2003 ASME Power Conference Heat Balance Techniques for Diagnosing and Evaluating Feedwater Flow...
43
-
Upload
komandur-sunder-raj-pe -
Category
Presentations & Public Speaking
-
view
118 -
download
3
Transcript of 2003 ASME Power Conference Heat Balance Techniques for Diagnosing and Evaluating Feedwater Flow...


FW flow used to calculate NSSS heat input NSSS heat input with reactor heat balance
used to calculate reactor core thermal power
Calibrated flow nozzle used to measure FW flow
Calibration assumes clean flow section Fouling or deposits will result in errors in
flow measurement causing flow to read high

Calculated reactor power would be higher than true value with attendant loss in plant capacity
Methodology and heat balance techniques to diagnose FW flow nozzle fouling and quantifying capacity loss presented
Recommendations provided to monitor performance for FW flow nozzle fouling
Steps to take for corrective action

Reactor core thermal power cannot be measured directly
Determined indirectly through flow, pressure, temperature measurements
Errors in measurements could cause derived value of reactor core thermal power to read higher than actual value
Result is loss in plant capacity

From experience, most likely cause could be error in FW flow measurement from buildup of deposits in flow nozzle
Several means for verifying loss in capacity may be due to error in determination of reactor core thermal power
Include monitoring and trending parameters – stage pressures, electrical output, control valve position, etc.

Heat balance techniques invaluable diagnostic tools
Using performance modeling tools, heat balances developed for entire cycle
Used on routine basis to predict performance and compared with plant parameters for potential capacity losses
Performance modeling tool used to diagnose/evaluate BWR cycle in Fig. 1


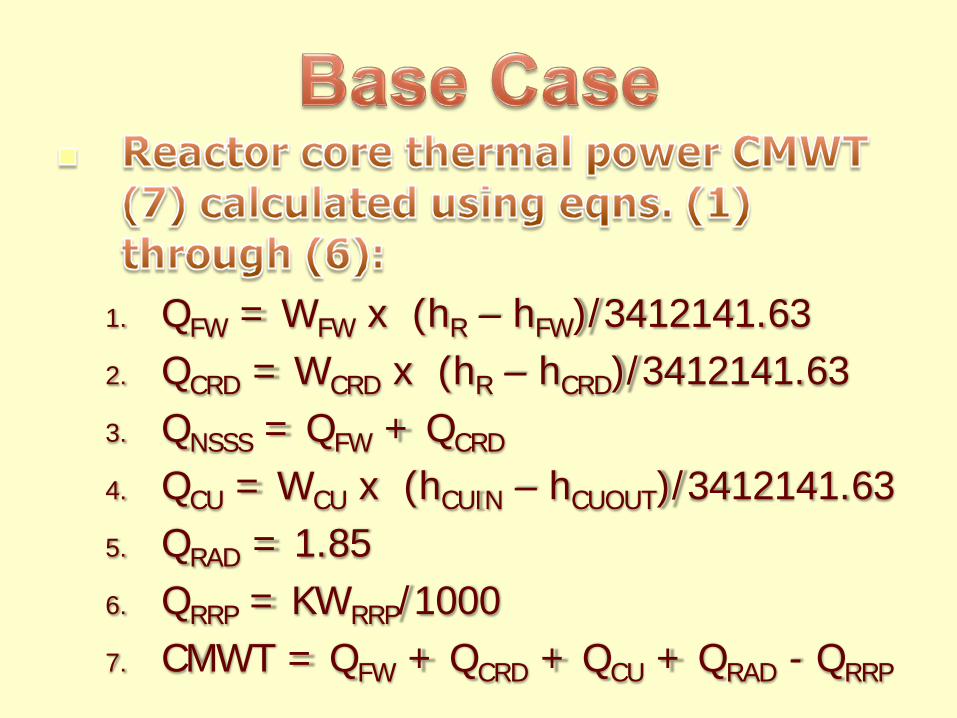
1. QFW = WFW x (hR – hFW)/3412141.63 2. QCRD = WCRD x (hR – hCRD)/3412141.63 3. QNSSS = QFW + QCRD 4. QCU = WCU x (hCUIN – hCUOUT)/3412141.63 5. QRAD = 1.85 6. QRRP = KWRRP/1000 7. CMWT = QFW + QCRD + QCU + QRAD - QRRP

CMWT predominantly function of FW thermal power QFW
QFW affected by: FW flow Reactor outlet enthalpy hR Feedwater enthalpy hFW
Fig. 3 shows base case turbine cycle heat balance using performance modeling tool
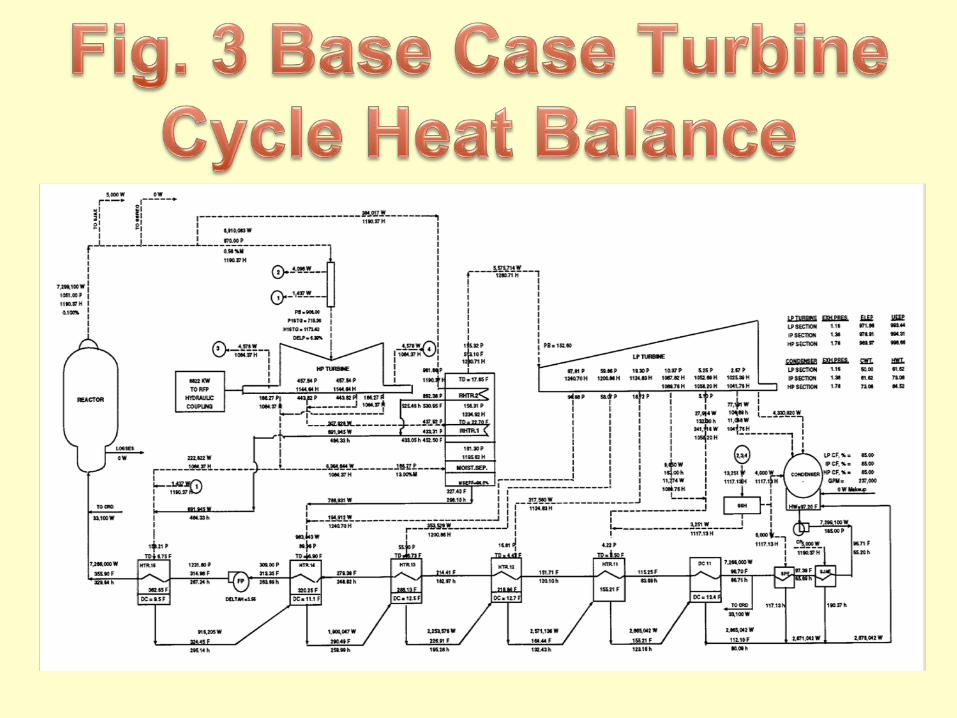

Reactor outlet pressure is 1051.0 psia Reactor outlet moisture is 0.1% HP turbine bowl pressure is 908.0 psia
(assumes full-arc admission) HP turbine first stage shell pressure is
approximately 715.0 psia HP turbine extraction stage pressures are
457.5 and 166.3 psia FW flow is 7,266,000 lb/hr Feed pump discharge pressure is 1231.8 psia Feedwater temperature is 355.9 °F

QFW decreases by 1%, from 1833.45 Mwt to 1815.12 Mwt
HP turbine bowl pressure decreases by 1%, from 908.0 psia to 899.0 psia
HP turbine first stage shell pressure decreases by 1%, from 715.4 psia to 707.8 psia
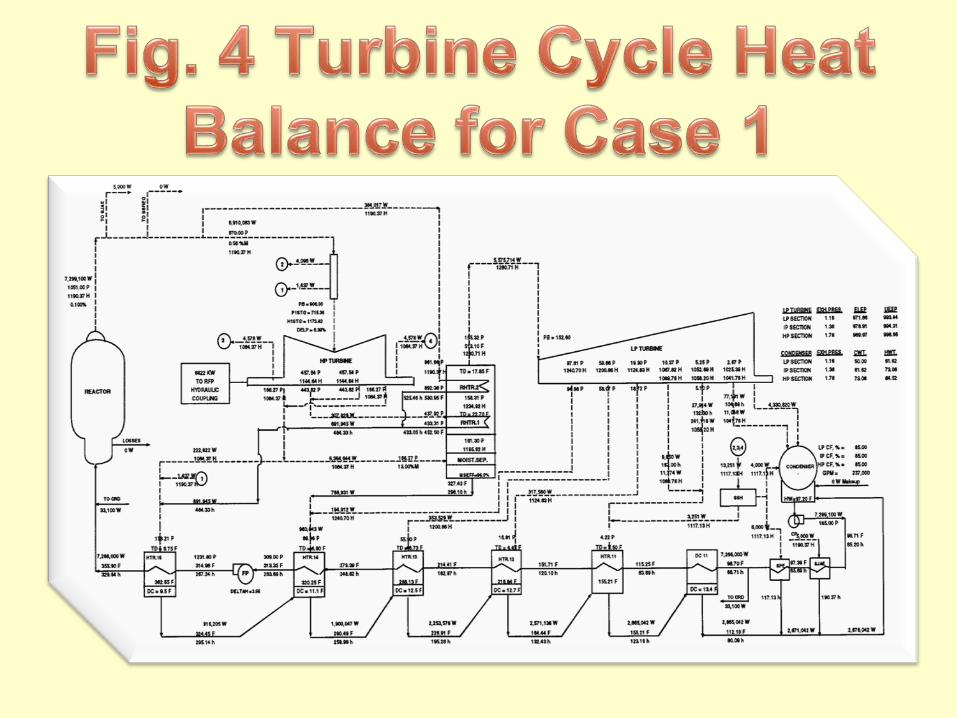
HP turbine extraction stage pressures decrease by 1%, from 457.5 psia to 452.8 psia and, from 166.3 psia to 164.7 psia
Feedwater temperature decreases by about 0.8 °F, from 355.9 °F to 355.1 °F.
Generator output decreases by about 1%, from 637 Mwe to 631 Mwe

FW flow decreases by 0.43%, from 7,266,000 lb/hr to 7,234,701 lb/hr
HP turbine bowl pressure decreases by 0.48%, from 908.0 psia to about 903.6 psia
HP turbine first stage shell pressure decreases by 0.49%, from 715.4 psia to 711.8 psia
Extraction steam flow to HP heater decreases and slightly more steam available to do work in LP turbine
Generator output decreases by about 1 Mwe, from 637 Mwe to 636 Mwe

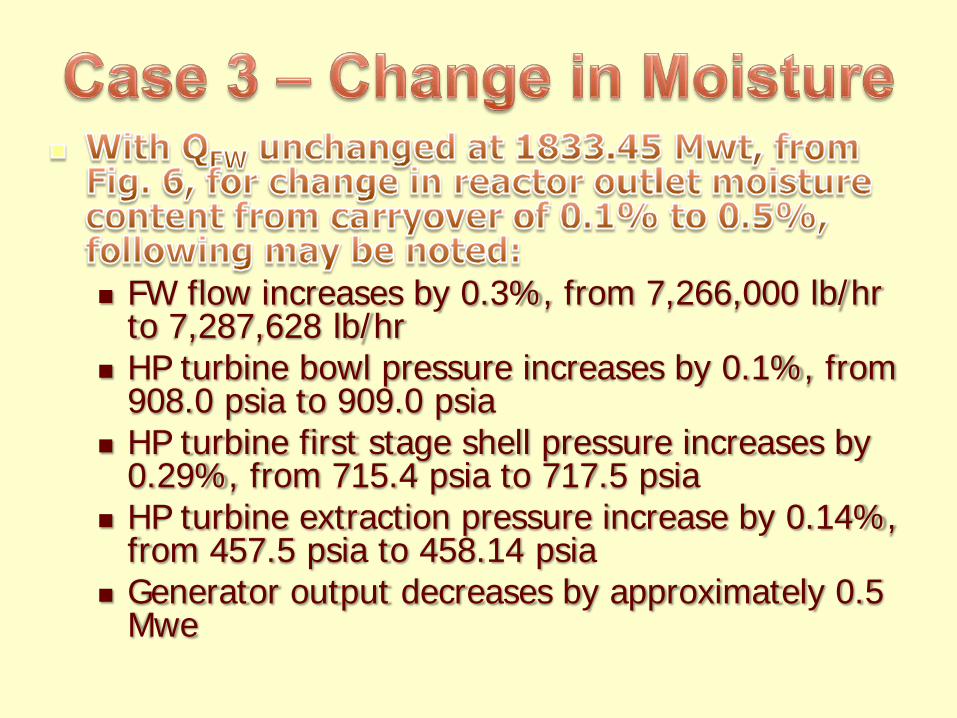
FW flow increases by 0.3%, from 7,266,000 lb/hr to 7,287,628 lb/hr
HP turbine bowl pressure increases by 0.1%, from 908.0 psia to 909.0 psia
HP turbine first stage shell pressure increases by 0.29%, from 715.4 psia to 717.5 psia
HP turbine extraction pressure increase by 0.14%, from 457.5 psia to 458.14 psia
Generator output decreases by approximately 0.5 Mwe


Changes in FW flow have the greatest impact on QFW, HP turbine bowl pressure, HP turbine first stage shell pressure, HP turbine extraction pressures and, generator output. A 1% reduction in the feedwater flow results in a like change in all these parameters
For a constant QFW, a change in feedwater temperature affects, to a lesser extent, FW flow, HP turbine bowl pressure, HP turbine first stage shell pressure and, generator output
For a constant QFW, a large change in reactor outlet moisture produces only small changes in FW flow, HP turbine bowl pressure, HP turbine first stage shell pressure and, generator output

For sample cycle, critical parameters to monitor for changes in FW flow are: Changes in HP turbine bowl pressure Changes in HP turbine first stage pressure Changes in HP turbine extraction stage
pressures Changes in generator output
Changes in HP turbine bowl pressure are the most important.

For sample cycle, heat balances were developed using the performance modeling tool
Heat balances relied upon detailed design, performance test and plant information
Extensive plant performance logs were reviewed at various reactor core thermal power levels

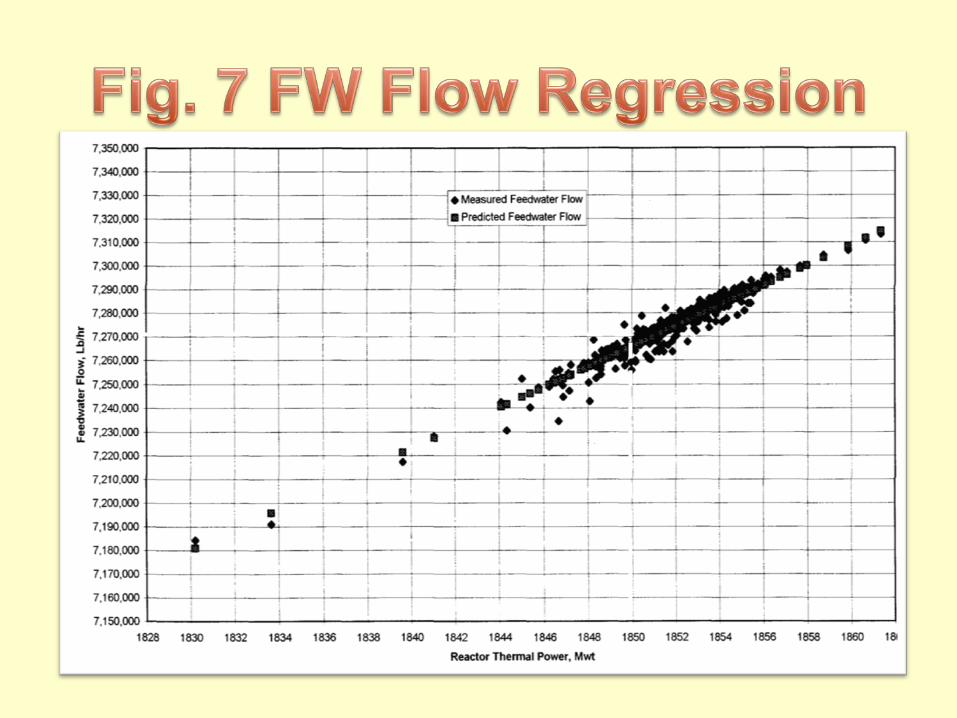
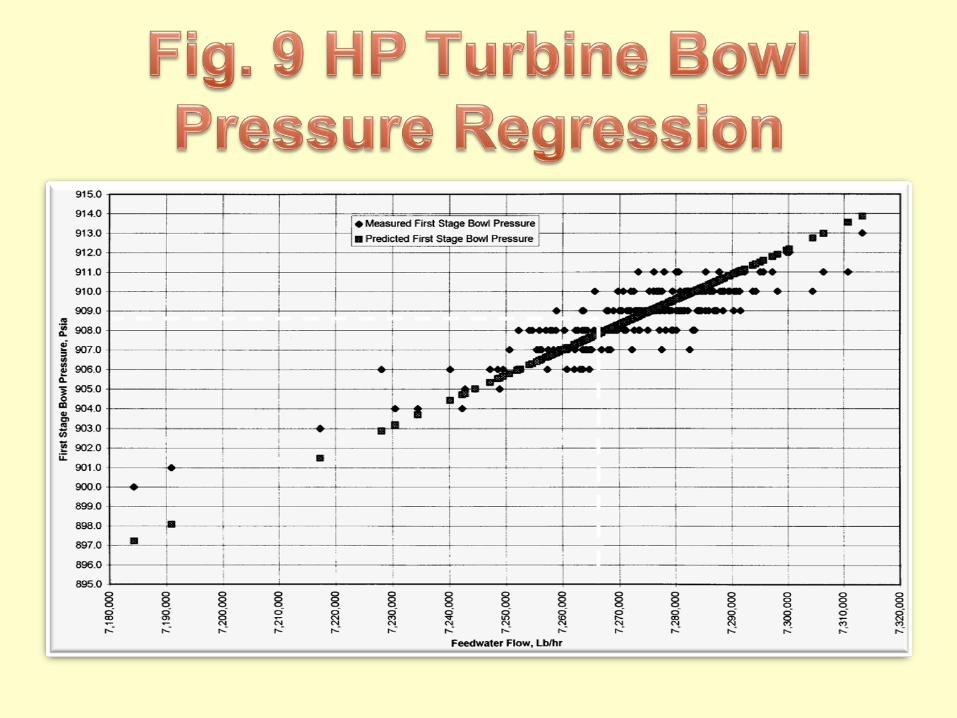
Using regression techniques, most probable values of FW flow, feedwater temperature and HP turbine first stage bowl pressure were determined at the licensed reactor core thermal power of 1850 Mwt
These values were used for base case shown in Fig. 3
Figures 7, 8 and 9 show the plots


Assume, for the sample cycle, fouling of FW flow nozzles is suspected and independent FW flow measurements show a FW flow of 7,188,000 lb/hr compared to a flow of 7,263,000 lb/hr using the plant flow nozzles
The FW temperature measured independently was 356.6 F compared to 356.1 F from plant instrumentation

Fig. 10 shows reactor heat balance for FW flow of 7,188,000 lb/hr
Calculated reactor core thermal power corresponding to this flow is 1828.41 Mwt
Heat input to the turbine cycle is 1824.35 Mwt.
Using this data, along with other plant data, predicted performance is shown in Fig. 11.
Predicted HP turbine bowl pressure was 900.2 psia and predicted generator output was about 631 Mwe.


Corresponding to FW flow of 7,263,000 lb/hr from plant FW flow nozzles, calculated reactor core thermal power was 1848.34 Mwt and heat input to turbine cycle was 1844.27 Mwt.
Using this data, along with rest of data same as that for FW flow of 7,188,000 lb/hr, performance of the cycle predicted.
Figure 12 shows reactor heat balance and Fig. 13 shows turbine cycle performance.


Predicted generator output was 638.2 Mwe and predicted HP turbine bowl pressure was 909.2 psia
From plant records, actual HP turbine bowl pressure was about 904.0 psia and actual generator output was about 634 Mwe
Corresponding to the actual recorded output of 634 Mwe, model predicted a FW flow of 7,219,304 lb/hr

Calculated reactor core thermal power was 1836.31 Mwt and heat input to the turbine cycle was 1832.25 Mwt
Predicted HP turbine bowl pressure was 904.0 psia, which was in agreement with plant value
Figures 14 and 15 show predicted performance
It might be concluded that fouling of the FW flow nozzles is about 0.6% and associated loss in output is about 4 Mwe


If fouling is suspected, following technique may be used for approximating the degree of fouling and associated loss of capacity: Assume that plant performance logs show a FW
flow of 7,191,000 lb/hr, HP turbine bowl pressure of 894.0 psia and generator output of 632 Mwe
From the regression analysis discussed earlier, most probable FW flow is 7,266,000 lb/hr and, probable HP turbine bowl pressure is 908.0 psia at the licensed reactor core thermal power of 1850 Mwt

Corresponding to measured FW flow of 7,191,000 lb/hr, expected HP turbine bowl pressure should have been (7,191,000/7,266,000) x 908 = 898.6 psia
Since actual bowl pressure is 894.0 psia, the most probable FW flow is (894/908.0) x 7,266,000 = 7,153,969 lb/hr
Suspected degree of FW fouling is then (7,191,000-7,153,969)/7,153,969 = 0.52%
Expected generator output at the flow of 7,191,000 lb/hr is 632/(1-0.0052) = 635.3 Mwe
Estimated loss in capacity due to fouling = 635.3 – 632 = 3.3 Mwe

Heat balance techniques invaluable in diagnosing fouling of FW flow nozzles and in quantifying the associated capacity losses
Using performance modeling tools, accurate models may be constructed for analysis of plant data and, performance predictions
Success of heat balance methodology to diagnose and quantify FW flow nozzle fouling dependent upon ability to monitor key parameters and use of performance modeling tools, on a routine basis

For sample cycle discussed in the paper, most important parameters to monitor for evidence of FW flow nozzle fouling are HP turbine bowl pressure, HP turbine first stage pressure, HP turbine extraction pressures and generator output
Other plant parameters such as pressures, temperatures for feedwater heaters are not as critical in calculations as HP turbine bowl, first stage shell and extraction pressures, generator output and condenser pressure

Establish routine performance monitoring program to monitor FW flow, FW temperature, reactor core thermal power, feedwater thermal power, HP turbine bowl pressure, HP turbine first stage pressure, HP turbine extraction pressures and, generator output
Using performance modeling tools, develop an accurate heat balance model using design, acceptance/performance test and other plant data

Develop correlations between critical parameters identified in the routine performance monitoring program
Use the model for performance calculations using plant data from the routine performance monitoring program
Compare with the correlations to check for potential FW flow nozzle fouling and, to quantify the associated capacity loss