2002 Rubik Scientific Analysis of the Human Aura · Figure 4. Whole body aura, front view composite...
28
In: Konstantin G. Korotkov (Ed.). Measuring Energy Fields: Current Research. – Backbone Publishing Co. Fair Lawn, USA, 2004. SCIENTIFIC ANALYSIS OF THE HUMAN AURA Beverly Rubik, Ph.D. Institute for Frontier Science Oakland, California [email protected] INTRODUCTION The dominant biomedical paradigm that is the foundation of conventional Western medicine has had only limited success. Its Human Genome Project showed that less than 40,000 genes make up a human being (Claverie, 2001), even less than the number of genes in a grain of rice. Some key scientists question whether this approach is sufficient to account for all the information in a human being (Strohman, 1993). Additionally, this paradigm is very limited toward understanding healing and the modus operandi of many types of alternative therapies. On the other hand, a new scientific worldview is emerging from biophysics. Based on chaos theory and quantum mechanics, the biophysical view of life focuses on its matrix of energy and information. Although the dynamics of these are very complex and often difficult to measure, work in this area is yielding insights into a subtler dimension of life. Many lines of scientific and clinical evidence show that extremely tiny energetic stimuli to injured or sick organisms can promote healing. Homeopathy, biofield therapies, acupuncture, and bioelectromagnetic therapies—various types of energy medicine —demonstrate that tiny nudges, repeated over time, can shift the dynamics of the organism, nudging it into a healing state. These changes may be lasting after the stimulus is withdrawn. This is the basis of energy medicine. It is distinctly different from the approach of conventional medicine, which focuses on modifying the structure and/or biochemistry of life. In relation to this, consider that virtually every indigenous culture has held a form of vitalism, the belief in a vital force or life energy. There is the concept of qi in China, ki in Japan, prana in India, and it goes by many other names worldwide. It is possible that all of the indigenous systems of medicine were founded on the principle of a vital force, and many of these medical systems remain outside of mainstream Western medicine today. In any case, vitalistic principles are key to many contemporary alternative systems of medicine, including homeopathy, chiropractic, Oriental medicine, Ayurvedic medicine, Anthroposophical medicine, and others. Presently we have no such concept of a vital force in science or allopathic medicine, which was eradicated long ago from a mechanistic biology. Medical historial Harris Coulter describes the 2,500 year-old struggle between the vitalists and mechanists in their healing philosophies (Coulter, 1994), which still remains as the battle between alternative and allopathic medicine continues. It is the author’s goal to introduce an energy field concept consistent with contemporary biophysics, which builds a bridge from science to the indigenous concepts of qi, ki, prana, etc. The biofield hypothesis was recently proposed (Rubik et al., 1994; Rubik, 2002) as a scientific foundation. An empirical approach to measure the energy field patterns of life is also necessary. This study reports on use of a new method to assess the energy field patterns of humans. There are various methods used to measure or otherwise assess the flow of subtle energy in the body. Electrodermal testing measures the flow of electricity at acupuncture
-
Upload
truongtuyen -
Category
Documents
-
view
226 -
download
0
Transcript of 2002 Rubik Scientific Analysis of the Human Aura · Figure 4. Whole body aura, front view composite...

In: Konstantin G. Korotkov (Ed.). Measuring Energy Fields: Current Research. – BackbonePublishing Co. Fair Lawn, USA, 2004.
SCIENTIFIC ANALYSIS OF THE HUMAN AURA
Beverly Rubik, Ph.D.Institute for Frontier Science
Oakland, [email protected]
INTRODUCTION
The dominant biomedical paradigm that is the foundation of conventional Westernmedicine has had only limited success. Its Human Genome Project showed that less than40,000 genes make up a human being (Claverie, 2001), even less than the number of genesin a grain of rice. Some key scientists question whether this approach is sufficient to accountfor all the information in a human being (Strohman, 1993). Additionally, this paradigm isvery limited toward understanding healing and the modus operandi of many types ofalternative therapies.
On the other hand, a new scientific worldview is emerging from biophysics. Basedon chaos theory and quantum mechanics, the biophysical view of life focuses on its matrixof energy and information. Although the dynamics of these are very complex and oftendifficult to measure, work in this area is yielding insights into a subtler dimension of life.
Many lines of scientific and clinical evidence show that extremely tiny energeticstimuli to injured or sick organisms can promote healing. Homeopathy, biofield therapies,acupuncture, and bioelectromagnetic therapies—various types of energy medicine—demonstrate that tiny nudges, repeated over time, can shift the dynamics of the organism,nudging it into a healing state. These changes may be lasting after the stimulus iswithdrawn. This is the basis of energy medicine. It is distinctly different from the approachof conventional medicine, which focuses on modifying the structure and/or biochemistry oflife.
In relation to this, consider that virtually every indigenous culture has held a form ofvitalism, the belief in a vital force or life energy. There is the concept of qi in China, ki inJapan, prana in India, and it goes by many other names worldwide. It is possible that all ofthe indigenous systems of medicine were founded on the principle of a vital force, and manyof these medical systems remain outside of mainstream Western medicine today. In anycase, vitalistic principles are key to many contemporary alternative systems of medicine,including homeopathy, chiropractic, Oriental medicine, Ayurvedic medicine,Anthroposophical medicine, and others.
Presently we have no such concept of a vital force in science or allopathic medicine,which was eradicated long ago from a mechanistic biology. Medical historial Harris Coulterdescribes the 2,500 year-old struggle between the vitalists and mechanists in their healingphilosophies (Coulter, 1994), which still remains as the battle between alternative andallopathic medicine continues.
It is the author’s goal to introduce an energy field concept consistent withcontemporary biophysics, which builds a bridge from science to the indigenous concepts ofqi, ki, prana, etc. The biofield hypothesis was recently proposed (Rubik et al., 1994; Rubik,2002) as a scientific foundation. An empirical approach to measure the energy field patternsof life is also necessary. This study reports on use of a new method to assess the energy fieldpatterns of humans.
There are various methods used to measure or otherwise assess the flow of subtleenergy in the body. Electrodermal testing measures the flow of electricity at acupuncture

points, considered to correspond to the flow of energy along acupuncture meridians.Thermography maps the thermal patterns of the body. EEG, ECG, and other similar clinicaldiagnostics measure the electrical emission from key organs such as brain and heart,respectively, although the conventional belief is that this energy is simply waste. Scientistshave also measured biophotons, the ultraweak light emitted from the body. Dowsing,psychic reading, and other subjective measures have also been used to assess the subtleenergies of life. In this study, a form of digital electrophotography, also known asbioelectrography or digital Kirlian photography, is used to visualize part of the humanbiofield to ascertain information about the state of the person. This method is described inthe next section.
METHOD: DIGITAL KIRLIAN PHOTOGRAPHY AND COMPUTER ANALYSIS
Kirlian photography or electrophotography was discovered by Semyon Kirlian in1939. Due to the Cold War between the US and Russia, American scientists only becameaware of it in the 1970s. Because the photographic film method of Kirlian photographyproved difficult to reproduce and replicate, it was initially dismissed by most Westernscientists. However, over the next several decades, key holistic health practitioners such asDr. Peter Mandel in Germany and others in Eastern Europe developed an enormousempirical database of medical case studies using this method (Mandel, 1989). In the late1990s, physicist Konstantin Korotkov, Ph.D., and his colleagues at St. Petersburg invented adigital form of Kirlian photography, called GDV, or “gas discharge visualization” technique,and incorporated the knowledge base of Mandel and others in software programs to analyzethe human aura according to empirical findings (Korotkov, 1998a; 1998b; 2002).
The GDV camera is presently the state-of-the-art in electrophotography. It utilizes ahigh frequency (1024 Hz), high-voltage (10 kV) input to the finger (or other object to bephotographed), which is placed on the electrified glass lens of the camera. Because theelectrical stimulus in this device is less than that of older Kirlian cameras, most humansubjects do not experience any sensation when exposing their fingertip to the camera. Inpractice, the applied electric field is pulsed on and off every 10 microseconds, and thefingertip is exposed for only 0.5 seconds. This causes a corona discharge of light-emittingplasma to stream outward from the fingertip. The light emitted from the finger is detecteddirectly by a CCD (charge-coupled detector), which is the state-of-the-art in scientificinstruments such as telescopes to measure extremely low-level light. The signal from theCCD is sent directly to a computer, and software analysis is done to calculate a variety ofparameters that characterize the pattern of light emitted, including brightness, total area,fractality, and density. The software can also provide color enhancement to enable subtlefeatures such as intensity variations of the Kirlian aura to be perceived.
In assessing human subjects, the electrophotographs of all ten fingers are made andanalyzed. A typical set of measurements from a normal healthy subject is shown in Figure 1.
Figure 1. Digital Kirlian photographs of all ten fingers of a normalhealthy human subject. 1L = left thumb; 2L = left index finger, etc. Color enhancement can been done to indicate qualitatively regionsof varying brightness. The total area, intensity distribution, densitydistribution, fractality, and other parameters can also be calculated for each pattern of fingertip emission.
From this raw data input, various software calculations are made. A schematic showinghow the regions of the finger emission patterns correspond to various regions of the body is
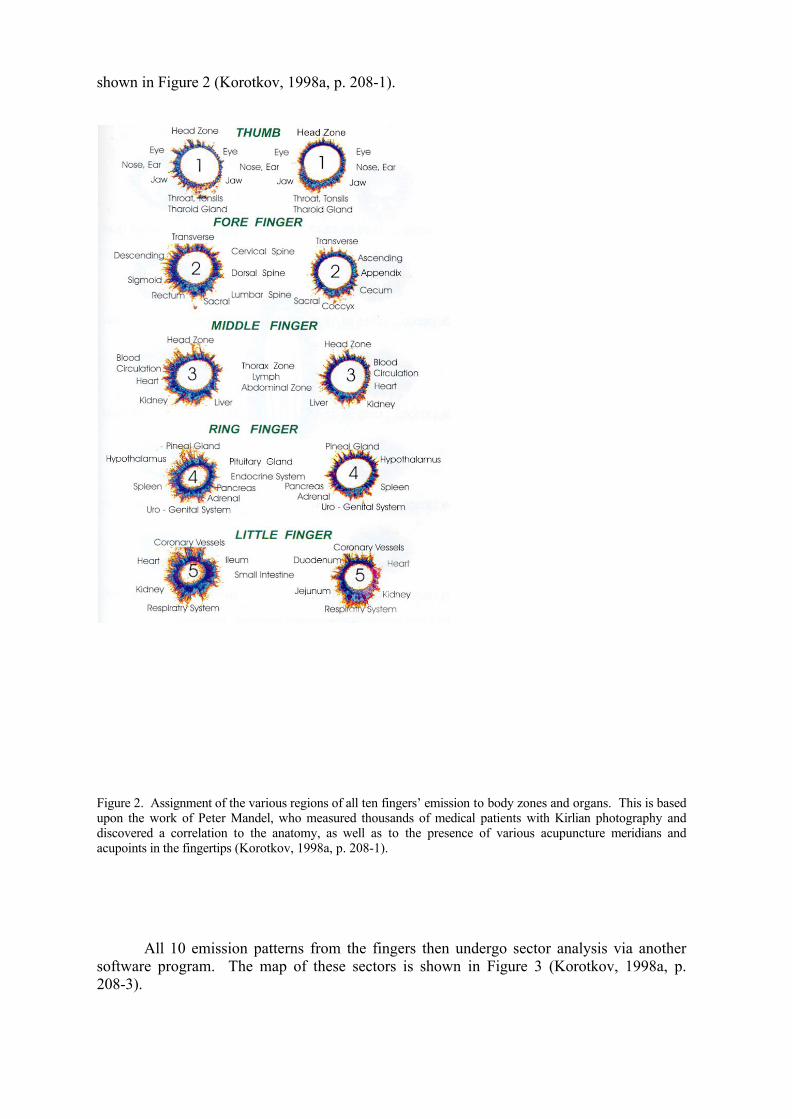
shown in Figure 2 (Korotkov, 1998a, p. 208-1).
Figure 2. Assignment of the various regions of all ten fingers’ emission to body zones and organs. This is basedupon the work of Peter Mandel, who measured thousands of medical patients with Kirlian photography anddiscovered a correlation to the anatomy, as well as to the presence of various acupuncture meridians andacupoints in the fingertips (Korotkov, 1998a, p. 208-1).
All 10 emission patterns from the fingers then undergo sector analysis via anothersoftware program. The map of these sectors is shown in Figure 3 (Korotkov, 1998a, p.208-3).

Figure 3. Schematic showing the defined sectors of the light emission of all ten fingers as well as the compositewhole body aura computed from them. As an example of how this is utilized, sector number 8 on the left andright thumbs are combined mathematically to comprise the aura around the crown of the head. (Korotkov,1998a, p. 208-3)
An example of the front view of a composite aura is shown in Figure 4.
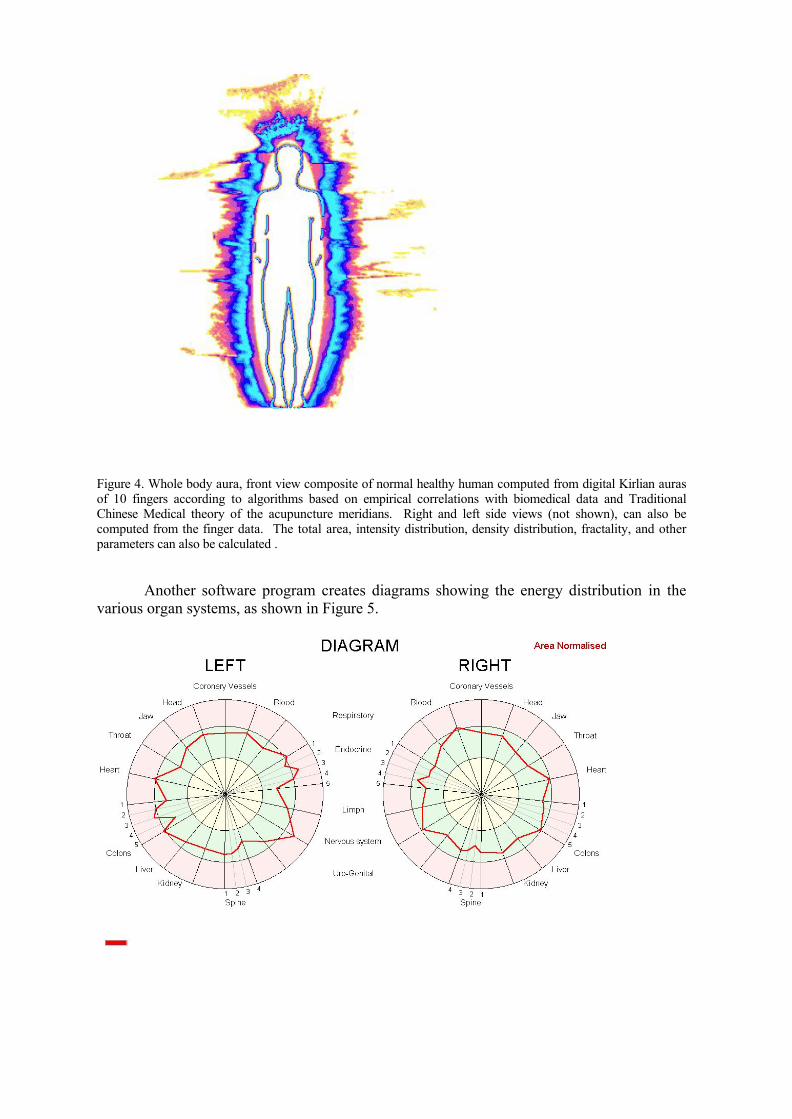
Figure 4. Whole body aura, front view composite of normal healthy human computed from digital Kirlian aurasof 10 fingers according to algorithms based on empirical correlations with biomedical data and TraditionalChinese Medical theory of the acupuncture meridians. Right and left side views (not shown), can also becomputed from the finger data. The total area, intensity distribution, density distribution, fractality, and otherparameters can also be calculated .
Another software program creates diagrams showing the energy distribution in thevarious organ systems, as shown in Figure 5.

Figure 5. Organ diagram computed from software analysis of all ten fingers of a normal healthy human, showingenergy distribution associated with various organs and organ systems. The left diagram is computed from thephotographs of the fingers of the left hand, and the right, corresponds to data gathered from the right hand. Colons 1-5 on the left side correspond as follows: 1-transverse; 2-descending; 3-sigmoid; 4-rectum; 5-ileum. Colons 1-5 on the right side correspond as follows: 1-transverse; 2-ascending; 3-appendix; 4-caecum;5-duodenum. Endocrine 1-5, left and right, correspond as follows: 1-whole system; 2-pineal; 3-pituitary;4-hypothalamus; 5-thyroid. Regions of the spine, 1-4, correspond respectively to 1-cervical; 2-thoracic;3-lumbar, and 4-sacral regions. The central zone of the circle is a region indicating energy deficiency or belownormal energy levels; the intermediate ring indicates average energy levels, and the outer ring indicatesinflammatory or excess energy.
Another software analysis computes the relative energy flow in the 7 chakras. Figure6 depicts typical data obtained in the chakra analysis program for a normal health human.
Figure 6. Relative energy distribution in the 7 chakras of a normal healthy human. Chakras 1 – 7 are shownfrom left to right. Typically the energy pattern shows the heart chakra (4th) with the highest energy peak asshown here. An energy distribution of –0.5 or below is indicative of less than normal energy levels; between–0.5 and 0.5 is indicative of normal energy levels; and above 0.5 is indicative of excess or inflammatory energylevels.
Figure 7 shows the schematic forthe computer algorithm for calculating
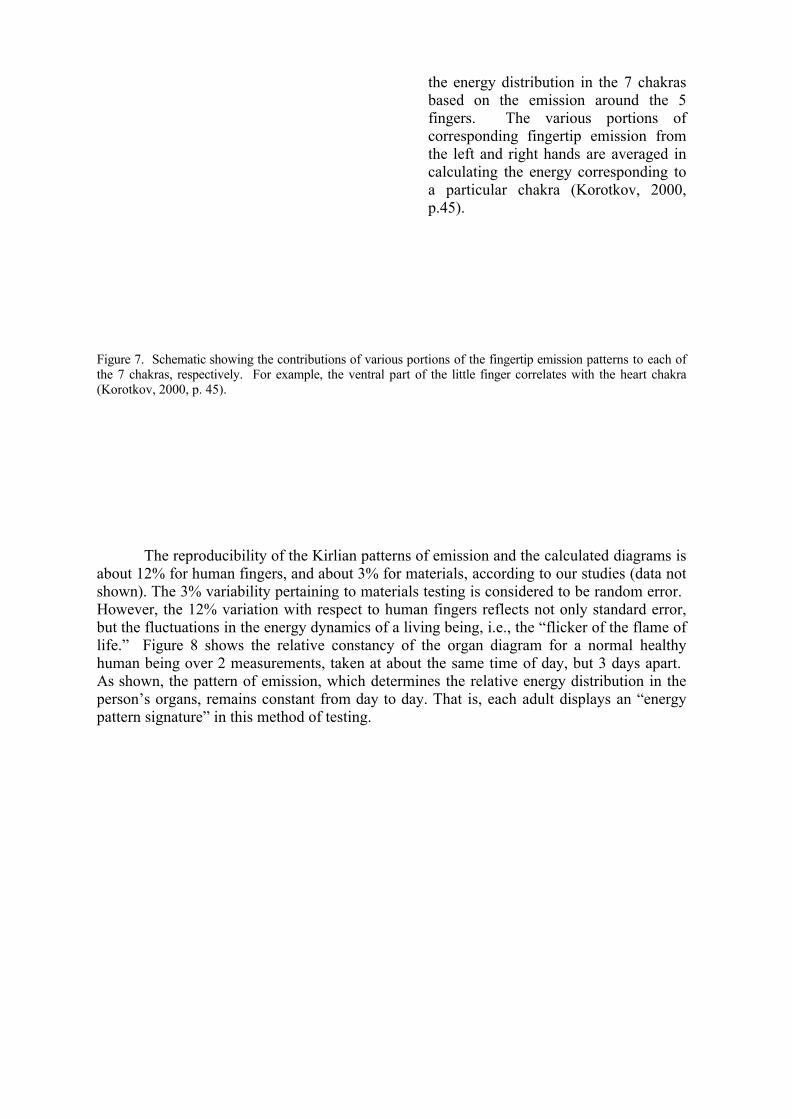
the energy distribution in the 7 chakrasbased on the emission around the 5fingers. The various portions ofcorresponding fingertip emission fromthe left and right hands are averaged incalculating the energy corresponding toa particular chakra (Korotkov, 2000,p.45).
Figure 7. Schematic showing the contributions of various portions of the fingertip emission patterns to each ofthe 7 chakras, respectively. For example, the ventral part of the little finger correlates with the heart chakra(Korotkov, 2000, p. 45).
The reproducibility of the Kirlian patterns of emission and the calculated diagrams isabout 12% for human fingers, and about 3% for materials, according to our studies (data notshown). The 3% variability pertaining to materials testing is considered to be random error. However, the 12% variation with respect to human fingers reflects not only standard error,but the fluctuations in the energy dynamics of a living being, i.e., the “flicker of the flame oflife.” Figure 8 shows the relative constancy of the organ diagram for a normal healthyhuman being over 2 measurements, taken at about the same time of day, but 3 days apart. As shown, the pattern of emission, which determines the relative energy distribution in theperson’s organs, remains constant from day to day. That is, each adult displays an “energypattern signature” in this method of testing.

Figure 8. Two different organ diagrams for normal healthy person, superimposed taken 3 days apart at the sametime of day, as indicated by black and charcoal curves. This superimposition shows the relative stability of thismethod for assessing various features of the energy field of the human being.
Research Question
Does the Kirlian emission from the human body change following alternativemedical interventions or healing practices, especially those that purportedly provide subtleenergy nudges to stimulate natural healing? If so, how? Because this research was apreliminary study, no specific hypotheses were tested.
Case Study Approach
The research question was addressed via case studies on four interventions orconsciousness-altering events, including biofield therapy, hypnosis, entity possession, andqigong. We measured four normal healthy adults before and after the intervention orpractice. The following cases are presented here: (A) Therapeutic Touch Practitioner,

before and after giving therapy; (B) hypnosis of inducible subject; (C) entity possession andrelease; (D) qigong practice. Control subjects constitute two additional cases, where nointervention was used, shown in (E) and (F). The energy patterns of human subjects wereassessed once each for pre- and post-conditions.
RESULTS
In general, changes were found to occur in the human energy pattern after a specificintervention or consciousness-altering activity, whereas control subjects who underwent nointervention showed no change. Results showing the pre- and post-composite auras, organdiagrams, and chakra diagrams are shown for cases A-F.
A. Therapeutic Touch Practitioner. The composite aura of the practitioner before sheadministered therapy to a patient is shown in Figure 9.
Figure 9. Initial composite aura for normal healthy female, 50, before administering Therapeutic Touch topatient.

Figure 10 shows the same subject after she gave a patient a 30-minute standardtreatment of Therapeutic Touch to a pain patient. Note the general expansion and greatersmoothness of the aura, and the filling in of gaps or discontinuities, indicating improvedenergy regulation following the practice of Therapeutic Touch.
Figure 10. Composite aura for normal healthy female, 50, after providing 30 minutes of Therapeutic Touch topatient.
The organ and chakra diagrams for the pre- and post-conditions are shown in Figures11 and 12, respectively. Figure 11 shows that post-Therapeutic Touch mobilizes an energyexpansion in most organs as well as greater evenness of energy distribution throughout thebody. Figure 12 shows that the subject has an apparent energy deficiency in chakras 2, 3, 4,and 7 before giving the treatment. After the treatment, the practitioner shows normal energylevels and energy distribution throughout all 7 chakras. Table 1 shows the integrated energyvalues for the 2 sides of the body both pre- and post. The larger values (less negative) in thepost-condition indicate greater energy, and the reduced standard deviations indicateimproved energy regulation throughout the body.
Pre-TherapeuticTouch
Post-Therapeutic Touch
Left side -0.741 (0.54) -0.198 (0.47)Right side -0.956 (0.90) -0.129 (0.38)
Table 1. Integrative energy values (relative) for 2 sides ofthe body for subject before and after giving TherapeuticTouch. Standard deviations are shown in parentheses.

Figure 11. Organ diagram of female Therapeutic Touch practitioner, before (charcoal curve) and after (blackcurve) administering Therapeutic Touch to a patient.
Figure 12. . Chakra diagram of female Therapeutic Touch practitioner, before (lower curve) and after (uppercurve) giving a patient Therapeutic Touch.
Some biofield practitioners draw on their own systemic energy in treating patients,which may deplete them over time. However, in Therapeutic Touch (TT), the practitionerdraws on a divine or cosmic source of energy outside herself and acts as a conduit to movethis energy into the biofield of the patient. If the TT practitioner does this correctly, she isnot depleted. These results indicate that this particular TT practitioner was energeticallydeficient in the beginning, but markedly improved following the act of treating a patient.
This case suggests what biofield therapists frequently say about their work—that theyexperience a feeling of energy expansion in the act of treating others. Namely, thepractitioner experiences improved energy regulation after treating the patient.

B. Hypnosis of inducible subject
This was a preliminary experiment involving 2 subjects to see if the hypnoticcommand to “reduce energy” and produce glove anesthesia in the left hand would produce acorresponding measurable lateral change in the human energy pattern. Two professionalhypnotists were employed as subjects, and each of them hypnotized the other sequentially. Itwas ascertained that the subject, male, 49 years old, was in a deep trance by clamping ahemostat on the index finger of his left hand, which produced no sensation, indicating “gloveanesthesia” was achieved. (Note: The data of only one subject is shown here; the othershowed a slightly weaker but similar trend.) The composite aura of the subject beforehypnosis is shown in Figure 13.
Figure 13. Initial composite aura for male, 49, before hypnosis.

Figure 13 shows a somewhat irregular aura for the subject prior to hypnosis. Figure14 shows the aura after glove anesthesia was achieved in the left hand, during deep hypnosis.The post-hypnosis aura appears to be smoother, more regular in shape, and more energyappears to be in the left side of the body than on the right, despite the induction commandused. (Note: left and right appear reversed as shown in the aura figures.). This greateramount of energy on the left hand side of the body was confirmed in the organ diagram (SeeFigure 15), in which the energy expansion on the left side of the body can more readily beseen.
Figure 14. Composite aura for male, 49, after deep hypnosis with suggestion to move energy out of left hand andproduce glove anesthesia.
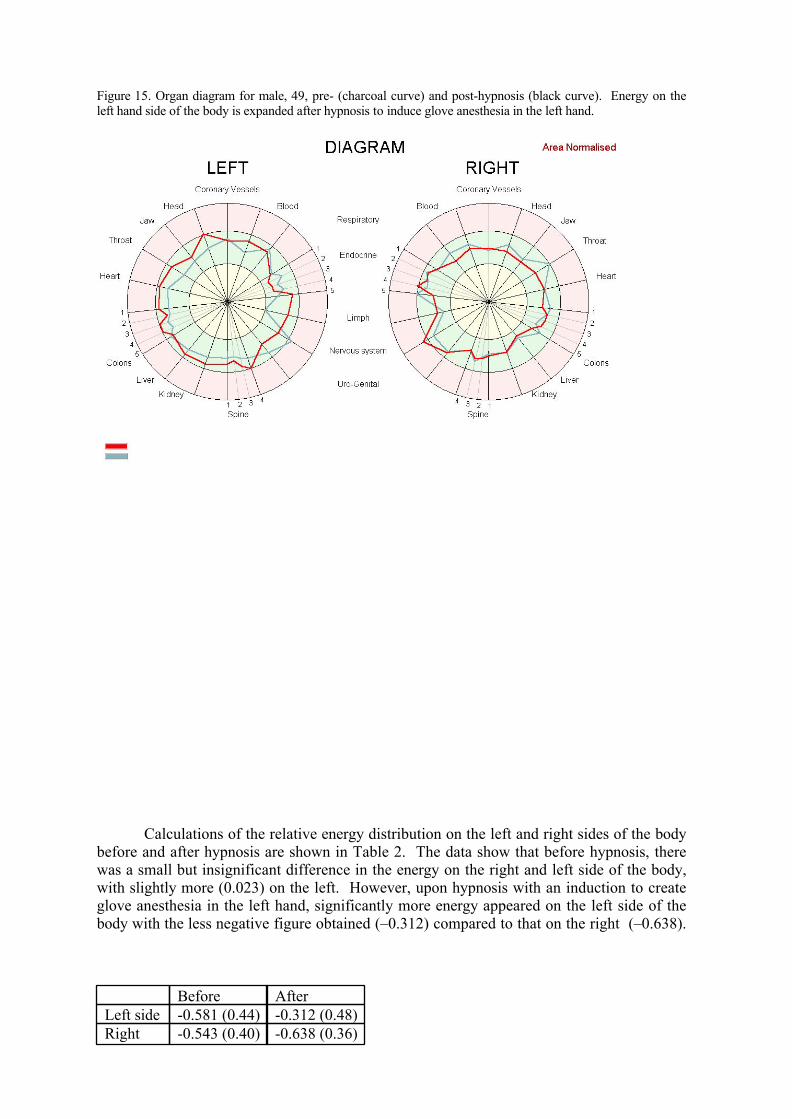
Figure 15. Organ diagram for male, 49, pre- (charcoal curve) and post-hypnosis (black curve). Energy on theleft hand side of the body is expanded after hypnosis to induce glove anesthesia in the left hand.
Calculations of the relative energy distribution on the left and right sides of the bodybefore and after hypnosis are shown in Table 2. The data show that before hypnosis, therewas a small but insignificant difference in the energy on the right and left side of the body,with slightly more (0.023) on the left. However, upon hypnosis with an induction to createglove anesthesia in the left hand, significantly more energy appeared on the left side of thebody with the less negative figure obtained (–0.312) compared to that on the right (–0.638).
Before AfterLeft side -0.581 (0.44) -0.312 (0.48)Right -0.543 (0.40) -0.638 (0.36)

side Table 2. Relative integrated energy distribution on left and right sides of the body before and after hypnosis ofmale subject, 49. Standard deviations are shown in parenthesis for each calculation.
This result suggests that the process of hypnotic induction for glove anesthesia in theleft hand involves entering into an altered state with expanded energy regionally specific inthe body (in this case, left side). This finding is consistent with the fact that highly specifichypnotic inductions in hypnotizable subjects are known to create highly specific perceptionsand behaviors in the subjects. In this case, it was expected that glove anesthesia might beassociated with reduced energy in the body part in which it was induced, but it was foundthat more energy was observed. Speculating, it is possible that the person has gone “out ofthe body” on the anesthetized side, manifesting greater presence in the energy realm on thatside of the body than in the material realm.
C. Entity Possession and Release
Figure 16. Composite aura of female, 63, under voluntary possession of “benign entity” whom she claimsaugments her psychic powers.
A. female subject, age 63, who claimed to be able to assess human auras worked withme to investigate this. Her ability to assess the human aura correlated well with myscientific measurements of the human energy field for three subjects in shape, size, andgeneral pattern (data not shown). At the end of the experiment, she confided in me that shewas able to do this due to an entity that she believed occupied her energy field, whoaugmented her psychic powers, and who had been with her for over 50 years. She seemed toregard the entity as a friend. I had already run a baseline aura measurement on her with thepurported entity in her energy field. I then asked whether she would be willing to release the
entity so that I might take a measurement and compare it to her aura in her usual state withthe entity. After balking at the idea for a little while, she decided to do it. She told the entityto leave for the sake of a scientific experiment and to return to her in 15 minutes.
Figure 16 shows the composite aura of the subject in her usual state with the benign entity.
Figure 17. Composite aura of female subject, 63, after she released benign entity.
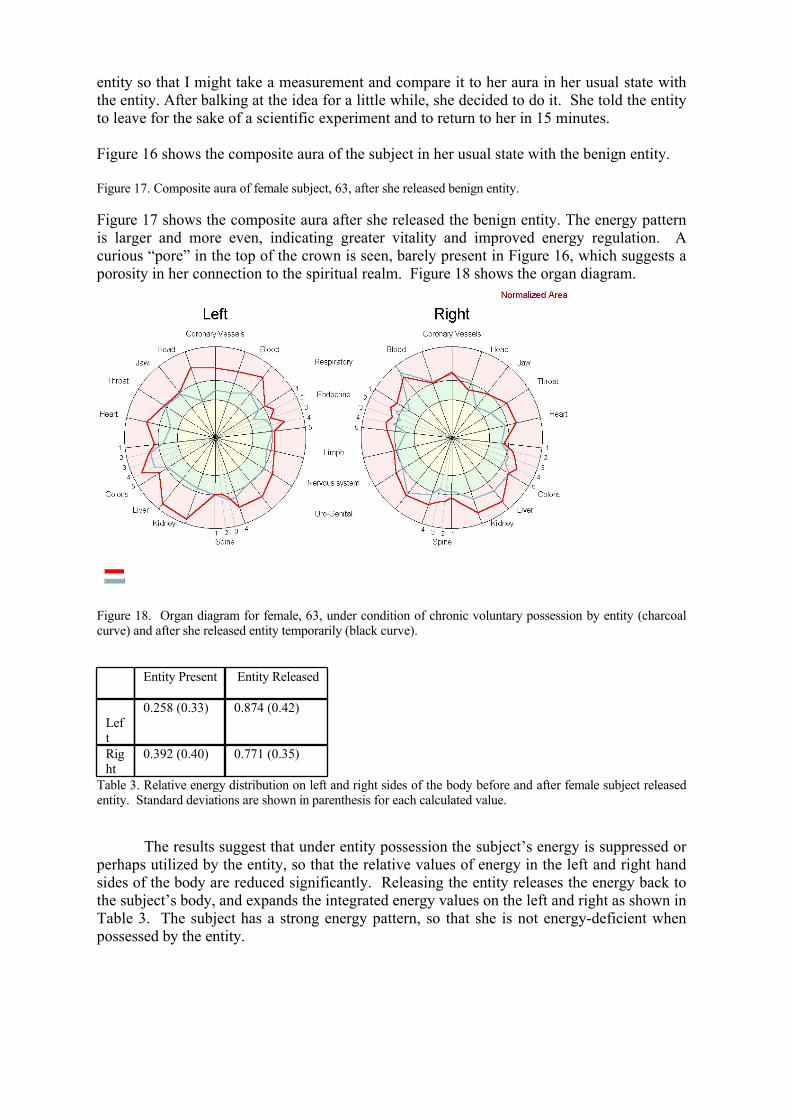
Figure 17 shows the composite aura after she released the benign entity. The energy patternis larger and more even, indicating greater vitality and improved energy regulation. Acurious “pore” in the top of the crown is seen, barely present in Figure 16, which suggests aporosity in her connection to the spiritual realm. Figure 18 shows the organ diagram.
Figure 18. Organ diagram for female, 63, under condition of chronic voluntary possession by entity (charcoalcurve) and after she released entity temporarily (black curve).
Entity Present
Entity Released
Left
0.258 (0.33) 0.874 (0.42)
Right
0.392 (0.40) 0.771 (0.35)
Table 3. Relative energy distribution on left and right sides of the body before and after female subject releasedentity. Standard deviations are shown in parenthesis for each calculated value.
The results suggest that under entity possession the subject’s energy is suppressed orperhaps utilized by the entity, so that the relative values of energy in the left and right handsides of the body are reduced significantly. Releasing the entity releases the energy back tothe subject’s body, and expands the integrated energy values on the left and right as shown inTable 3. The subject has a strong energy pattern, so that she is not energy-deficient whenpossessed by the entity.

Figure 19. Chakra diagram for female subject, 63, under entity possession (lower curve) and with entity released(upper curve).
Figure 19 shows the chakra diagram for the subject, in which the lower curve is theenergy profile in the chakras under entity possession, and the upper curve is that when theentity is released. Apparently, the interaction of the entity with her energy system reducesthe energy of each chakra, but the higher chakras (5, 6, and 7) appear to be most reduced bythe entity’s presence.
D. Subject Practicing Dayan (Wild Goose) Qigong
These data were obtained during a field experiment at an all-day qigong workshopi
led by qigong master Bett Martinez. Eight participants in the workshop were measured;however, only the data on a single participant, a woman with 5 years’ practice of qigong, isshown here. The pre-qigong aura of the subject, a 58-year old female, is shown in Figure 20. Note the irregularity in the pattern as well as in the brightness, and the gaps and asymmetry.
Figure 20. Energy pattern of female, 58, before qigong practice.
The post-qigong energy pattern of the subject shown in Figure 21. Note how the aurahas expanded, particularly in the region of the crown of the head, and how it is more regularand symmetrical than the previous state.

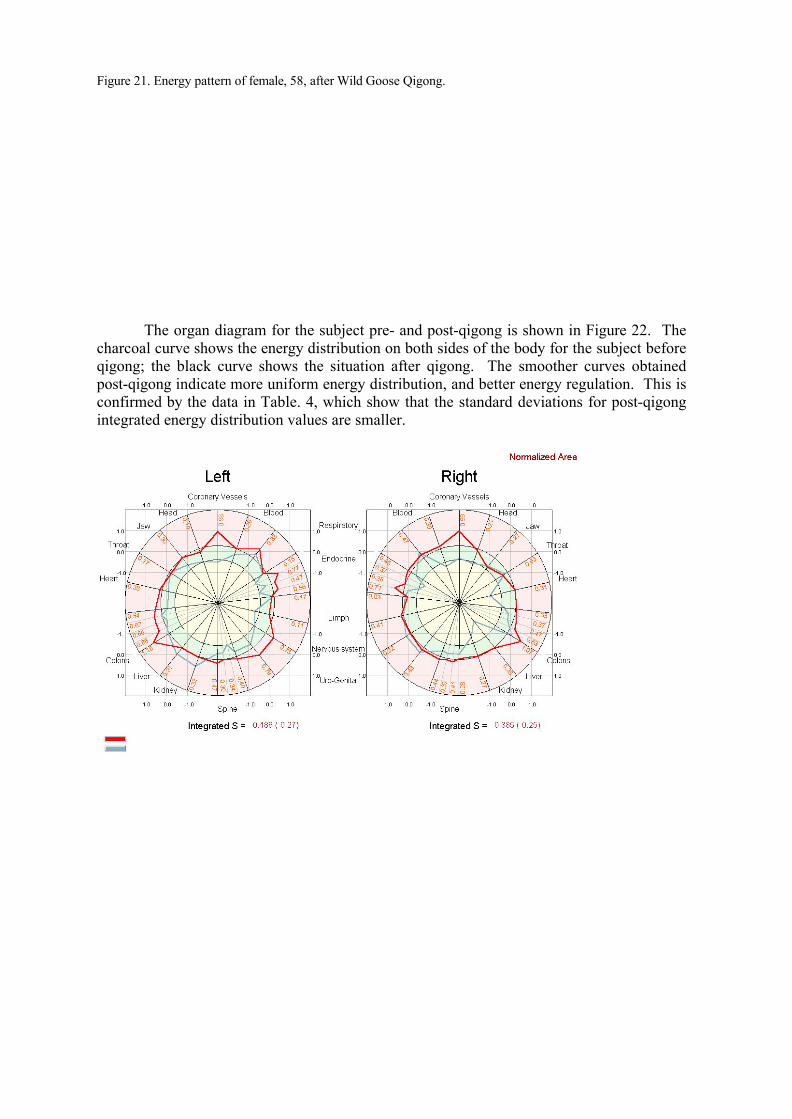
Figure 21. Energy pattern of female, 58, after Wild Goose Qigong.
The organ diagram for the subject pre- and post-qigong is shown in Figure 22. Thecharcoal curve shows the energy distribution on both sides of the body for the subject beforeqigong; the black curve shows the situation after qigong. The smoother curves obtainedpost-qigong indicate more uniform energy distribution, and better energy regulation. This isconfirmed by the data in Table. 4, which show that the standard deviations for post-qigongintegrated energy distribution values are smaller.

Figure 21. Organ diagram for female, 58, pre- (charcoal curve) and post- (black curve) qigong.
Pre-qigong Post-qigongLeft 0.013 (0.35) 0.486 (0.27)Right
-0.013 (0.47) 0.385 (0.25)
Table 4. Relative energy distribution on left and right sides of the body before and after female subject performedqigong. Standard deviations are shown in parenthesis for each calculated value.
The chakra diagram is shown in Figure 22. Most notably, all chakras are increased inenergy after qigong, except for the throat chakra (Vishuddhi). The heart and crown chakrawere the most expanded following qigong.
Figure 22. Chakra diagram for female subject, 58, pre-qiqong (lower curve) and post-qigong (upper curve).
The results indicate that the human energy field was significantly expanded, thatenergy regulation was enhanced, and that energy in the heart and crown chakras wereespecially increased in this subject following qigong practice.
E. Control Subject #1
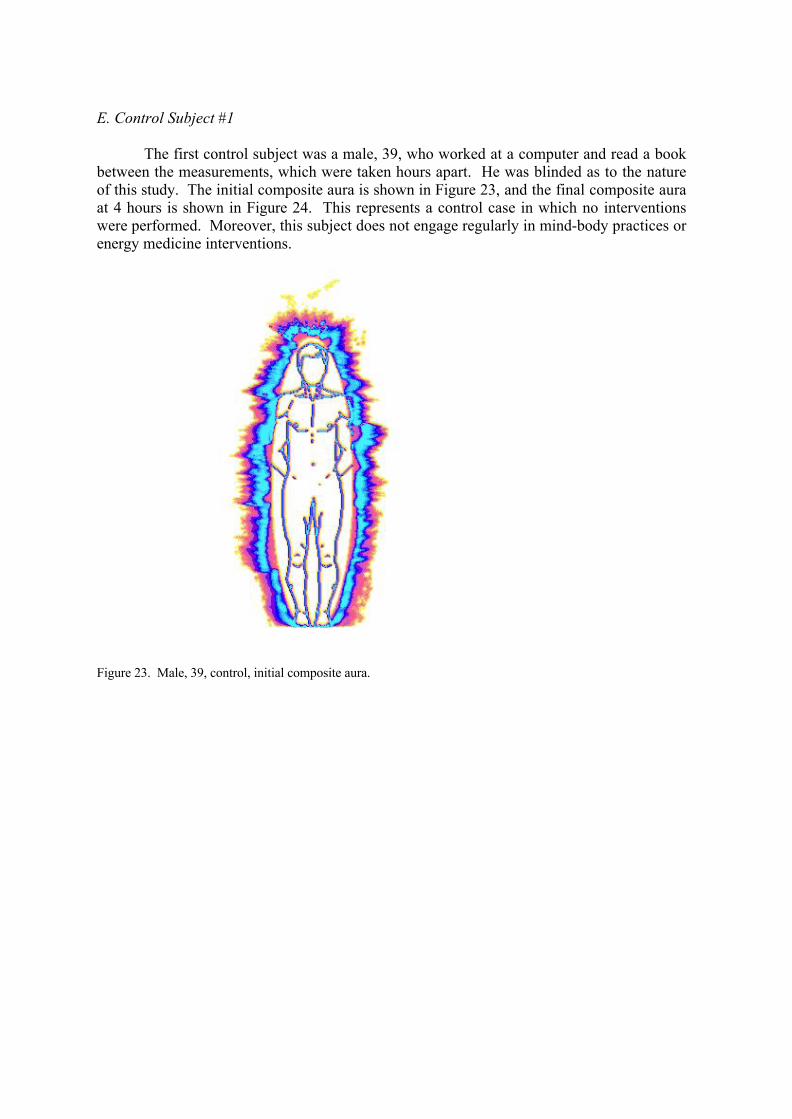
The first control subject was a male, 39, who worked at a computer and read a bookbetween the measurements, which were taken hours apart. He was blinded as to the natureof this study. The initial composite aura is shown in Figure 23, and the final composite auraat 4 hours is shown in Figure 24. This represents a control case in which no interventionswere performed. Moreover, this subject does not engage regularly in mind-body practices orenergy medicine interventions.
Figure 23. Male, 39, control, initial composite aura.

Figure 24. Male, 39, control, composite aura after working 4 hours reading a book and operating a computer.
The two auras appear to be very similar. The organ diagram is shown in Figure 25.
Figure 25. Organ diagram for control subject, male, 39, taken twice, 4 hours apart. Charcoal curve representsthe initial measurement, and the black curve the final measurement.
Table 4 shows the relative energy distribution on left and right sides of the body forthe initial and final measurements. The values are not significantly different, nor are the
standard deviations shown in parenthesis for each calculated value.
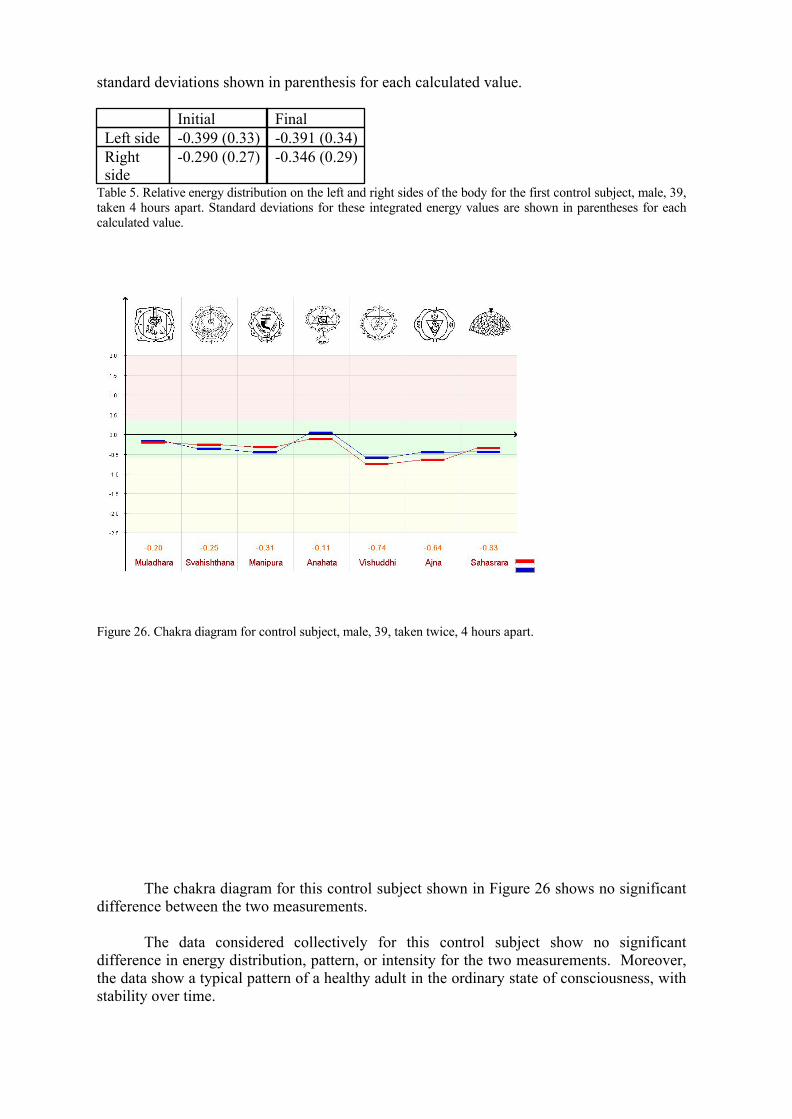
Initial FinalLeft side -0.399 (0.33) -0.391 (0.34)Rightside
-0.290 (0.27) -0.346 (0.29)
Table 5. Relative energy distribution on the left and right sides of the body for the first control subject, male, 39,taken 4 hours apart. Standard deviations for these integrated energy values are shown in parentheses for eachcalculated value.
Figure 26. Chakra diagram for control subject, male, 39, taken twice, 4 hours apart.
The chakra diagram for this control subject shown in Figure 26 shows no significantdifference between the two measurements.
The data considered collectively for this control subject show no significantdifference in energy distribution, pattern, or intensity for the two measurements. Moreover,the data show a typical pattern of a healthy adult in the ordinary state of consciousness, withstability over time.

F. Control Subject #2
The second control subject is a female, 62, who had a conversation with a colleaguein between the 2 measurements taken 2 hours apart. She was blinded as to the nature of thisstudy. The initial composite aura is shown in Figure 27, and the final composite aura at 2hours is shown in Figure 28. This represents a second control case in which no interventionswere performed.

Figure 27. Initial composite aura of control subject, female, 62.
Figure 28. Final composite aura of control subject, female, 62.
No significant difference is seen between these two auras. Figure 29 shows the organdiagram for the initial and final measurements. Again, no significant difference between thetwo measurements is seen. This is confirmed by the data shown in Table 5.
Figure 29. Organ diagram for initial and final measurements of control subject #2, female, 62.

Initial FinalLeft side 0.627 (0.28) 0.613 (0.23)Rightside
0.515 (0.31) 0.635 (0.25)
Table 6. Calculated integrated relative energy values for left and right sides of the body, control subject #2,female, 62, measured twice.
Figure 30 shows the chakra diagram for both runs on this control subject, and once again, itreveals no significant difference.
Figure 30. Chakra diagram for control subject, two runs.

Taken collectively, the evidence for control subject #2 shows no significantdifference in energy distribution, pattern, or intensity for the two measurements. Moreover,the data show a typical energy distribution pattern for a person who practices yoga, qigong,or other mind-body practice, which is expanded over the typical values observed for theaverage person. In this case, the subject is a yoga practitioner, although this intervention wasnot examined here.
CONCLUSIONS AND DISCUSSION
The data for 4 subjects that underwent interventions or mind-body alterations showssignificant changes in energy emission patterns. These interventions including practicingTherapeutic Touch, a type of biofield therapy; undergoing hypnosis to induce gloveanesthesia in the left hand; under possession and then release of a benign entity; andpracticing qigong. Additionally, the data for 2 control subjects that did not undergo anyinterventions between measurements showed no significant changes between initial and finalmeasurements. This was true despite the fact that control subject #2 was a yogini andpracticed yoga regularly.
The data indicate that practices such as biofield therapy, hypnosis, and qigong canalter the human energy field in particular ways as shown herein, and that the presence of anentity in the energy field can also alter it. Some of the practices showed changes that wereexpected; for example, the practice of qigong, whereas other practices such as the effects ofhypnosis showed trends that opposed the researcher’s and hypnotists’ expectations. As thisis only a preliminary study of a small number of cases, no strong conclusions can be saidabout the trends observed.
Nonetheless, these data demonstrate some of the promising features of this newmethod of scientific analysis of the digital Kirlian aura. It appears to be a stable method ofascertaining various features about the human energy system, both qualitatively andquantitatively, and promises to be useful as one method of investigating the human biofield. Many other types of quantitative analysis of the aura are possible with the GDV camerasoftware, but they were not done in this initial study.
It is possible that positive changes in the aura following a particular interventionindicate that that therapy might be useful to the subject for enhancing health or healing. Inrelation to this, Oriental medicine maintains that, “blood follows qi”, meaning that the fleshand blood will follow in the direction of subtle energy. Therefore, if energy regulation isimproved, the patient will improve. Further studies are needed to confirm this with respectto this new methodology, however, using large numbers of subjects studied under long term.
ACKNOWLEDGEMENTS
We gratefully acknowledge the support of the Lifebridge Foundation for the Institutefor Frontier Science and this work. We are also grateful to Bett Martinez and Effie Chowfor allowing us to study participants in Bett’s Dayan (Wild Goose) Qigong Workshop at the4th World Congress on Qigong, San Francisco, 2001.
REFERENCES
Claverie, J. (2001). Gene number: what if there are only 30,000 human genes? Science291(5507): 1255-1257. Coulter, HL. (1994). Divided Legacy, a History of the Schism in Medical Thought, Vol. 4: Twentieth Century Medicine: The Bacteriological Era. Washington, D.C.: Center forEmpirical Medicine. Korotkov, K. (1998a). Aura and Consciousness: New Stage of Scientific Understanding. St.

Petersburg, Russia: State Editing and Publishing Unit “Kultura”. Korotkov, K. (1998b). Light After Life: A Scientific Journey Into the Spiritual World. FairLawn, NJ: Backbone Publishing Co.Korotkov, K. (2002). Human Energy Field: Study with GDV Bioelectrography. Fair Lawn,NJ: Backbone Publishing Co.Mandel P. (1986). Energy Emission Analysis: New Application of Kirlian Photography forHolistic Health. Essen, Germany: Synthesis Publishing Company. Rubik B, Pavek R, Ward R, Greene E, Upledger J, Lawrence D, Ramsden E. (1994). Manualhealing methods. In: NIH Publication No. 94-066, Alternative Medicine: ExpandingMedical Horizons. Washington, DC: US Government Printing Office, 134-157.Rubik B. (2002, in press). The biofield hypothesis: its biophysical basis and role inmedicine. J Altern & Complement Med 8(6):xxx-yyy. Strohman, R. (1993). Ancient genomes, wise bodies, unhealthy people: limits of a geneticparadigm in biology and medicine. Perspect Biol & Med 37: 112-145.
i Dayan Qigong Workshop led by qigong master Bett Martinez at the 4th World Qigong Congress, May 2001. This conference was hosted by Dr. Effie Chow of the East West Qigong Center, San Francisco.