2002 Farm Bill
24
Allan Gray and Chris Hurt, Purdue University 2002 Farm Bill Decision Time Allan Gray and Chris Hurt Purdue University
-
Upload
xanthus-mason -
Category
Documents
-
view
40 -
download
0
description
2002 Farm Bill. Decision Time Allan Gray and Chris Hurt Purdue University. 2002 Farm Bill. 6 Year bill Costs $180 billion over 10 years Almost a $6.0 billion dollar increase in annual spending for program crops Similar to emergency legislation spending from 1997-2001 - PowerPoint PPT Presentation
Transcript of 2002 Farm Bill
Allan Gray and Chris Hurt, Purdue University
2002 Farm Bill
Decision Time
Allan Gray and Chris HurtPurdue University
Allan Gray and Chris Hurt, Purdue University
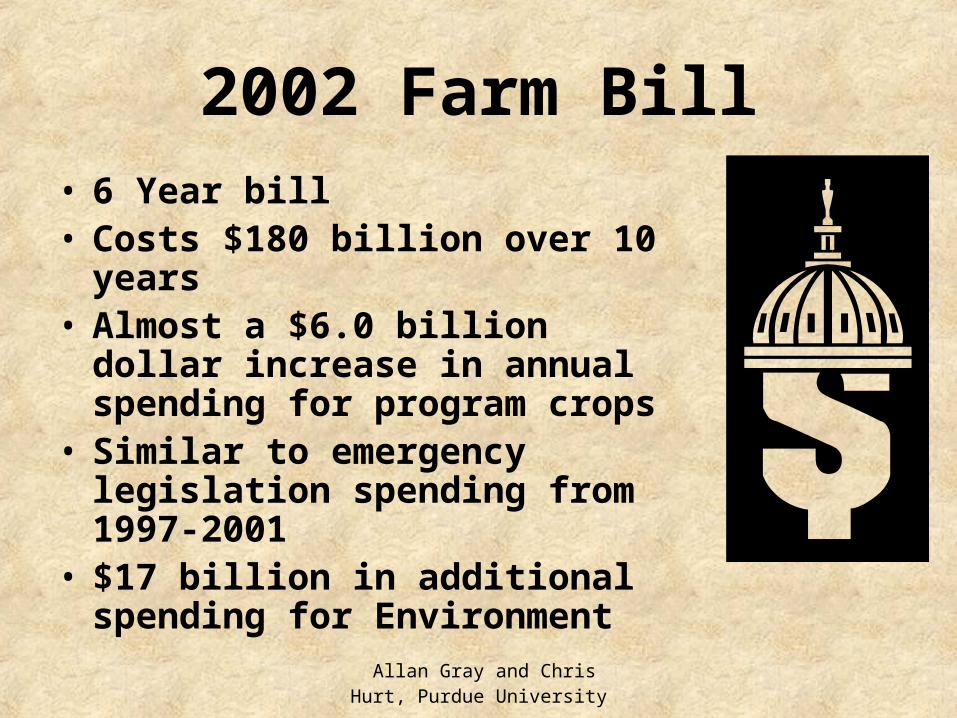
2002 Farm Bill• 6 Year bill• Costs $180 billion over 10 years• Almost a $6.0 billion dollar
increase in annual spending for program crops
• Similar to emergency legislation spending from 1997-2001
• $17 billion in additional spending for Environment

Allan Gray and Chris Hurt, Purdue University
What is in the Commodity Title of the Bill?
• Three Basic Support Mechanisms– Marketing Loans– Direct Payments– Counter-Cyclical Payments
• Soybeans and Peanuts become complete program crops
• Lentils, small chickpeas, wool, mohair, and honey are new commodities
• Dairy gets a counter-cyclical program
Allan Gray and Chris Hurt, Purdue University
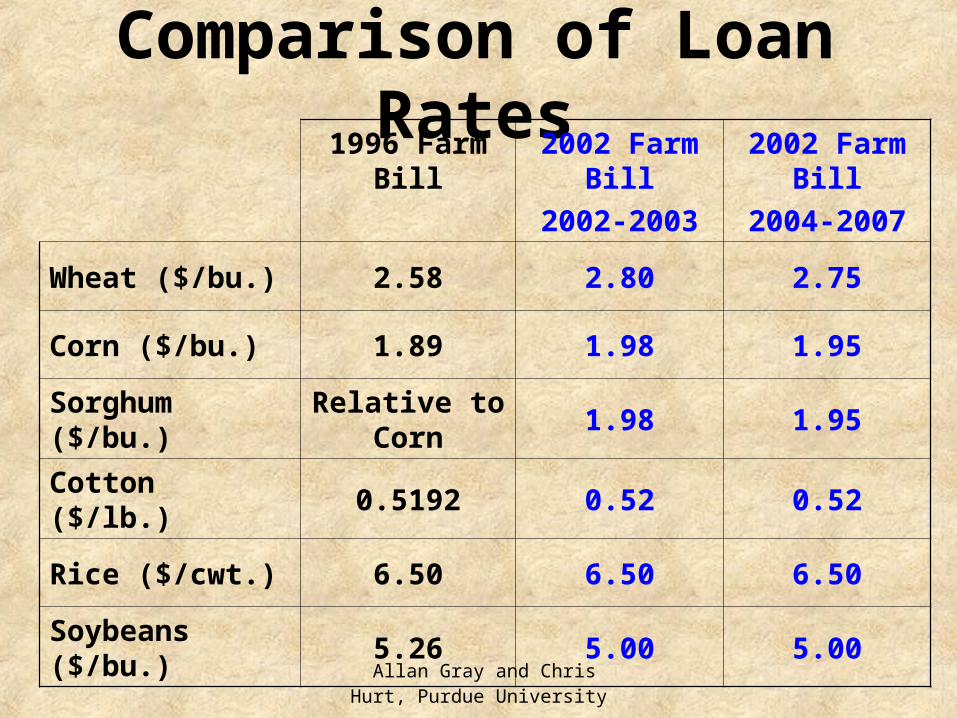
Comparison of Loan Rates1996 Farm
Bill2002 Farm
Bill2002-2003
2002 Farm Bill
2004-2007
Wheat ($/bu.) 2.58 2.80 2.75
Corn ($/bu.) 1.89 1.98 1.95
Sorghum ($/bu.) Relative to Corn 1.98 1.95
Cotton ($/lb.) 0.5192 0.52 0.52
Rice ($/cwt.) 6.50 6.50 6.50
Soybeans ($/bu.) 5.26 5.00 5.00

Allan Gray and Chris Hurt, Purdue University
Comparison of DirectPayment Rates
1996 Farm Bill (2001)
2002 Farm Bill
Wheat ($/bu.) .46 .52
Corn ($/bu.) .26 .28
Sorghum ($/bu.) .31 .35
Cotton ($/lb.) .057 .067
Rice ($/cwt.) 2.05 2.35
Soybeans ($/bu.) N/A .44
Allan Gray and Chris Hurt, Purdue University
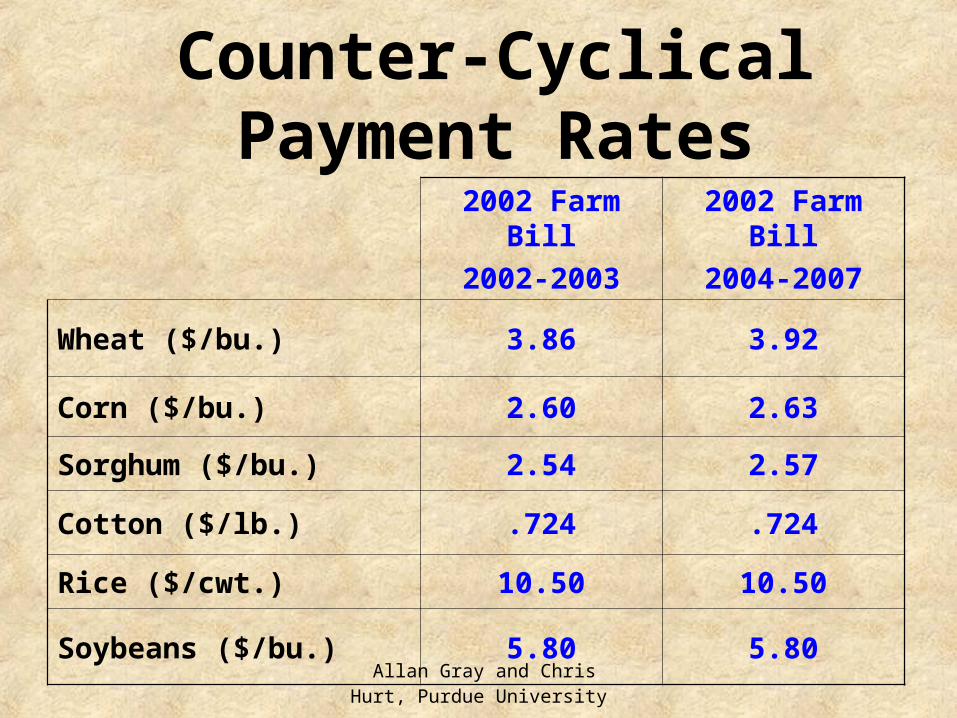
Counter-Cyclical Payment Rates
2002 Farm Bill2002-2003
2002 Farm Bill2004-2007
Wheat ($/bu.) 3.86 3.92
Corn ($/bu.) 2.60 2.63
Sorghum ($/bu.) 2.54 2.57
Cotton ($/lb.) .724 .724
Rice ($/cwt.) 10.50 10.50
Soybeans ($/bu.) 5.80 5.80

Allan Gray and Chris Hurt, Purdue University
Computing Payments• Direct Payments (DP)
– DP per unit X Base acres X DP yield X 0.85 = Direct Payment
• Counter Cyclical Program Payments (CCP)– Target Price – DP per unit – higher of (loan rate
or market price) = CCP per unit– CCP per unit X Base acres X CCP payment yield
X 0.85 = CCP Payment• Marketing Loan Payments (LDP)
– (Loan Rate – Market Price)*Current Production

Allan Gray and Chris Hurt, Purdue University
$2.52
$ .03$ .21 $ .00
$2.28$1.98$2.60
$2.81$2.46Total
$ .00$0.34 ($0.27)Counter Cyclical
$ .21$ 0.28 ($0.21)Direct $ .00$ .29LDP
$2.60$1.69Market Price$1.98$1.98Corn Loan$2.60$2.60Corn Target
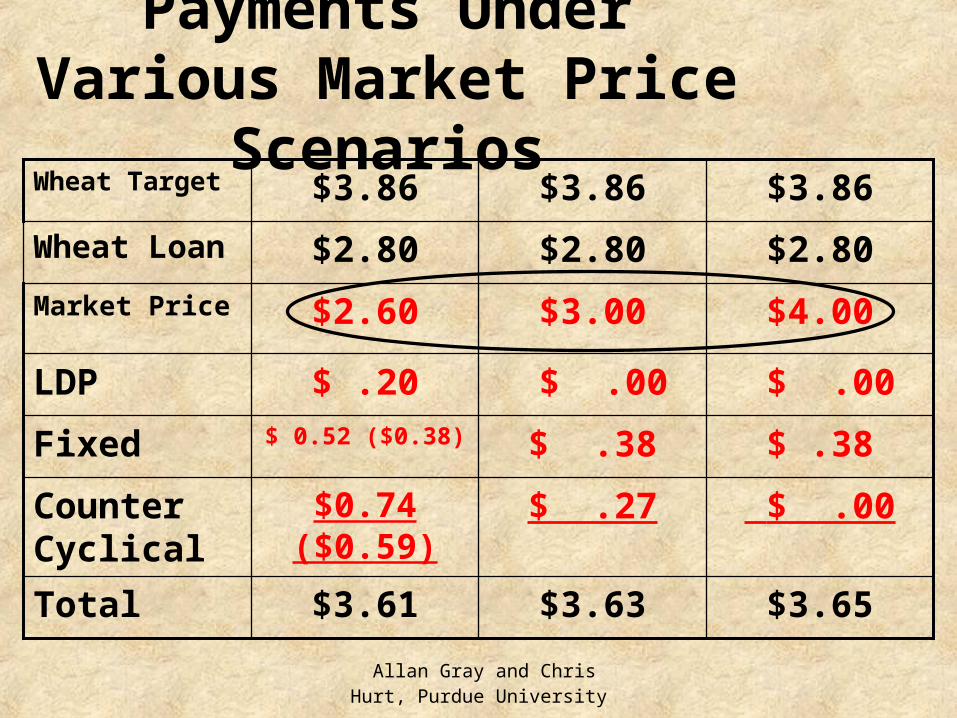
Payments Under Various Market Price Scenarios
Allan Gray and Chris Hurt, Purdue University
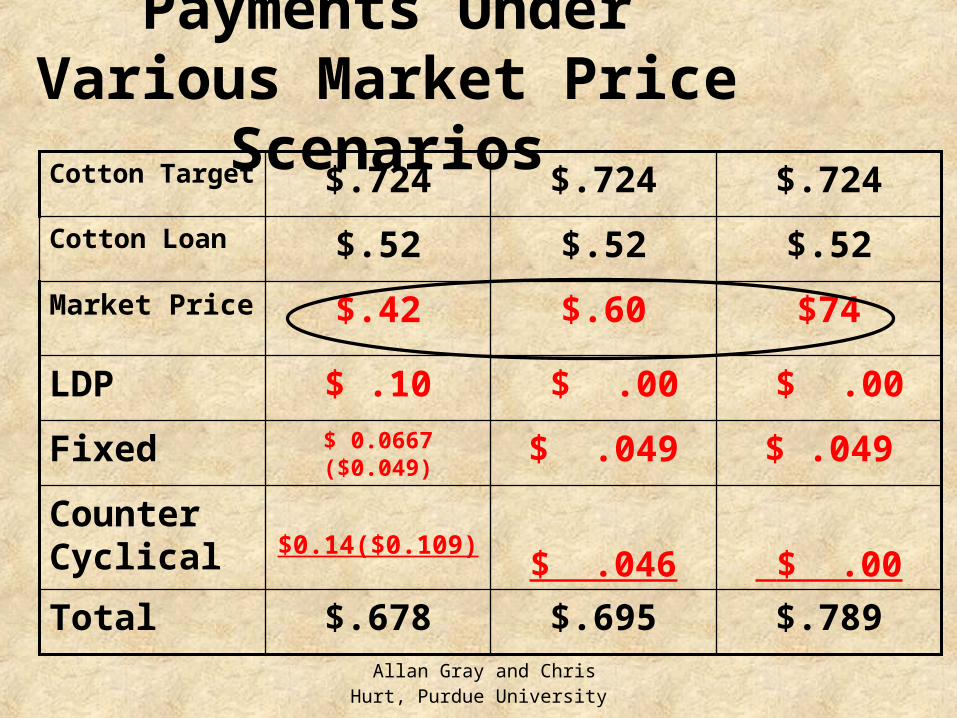
$.695$ .046
$ .049
$ .00
$.60
$.52
$.724
$.789$.678Total $ .00$0.14($0.109)
Counter Cyclical
$ .049$ 0.0667 ($0.049)Fixed
$ .00$ .10LDP
$74$.42Market Price
$.52$.52Cotton Loan
$.724$.724Cotton Target
Payments Under Various Market Price Scenarios
Allan Gray and Chris Hurt, Purdue University
$3.63
$ .27$ .38 $ .00
$3.00$2.80$3.86
$3.65$3.61Total
$ .00$0.74 ($0.59)Counter Cyclical
$ .38$ 0.52 ($0.38)Fixed $ .00$ .20LDP
$4.00$2.60Market Price$2.80$2.80Wheat Loan
$3.86$3.86Wheat Target
Payments Under Various Market Price Scenarios

Allan Gray and Chris Hurt, Purdue University
Price Impact of Program
$1.50
$1.75
$2.00
$2.25
$2.50
$2.75
$3.00
$3.25
$3.50
$1.50 $1.70 $1.90 $2.10 $2.30 $2.50 $2.70 $2.90Market Price
Govt Price
EffectivePrice
MarketPrice
$2.32 = $2.60 - .28

Allan Gray and Chris Hurt, Purdue University
Components of Final Price
$1.40
$1.60
$1.80
$2.00
$2.20
$2.40
$2.60
$2.80
$3.00
$3.20$1
.50
$1.6
0
$1.7
0
$1.8
0
$1.9
0
$2.0
0
$2.1
0
$2.2
0
$2.3
0
$2.4
0
$2.5
0
$2.6
0
$2.7
0
$2.8
0
Market Price
Mar
ket +
Gov
ernm
ent
$2.60-.28 = $2.32
Loan =$1.98
Market Price
Direct Payment
CCP’s
LPP’s
Allan Gray and Chris Hurt, Purdue University
Summary of Risk Impacts of 2002 Farm Bill
• Potential to substantially reduce downside cash flow risk
• Does not do a good job of protecting against yield drops

Allan Gray and Chris Hurt, Purdue University
Impact of Yield Drops on Total Revenue
20%
40%
60%
80%
100%
120%
140%
90.00 92.00 94.00 96.00 98.00 100.00
National Yield Index
% C
hang
e in
Rev
enue
Market Receipts Government Payments Total Revenue

Allan Gray and Chris Hurt, Purdue University
Impact on Revenues from Various Drops in Farm Level Yields When National Yields are Down 10%
96%103%
109% 116%129%
48% 48% 48% 48% 48%
88% 93% 98% 104%114%
0%
20%
40%
60%
80%
100%
120%
75.00 80.00 85.00 90.00 100.00
Yield Index
% C
hang
e in
Rec
eipt
s
Market Receipts Government Payments Total Revenue

Allan Gray and Chris Hurt, Purdue University
Updating Base Acres and Yields
• Five Basic Options– Make No Changes– Don’t update base acres or yields and simply add
soybeans to fully base your acres– Maximize soybean base– Update base acres and CCP payment yields
• Don’t update yields is an option• using 70% of the difference between 98-01 average yield
and 1985 program yield• using 93.5% of the 98-01 average yield
– Trade base acres of other crops for bean base
Allan Gray and Chris Hurt, Purdue University
Decision-Support Spreadsheet
• Website for Farm Bill Spreadsheet:
• http://www.agecon.purdue.edu/staff/gray/agrium/agrium.htm
• Spreadsheet Example

Allan Gray and Chris Hurt, Purdue University
FSA Letter Page 1

Allan Gray and Chris Hurt, Purdue University
FSA Letter from Page 2

Allan Gray and Chris Hurt, Purdue University
INPUTS Complete the Yellow Cells for Example FarmThis spreadsheet is designed for each individual farm number, not for the entire farming operation.
Name or Number of Farm Example REQUIRED INPUTSEffective DCP Cropland 148.8 CALCULATED VALUESMaximum Double Crop Acres (1998-2001) 0.0 NOT APPLICABLE
Historical Farm Program Information Barley Corn Cotton Oats Rice Sorghum Soybeans Wheat2002 PFC Acres 0.0 128.1 0.0 0.0 0.0 0.0 11.5Direct Yields (PFC Yields) 0 103.0 0 0 0 0 51
Barley Corn Cotton Oats Rice Sorghum Soybeans Wheat1998 0.0 0.0 0.0 0.0 0.0 0.0 48.3 85.51999 0.0 0.0 0.0 0.0 0.0 0.0 133.8 0.02000 0.0 143.8 0.0 0.0 0.0 0.0 0.0 0.02001 0.0 0.0 0.0 0.0 0.0 0.0 143.8 0.0
Average 0.0 36.0 0.0 0.0 0.0 0.0 81.5 21.4
Barley Corn Cotton Oats Rice Sorghum Soybeans WheatIn the cells to the rignt enter the actual 0 0 0 0 0 0 43 50 1998yields for this farm. The computer will 0 0 0 0 0 0 37 0 1999determine whether to use this actual 0 150 0 0 0 0 0 0 2000yield or 75% of the county average yield. 0 0 0 0 0 0 50 0 2001
Planted Acres
Yield Per Harvested Acre

Allan Gray and Chris Hurt, Purdue University
OUTPUTS Probability of Best Options for Example Farm(Based on discounted cash flows over the life of the Farm Bill)
Farm Bill Options Option 1 Option 2 Option 3 Option 5
Explanation of OptionsRetain Current
PFC Base
Retain PFC Base & Add Oilseeds Without Offset
Maximize Soybean Base by Trading
(offset)
Update Base Acres, Keep
Historical Yields
Update Base Acres, Update
Yields with 70% Rule
Update Base Acres, Update
Yields with 93.5% Rule
Swap Selected PFC Acres for Oilseed Base
Probability* 0% 100% 0% 0% 0% 0% 0%Discounted Cash Flows** 27,208 27,399 19,372 17,930 19,327 19,397 27,399Base Acres
Barley Acres 0.0 0.0 0.0 0.0 0.0 0.0 0.0Corn Acres 128.1 128.1 60.2 36.0 36.0 36.0 128.1Cotton Acres 0.0 0.0 0.0 0.0 0.0 0.0 0.0Oats Acres 0.0 0.0 0.0 0.0 0.0 0.0 0.0Rice Acres 0.0 0.0 0.0 0.0 0.0 0.0 0.0Sorghum Acres 0.0 0.0 0.0 0.0 0.0 0.0 0.0Soybean Acres 0.0 2.1 81.5 81.5 81.5 81.5 2.1Wheat Acres 11.5 11.5 0.0 21.4 21.4 21.4 11.5
CCP YieldsBarley Yield 0 0 0 0 0 0 0Corn Yield 103 103 103 103 136 140 103Cotton Yield 0 0 0 0 0 0 0Oats Yield 0 0 0 0 0 0 0Rice Yield 0 0 0 0 0 0 0Sorghum Yield 0 0 0 0 0 0 0Soybean Yield 0 34 34 34 41 41 34Wheat Yield 51 51 51 51 52 50 51
Direct Payment YieldsBarley Yield 0 0 0 0 0 0 0Corn Yield 103 103 103 103 103 103 103Cotton Yield 0 0 0 0 0 0 0Oats Yield 0 0 0 0 0 0 0Rice Yield 0 0 0 0 0 0 0Sorghum Yield 0 0 0 0 0 0 0Soybean Yield 0 34 34 34 34 34 34Wheat Yield 51 51 51 51 51 51 51
Option 4

Allan Gray and Chris Hurt, Purdue University
Critical Issues• WTO negotiations• Competitiveness• Market
responsiveness• Value of land and
farmland rents• Budget costs

Allan Gray and Chris Hurt, Purdue University
Treating Symptoms or Curing Problems?
• Will this farm bill reduce dependence on government?
• Will this farm bill improve crop prices?
• Will this farm bill encourage free trade and competition?
• Will this farm bill provide opportunities or maintain status quo?
Allan Gray and Chris Hurt, Purdue University
Contact Information