2000 Refugio County Population by Age Source: 2000 U.S Census Bureau.
89
R efugio C ounty Profile Philip W . R hoades, Ph.D . V alerieV illarrealB.A . Stephanie Jackson B.A . Sw athiYarlagadda B.S. June 30,2005
-
Upload
dennis-quinn -
Category
Documents
-
view
216 -
download
0
Transcript of 2000 Refugio County Population by Age Source: 2000 U.S Census Bureau.

Refugio County Profile
Philip W. Rhoades, Ph.D.
Valerie Villarreal B.A.
Stephanie Jackson B.A.
Swathi Yarlagadda B.S.
June 30, 2005
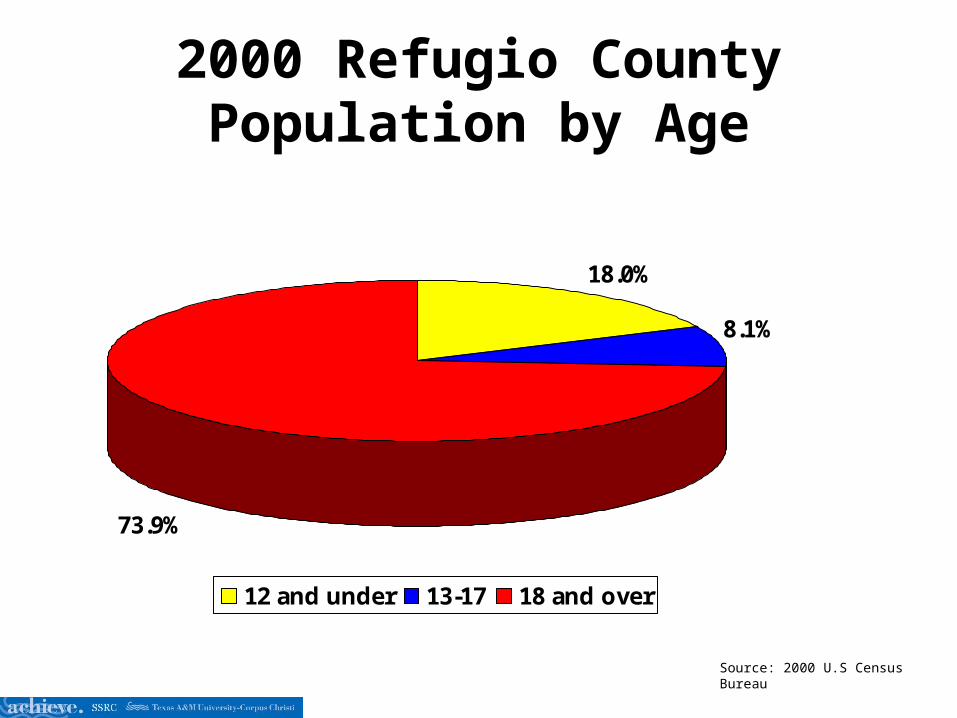
2000 Refugio County Population by Age
Source: 2000 U.S Census Bureau
73.9%
18.0%
8.1%
12 and under 13-17 18 and over

2004 Refugio County Population by Age
18
8.4
74
12 & und
13-17
18+
Source: 2000 U.S Census Bureau
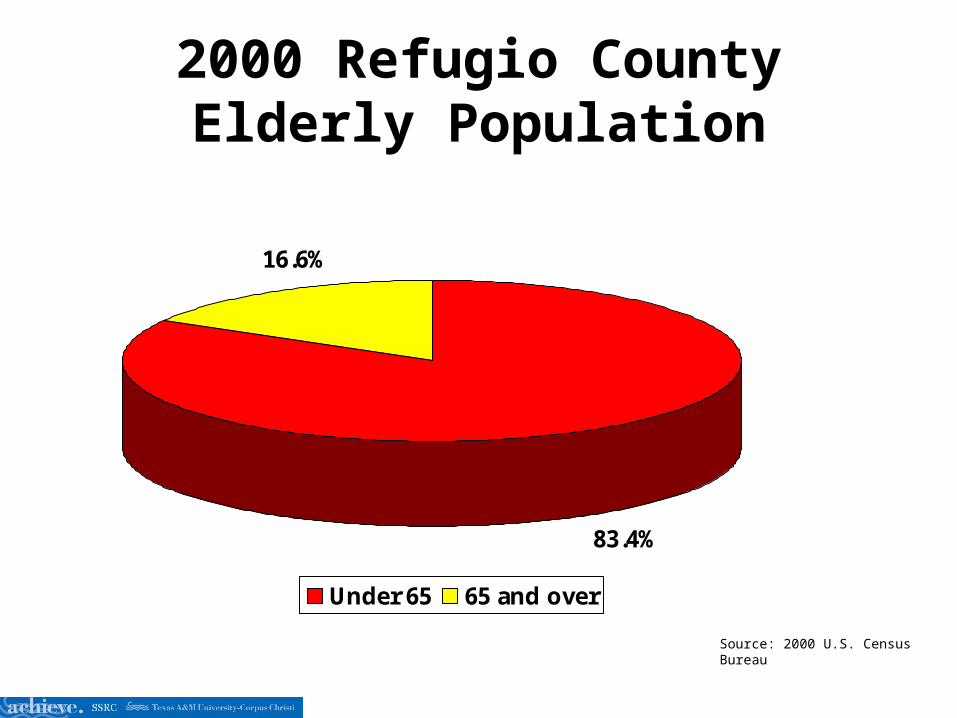
2000 Refugio County Elderly Population
Source: 2000 U.S. Census Bureau
83.4%
16.6%
Under 65 65 and over

2004 Refugio County Elderly Population
81.2
18.8
under 65
65 +
Source: 2000 U.S. Census Bureau

2000 Percent of Male and Female
Source: 2000 U.S Census Bureau
48.9%51.1%
Male Female
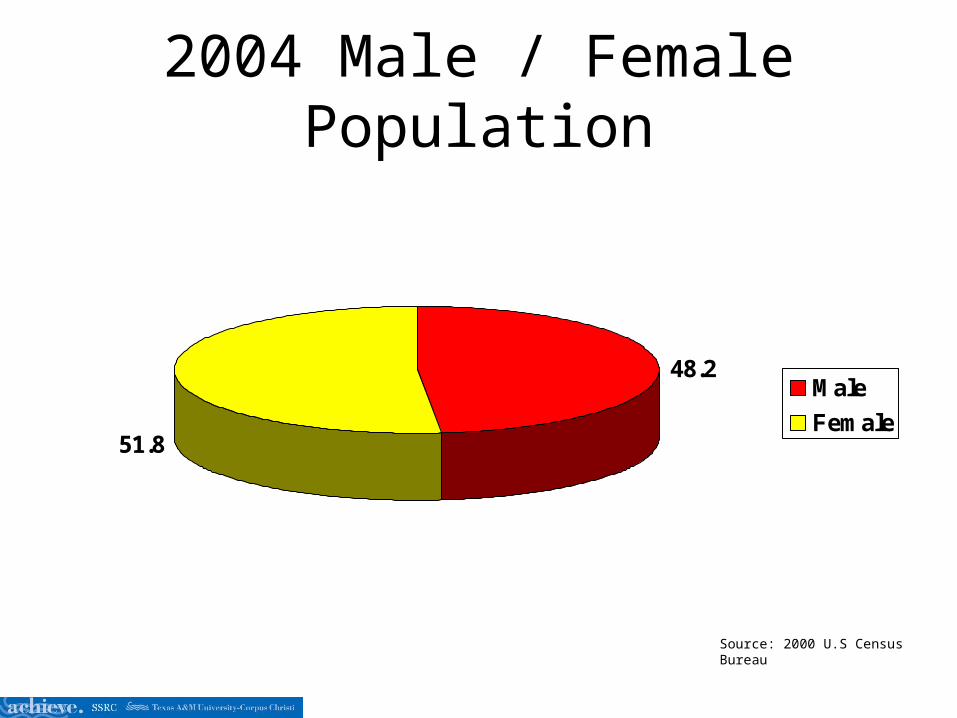
2004 Male / Female Population
48.2
51.8
Male
Female
Source: 2000 U.S Census Bureau
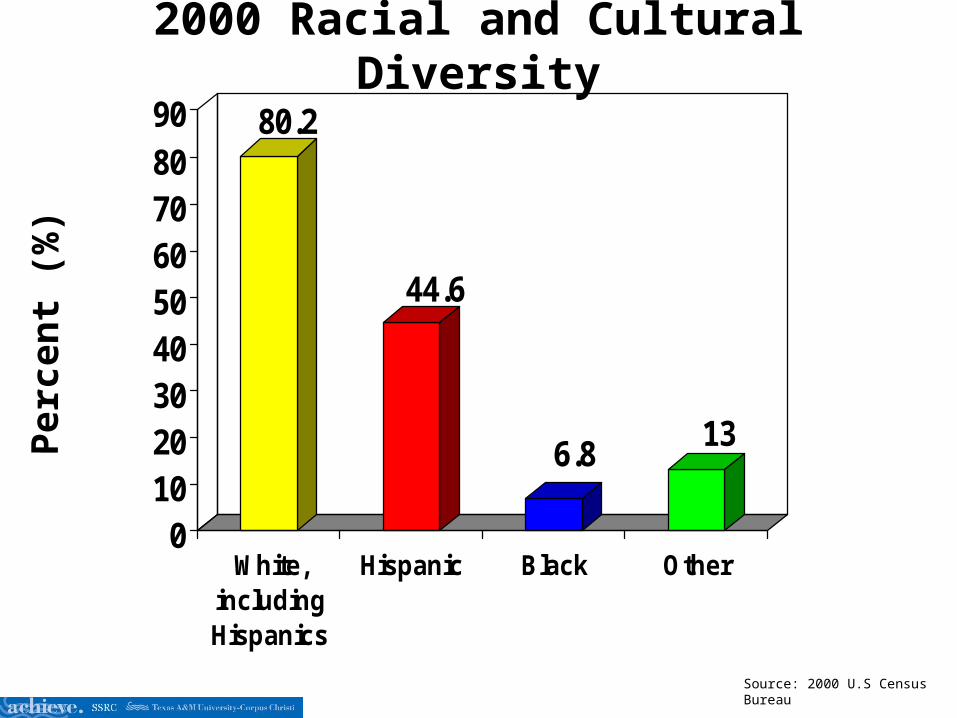
2000 Racial and Cultural Diversity
80.2
44.6
6.813
0102030405060708090
White,includingHispanics
Hispanic Black Other
Source: 2000 U.S Census Bureau
Per c
ent (
%)

2004 Racial and Cultural Diversity
80.1
44.5
6.9 13.1
0102030405060708090
White,includingHispanics
Hispanic Black Other
Source: 2000 U.S Census Bureau
Per c
ent (
%)

0
0.5
1
1.5
2
2.5
2000 2001 2002 2003 2004
State Refugio
Alcohol-Related Juvenile ArrestsPe
r 1,0
00 J
uven
iles
Source: Texas Uniform Crime Reports
0
0.5
1
1.5
2
2.5
3
3.5
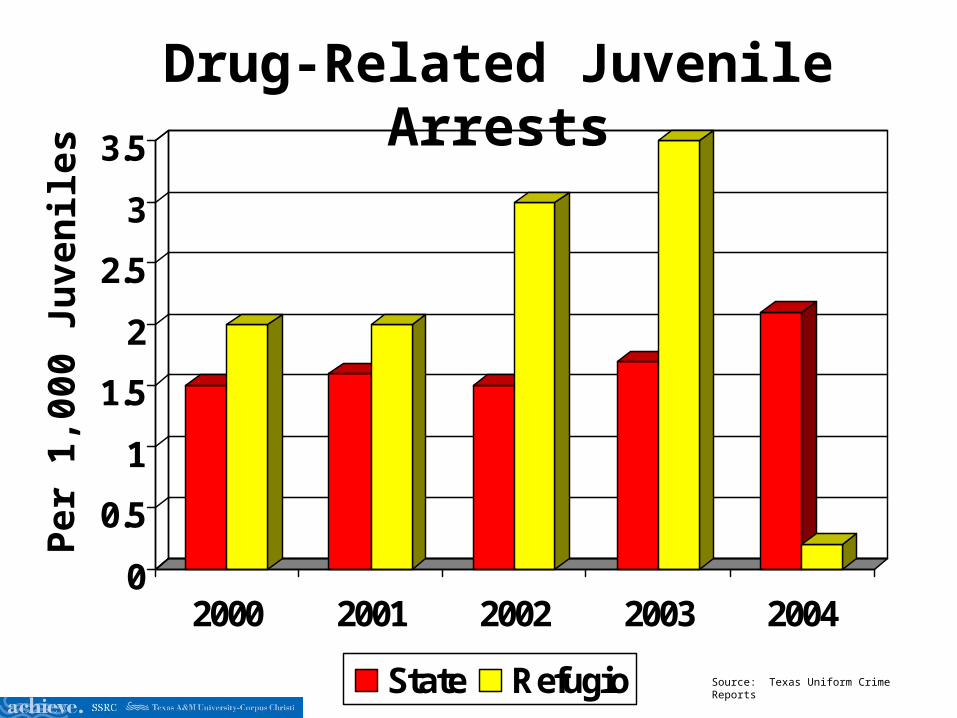
2000 2001 2002 2003 2004
State Refugio
Drug-Related Juvenile ArrestsPe
r 1,0
00 J
uven
iles
Source: Texas Uniform Crime Reports

0
0.5
1
1.5
2
2000 2001 2002 2003 2004
State Refugio
Violent Crimes Juvenile ArrestsPe
r 1,0
00 J
uven
iles
Source: Texas Uniform Crime Reports

0
1
2
3
4
5
6
2000 2001 2002 2003 2004
State Refugio
Property Crimes Juvenile ArrestsPe
r 1,0
00 J
uven
iles
Source: Texas Uniform Crime Reports
0
0.5
1
1.5
2
2.5
3
3.5
2000 2001 2002 2003 2004
State Refugio
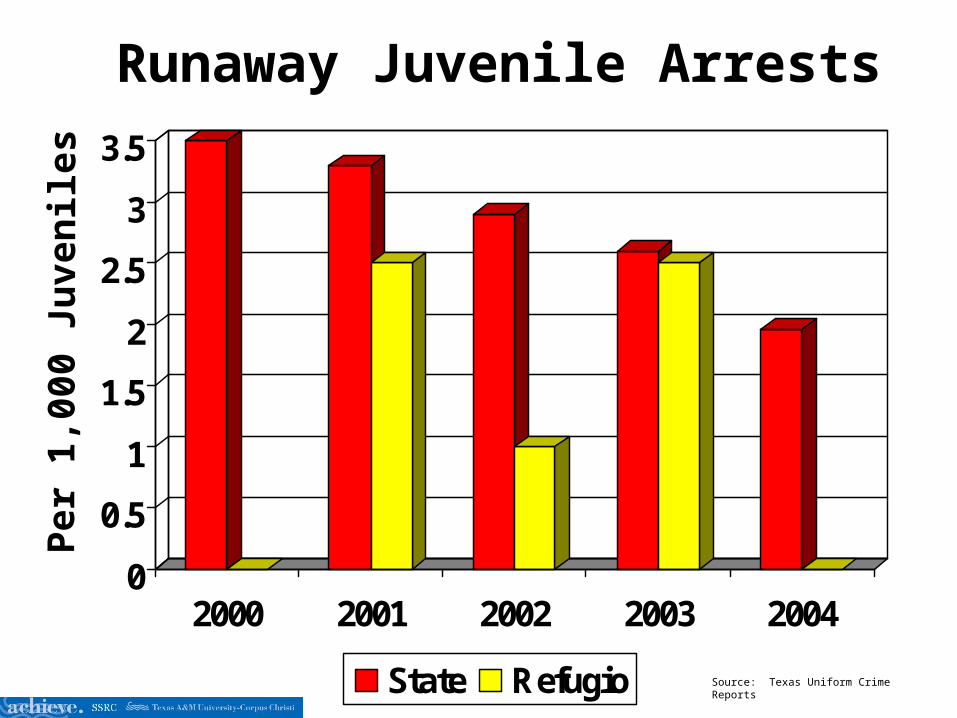
Runaway Juvenile ArrestsPe
r 1,0
00 J
uven
iles
Source: Texas Uniform Crime Reports

0
1
2
3
4
5
6
7
8
2000 2001 2002 2003 2004
State Refugio
Curfew, Vandalism, & Disorderly Conduct Juvenile Arrests
Per 1
,000
Juv
enile
s
Source: Texas Uniform Crime Reports

0
5
10
15
20
2000 2001 2002 2003 2004
State Refugio
Alcohol-Related Adult ArrestsPe
r 1,0
00 A
dults
Source: Texas Uniform Crime Reports

0
2
4
6
8
10
12
14
2000 2001 2002 2003 2004
State Refugio
Drug-Related Adult ArrestsPe
r 1,0
00 A
dults
Source: Texas Uniform Crime Reports
0
0.5
1
1.5
2
2.5
3
3.5
2000 2001 2002 2003 2004
State Refugio
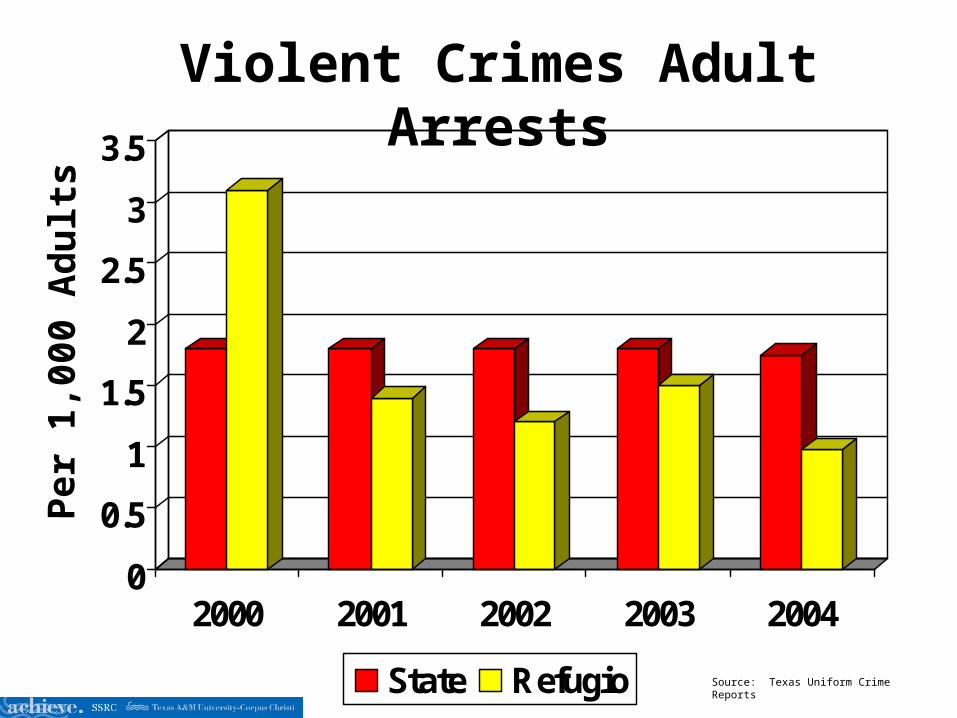
Violent Crimes Adult ArrestsPe
r 1,0
00 A
dults
Source: Texas Uniform Crime Reports

0
1
2
3
4
5
6
7
2000 2001 2002 2003 2004
State Refugio
Property Crimes Adult ArrestsPe
r 1,0
00 A
dults
Source: Texas Uniform Crime Reports

0123456789
2000 2001 2002 2003
State Refugio
Rate of Family Violence IncidentsPe
r 1,0
00 p
opul
atio
n
Source: Texas Uniform Crime Report
0
2
4
6
8
10
12
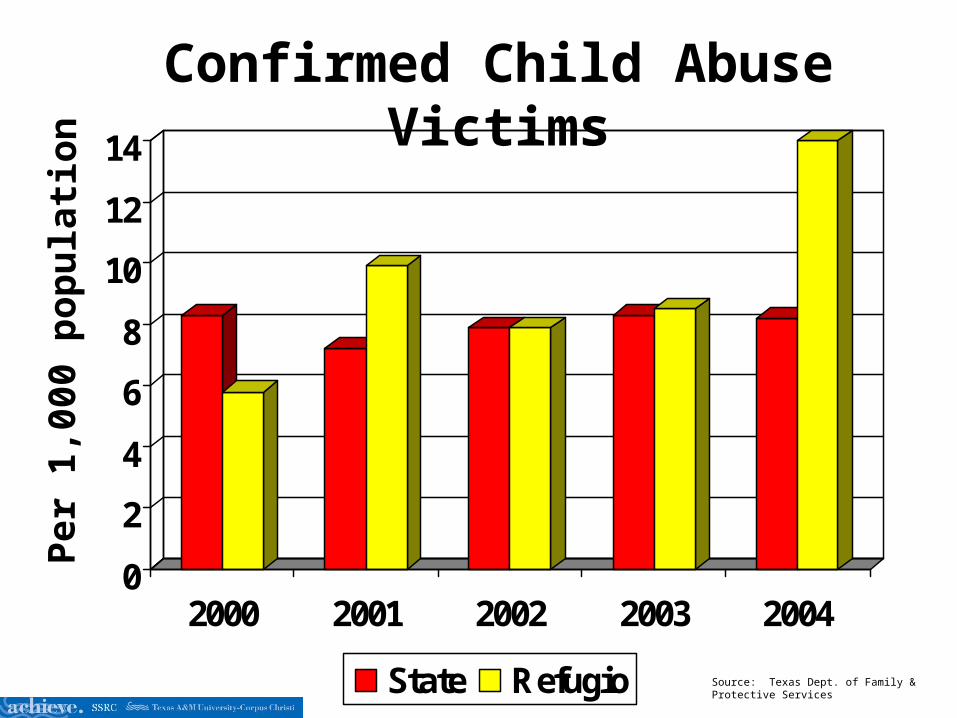
14
2000 2001 2002 2003 2004
State Refugio
Confirmed Child Abuse VictimsPe
r 1,0
00 p
opul
atio
n
Source: Texas Dept. of Family & Protective Services

0
1
2
3
4
5
6
7
2000 2001 2002 2003 2004
State Refugio
2003 Confirmed Adult AbusePe
r 1,0
00 p
opul
atio
n
Source: 2003 Texas Dept. of Family & Protective Services
0
1
2
3
4
5
6
7
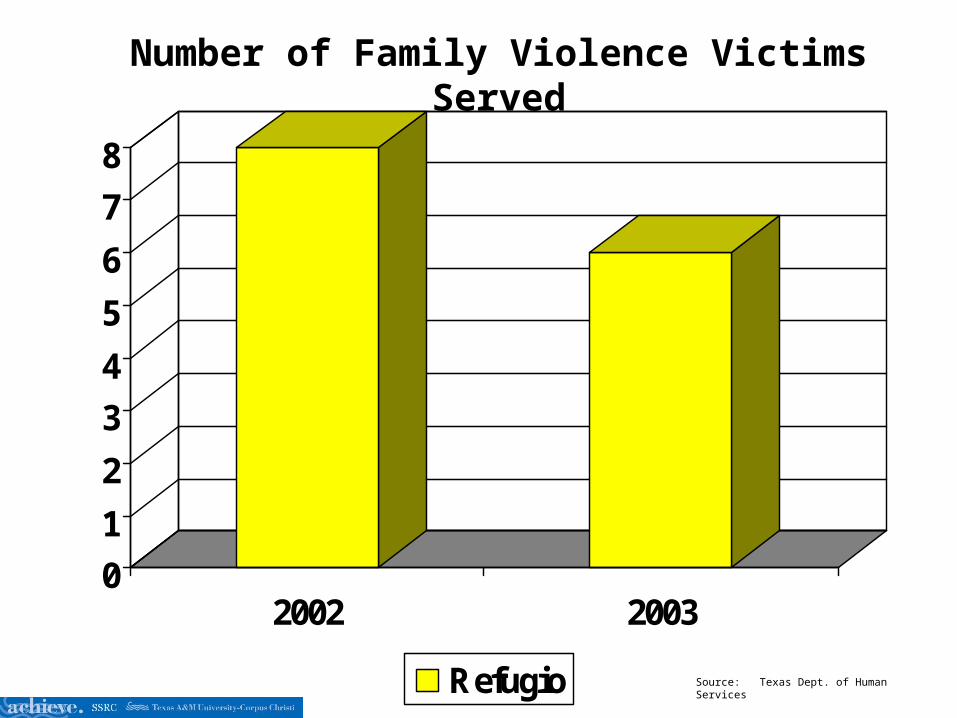
8
2002 2003
Refugio
Number of Family Violence Victims Served
Source: Texas Dept. of Human Services

0
200
400
600
800
1,000
1,200
Food Stamps Medicaid TANF
2002 2003 2004
Recipients of Food Stamps, Medicaid, & TANF
Source: Texas Department of Human Services

0
1
2
3
4
5
6
7
2001 2002 2003 2004
State Refugio
Unemployment Rate
Source: Texas Workforce Commission

0
10
20
30
40
50
60
2000 2004
% in Labor Force % not in Labor Force
Labor Force: 16 years & over
Source: Demographicsnow

0
5
10
15
20
Poverty
State Refugio
1999 Elderly Poverty Status (65 years and over)Pe
r cen
t (%
)
Source: 2000 U.S. Census Bureau

18
19
20
21
22
23
24
25
Poverty
State Refugio
1999 Poverty Status of Individuals Under 18 Years of AgePe
r cen
t bel
ow p
ove r
ty le
vel (
%)
Source: 2000 U.S. Census Bureau

0
5
10
15
20
25
Poverty
State Refugio
1999 Families in Poverty (with related children under 18)Pe
r cen
t bel
ow p
ove r
ty le
vel (
%)
Source: 2000 U.S. Census Bureau

19
20
21
22
23
24
Poverty
2000 2001 2002
Children in Poverty Pe
r cen
t bel
ow p
ove r
ty le
vel (
%)
Source: 2000 U.S. Census Bureau
14
14.5
15
15.5
16
16.5
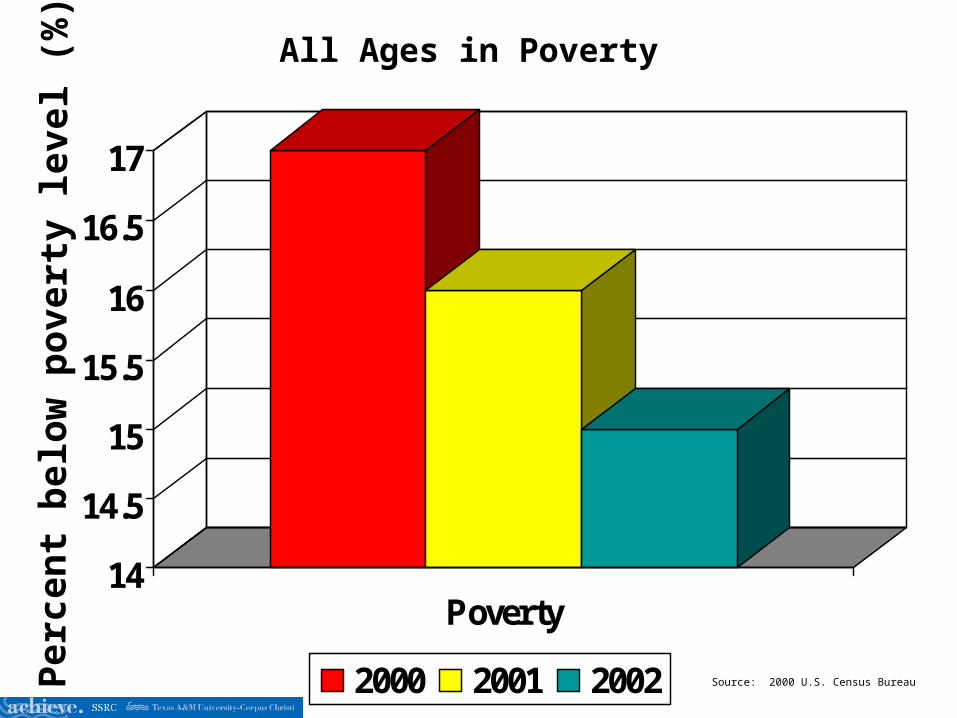
17
Poverty
2000 2001 2002
All Ages in Poverty Pe
r cen
t bel
ow p
ove r
ty le
vel (
%)
Source: 2000 U.S. Census Bureau
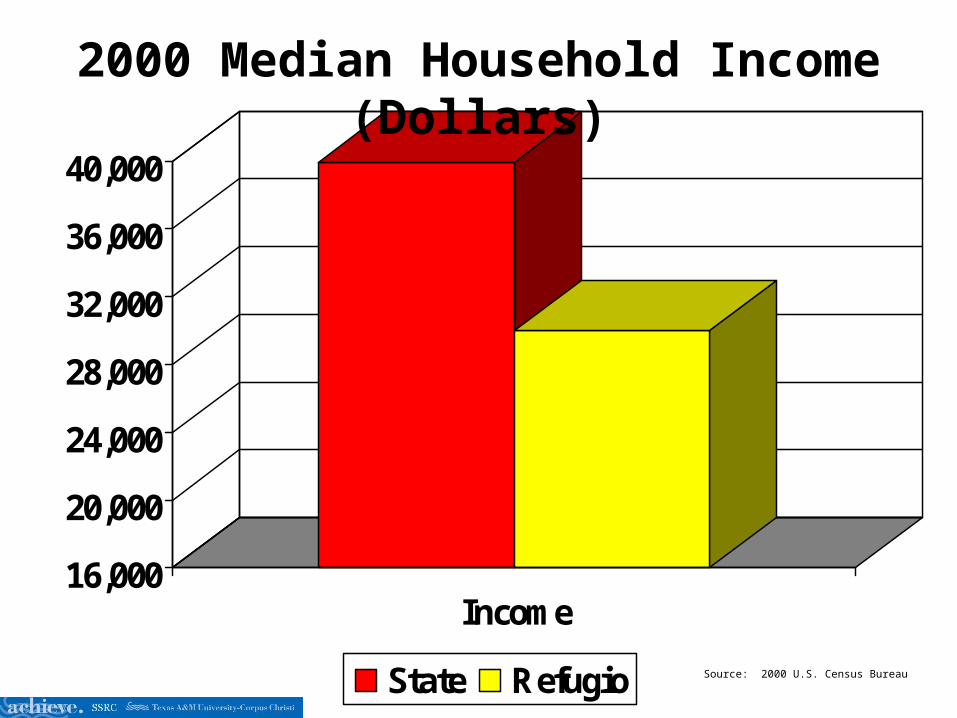
16,000
20,000
24,000
28,000
32,000
36,000
40,000
Income
State Refugio
2000 Median Household Income (Dollars)
Source: 2000 U.S. Census Bureau

16,000
20,000
24,000
28,000
32,000
36,000
40,000
Income
State Refugio
2004 Median Household Income (Dollars)
Source: 2000 U.S. Census Bureau
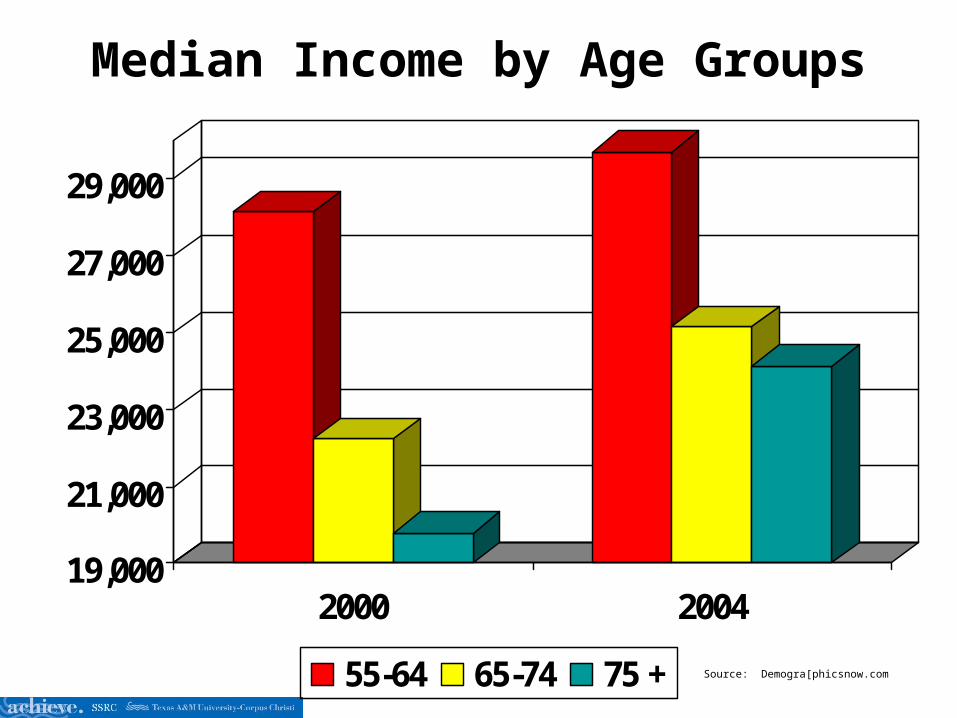
19,000
21,000
23,000
25,000
27,000
29,000
2000 2004
55-64 65-74 75 +
Median Income by Age Groups
Source: Demogra[phicsnow.com
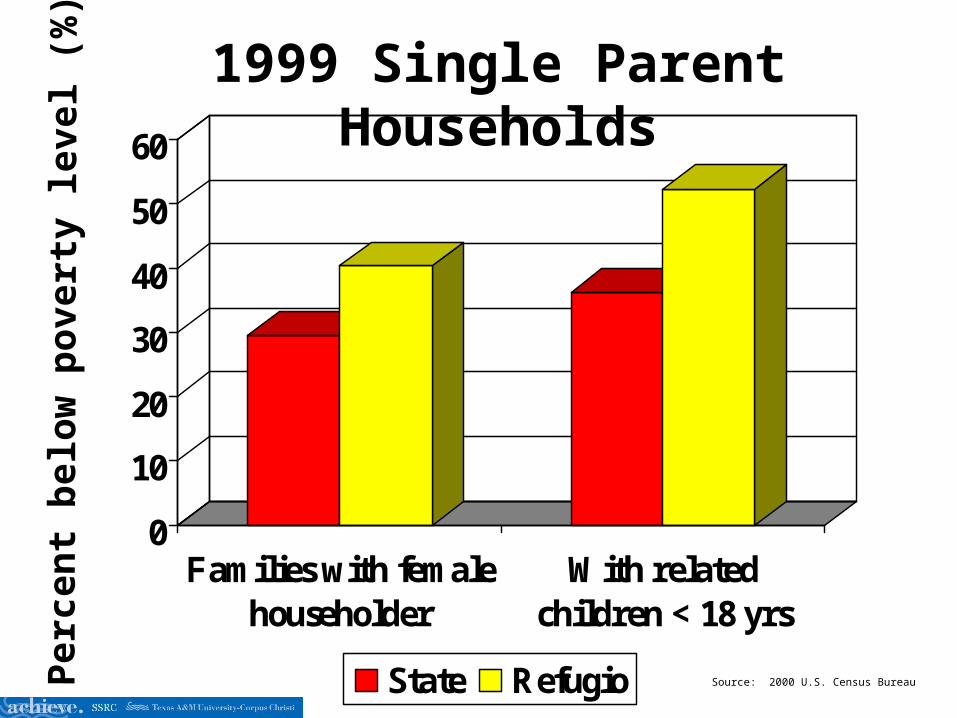
0
10
20
30
40
50
60
Families with femalehouseholder
With relatedchildren < 18 yrs
State Refugio
1999 Single Parent HouseholdsPe
r cen
t bel
ow p
ove r
ty le
vel (
%)
Source: 2000 U.S. Census Bureau

36
38
40
42
44
46
48
2001 2002
State Refugio
Educational Status of Unmarried Mothers: Less than 12 yrs of Education
Per c
ent (
%)
Source: Demographicnow
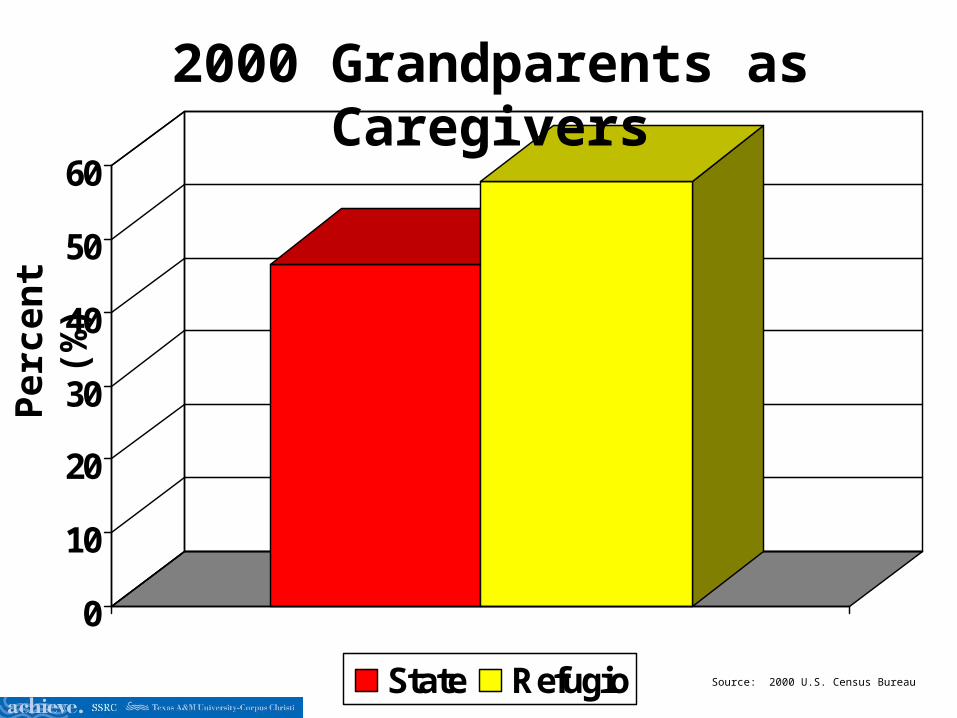
0
10
20
30
40
50
60
State Refugio
2000 Grandparents as CaregiversPe
r cen
t (%
)
Source: 2000 U.S. Census Bureau

1,130
1,135
1,140
1,145
1,150
1,155
1,160
1,165
1,170
1,175
1,180
2001 2002 2003 2004 2005
Refugio County Adults with Mental Illness: 2001-2003 Estimates
Source: Texas Dept. of Mental Health and Mental Retardation

05
1015202530354045
5-15 yrs 16-64 yrs 65 & over
State Refugio
2000 Disability Status by Age
Source: 2000 U.S Census Bureau
Pe
rce
nt
(%)

0
2
4
6
8
10
12
14
16
2000 2001 2002 2003
State Refugio
Percent of Teen Births
Source: Texas Dept. of Health
Per c
ent (
%)

02468
1012141618
1999 2000 2001 2002
State Refugio
Infant Mortality RatePe
r 1,0
00 p
opul
atio
n
Source: Texas Department of Health

0
2
4
6
8
10
12
14
2000 2001 2002 2003
State Refugio
Mortality RatePe
r 1,0
00 p
opul
atio
n
Source: Texas Dept. of Health

0123456789
1999 2000 2001 2002 2003
State Refugio
Percent of Low Birth Weight
Source: Texas Dept. of Health
Per c
ent (
%)

0
1
2
3
4
5
6
2000 2001 2002 2003
State Refugio Source: Texas Department of Health
Chlamydia R
ate
per
1,0
00 p
op
ula
tio
n
Half year only
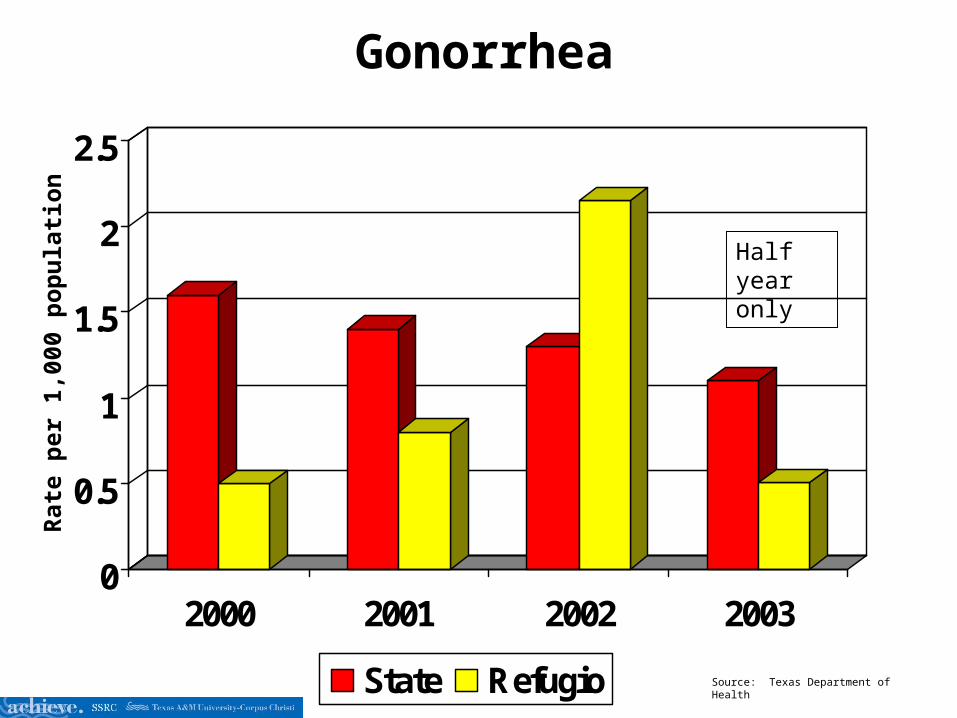
0
0.5
1
1.5
2
2.5
2000 2001 2002 2003
State Refugio Source: Texas Department of Health
Gonorrhea R
ate
per
1,0
00 p
op
ula
tio
n
Half year only
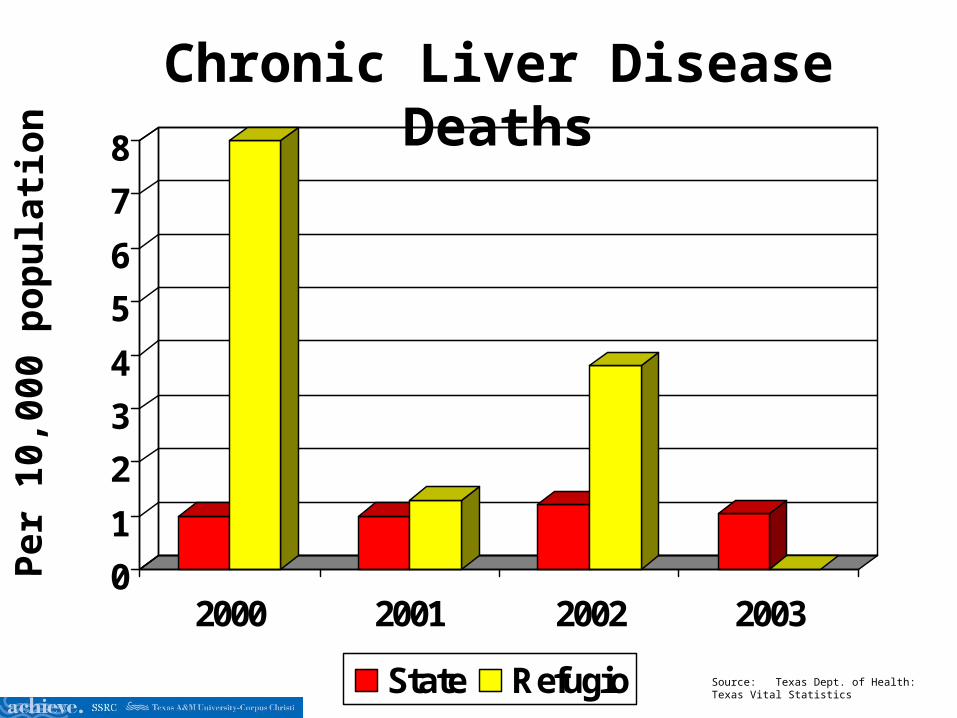
0
1
2
3
4
5
6
7
8
2000 2001 2002 2003
State Refugio
Chronic Liver Disease DeathsPe
r 10,
0 00
popu
latio
n
Source: Texas Dept. of Health: Texas Vital Statistics
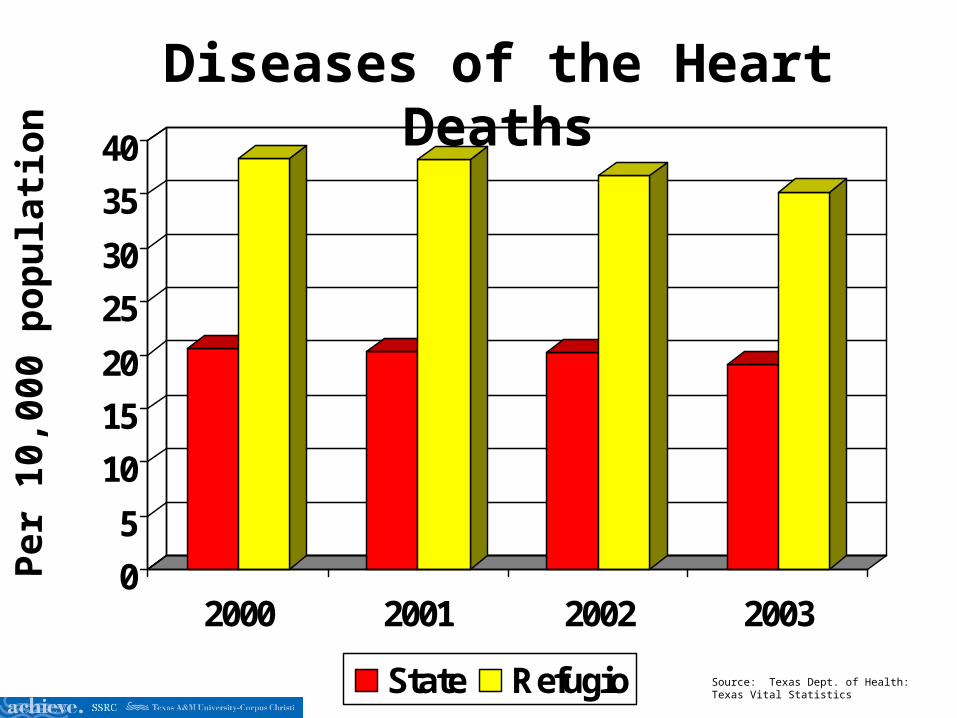
0
5
10
15
20
25
30
35
40
2000 2001 2002 2003
State Refugio
Diseases of the Heart DeathsPe
r 10,
000
popu
latio
n
Source: Texas Dept. of Health: Texas Vital Statistics

0
5
10
15
20
25
30
35
2000 2001 2002 2003
State Refugio
Malignant Neoplasm DeathsPe
r 10,
000
popu
latio
n
Source: Texas Dept. of Health: Texas Vital Statistics
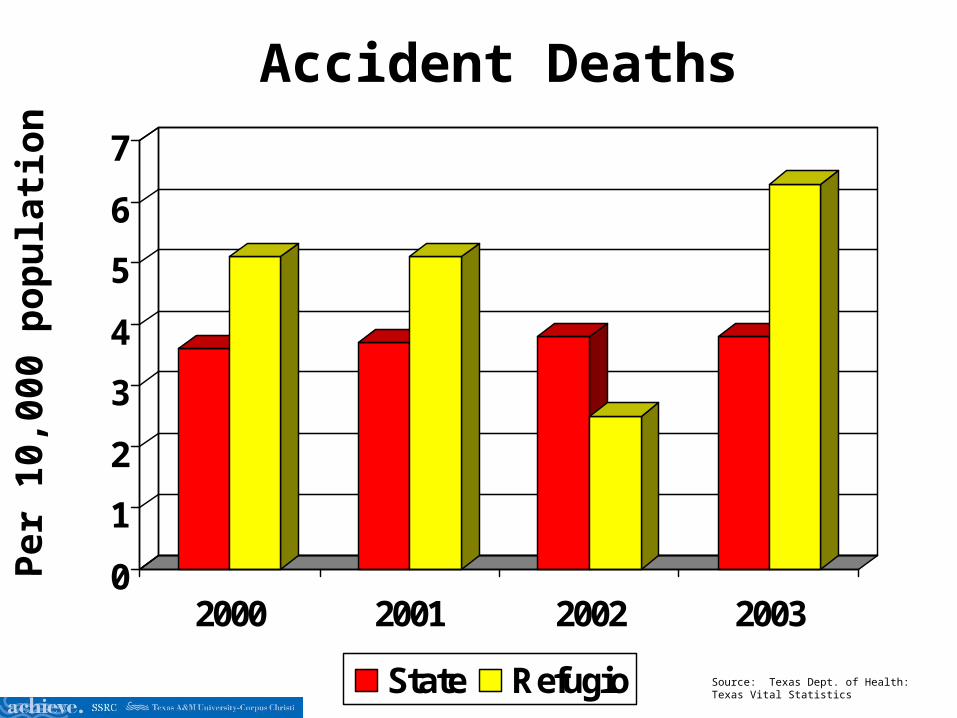
0
1
2
3
4
5
6
7
2000 2001 2002 2003
State Refugio
Accident DeathsPe
r 10,
000
popu
latio
n
Source: Texas Dept. of Health: Texas Vital Statistics

0
0.2
0.4
0.6
0.8
1
1.2
1.4
2000 2001 2002 2003
State Refugio
SuicidePe
r 10,
000
popu
latio
n
Source: Texas Dept. of Health: Texas Vital Statistics

0
0.1
0.2
0.3
0.4
0.5
0.6
0.7
2000 2001 2002 2003
State Refugio
HomicidePe
r 10,
000
popu
latio
n
Source: Texas Dept. of Health: Texas Vital Statistics

30
31
32
33
34
35
36
37
38
2002 2003
Refugio
Annual Sales Tax Receipts for Mixed Beverages In
Tho
usan
ds o
f Dol
lars
Source: State of Texas Comptroller of Public Accounts

0
10
20
30
40
50
60
70
2000 2004
Owner-Occupied Renter-Occupied Vacant
Total Housing UnitsPe
rce n
t
Source: Dmographicsnow
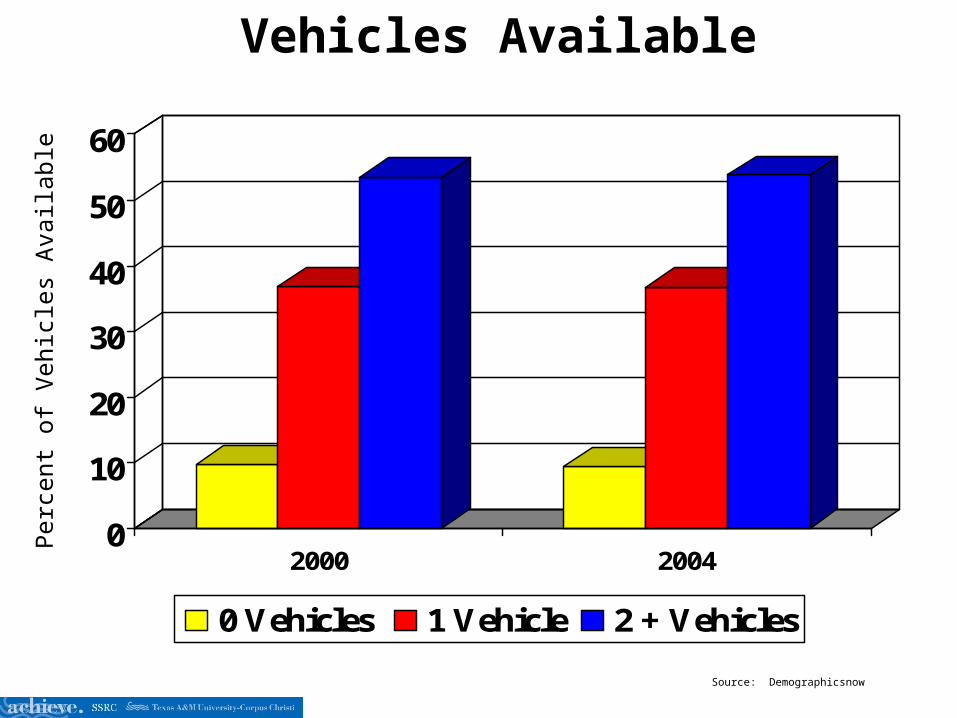
0
10
20
30
40
50
60
2000 2004
0 Vehicles 1 Vehicle 2 + Vehicles
Vehicles Available
Source: Demographicsnow
Per
cent
of
Veh
icle
s A
vaila
ble
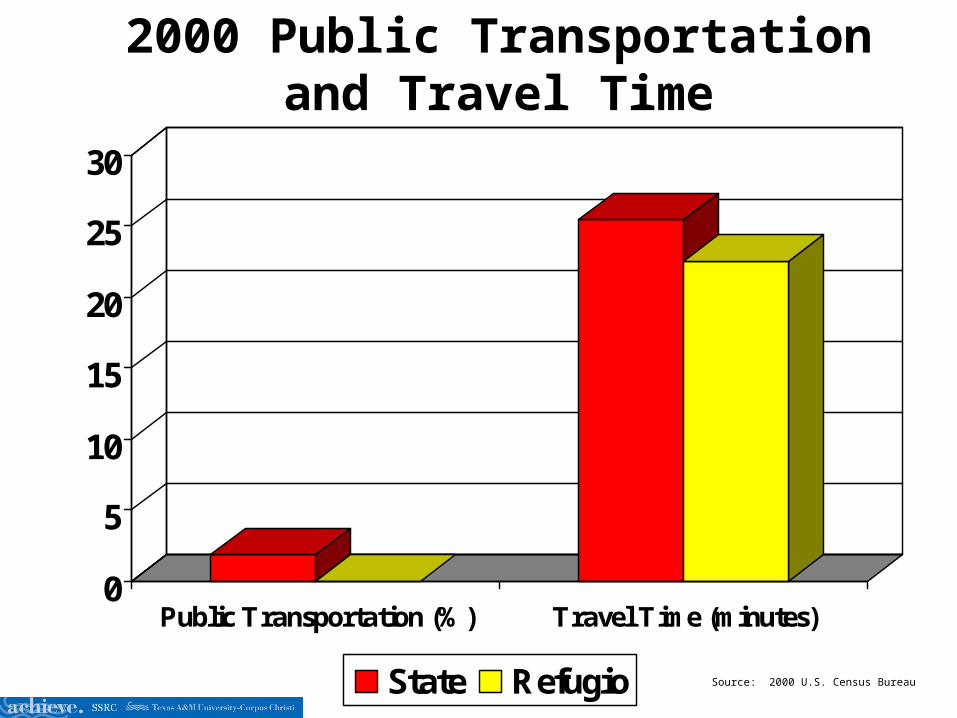
0
5
10
15
20
25
30
Public Transportation (%) Travel Time (minutes)
State Refugio
2000 Public Transportation and Travel Time
Source: 2000 U.S. Census Bureau

2000 Residence County to Workplace County: Refugio County
Source: 2000 U.S. Census Bureau
70.9%
29.1%
Work in County Work outside County

2003 % Passing Reading TAKS
81
82
83
84
85
86
87
88
89
90
91
State Austwell-Tivoli Refugio Woodsboro
Source: Texas Education Agency

2003 % Passing Math TAKS
75
76
77
78
79
80
81
82
State Austwell-Tivoli Refugio Woodsboro
Source: Texas Education Agency

Reading TAKS Met Standards (Sum of All Grades Tested) (Panel Recommendation)
0
10
20
30
40
50
60
70
80
90
2003 2004
State Austwell Refugio Woodsboro

Math TAKS Met Standards (Sum of All Grades Tested) (Panel Recommendation)
0
10
20
30
40
50
60
70
2003 2004
State Austwell Refugio Woodsboro

2003 % Limited English Proficiency
0
0.2
0.4
0.6
0.8
1
1.2
1.4
1.6
1.8
Austwell-Tivoli Refugio Woodsboro
Source: Texas Education Agency
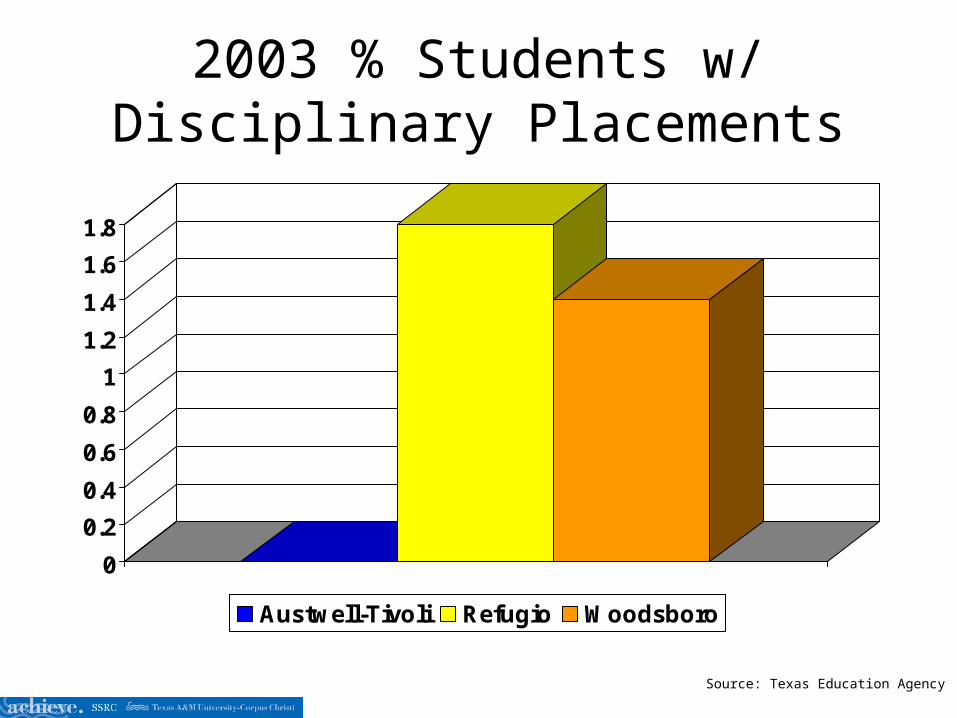
2003 % Students w/ Disciplinary Placements
0
0.2
0.4
0.6
0.8
1
1.2
1.4
1.6
1.8
Austwell-Tivoli Refugio Woodsboro
Source: Texas Education Agency

Percent of Economically Disadvantaged Students
0
10
20
30
40
50
60
2000 2001 2002 2003
State Austwell-Tivoli Refugio Woodsboro
Source: Texas Education Agency

Attendance Rate
94.6
94.895
95.2
95.495.695.8
96
96.296.496.6
1999 2000 2001 2002
State Austwell-Tivoli Refugio Woodsboro
Source: Texas Education Agency

Dropped Out (4 Year % of Students)
0
102030
405060
708090
100
1999 2000 2001 2002
Austwell-Tivoli Refugio Woodsboro
Source: Texas Education Agency

Total Number of Students
0
100
200
300
400
500
600
700
800
900
2000 2001 2002 2003
Austwell-Tivoli Refugio Woodsboro
Source: Texas Education Agency

High School Rate of Graduation
0
102030
40506070
8090
100
2000 2001 2002 2003
Austwell-Tivoli Refugio Woodsboro State
Source: Texas Education Agency

2000 Percent of Students by Ethnicity/Race
0
10
20
30
40
50
60
70
80
White Hispanic African-American
Other
Austwell-Tivoli Refugio Woodsboro
Source: Texas Education Agency

2001 Percent of Students by Ethnicity/Race
0
10
20
30
40
50
60
70
80
White Hispanic African-American
Other
Austwell-Tivoli Refugio Woodsboro
Source: Texas Education Agency

2002 Percent of Students by Ethnicity/Race
0
10
20
30
40
50
60
70
White Hispanic African-American
Other
Austwell-Tivoli Refugio Woodsboro
Source: Texas Education Agency
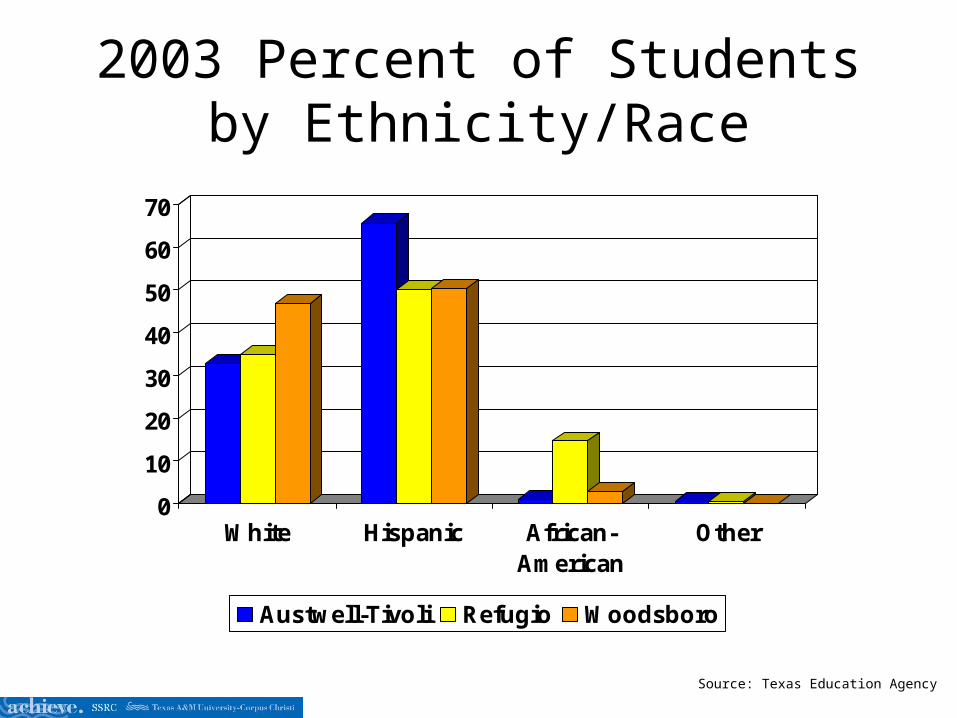
2003 Percent of Students by Ethnicity/Race
0
10
20
30
40
50
60
70
White Hispanic African-American
Other
Austwell-Tivoli Refugio Woodsboro
Source: Texas Education Agency

Total Number of Graduates
0
10
20
30
40
50
60
70
1999 2000 2001 2002
Austwell-Tivoli Refugio Woodsboro
Source: Texas Education Agency
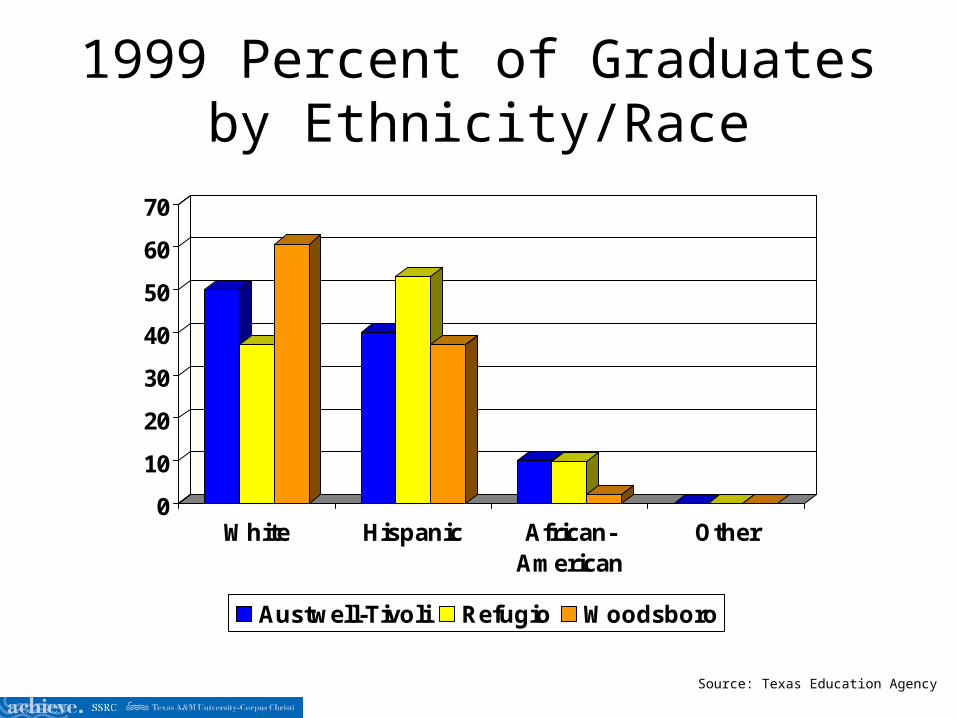
1999 Percent of Graduates by Ethnicity/Race
0
10
20
30
40
50
60
70
White Hispanic African-American
Other
Austwell-Tivoli Refugio Woodsboro
Source: Texas Education Agency

2000 Percent of Graduates by Ethnicity/Race
0
10
20
30
40
50
60
70
White Hispanic African-American
Other
Austwell-Tivoli Refugio Woodsboro
Source: Texas Education Agency

2001 Percent of Graduates by Ethnicity/Race
0
10
20
30
40
50
60
70
80
White Hispanic African-American
Other
Austwell-Tivoli Refugio Woodsboro
Source: Texas Education Agency
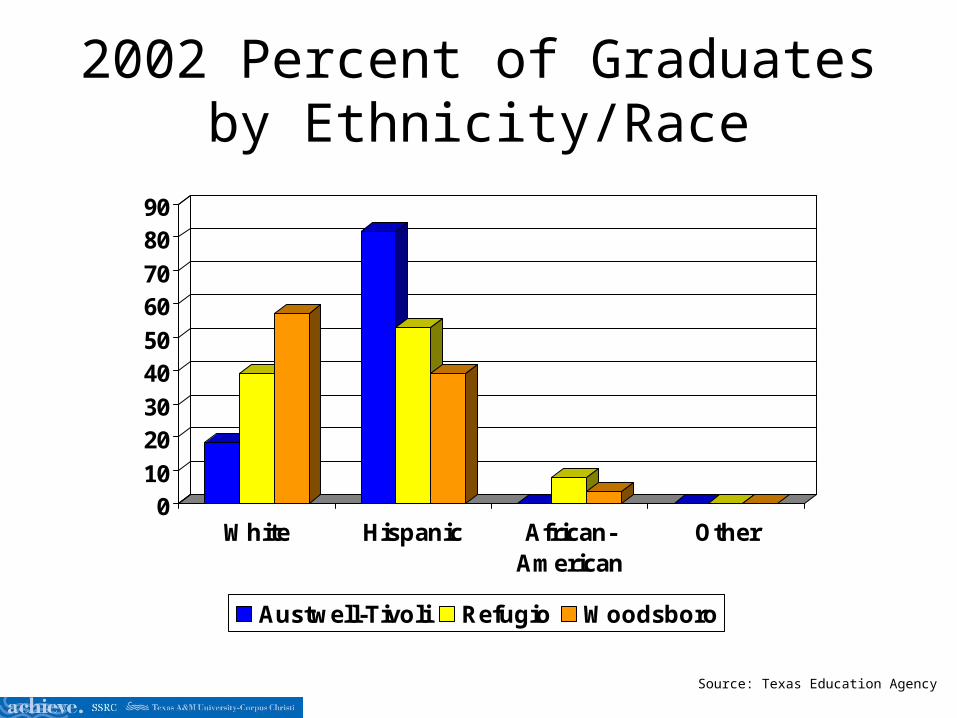
2002 Percent of Graduates by Ethnicity/Race
010
2030
4050
6070
8090
White Hispanic African-American
Other
Austwell-Tivoli Refugio Woodsboro
Source: Texas Education Agency

Educational AttainmentPopulation Age 25 +
0
5
10
15
20
25
30
35
2000 2004
Grade K-8 Grade 9-12 HS Graduate Associates
Bachelor Graduate Degree Some College No Schooling
Source: Demographicsnow

Children Enrolled in CHIP
0
2
4
6
8
10
12
2000 2001 2002 2003 2004
Texas Refugio
Source: KIDSCOUNT

Infants and Children Receiving WIC
05
10
152025303540
4550
2000 2001 2002 2003 2004
Texas Refugio
Source: WIC AUSTIN

% Taking SAT/ACT
01020
304050607080
90100
1999 2000 2001 2002 2003
Texas Refugio
Source: Texas Education Agency
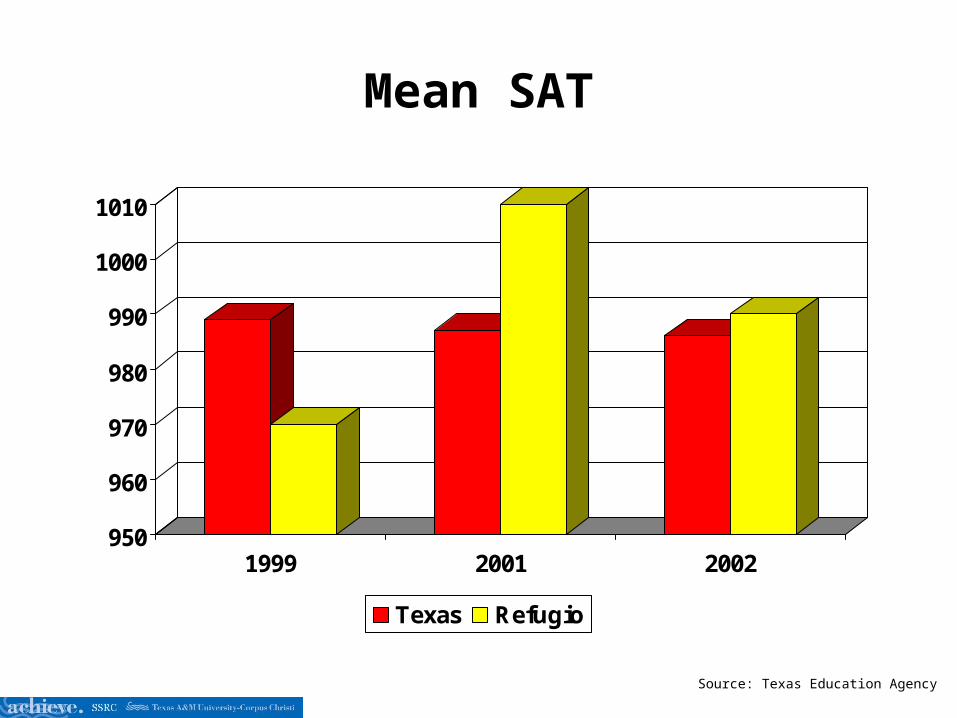
Mean SAT
950
960
970
980
990
1000
1010
1999 2001 2002
Texas Refugio
Source: Texas Education Agency

Mean ACT
16.5
17
17.5
18
18.5
19
19.5
20
20.5
1999 2000 2001 2002 2003
Texas Refugio
Source: Texas Education Agency

At/Above Criterion
0
5
10
15
20
25
30
1999 2000 2001 2002 2003
Texas Refugio
Source: Texas Education Agency

Divorce Rate
0
0.5
1
1.5
2
2.5
3
3.5
4
2000 2001 2002 2003
Texas Refugio
Per
1,0
00 to
tal p
opul
atio
n
Source: Texas Vital Stat

% of Children in Head Start Program ages 3 and 4
0
5
10
15
20
25
30
35
40
45
2000 2001 2002
Texas Refugio
Source: KIDSCOUNT
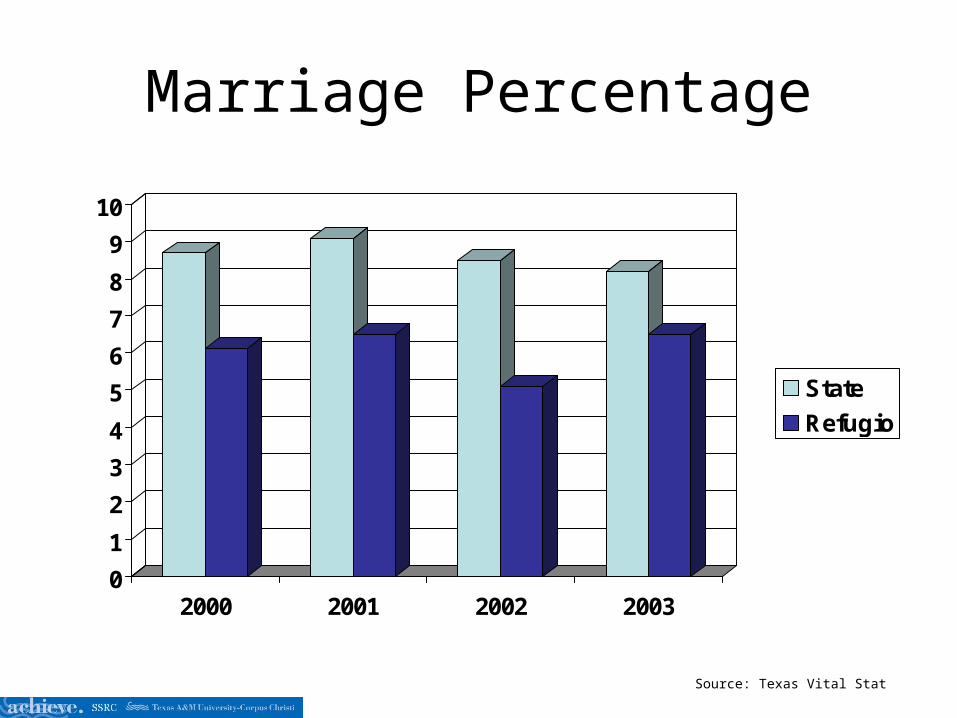
Marriage Percentage
0
1
2
3
4
5
6
7
8
9
10
2000 2001 2002 2003
State
Refugio
Source: Texas Vital Stat
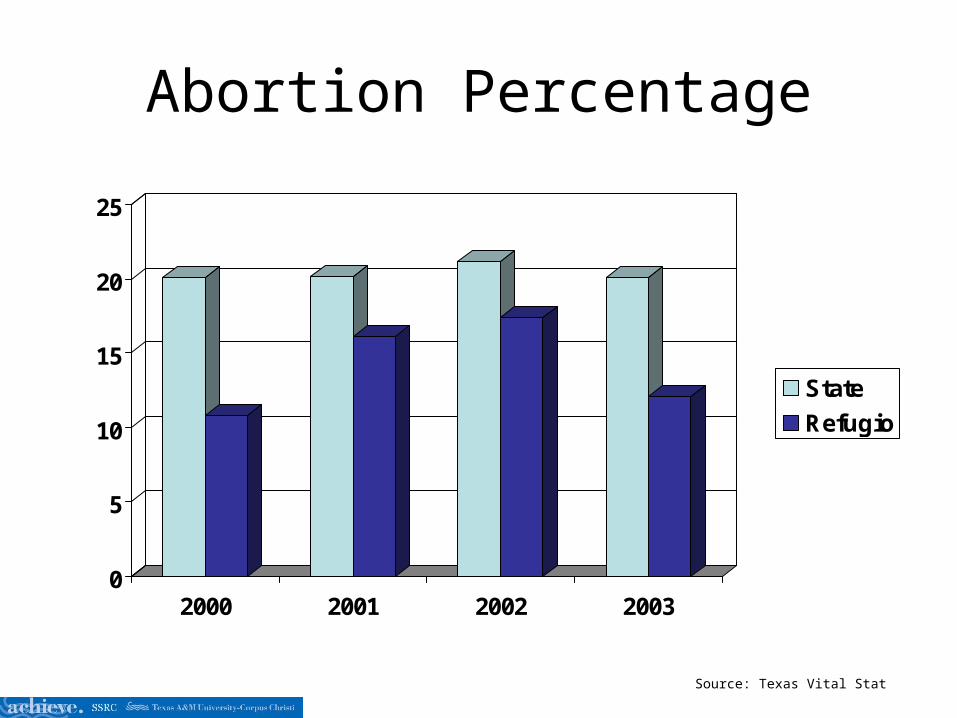
Abortion Percentage
0
5
10
15
20
25
2000 2001 2002 2003
State
Refugio
Source: Texas Vital Stat

HIV per 1,000
Source: Texas Vital Stat
0
0.1
0.2
0.3
0.4
0.5
0.6
0.7
0.8
0.9
2000 2001 2002 2003
State
Refugio

AIDS per 1,000
0
0.5
1
1.5
2
2.5
3
3.5
2000 2001 2002 2003
State
Refugio
Source: Texas Vital Stat