Survey of New York State Deer Hunters Following the 2009 Hunting Season

2000
Deer Hunter Survey Summary Statistics
Tom Paul Tom B Straugh
Division of Wildlife Conservation Region 1 - Southeast Alaska
Grant W-27-2
1 July 2000– 30 June 2001
August 2000 – January 2001 Hunting season
June 2001


i
2001 Deer Hunter Survey
Summary Statistics
August 2000 – January 2001 season (We include reported Unit 4 harvest data from January and doe harvest data from Prince of Wales Island in our survey
even though those are federal hunting seasons.)
INTRODUCTION, METHODS, AND ANALYSIS This is a report of the results of an annual deer hunter mail survey conducted by the Alaska Department of Fish and Game, Division of Wildlife Conservation. The survey was mailed to a sample of hunters who obtained deer harvest tickets throughout Southeast Alaska during the 2000 hunting season. We have conducted the survey since 1980 to quantify the Sitka black-tailed deer harvest in Southeast Alaska. Results of the survey contribute to management decisions and recommendations made by Region I wildlife biologists to the Board of Game. They are also used by the U.S. Forest Service to help determine how logging and other land management decisions affect deer hunting. The Federal Regional Subsistence Council and Federal Subsistence Board use these survey results when deliberating federal subsistence hunting regulation changes. Form – The 2000 season survey form was identical to that of the previous year. As with all surveys since 1996 we did not provide a map with the survey for hunters to use in reporting their hunting sites. Instead we asked hunters to be specific in describing the locations (islands, bays, shore and/or drainages) where they hunted deer. For the fourth year we also asked if hunters participated in the state “proxy” or federal “designated hunter” programs and the number of deer they took for others under those programs. Distribution – Not every hunter received a survey and not everyone who received one responded. Approximately 30% of the deer hunters residing in Southeast Alaska who obtained deer harvest tickets were sent surveys. Response – The overall response rate of those who received surveys was 61%. Because response rates varied by community, the responses received from each community were multiplied by an expansion factor to calculate estimates for hunters possessing deer harvest tickets in the community. The higher the sample fraction and percentage of responses from a community, the lower the expansion factor. And, the higher a community's response rate, the better these data represent actual hunting effort and success of all hunters with deer harvest tickets in that community. This year's overall response rate was the highest since we began mail surveys in 1980. Although the continued good overall response rate is encouraging, annual response rates from many small communities, such as Angoon, Coffman Cove, Hoonah, Hydaburg, Kake, Klawock, Metlakatla, Meyers Chuck, Pelican, Naukati Bay, Port Alexander, and Whitestone Camp are too low. The continued low response rates from many rural areas reduce our confidence in the ability of the survey to accurately describe actual deer hunting effort and success in parts of Southeast Alaska. Response from Ketchikan and Sitka has also been below the regional average for the past few years. Kill location – Along with an increased survey response rate, the percentage of hunters who described kill location specifically enough for us to assign it to a Game Management Unit (GMU), island, major hunt area, or Wildlife Analysis Area (WAA) was the same as last year. When kill location was not identified specifically enough to assign to a GMU, island, major hunt area, or WAA, we report them as "unknown" or "missing" in the summary. In the past, when hunters were provided a map to code hunt locations, 99% of responding hunters reported hunt locations down to the scale of WAA. In the 2000 survey, without a map, the percentage of hunters who gave detailed enough information for us to code hunt locations to GMUs was 99.7%. For coding to islands it was 99%. The percentage giving enough detail to code to major hunt areas remained 98%; the percentage of those providing sufficient information for coding to WAAs remained 97% in 2000. Results – Results this year were significantly different from previous years’ in regard to harvest and hunting activity on Prince of Wales Island (POW). In the 2000 season, we estimate a POW harvest about 15% higher than the past 10 years’ average with 300 more POW hunters than in previous years. Almost all of this increase can be attributed to a 42% increase in the number of hunters reported from the community of Craig. Whether this represents an actual increase in the number of Craig hunters or more complete information on the number of deer harvest tickets issued by license and harvest ticket vendors is unknown. If the latter, hunter and harvest numbers for areas hunted by Craig residents have likely been underestimated in recent years. Total deer harvest for the 2000 season is estimated to be 10,547, a decrease of about 470 (4%) from the previous season and 2200 (18%) less than the average for the previous 19 years. Hunter numbers of 7981 were slightly higher than last year and slightly lower than the long term average of 8120. The average hunter spent 5.8 days hunting this year, near the long-term average of 6 days. Hunters bagged a deer every 4.4 days afield, less often than the long-term average of 3.8. The total number of hunter days afield (46,000) increased for the third straight year but remains 5% below the long-term average. Hunters’ success rate declined to 58% in 2000, 4% below the long-term average. The average number of deer killed per hunter was 1.3, slightly less than the long-term average of 1.6. Regionwide, 42% of the deer harvest was taken by hunters using highway vehicles or ATVs. That is up from the 36% using motorized road vehicles in 1999 and just 31% in 1998. The percentage of deer harvested by boat hunters declined from 53% in 1999 to 48% in 2000. This trend toward road vehicle harvest is fueled by the increasing harvest in recent years from roaded areas in GMU 2, primarily Prince of Wales Island, while harvest in mostly boat-accessible areas of GMU 4 has been declining. Hunters using airplanes took 8% of deer in 2000 the same as the previous 2 years. The lower regional harvest total may be due to multiple factors. Hunter success and days afield may have been reduced by unusually mild fall and early winter weather which allowed deer to remain at higher elevations and more dispersed throughout the 2000 hunting season. Apparent lower deer densities in some areas of southern Southeast may also be responsible for lower deer harvests.

ii
Several hunters reported harvesting large numbers of deer, mostly does, during very short time periods. For instance, one respondent reported taking 20 does in one day of hunting and a total of 38 deer in 4 days. Although such an achievement is possible, it is extremely unlikely and cannot properly be expanded to the hunting population as a whole. Consequently, the responses of these “statistical outliers” (those reporting more than 4 deer taken per day) were not included in the data analyzed for survey results. Even though the survey asks hunters to report only deer they killed themselves, some hunters may have been reporting deer seen while hunting or total deer killed by the party they hunted with. Proxy and designated hunters – The number of hunters reporting as state “proxy” or federal “designated” hunters was slightly fewer in 2000 than in 1999. However, they reported taking almost 25% more deer and had a higher success rate. We estimate 191 state proxy hunters from 13 communities took a total of 287 deer with a 64% success rate in 2000. That compares with about 197 hunters, 233 deer and a 54% success rate in 1999. Year 2000 reporting proxy hunters came from the following Southeast communities: Angoon, Craig, Game Creek, Haines, Hollis, Hoonah, Juneau, Ketchikan, Klawock, Meyers Chuck, Petersburg, Sitka, and Wrangell. We estimate about 196 federal designated hunters from 10 communities took 397 deer with a 77% success rate. That compares with 215 hunters from 9 communities reporting 321 deer and a 56% success rate in 1999. Year 2000 reporting designated hunters came from the following Southeast communities: Craig, Gustavus, Haines, Hoonah, Juneau, Ketchikan, Petersburg, Sitka, Thorne Bay, and Wrangell. Weather - Weather during the 2000 Southeast Alaska deer hunting season was warm and wetter than normal but not as inclement as the previous year. Snowfall was unusually light, well below normal at low elevations but near normal at high elevations throughout the winter. Snow cover was restricted to high elevations through January, which likely depressed harvest even for late season subsistence hunters. Anecdotal comments from some hunters in northern Southeast suggest that fewer hunters than usual went afield after Thanksgiving. Many were waiting for “a big snow” to drive deer to lower elevations. Only 14% of the season’s total harvest in GMU 4 came in December whereas December harvest in the unit usually averages about 20%. In GMU 1C, December 2000 harvest was 12% of the season total compared to 20% the previous year. Because of the lack of persistent snow cover at low elevations, the winter of 2000/01 can be described as very mild in terms of its probable effects on the deer population. Pellet-group surveys completed after the hunting season in spring 2001 found deer densities higher in northern and central Southeast Alaska, showing some evidence of rebounding from the effects of the severe winter of 1998/99. Pellet-group densities in southern Southeast on the other hand were notably lower especially on Prince of Wales Island and the Cleveland Peninsula. Because we have had two consecutive years of mild winter weather, it is not clear what factors are responsible for the decline in southern Southeast. Results by Game Management Unit GMU 1A (Revillagigedo and Gravina islands, Cleveland Peninsula, and Misty Fjords mainland) – Estimated total unit harvest of 267 was slightly lower than last year and less than half the long-term average for the unit (580). The overall hunter success rate for GMU 1A was only 26%, considerably below the regional rate of 58%. Gravina Island hunter numbers and harvest were similar to 1999 and only about 25% of the long-term average for the island. Reported hunter success rate on Gravina was again only 13%, far lower than anywhere else in Region I except the mainland, and hunters spent 18 days afield for every deer taken. The decline in the Cleveland Peninsula harvest from 59 deer in 1999 to 11 deer in 2000 was the fifth year of declining harvest in the past 6. Deer were reported taken only at Vixen Inlet and Port Stewart areas. Pellet-group surveys in spring 2001 indicate the deer densities in drainages on the east side of the Cleveland remain very low and are only 25–30% of what they were a decade ago. The hunter kill was only 8% of the previous 10 years’ average (140). Number of hunters using Revilla Island declined for the second consecutive year but reported hunter days increased, as did the hunter success rate (27%), and the harvest was up by 9% from the previous year. Revilla hunters still spent 14 days afield for every deer taken, however. Boosting that statistic was the futility reported by those using highway vehicles who spent 36 days afield for each deer bagged. Boat hunters fared better spending 10 days afield per deer. Only 21% of Revilla’s deer harvest came from road-based hunting. GMU 2 (Prince of Wales and neighboring islands) – Harvest on Prince of Wales (POW) is estimated at 2770 deer, 15% higher than the long-term average. Reported harvest of does (231) was slightly higher than the previous season and the highest annual reported doe harvest. Hunter days on POW totalled 13,160, increasing for the second consecutive year. Craig and Hollis hunters’ reported harvests were over 300 deer more than last year and those communities accounted for most of the reported harvest increase on POW. The increases were also reflected in areas most hunted by people from those communities, central and northcentral POW. The area in which Ketchikan hunters expended the most effort and reaped their highest harvest also shifted from northern POW in 1999 to central and northcentral in 2000. As a result, reported harvest in the Craig/Klawock/Thorne Bay area of central POW increased significantly for the third straight year to 1254. Northcentral POW (Staney Creek – Coffman Cove) was up slightly. Harvest was slightly higher than 1999 on northeast POW and slightly lower on northwest POW. Ketchikan hunters’ share of the reported deer kill on POW was 26%, equal to the average of the past 3 years. Because of higher reported harvest from Craig, Klawock, Hydaburg, and Ketchikan, harvest on southwest POW more than doubled (112) the 1999 total. In southeast POW, reported harvest dropped slightly from 120 to 107 deer. The number of hunters (2150) on POW was 17% (220) higher than the previous year. The success rate remained stable at 63% and hunters spent an average of 6 days in the field, one less than in 1999. 77% of the harvest in GMU 2 comes from hunters using highway vehicles or ATVs as their main mode of transport compared to 42% for the entire region. On Heceta Island, 54 deer were reported taken continuing the trend of declining harvest begun the previous year. Hunter success was very high, however, with 100% of hunters reporting killing a deer, taking an average of 2 per hunter, and spending only 2 days afield for each deer taken. Harvest was higher on other Unit 2 islands compared to 1999 including, Dall and Long islands, Suemez Island, the “Outer” islands (including Noyes, Baker, and Lulu), and Tuxekan and other islands of Sea Otter Sound. GMU 1B and 3 (central mainland and islands) – Deer harvest on the central mainland (GMU 1B) in 2000 was half of what it was in 1999. The total of 44

iii
deer was also half the long-term average. All harvest reported came from the Thomas Bay area. The GMU 3 harvest of 1060 deer was 30% higher than the average since 1993 when all of Unit 3 was open for deer hunting. In Unit 3, the Zarembo Island harvest of 430 was the highest ever and again supplied about half of Wrangell hunters’ total harvest for the year. The Wrangell Island harvest topped 100 for only the second time since the 1980s. Harvest on Mitkof Island (169) was up 25 deer from the previous season and also 25 more than the long-term average for the island. The kill on Kupreanof Island (249) was slightly lower than the previous season but for the first time provided more deer for Petersburg residents than Mitkof Island. Since hunting was resumed on Kupreanof in 1993 the annual average harvest has risen to over 200 deer. The percent of the harvest in GMU 3 that comes from hunters using highway vehicles or ATVs as their main mode of transport remained above 50% for the third consecutive year. GMU 1C (northern mainland, Douglas, Shelter, and Lincoln islands) – Estimated harvest on Douglas Island was 153 deer, lowest since the early 1980s and the fourth straight season decline. Percentage of bucks in the harvest was 67%; an increase over the previous year’s 58%. The estimated number of hunters and hunter days dropped for the second year to 616 (4% decline) and 1661 (8% decline) respectively. Because of its proximity to Juneau hunters and having road access to about half the island, Douglas is consistently the most heavily hunted island per square mile in Southeast Alaska. It ranks seventh in number of reported hunter days per island behind the much larger islands Prince of Wales, Chichagof, Admiralty, Baranof, Revillagigedo, and Zarembo. Douglas’ hunter success rate of 19% was second lowest of all islands, bettering only Gravina (13%). Douglas hunters spent 11 days afield for each deer harvested, 4 more than 1999. Only hunters on Gravina (18), Wrangell (13), and Revillagigedo (11.5) spent more days afield per deer. The percentage of the harvest on Douglas by hunters using highway vehicles as their main mode of transport continued to decline to 46% from a high of 70% in 1998. This suggests hunters are having less success in the road-accessible areas of the island. Lack of late season snow may have influenced hunter success by allowing deer to remain farther from the mostly low-elevation road system. Spring 2001 surveys found relatively low but stable pellet-group density on the north (roaded) side of Douglas Island. Harvest on Shelter and Lincoln islands was about the same as 1999 and slightly lower than that of the previous two seasons. Percentage of does taken from those islands declined from the previous year to a more desirable 29% of the harvest. Spring 2001 pellet-group surveys indicated Shelter Island had the second highest deer density of all areas sampled in Southeast Alaska this year. GMU 4 (ABC and neighboring islands) – Estimated harvest was down 13% for the unit compared to 1999 and 30% below the long-term average. Admiralty and Kruzof islands’ harvests were similar to last years’. The Kruzof harvest of 335 was slightly higher than the long-term average for the island. Baranof and Chichagof islands’ harvests were down about 20% from the previous year. Yakobi Island harvest was up. The Chichagof/Yakobi kill was an estimated 2205, an decrease of about 17% (466 deer) from 1999. That is 500 deer, or 20%, below the long-term average. Yakobi Island harvest at 65 deer was more than double last year’s total. Most of the decrease in Chichagof Island harvest came from the Peril Straits area, Ushk Bay/Hoonah Sound to Sitkoh Bay on south Chichagof where harvest (315 deer) was only 40% of 1999. Lower harvest was also reported on west and north Chichagof Island, but harvest on the Northeast Chichagof road system and the south shore of Tenakee Inlet increased. Although the number of hunters on Chichagof/Yakobi was the same as the previous year, hunter days increased 13%. Most of that increase was due to Hoonah hunters who reported 1,000 more days afield on Chichagof than last season, an 80% increase. Hoonah hunters reported 28% more deer taken on Chichagof with 72% of that harvest coming from the road system on Northeast Chichagof. A hundred more Juneau hunters reported hunting Chichagof/Yakobi this season, but they spent the same number of days afield and took the same number of deer (660) as in 1999. For the second straight year the estimated Baranof Island harvest was almost 20% lower than the previous season. The harvest of 1583 deer was 32% below the long-term average. Lower harvests were reported in Peril Strait (where harvest was half of 1999) and southwest Baranof. Harvest around Sitka Sound and northeast Baranof was slightly higher than last season. A hundred more hunters spent 1,000 more hunter days on Baranof in 2000 than in 1999 and killed almost 400 fewer deer. As a result, hunters spent over 3 days afield for every deer bagged compared to 2 days per deer in 1999. Sitka hunters reported taking about 1,000 fewer deer in 2000 than their annual average, a decrease of 30%. Greatest decline came in the Chichagof Island harvest where they reported 750 fewer deer from Peril Strait and West Chichagof. Mild weather may have enabled deer to keep well inland from the beaches in those areas and less accessible to hunters. Admiralty Island’s 2000 harvest of 1696 deer was nearly identical to 1999’s harvest and 30% lower than the 10-year average. Hunter numbers (1350) were similar to the previous year and the 3.3 days per deer average in 2000 for each deer killed was also similar to 1999. Not all areas remained unchanged. Harvest on north Admiralty was slightly higher than 1999, whereas west Admiralty harvest was down about 20%. In the Gambier-Pybus-Eliza area of south Admiralty and in Seymour Canal harvest equaled the 1999 totals. Spring 2001 pellet group surveys in GMU 4 found densities varied compared to previous years in the areas surveyed – north Chichagof and Yakobi Island higher, west Chichagof slightly lower, northwest Baranof and north Kruzof stable. During deer mortality transects in spring 2001 no carcasses were found along 5 one-mile transects on beaches in Sitka Sound and Peril Strait. In addition during the transects, a large number of deer, all appearing to be in excellent physical condition, were seen on the beaches. Outlook – In northern Southeast Alaska, thanks to two consecutive mild winters in 1999/00 and 2000/01, deer numbers appear to be rebounding somewhat from the effects of the severe 1998/99 winter. Hunters should encounter plenty of deer during the 2001 season. Spring 2001 pellet-group surveys suggest deer numbers are stable in central Southeast but lower in the south. Hunters on Prince of Wales Island had good success last season but elsewhere in southern Southeast harvest was down. Despite biologists’ field observations of abundant deer on Prince of Wales Island, pellet-group surveys indicate declining deer densities in six of the seven drainages surveyed. Until we know more about the reasons for low and declining deer pellet-group densities in most areas of southern Southeast despite the mild winters, it is difficult to predict the hunting outlook. Based on our current information, it appears hunters may continue to have low success rates in many areas of southern Southeast Alaska during the 2001 season.

iv

v
2000-2001 Southeast Deer Survey Table of Contents
Estimated Totals for Region I..................................................................................................1
Estimated Totals for Month of Kill .......................................................................................... 2
Estimated Totals for Transportation Type ............................................................................. 3
Estimated Totals by Community of Residence ..................................................................... 4
Estimated Totals by Game Management Unit of Residence ................................................ 5
Estimated Totals for Game Management Unit ....................................................................... 6
Estimated Totals for Month of Kill by GMU............................................................................ 7
Estimated Totals for Transportation Type by GMU............................................................... 9
Estimated Totals for GMU by Community of Residence .................................................... 11
Estimated Totals for Community of Residence by GMU .................................................... 13
Estimated Totals by Island .................................................................................................... 17
Estimated Totals for Island by Community of Residence .................................................. 18
Estimated Totals for Community of Residence by Island .................................................. 22
Estimated Totals by Major Hunt Area................................................................................... 26
Estimated Totals for Major by Community of Residence ................................................... 27
Estimated Totals for Community of Residence by Major ................................................... 33
Estimated Totals by Wildlife Analysis Area ......................................................................... 38
Estimated Totals for WAA by Community of Residence .................................................... 40
Estimated Totals for Community of Residence by WAA .................................................... 52
Estimated Totals for Proxy Hunters by Community of Residence .................................... 60
Estimated Totals for Federal "Designated" Hunters by Comm. Res. ................................ 61
Final Survey Statistics ........................................................................................................... 62
Appendices................................................................................... Error! Bookmark not defined.


Page 1
2000-2001 Southeast Deer Survey Estimated Totals for Region I
Number Percent Total Average Average Number of of Number Number Deer Deer/ Average Average of Suc. Hunters of Days Number Number of per Successful Days/ Days/ Hunters Hunters Suc. Hunted of Bucks of Does Deer Hunter Hunter Hunter Deer _______ _______ _______ _______ ________ _______ _______ _______ __________ _______ _______ 7981 4643 58.2 45990 8779 1768 10547 1.3 2.3 5.8 4.4

Page 2
2000-2001 Southeast Deer Survey Estimated Totals for Month of Kill
Total Number of Number Number Number Number Percent Average Number of Hunters of Days of of of Percent Kill Days per Month of Kill Hunters Successful Hunted Bucks Does Deer Bucks by Month Deer _____________ __________ __________ __________ ______ ______ _______ _______ ________ __________
August, 2000 1481 939 5315 1373 125 1498 92% 14% 3.5
September, 2000 1388 627 6658 943 190 1134 83% 11% 5.9
October, 2000 2445 1303 12595 2151 430 2580 83% 24% 4.9
November, 2000 2299 1403 14224 3056 548 3604 85% 34% 3.9
December, 2000 775 323 4716 718 279 997 72% 9% 4.7
January, 2001 80 44 551 88 77 165 53% 2% 3.3
February, 2001 26 0 62 0 0 0 . 0% .0
March, 2001 13 13 30 26 0 26 100% 0% 1.2
April, 2001 5 0 54 0 0 0 . 0% .0
May, 2001 5 5 39 11 5 16 67% 0% 2.4
June, 2001 33 12 238 17 11 28 62% 0% 8.5
Blank/Missing 298 191 1507 395 103 498 79% 4% 3.0
--------------------------------------------------------------------------------------------------------------------------------------------------------------------------------------------------------- TOTAL 8848 4861 45990 8779 1768 10547 83% 100% 4.4
Page 3
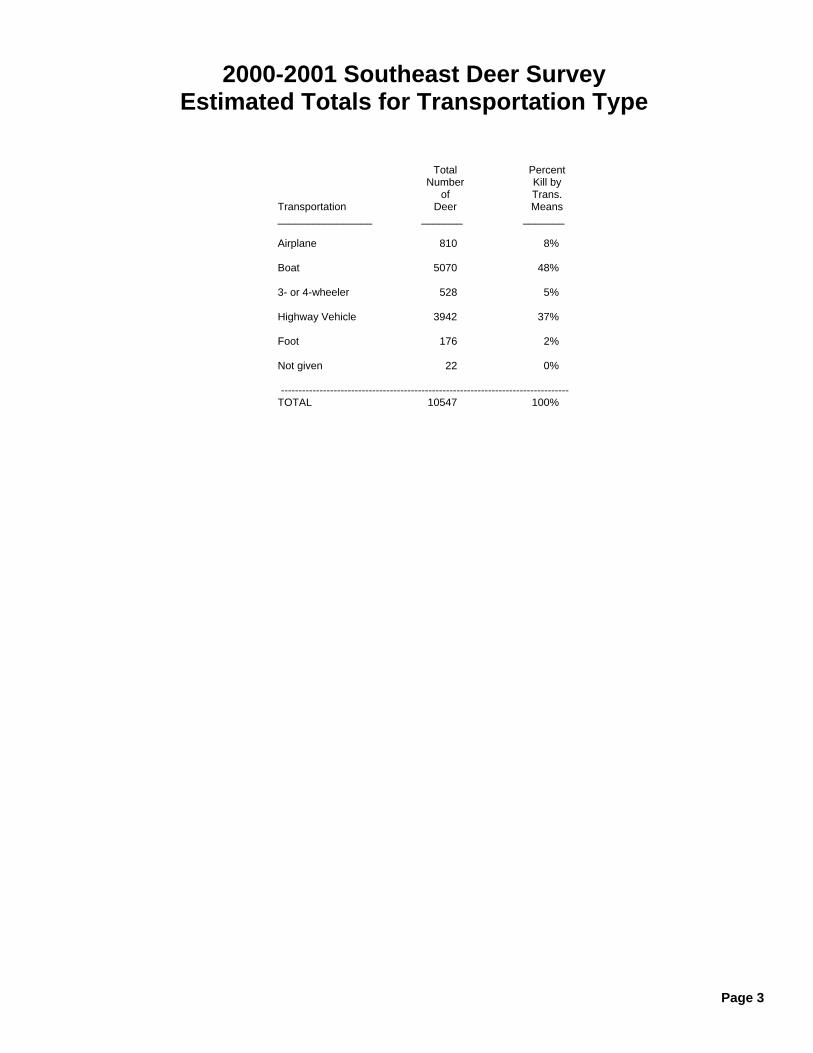
2000-2001 Southeast Deer Survey Estimated Totals for Transportation Type
Total Percent Number Kill by of Trans. Transportation Deer Means ________________ _______ _______ Airplane 810 8% Boat 5070 48% 3- or 4-wheeler 528 5% Highway Vehicle 3942 37% Foot 176 2% Not given 22 0% ----------------------------------------------------------------------------------
TOTAL 10547 100%
Page 4
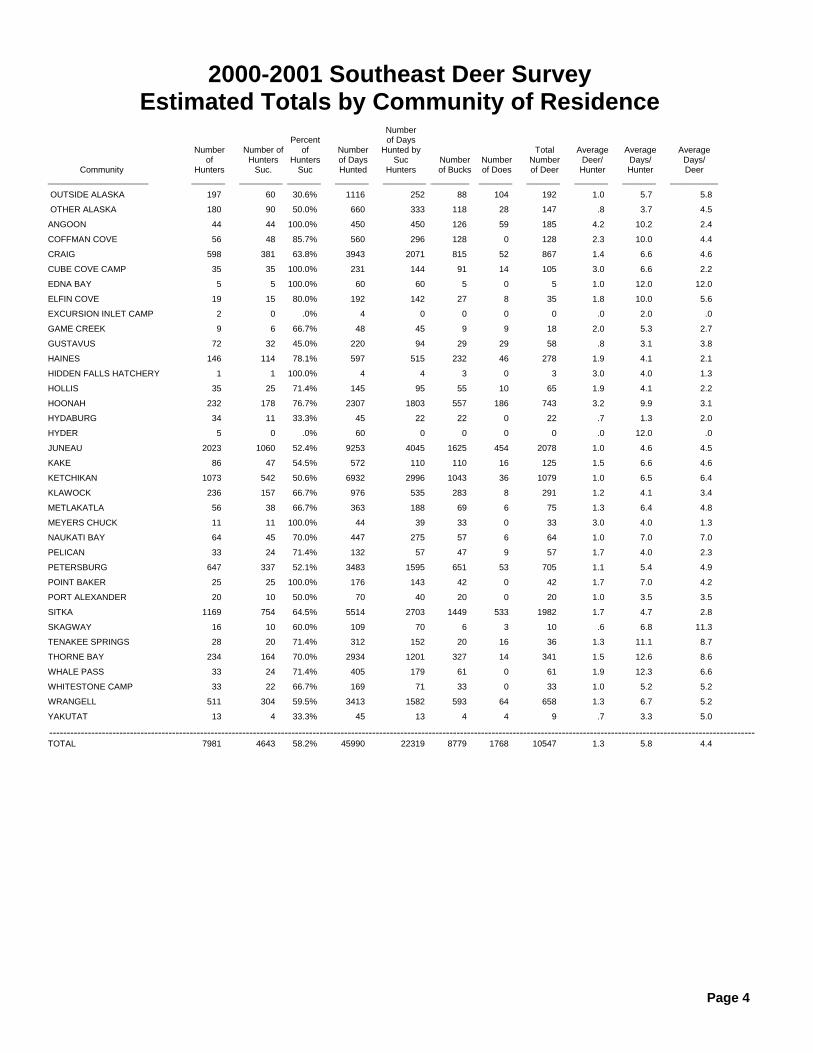
2000-2001 Southeast Deer Survey Estimated Totals by Community of Residence
Number Percent of Days Number Number of of Number Hunted by Total Average Average Average of Hunters Hunters of Days Suc Number Number Number Deer/ Days/ Days/ Community Hunters Suc. Suc Hunted Hunters of Bucks of Does of Deer Hunter Hunter Deer _____________________ _______ _________ _______ _______ _________ ________ _______ _______ _______ _______ __________
OUTSIDE ALASKA 197 60 30.6% 1116 252 88 104 192 1.0 5.7 5.8
OTHER ALASKA 180 90 50.0% 660 333 118 28 147 .8 3.7 4.5
ANGOON 44 44 100.0% 450 450 126 59 185 4.2 10.2 2.4
COFFMAN COVE 56 48 85.7% 560 296 128 0 128 2.3 10.0 4.4
CRAIG 598 381 63.8% 3943 2071 815 52 867 1.4 6.6 4.6
CUBE COVE CAMP 35 35 100.0% 231 144 91 14 105 3.0 6.6 2.2
EDNA BAY 5 5 100.0% 60 60 5 0 5 1.0 12.0 12.0
ELFIN COVE 19 15 80.0% 192 142 27 8 35 1.8 10.0 5.6
EXCURSION INLET CAMP 2 0 .0% 4 0 0 0 0 .0 2.0 .0
GAME CREEK 9 6 66.7% 48 45 9 9 18 2.0 5.3 2.7
GUSTAVUS 72 32 45.0% 220 94 29 29 58 .8 3.1 3.8
HAINES 146 114 78.1% 597 515 232 46 278 1.9 4.1 2.1
HIDDEN FALLS HATCHERY 1 1 100.0% 4 4 3 0 3 3.0 4.0 1.3
HOLLIS 35 25 71.4% 145 95 55 10 65 1.9 4.1 2.2
HOONAH 232 178 76.7% 2307 1803 557 186 743 3.2 9.9 3.1
HYDABURG 34 11 33.3% 45 22 22 0 22 .7 1.3 2.0
HYDER 5 0 .0% 60 0 0 0 0 .0 12.0 .0
JUNEAU 2023 1060 52.4% 9253 4045 1625 454 2078 1.0 4.6 4.5
KAKE 86 47 54.5% 572 110 110 16 125 1.5 6.6 4.6
KETCHIKAN 1073 542 50.6% 6932 2996 1043 36 1079 1.0 6.5 6.4
KLAWOCK 236 157 66.7% 976 535 283 8 291 1.2 4.1 3.4
METLAKATLA 56 38 66.7% 363 188 69 6 75 1.3 6.4 4.8
MEYERS CHUCK 11 11 100.0% 44 39 33 0 33 3.0 4.0 1.3
NAUKATI BAY 64 45 70.0% 447 275 57 6 64 1.0 7.0 7.0
PELICAN 33 24 71.4% 132 57 47 9 57 1.7 4.0 2.3
PETERSBURG 647 337 52.1% 3483 1595 651 53 705 1.1 5.4 4.9
POINT BAKER 25 25 100.0% 176 143 42 0 42 1.7 7.0 4.2
PORT ALEXANDER 20 10 50.0% 70 40 20 0 20 1.0 3.5 3.5
SITKA 1169 754 64.5% 5514 2703 1449 533 1982 1.7 4.7 2.8
SKAGWAY 16 10 60.0% 109 70 6 3 10 .6 6.8 11.3
TENAKEE SPRINGS 28 20 71.4% 312 152 20 16 36 1.3 11.1 8.7
THORNE BAY 234 164 70.0% 2934 1201 327 14 341 1.5 12.6 8.6
WHALE PASS 33 24 71.4% 405 179 61 0 61 1.9 12.3 6.6
WHITESTONE CAMP 33 22 66.7% 169 71 33 0 33 1.0 5.2 5.2
WRANGELL 511 304 59.5% 3413 1582 593 64 658 1.3 6.7 5.2
YAKUTAT 13 4 33.3% 45 13 4 4 9 .7 3.3 5.0
--------------------------------------------------------------------------------------------------------------------------------------------------------------------------------------------------------- TOTAL 7981 4643 58.2% 45990 22319 8779 1768 10547 1.3 5.8 4.4

Page 5
2000-2001 Southeast Deer Survey Estimated Totals by GMU of Residence
Number Percent of Days Total Number Number of Number Hunted Number Average Average Average of of Suc. Hunters of Days by Suc. Number Number of Deer/ Days/ Days/ GMUR Hunters Hunters Suc. Hunted Hunters of Bucks of Does Deer Hunter Hunter Deer ______________ _______ _______ _______ _______ _________ ________ _______ _______ _______ _______ __________ OUTSIDE ALASKA 197 60 30.6% 1116 252 88 104 192 1.0 5.7 5.8
OTHER ALASKA 180 90 50.0% 660 333 118 28 147 .8 3.7 4.5
GMU 1A 1145 591 51.6% 7398 3222 1145 42 1187 1.0 6.5 6.2
GMU 1C 2097 1092 52.1% 9476 4139 1653 482 2136 1.0 4.5 4.4
GMU 1D 162 123 76.3% 706 585 239 49 287 1.8 4.4 2.5
GMU 2 1319 885 67.1% 9692 4877 1796 90 1886 1.4 7.3 5.1
GMU 3 1244 687 55.3% 7468 3287 1354 133 1488 1.2 6.0 5.0
GMU 4 1623 1109 68.3% 9429 5611 2381 834 3215 2.0 5.8 2.9
GMU 5A 13 4 33.3% 45 13 4 4 9 .7 3.3 5.0
--------------------------------------------------------------------------------------------------------------------------------------------------------------------------------------------------------- TOTAL 7981 4643 58.2% 45990 22319 8779 1768 10547 1.3 5.8 4.4

Page 6
2000-2001 Southeast Deer Survey Estimated Totals for Game Management Unit
Total
Number of Number Number Number Number Average Average
Number of Hunters of Days of of of Percent Deer/ Days/
GMU Hunters Successful Hunted Bucks Does Deer Bucks Hunter Deer
______________ __________ __________ __________ ______ ______ _______ _______ __________ __________
GMU 1A 636 164 3684 261 6 267 98% .4 13.8
GMU 1B 156 36 555 44 0 44 100% .3 12.5
GMU 1C 803 186 2279 172 69 241 71% .3 9.4
GMU 2 2231 1419 13865 2792 231 3023 92% 1.4 4.6
GMU 3 1220 603 6508 984 36 1020 96% .8 6.4
GMU 4 3765 2421 18641 4485 1420 5905 76% 1.6 3.2
GMU 5A 4 0 9 0 0 0 . .0 .0
UNKNOWN 33 33 449 40 5 46 88% 1.4 9.8
--------------------------------------------------------------------------------------------------------------------------------------------------------------------------------------------------------- TOTAL 8848 4861 45990 8779 1768 10547 83% 1.2 4.4

Page 7
2000-2001 Southeast Deer Survey Estimated Totals for Month of Kill by GMU
Total Percent Number of Number Number Number Number Kill Average Number of Hunters of Days of of of Percent in GMU Days per GMU Month of Kill Hunters Successful Hunted Bucks Does Deer Bucks by Month Deer _______ _____________ __________ __________ __________ ______ ______ _______ _______ ________ __________ GMU 1A August, 2000 105 37 216 43 0 43 100% 16% 5.1 September, 2000 145 36 727 42 0 42 100% 16% 17.2 October, 2000 175 42 966 67 6 73 92% 27% 13.3 November, 2000 121 30 852 61 0 61 100% 23% 14.0 December, 2000 54 6 296 25 0 25 100% 9% 11.8 June, 2001 6 0 24 0 0 0 . 0% .0 Blank/Missing 30 12 602 24 0 24 100% 9% 25.0 --------------------------------------------------------------------------------------------------------------------------------------------------------------------------------------------------------- Total 636 164 3684 261 6 267 98% 100% 13.7 GMU 1B August, 2000 28 4 92 9 0 9 100% 20% 10.2 September, 2000 42 4 141 4 0 4 100% 10% 35.3 October, 2000 18 4 129 4 0 4 100% 10% 32.3 November, 2000 60 22 144 27 0 27 100% 60% 5.3 December, 2000 4 0 22 0 0 0 . 0% .0 Blank/Missing 5 0 28 0 0 0 . 0% .0 --------------------------------------------------------------------------------------------------------------------------------------------------------------------------------------------------------- Total 156 36 555 44 0 44 100% 100% 12.6 GMU 1C August, 2000 97 28 167 32 0 32 100% 13% 5.1 September, 2000 102 23 267 28 9 37 75% 15% 7.3 October, 2000 215 51 541 32 28 60 54% 25% 9.0 November, 2000 181 61 647 56 19 75 75% 31% 8.6 December, 2000 153 14 551 19 9 28 67% 12% 19.8 January, 2001 9 5 42 5 0 5 100% 2% 8.4 February, 2001 5 0 9 0 0 0 . 0% .0 June, 2001 9 0 9 0 0 0 . 0% .0 Blank/Missing 32 5 46 0 5 5 0% 2% 9.2 --------------------------------------------------------------------------------------------------------------------------------------------------------------------------------------------------------- Total 803 186 2279 172 69 241 71% 100% 9.4 GMU 2 August, 2000 683 490 3038 733 81 814 90% 27% 3.7 September, 2000 443 213 2811 367 5 372 99% 12% 7.6 October, 2000 533 328 3476 657 59 716 92% 24% 4.9 November, 2000 421 303 3681 884 39 924 96% 31% 4.0 December, 2000 69 29 505 42 46 88 47% 3% 5.7 January, 2001 8 8 8 8 0 8 100% 0% 1.0 February, 2001 5 0 19 0 0 0 . 0% .0 March, 2001 9 9 26 17 0 17 100% 1% 1.5 June, 2001 9 9 173 17 0 17 100% 1% 10.2 Blank/Missing 52 30 128 67 0 67 100% 1% 1.9 --------------------------------------------------------------------------------------------------------------------------------------------------------------------------------------------------------- Total 2231 1419 13865 2792 231 3023 92% 100% 4.6 GMU 3 August, 2000 191 110 633 133 0 133 100% 13% 4.8 September, 2000 217 64 982 91 0 91 100% 9% 10.8 October, 2000 567 274 3103 380 18 398 96% 39% 7.8 November, 2000 193 124 1576 284 18 302 94% 30% 5.2 February, 2001 5 0 9 0 0 0 . 0% .0 Blank/Missing 49 32 205 86 0 86 100% 8% 2.4 --------------------------------------------------------------------------------------------------------------------------------------------------------------------------------------------------------- Total 1220 603 6508 984 36 1020 96% 100% 6.4 GMU 4 August, 2000 377 271 1049 423 44 467 91% 8% 2.2 September, 2000 437 282 1720 401 176 577 69% 10% 3.0 October, 2000 915 581 4116 979 319 1297 75% 22% 3.2 November, 2000 1318 866 7432 1745 472 2216 79% 38% 3.4 December, 2000 494 269 3212 624 223 847 74% 14% 3.8 January, 2001 57 26 460 76 71 147 51% 2% 3.1 February, 2001 12 0 25 0 0 0 . 0% .0 March, 2001 4 4 4 9 0 9 100% 0% .5 April, 2001 5 0 54 0 0 0 . 0% .0 May, 2001 5 5 39 11 5 16 67% 0% 2.4 June, 2001 9 4 31 0 11 11 0% 0% 2.9 Blank/Missing 130 112 499 218 98 316 69% 5% 1.6 --------------------------------------------------------------------------------------------------------------------------------------------------------------------------------------------------------- Total 3765 2421 18641 4485 1420 5905 76% 100% 3.2

Page 8
2000-2001 Southeast Deer Survey Estimated Totals for Month of Kill by GMU
Total Percent Number of Number Number Number Number Kill Average Number of Hunters of Days of of of Percent in GMU Days per GMU Month of Kill Hunters Successful Hunted Bucks Does Deer Bucks by Month Deer _______ _____________ __________ __________ __________ ______ ______ _______ _______ ________ __________ GMU 5A November, 2000 4 0 9 0 0 0 . . .0 --------------------------------------------------------------------------------------------------------------------------------------------------------------------------------------------------------- Total 4 0 9 0 0 0 . . .0 UNKNOWN September, 2000 5 5 9 9 0 9 100% 20% 1.0 October, 2000 23 23 386 31 0 31 100% 68% 12.5 January, 2001 5 5 54 0 5 5 0% 12% 10.8 --------------------------------------------------------------------------------------------------------------------------------------------------------------------------------------------------------- Total 33 33 449 40 5 46 88% 100% 10.0 --------------------------------------------------------------------------------------------------------------------------------------------------------------------------------------------------------- Grand Total 8848 4861 45990 8779 1768 10547 83% 100% 4.4

Page 9
2000-2001 Southeast Deer Survey Estimated Totals for Transportation Type by GMU
Total Percent Number of Number Number Number Number Kill Average Number Hunters of Days of of of in GMU Days/ GMU Transportation of Hunters Successful Hunted Bucks Does Deer by Trans Deer _______ ________________ __________ __________ __________ ______ ______ _______ ________ __________ GMU 1A Airplane 18 6 48 6 0 6 2% 8.0 Boat 419 122 2014 194 0 194 73% 10.4 3- or 4-wheeler 18 12 96 12 6 18 7% 5.3 Highway Vehicle 126 18 1314 37 0 37 14% 35.5 Foot 54 6 211 12 0 12 5% 17.6 --------------------------------------------------------------------------------------------------------------------------------------------------------------------------------------------------------- Total 636 164 3684 261 6 267 100% 13.8 GMU 1B Airplane 6 0 6 0 0 0 0% .0 Boat 141 36 527 44 0 44 100% 12.0 3- or 4-wheeler 9 0 22 0 0 0 0% .0 --------------------------------------------------------------------------------------------------------------------------------------------------------------------------------------------------------- Total 156 36 555 44 0 44 33% 12.6 GMU 1C Airplane 9 0 9 0 0 0 0% .0 Boat 261 89 599 84 28 112 46% 5.4 Highway Vehicle 454 78 1444 69 42 111 46% 13.0 Foot 79 19 227 19 0 19 8% 11.9 --------------------------------------------------------------------------------------------------------------------------------------------------------------------------------------------------------- Total 803 186 2279 172 69 241 25% 9.5 GMU 2 Airplane 91 40 275 69 0 69 2% 4.0 Boat 323 229 1243 517 47 563 19% 2.2 3- or 4-wheeler 44 38 200 69 0 69 2% 2.9 Highway Vehicle 1705 1070 11893 2081 184 2266 75% 5.2 Foot 60 33 244 48 0 48 2% 5.1 Not given 9 9 9 9 0 9 0% 1.0 --------------------------------------------------------------------------------------------------------------------------------------------------------------------------------------------------------- Total 2231 1419 13865 2792 231 3023 17% 4.6 GMU 3 Airplane 21 19 75 19 0 19 2% 3.9 Boat 466 227 1992 405 0 405 40% 4.9 3- or 4-wheeler 89 51 540 142 0 142 14% 3.8 Highway Vehicle 635 296 3585 404 36 440 43% 8.1 Foot 9 9 326 9 0 9 1% 36.2 --------------------------------------------------------------------------------------------------------------------------------------------------------------------------------------------------------- Total 1220 603 6508 984 36 1020 17% 6.4

Page 10
2000-2001 Southeast Deer Survey Estimated Totals for Transportation Type by GMU
Total Percent Number of Number Number Number Number Kill Average Number Hunters of Days of of of in GMU Days/ GMU Transportation of Hunters Successful Hunted Bucks Does Deer by Trans Deer _______ ________________ __________ __________ __________ ______ ______ _______ ________ __________ GMU 4 Airplane 529 352 3070 568 147 716 12% 4.3 Boat 2484 1532 10406 2814 905 3719 63% 2.8 3- or 4-wheeler 73 78 783 216 82 298 5% 2.6 Highway Vehicle 606 434 3904 813 270 1083 18% 3.6 Foot 63 16 424 64 16 80 1% 5.3 Not given 9 9 54 9 0 9 0% 6.0 --------------------------------------------------------------------------------------------------------------------------------------------------------------------------------------------------------- Total 3765 2421 18641 4485 1420 5905 14% 3.2 GMU 5A Boat 4 0 9 0 0 0 . .0 --------------------------------------------------------------------------------------------------------------------------------------------------------------------------------------------------------- Total 4 0 9 0 0 0 . .0 UNKNOWN Boat 23 23 300 27 5 32 70% 9.4 Highway Vehicle 5 5 140 5 0 5 10% 28.0 Foot 5 5 9 9 0 9 20% 1.0 --------------------------------------------------------------------------------------------------------------------------------------------------------------------------------------------------------- Total 33 33 449 40 5 46 33% 9.8 --------------------------------------------------------------------------------------------------------------------------------------------------------------------------------------------------------- Grand Total 8848 4861 45990 8779 1768 10547 15% 4.4

Page 11
2000-2001 Southeast Deer Survey Estimated Totals for GMU by Community of Residence
Total Number of Number Number Number Number Average Average Number Hunters of Days of of of Deer/ Days/ GMU Community of Residence of Hunters Successful Hunted Bucks Does Deer Hunter Deer ______________ ______________________ __________ __________ __________ ______ ______ _______ __________ __________ GMU 1A OUTSIDE ALASKA 5 0 66 0 0 0 .0 .0 OTHER ALASKA 11 0 23 0 0 0 .0 .0 HYDER 3 0 40 0 0 0 .0 .0 KETCHIKAN 567 133 3243 199 6 205 .4 15.8 METLAKATLA 50 31 313 63 0 63 1.3 5.0 --------------------------------------------------------------------------------------------------------------------------------------------------------------------------------------------------------- Total 636 164 3684 261 6 267 .4 13.8 GMU 1B JUNEAU 5 0 5 0 0 0 .0 .0 KETCHIKAN 18 0 24 0 0 0 .0 .0 PETERSBURG 115 31 430 40 0 40 .3 10.8 WRANGELL 18 5 97 5 0 5 .3 19.4 --------------------------------------------------------------------------------------------------------------------------------------------------------------------------------------------------------- Total 156 36 555 44 0 44 .3 12.4 GMU 1C OUTSIDE ALASKA 11 5 44 5 0 5 .5 8.0 OTHER ALASKA 6 0 6 0 0 0 .0 .0 HAINES 14 0 14 0 0 0 .0 .0 JUNEAU 768 176 2189 162 69 231 .3 9.5 PETERSBURG 4 4 27 4 0 4 1.0 6.8 --------------------------------------------------------------------------------------------------------------------------------------------------------------------------------------------------------- Total 803 186 2279 172 69 241 .3 9.5 GMU 2 OUTSIDE ALASKA 115 38 679 38 71 109 1.0 6.2 OTHER ALASKA 34 11 197 28 0 28 .8 7.0 COFFMAN COVE 56 48 392 128 0 128 2.3 3.1 CRAIG 563 364 3735 780 52 832 1.5 4.5 EDNA BAY 5 5 60 5 0 5 1.0 12.0 HAINES 9 5 18 0 5 5 .5 3.6 HOLLIS 35 25 145 55 10 65 1.9 2.2 HYDABURG 34 11 45 22 0 22 .7 2.0 HYDER 3 0 20 0 0 0 .0 .0 JUNEAU 23 23 111 51 0 51 2.2 2.2 KETCHIKAN 621 386 3074 759 12 772 1.2 4.0 KLAWOCK 236 157 976 283 8 291 1.2 3.4 METLAKATLA 6 6 50 6 6 13 2.0 4.0 MEYERS CHUCK 11 11 44 33 0 33 3.0 1.3 NAUKATI BAY 64 45 447 57 6 64 1.0 7.0 PETERSBURG 53 31 230 49 4 53 1.0 4.3 POINT BAKER 17 8 50 8 0 8 .5 6.3 SITKA 11 11 54 22 5 27 2.5 2.0 THORNE BAY 234 164 2910 322 14 336 1.4 8.7 WHALE PASS 33 24 405 61 0 61 1.9 6.6 WRANGELL 69 46 221 83 37 120 1.7 1.8 --------------------------------------------------------------------------------------------------------------------------------------------------------------------------------------------------------- Total 2231 1419 13865 2792 231 3023 1.4 4.6 GMU 3 OUTSIDE ALASKA 5 0 27 0 0 0 .0 .0 OTHER ALASKA 28 6 45 6 0 6 .2 7.5 CRAIG 17 17 52 17 0 17 1.0 3.0 JUNEAU 19 14 65 14 0 14 .8 4.7 KAKE 47 16 454 24 0 24 .5 18.9 KETCHIKAN 60 18 211 24 0 24 .4 8.8 PETERSBURG 527 244 2366 386 18 403 .8 5.9 POINT BAKER 25 25 126 34 0 34 1.3 3.8 SITKA 22 11 135 11 0 11 .5 12.5 THORNE BAY 5 0 5 0 0 0 .0 .0 WRANGELL 465 253 3022 469 18 488 1.0 6.2 --------------------------------------------------------------------------------------------------------------------------------------------------------------------------------------------------------- Total 1220 603 6508 984 36 1020 .8 6.4

Page 12
2000-2001 Southeast Deer Survey Estimated Totals for GMU by Community of Residence
Total Number of Number Number Number Number Average Average Number Hunters of Days of of of Deer/ Days/ GMU Community of Residence of Hunters Successful Hunted Bucks Does Deer Hunter Deer ______________ ______________________ __________ __________ __________ ______ ______ _______ __________ __________ GMU 4 OUTSIDE ALASKA 55 16 301 44 33 77 1.4 3.9 OTHER ALASKA 107 73 378 85 28 113 1.1 3.4 ANGOON 44 44 450 126 59 185 4.2 2.4 CUBE COVE CAMP 35 35 231 91 14 105 3.0 2.2 ELFIN COVE 19 15 192 27 8 35 1.8 5.6 EXCURSION INLET CAMP 2 0 4 0 0 0 .0 .0 GAME CREEK 9 6 48 9 9 18 2.0 2.7 GUSTAVUS 72 32 220 29 29 58 .8 3.8 HAINES 123 109 565 232 41 273 2.2 2.1 HIDDEN FALLS HATCHERY 1 1 4 3 0 3 3.0 1.3 HOONAH 232 178 2276 557 186 743 3.2 3.1 JUNEAU 1569 912 6855 1393 384 1777 1.1 3.9 KAKE 55 39 117 86 16 102 1.9 1.2 KETCHIKAN 54 42 368 60 18 78 1.4 4.7 PELICAN 33 24 132 47 9 57 1.7 2.3 PETERSBURG 102 80 430 173 31 204 2.0 2.1 PORT ALEXANDER 20 10 70 20 0 20 1.0 3.5 SITKA 1142 738 5315 1416 522 1939 1.7 2.7 SKAGWAY 16 10 109 6 3 10 .6 10.9 TENAKEE SPRINGS 24 20 312 20 16 36 1.5 8.7 WHITESTONE CAMP 33 22 169 33 0 33 1.0 5.2 WRANGELL 9 9 60 23 9 32 3.5 1.9 YAKUTAT 9 4 36 4 4 9 1.0 4.0 --------------------------------------------------------------------------------------------------------------------------------------------------------------------------------------------------------- Total 3765 2421 18641 4485 1420 5905 1.6 3.2 GMU 5A YAKUTAT 4 0 9 0 0 0 .0 .0 --------------------------------------------------------------------------------------------------------------------------------------------------------------------------------------------------------- Total 4 0 9 0 0 0 .0 .0 UNKNOWN CRAIG 9 9 365 17 0 17 2.0 21.5 JUNEAU 5 5 28 5 0 5 1.0 5.6 SITKA 5 5 23 0 5 5 1.0 2.0 THORNE BAY 5 5 19 5 0 5 1.0 4.6 WRANGELL 9 9 14 14 0 14 1.5 1.0 --------------------------------------------------------------------------------------------------------------------------------------------------------------------------------------------------------- Total 33 33 449 40 5 46 1.4 9.8 --------------------------------------------------------------------------------------------------------------------------------------------------------------------------------------------------------- Grand Total 8848 4861 45990 8779 1768 10547 1.2 4.4

Page 13
2000-2001 Southeast Deer Survey Estimated Totals for Community of Residence by GMU
Total Number of Number Number Number Number Average Average Number Hunters of Days of of of Deer/ Days/ Community of Residence GMU of Hunters Successful Hunted Bucks Does Deer Hunter Deer ______________________ ______________ __________ __________ __________ ______ ______ _______ __________ __________ OUTSIDE ALASKA GMU 1A 5 0 66 0 0 0 .0 .0 GMU 1C 11 5 44 5 0 5 .5 8.8 GMU 2 115 38 679 38 71 109 1.0 6.2 GMU 3 5 0 27 0 0 0 .0 .0 GMU 4 55 16 301 44 33 77 1.4 3.9 --------------------------------------------------------------------------------------------------------------------------------------------------------------------------------------------------------- Total 192 60 1116 88 104 192 1.0 5.8 OTHER ALASKA GMU 1A 11 0 23 0 0 0 .0 .0 GMU 1C 6 0 6 0 0 0 .0 .0 GMU 2 34 11 197 28 0 28 .8 7.0 GMU 3 28 6 45 6 0 6 .2 7.5 GMU 4 107 73 389 85 28 113 1.1 3.4 --------------------------------------------------------------------------------------------------------------------------------------------------------------------------------------------------------- Total 186 90 660 118 28 147 .8 4.5 ANGOON GMU 4 44 44 450 126 59 185 4.2 2.4 --------------------------------------------------------------------------------------------------------------------------------------------------------------------------------------------------------- Total 44 44 450 126 59 185 4.2 2.4 COFFMAN COVE GMU 2 56 48 560 128 0 128 2.3 4.4 --------------------------------------------------------------------------------------------------------------------------------------------------------------------------------------------------------- Total 56 48 560 128 0 128 2.3 4.4 CRAIG GMU 2 563 364 3735 780 52 832 1.5 4.5 GMU 3 17 17 52 17 0 17 1.0 3.0 UNKNOWN 9 9 156 17 0 17 2.0 9.2 --------------------------------------------------------------------------------------------------------------------------------------------------------------------------------------------------------- Total 589 390 3943 815 52 867 1.5 4.6 CUBE COVE CAMP GMU 4 35 35 231 91 14 105 3.0 2.2 --------------------------------------------------------------------------------------------------------------------------------------------------------------------------------------------------------- Total 35 35 231 91 14 105 3.0 2.2 EDNA BAY GMU 2 5 5 60 5 0 5 1.0 12.0 --------------------------------------------------------------------------------------------------------------------------------------------------------------------------------------------------------- Total 5 5 60 5 0 5 1.0 12.0 ELFIN COVE GMU 4 19 15 192 27 8 35 1.8 5.6 --------------------------------------------------------------------------------------------------------------------------------------------------------------------------------------------------------- Total 19 15 192 27 8 35 1.8 5.6 EXCURSION INLET CAMP GMU 4 2 0 4 0 0 0 .0 .0 --------------------------------------------------------------------------------------------------------------------------------------------------------------------------------------------------------- Total 2 0 4 0 0 0 .0 .0 GAME CREEK GMU 4 9 6 48 9 9 18 2.0 2.7 --------------------------------------------------------------------------------------------------------------------------------------------------------------------------------------------------------- Total 9 6 48 9 9 18 2.0 2.7 GUSTAVUS GMU 4 72 32 220 29 29 58 .8 3.8 --------------------------------------------------------------------------------------------------------------------------------------------------------------------------------------------------------- Total 72 32 220 29 29 58 .8 3.8

Page 14
2000-2001 Southeast Deer Survey Estimated Totals for Community of Residence by GMU
Total Number of Number Number Number Number Average Average Number Hunters of Days of of of Deer/ Days/ Community of Residence GMU of Hunters Successful Hunted Bucks Does Deer Hunter Deer ______________________ ______________ __________ __________ __________ ______ ______ _______ __________ __________ HAINES GMU 1C 14 0 14 0 0 0 .0 .0 GMU 2 9 5 18 0 5 5 .5 3.6 GMU 4 123 109 565 232 41 273 2.2 2.1 --------------------------------------------------------------------------------------------------------------------------------------------------------------------------------------------------------- Total 146 114 597 232 46 278 1.9 2.1 HIDDEN FALLS HATCHERY GMU 4 1 1 4 3 0 3 3.0 1.3 --------------------------------------------------------------------------------------------------------------------------------------------------------------------------------------------------------- Total 1 1 4 3 0 3 3.0 1.3 HOLLIS GMU 2 35 25 145 55 10 65 1.9 2.2 --------------------------------------------------------------------------------------------------------------------------------------------------------------------------------------------------------- Total 35 25 145 55 10 65 1.9 2.2 HOONAH GMU 4 232 178 2307 557 186 743 3.2 3.1 --------------------------------------------------------------------------------------------------------------------------------------------------------------------------------------------------------- Total 232 178 2307 557 186 743 3.2 3.1 HYDABURG GMU 2 34 11 45 22 0 22 .7 2.0 --------------------------------------------------------------------------------------------------------------------------------------------------------------------------------------------------------- Total 34 11 45 22 0 22 .7 2.0 HYDER GMU 1A 3 0 40 0 0 0 .0 .0 GMU 2 3 0 20 0 0 0 .0 .0 --------------------------------------------------------------------------------------------------------------------------------------------------------------------------------------------------------- Total 5 0 60 0 0 0 .0 .0 JUNEAU GMU 1B 5 0 5 0 0 0 .0 .0 GMU 1C 768 176 2189 162 69 231 .3 9.5 GMU 2 23 23 111 51 0 51 2.2 2.2 GMU 3 19 14 65 14 0 14 .8 4.7 GMU 4 1569 912 6855 1393 384 1777 1.1 3.9 UNKNOWN 5 5 28 5 0 5 1.0 5.6 --------------------------------------------------------------------------------------------------------------------------------------------------------------------------------------------------------- Total 2388 1129 9253 1625 454 2078 .9 4.5 KAKE GMU 3 47 16 454 24 0 24 .5 18.9 GMU 4 55 39 117 86 16 102 1.9 1.1 --------------------------------------------------------------------------------------------------------------------------------------------------------------------------------------------------------- Total 102 55 572 110 16 125 1.2 4.5 KETCHIKAN GMU 1A 567 133 3243 199 6 205 .4 15.8 GMU 1B 18 0 24 0 0 0 .0 .0 GMU 2 621 386 3074 759 12 772 1.2 4.0 GMU 3 60 18 211 24 0 24 .4 8.8 GMU 4 54 42 380 60 18 78 1.4 4.9 --------------------------------------------------------------------------------------------------------------------------------------------------------------------------------------------------------- Total 1320 579 6932 1043 36 1079 .8 6.4 KLAWOCK GMU 2 236 157 976 283 8 291 1.2 3.4 --------------------------------------------------------------------------------------------------------------------------------------------------------------------------------------------------------- Total 236 157 976 283 8 291 1.2 3.4 METLAKATLA GMU 1A 50 31 313 63 0 63 1.3 5.0 GMU 2 6 6 50 6 6 13 2.0 3.8 --------------------------------------------------------------------------------------------------------------------------------------------------------------------------------------------------------- Total 56 38 363 69 6 75 1.3 4.8

Page 15
2000-2001 Southeast Deer Survey Estimated Totals for Community of Residence by GMU
Total Number of Number Number Number Number Average Average Number Hunters of Days of of of Deer/ Days/ Community of Residence GMU of Hunters Successful Hunted Bucks Does Deer Hunter Deer ______________________ ______________ __________ __________ __________ ______ ______ _______ __________ __________ MEYERS CHUCK GMU 2 11 11 44 33 0 33 3.0 1.3 --------------------------------------------------------------------------------------------------------------------------------------------------------------------------------------------------------- Total 11 11 44 33 0 33 3.0 1.3 NAUKATI BAY GMU 2 64 45 447 57 6 64 1.0 7.0 --------------------------------------------------------------------------------------------------------------------------------------------------------------------------------------------------------- Total 64 45 447 57 6 64 1.0 7.0 PELICAN GMU 4 33 24 132 47 9 57 1.7 2.3 --------------------------------------------------------------------------------------------------------------------------------------------------------------------------------------------------------- Total 33 24 132 47 9 57 1.7 2.3 PETERSBURG GMU 1B 115 31 430 40 0 40 .3 10.8 GMU 1C 4 4 27 4 0 4 1.0 6.8 GMU 2 53 31 230 49 4 53 1.0 4.3 GMU 3 527 244 2366 386 18 403 .8 5.9 GMU 4 102 80 430 173 31 204 2.0 2.1 --------------------------------------------------------------------------------------------------------------------------------------------------------------------------------------------------------- Total 802 390 3483 651 53 705 .9 4.9 POINT BAKER GMU 2 17 8 50 8 0 8 .5 6.3 GMU 3 25 25 126 34 0 34 1.3 3.7 --------------------------------------------------------------------------------------------------------------------------------------------------------------------------------------------------------- Total 42 34 176 42 0 42 1.0 4.2 PORT ALEXANDER GMU 4 20 10 70 20 0 20 1.0 3.5 --------------------------------------------------------------------------------------------------------------------------------------------------------------------------------------------------------- Total 20 10 70 20 0 20 1.0 3.5 SITKA GMU 2 11 11 54 22 5 27 2.5 2.0 GMU 3 22 11 135 11 0 11 .5 12.3 GMU 4 1142 738 5315 1416 522 1939 1.7 2.7 UNKNOWN 5 5 11 0 5 5 1.0 2.2 --------------------------------------------------------------------------------------------------------------------------------------------------------------------------------------------------------- Total 1179 765 5514 1449 533 1982 1.7 2.8 SKAGWAY GMU 4 16 10 109 6 3 10 .6 11.3 --------------------------------------------------------------------------------------------------------------------------------------------------------------------------------------------------------- Total 16 10 109 6 3 10 .6 11.3 TENAKEE SPRINGS GMU 4 24 20 312 20 16 36 1.5 8.7 --------------------------------------------------------------------------------------------------------------------------------------------------------------------------------------------------------- Total 24 20 312 20 16 36 1.5 8.7 THORNE BAY GMU 2 234 164 2910 322 14 336 1.4 8.7 GMU 3 5 0 5 0 0 0 .0 .0 UNKNOWN 5 5 19 5 0 5 1.0 3.8 --------------------------------------------------------------------------------------------------------------------------------------------------------------------------------------------------------- Total 243 168 2934 327 14 341 1.4 8.6 WHALE PASS GMU 2 33 24 405 61 0 61 1.9 6.6 --------------------------------------------------------------------------------------------------------------------------------------------------------------------------------------------------------- Total 33 24 405 61 0 61 1.9 6.6 WHITESTONE CAMP GMU 4 33 22 169 33 0 33 1.0 5.2 --------------------------------------------------------------------------------------------------------------------------------------------------------------------------------------------------------- Total 33 22 169 33 0 33 1.0 5.2

Page 16
2000-2001 Southeast Deer Survey Estimated Totals for Community of Residence by GMU
Total Number of Number Number Number Number Average Average Number Hunters of Days of of of Deer/ Days/ Community of Residence GMU of Hunters Successful Hunted Bucks Does Deer Hunter Deer ______________________ ______________ __________ __________ __________ ______ ______ _______ __________ __________ WRANGELL GMU 1B 18 5 97 5 0 5 .3 19.4 GMU 2 69 46 221 83 37 120 1.7 1.8 GMU 3 465 253 3022 469 18 488 1.0 6.2 GMU 4 9 9 60 23 9 32 3.5 1.9 UNKNOWN 9 9 14 14 0 14 1.5 1.0 --------------------------------------------------------------------------------------------------------------------------------------------------------------------------------------------------------- Total 570 322 3413 593 64 658 1.2 5.2 YAKUTAT GMU 4 9 4 36 4 4 9 1.0 4.0 GMU 5A 4 0 9 0 0 0 .0 .0 --------------------------------------------------------------------------------------------------------------------------------------------------------------------------------------------------------- Total 13 4 45 4 4 9 .7 5.0 --------------------------------------------------------------------------------------------------------------------------------------------------------------------------------------------------------- Grand Total 8848 4861 45990 8779 1768 10547 1.2 4.4

Page 17
2000-2001 Southeast Deer Survey Estimated Totals by Island
Total Number of Number Number Number Number Average Average Number Hunters of Days of of of Percent Deer/ Days/ Island of Hunters Successful Hunted Bucks Does Deer Bucks Hunter Deer ___________________________ __________ __________ __________ ______ ______ _______ _______ __________ __________ Admiralty 1353 803 5519 1295 401 1696 76% 1.3 3.3 Baranof 1231 745 5000 1159 424 1583 73% 1.3 3.2 Chichagof/Yakobi 1409 942 7144 1737 467 2205 79% 1.6 3.2 Cleveland Peninsula 104 11 224 11 0 11 100% .1 21.0 Dall/Long 37 21 75 27 0 27 100% .7 2.8 Douglas 616 120 1666 102 51 153 67% .2 10.9 Etolin 135 49 404 59 0 59 100% .4 6.8 Gravina 187 24 646 36 0 36 100% .2 17.9 Heceta 25 25 104 54 0 54 100% 2.1 1.9 Kosciusko 33 18 155 27 0 27 100% .8 5.6 Kruzof 291 189 657 246 89 335 73% 1.2 2.0 Kuiu 48 27 185 27 0 27 100% .6 6.8 Kupreanof 270 126 1252 209 0 209 100% .8 6.0 Mainland/Chilkat Range 9 0 9 0 0 0 . .0 .0 Mainland/Juneau Area 93 10 164 10 0 10 100% .1 16.2 Mainland/Fanshaw-Stikine 126 31 488 40 0 40 100% .3 12.2 Mainland/Misty Fjords 15 0 64 0 0 0 . .0 .0 Mitkof/Woewodski 369 142 1368 151 18 169 89% .5 8.1 Outer Islands (Noyes, etc.) 34 17 43 35 0 35 100% 1.0 1.2 Prince of Wales 2149 1352 13160 2539 231 2770 92% 1.3 4.8 Pleasant/Lemesurier 80 35 208 24 33 57 41% .7 3.6 Revillagigedo 488 133 2586 182 6 188 97% .4 13.8 Shelter/Lincoln 168 51 422 46 19 65 71% .4 6.5 Suemez 54 48 97 61 0 61 100% 1.1 1.6 Woronkofski/Stikine Islands 14 5 14 5 0 5 100% .3 3.0 Wrangell 199 79 1331 84 18 102 82% .5 13.0 Zarembo 472 256 1914 430 0 430 100% .9 4.4 Unknown/Missing 108 108 1092 184 10 194 95% 1.8 5.6 --------------------------------------------------------------------------------------------------------------------------------------------------------------------------------------------------------- TOTAL 10118 5368 45990 8779 1768 10547 83% 1.0 4.4

Page 18
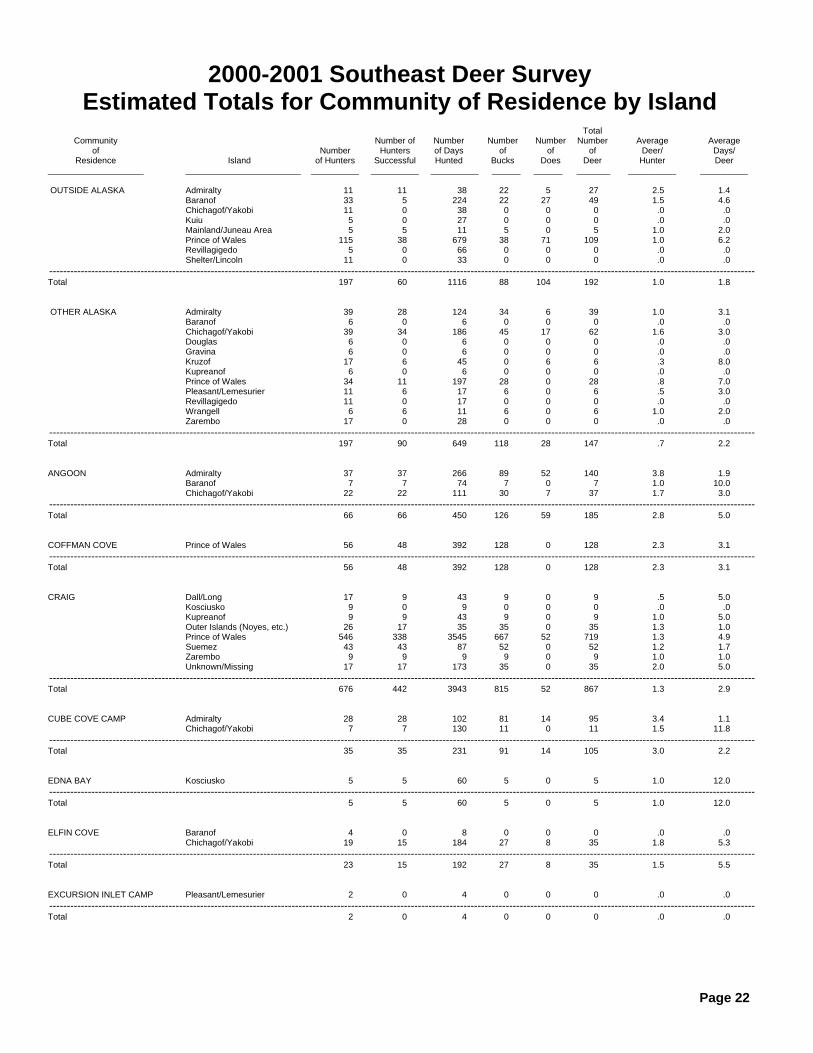
2000-2001 Southeast Deer Survey Estimated Totals for Island by Community of Residence
Total Community Number of Number Number Number Number Average Average of Number Hunters of Days of of of Deer/ Days/ Island Residence of Hunters Successful Hunted Bucks Does Deer Hunter Deer ______________________ ____________________ __________ __________ __________ ______ ______ _______ __________ __________ Admiralty OUTSIDE ALASKA 11 11 38 22 5 27 2.5 1.4 OTHER ALASKA 39 28 124 34 6 39 1.0 3.1 ANGOON 37 37 266 89 52 140 3.8 1.9 CUBE COVE CAMP 28 28 102 81 14 95 3.4 1.1 GUSTAVUS 4 0 4 0 0 0 .0 .0 HAINES 14 14 150 23 5 27 2.0 5.5 HIDDEN FALLS HATCHER 1 1 1 1 0 1 1.0 1.0 JUNEAU 1060 565 4226 778 259 1037 1.0 4.1 KAKE 47 39 102 86 16 102 2.2 1.0 KETCHIKAN 6 0 12 0 0 0 .0 .0 PETERSBURG 93 66 421 155 31 186 2.0 2.3 WRANGELL 9 9 60 23 9 32 3.5 1.9 YAKUTAT 4 4 13 4 4 9 2.0 1.5 --------------------------------------------------------------------------------------------------------------------------------------------------------------------------------------------------------- Total 1353 803 5519 1295 401 1696 1.3 3.3 Baranof OUTSIDE ALASKA 33 5 224 22 27 49 1.5 4.6 OTHER ALASKA 6 0 6 0 0 0 .0 .0 ANGOON 7 7 74 7 0 7 1.0 10.6 ELFIN COVE 4 0 8 0 0 0 .0 .0 HAINES 23 23 64 36 5 41 1.8 1.6 HIDDEN FALLS HATCHERY 1 1 3 2 0 2 2.0 1.5 HOONAH 8 0 15 0 0 0 .0 .0 JUNEAU 74 28 278 42 0 42 .6 6.7 KAKE 8 0 16 0 0 0 .0 .0 KETCHIKAN 36 36 325 54 12 66 1.8 4.9 PETERSBURG 9 9 9 13 0 13 1.5 .7 PORT ALEXANDER 20 10 60 20 0 20 1.0 3.0 SITKA 996 619 3877 959 377 1335 1.3 2.9 SKAGWAY 6 6 42 3 3 6 1.0 7.0 --------------------------------------------------------------------------------------------------------------------------------------------------------------------------------------------------------- Total 1231 745 5000 1159 424 1583 1.3 3.2 Chichagof/Yakobi OUTSIDE ALASKA 11 0 38 0 0 0 .0 .0 OTHER ALASKA 39 34 186 45 17 62 1.6 3.0 ANGOON 22 22 111 30 7 37 1.7 3.0 CUBE COVE CAMP 7 7 130 11 0 11 1.5 11.8 ELFIN COVE 19 15 184 27 8 35 1.8 5.3 GAME CREEK 9 6 48 9 9 18 2.0 2.7 GUSTAVUS 25 11 43 11 0 11 .4 4.0 HAINES 82 68 310 141 27 169 2.1 1.8 HOONAH 224 178 2260 557 186 743 3.3 3.0 JUNEAU 546 347 2245 555 106 662 1.2 3.4 KETCHIKAN 18 12 30 6 6 12 .7 2.5 PELICAN 33 24 132 47 9 57 1.7 2.3 SITKA 302 172 856 242 75 318 1.1 2.7 SKAGWAY 10 3 67 3 0 3 .3 22.3 TENAKEE SPRINGS 24 20 312 20 16 36 1.5 8.7 WHITESTONE CAMP 33 22 169 33 0 33 1.0 5.1 YAKUTAT 4 0 22 0 0 0 .0 .0 --------------------------------------------------------------------------------------------------------------------------------------------------------------------------------------------------------- Total 1409 942 7144 1737 467 2205 1.6 3.2 Cleveland Peninsula JUNEAU 5 0 5 0 0 0 .0 .0 KETCHIKAN 90 6 187 6 0 6 .1 31.2 WRANGELL 9 5 32 5 0 5 .5 6.4 --------------------------------------------------------------------------------------------------------------------------------------------------------------------------------------------------------- Total 104 11 224 11 0 11 .1 20.4 Dall/Long CRAIG 17 9 43 9 0 9 .5 4.8 KETCHIKAN 12 12 24 18 0 18 1.5 1.3 KLAWOCK 8 0 8 0 0 0 .0 .0 --------------------------------------------------------------------------------------------------------------------------------------------------------------------------------------------------------- Total 37 21 75 27 0 27 .7 2.8

Page 19
2000-2001 Southeast Deer Survey Estimated Totals for Island by Community of Residence
Total Community Number of Number Number Number Number Average Average of Number Hunters of Days of of of Deer/ Days/ Island Residence of Hunters Successful Hunted Bucks Does Deer Hunter Deer ______________________ ____________________ __________ __________ __________ ______ ______ _______ __________ __________ Douglas OTHER ALASKA 6 0 6 0 0 0 .0 .0 HAINES 5 0 5 0 0 0 .0 .0 JUNEAU 602 116 1629 97 51 148 .2 11.0 PETERSBURG 4 4 27 4 0 4 1.0 6.8 --------------------------------------------------------------------------------------------------------------------------------------------------------------------------------------------------------- Total 616 120 1666 102 51 153 .2 11.0 Etolin KETCHIKAN 24 12 96 18 0 18 .8 5.3 SITKA 5 0 27 0 0 0 .0 .0 THORNE BAY 5 0 5 0 0 0 .0 .0 WRANGELL 101 37 276 41 0 41 .4 6.7 --------------------------------------------------------------------------------------------------------------------------------------------------------------------------------------------------------- Total 135 49 404 59 0 59 .4 6.8 Gravina OTHER ALASKA 6 0 6 0 0 0 .0 .0 KETCHIKAN 163 24 597 36 0 36 .2 16.5 METLAKATLA 19 0 44 0 0 0 .0 .0 --------------------------------------------------------------------------------------------------------------------------------------------------------------------------------------------------------- Total 187 24 646 36 0 36 .2 18.0 Heceta KETCHIKAN 12 12 60 24 0 24 2.0 2.5 KLAWOCK 8 8 16 8 0 8 1.0 2.0 MEYERS CHUCK 6 6 28 22 0 22 4.0 1.3 --------------------------------------------------------------------------------------------------------------------------------------------------------------------------------------------------------- Total 25 25 104 54 0 54 2.1 1.9 Kosciusko CRAIG 9 0 9 0 0 0 .0 .0 EDNA BAY 5 5 60 5 0 5 1.0 12.0 KETCHIKAN 6 0 6 0 0 0 .0 .0 PETERSBURG 9 9 62 13 0 13 1.5 4.7 WRANGELL 5 5 18 9 0 9 2.0 2.0 --------------------------------------------------------------------------------------------------------------------------------------------------------------------------------------------------------- Total 33 18 155 27 0 27 .8 5.7 Kruzof OTHER ALASKA 17 6 45 0 6 6 .3 7.5 HAINES 9 9 36 32 5 36 4.0 1.0 JUNEAU 14 14 32 5 9 14 1.0 2.3 PETERSBURG 4 4 0 4 0 4 1.0 .0 PORT ALEXANDER 10 0 10 0 0 0 .0 .0 SITKA 237 156 533 205 70 275 1.2 1.9 --------------------------------------------------------------------------------------------------------------------------------------------------------------------------------------------------------- Total 291 189 657 246 89 335 1.2 2.0 Kuiu OUTSIDE ALASKA 5 0 27 0 0 0 .0 .0 KETCHIKAN 12 6 12 6 0 6 .5 2.0 PETERSBURG 13 4 44 4 0 4 .3 11.0 POINT BAKER 17 17 101 17 0 17 1.0 6.0 --------------------------------------------------------------------------------------------------------------------------------------------------------------------------------------------------------- Total 48 27 185 27 0 27 .6 6.8 Kupreanof OTHER ALASKA 6 0 6 0 0 0 .0 .0 CRAIG 9 9 43 9 0 9 1.0 5.0 JUNEAU 5 5 14 5 0 5 1.0 3.0 KAKE 47 16 454 24 0 24 .5 18.9 KETCHIKAN 18 0 78 0 0 0 .0 .0 PETERSBURG 164 84 576 146 0 146 .9 3.9 POINT BAKER 8 8 25 17 0 17 2.0 1.5 WRANGELL 14 5 55 9 0 9 .7 6.0 --------------------------------------------------------------------------------------------------------------------------------------------------------------------------------------------------------- Total 270 126 1252 209 0 209 .8 6.0 Mainland/Chilkat Range HAINES 9 0 9 0 0 0 .0 .0 --------------------------------------------------------------------------------------------------------------------------------------------------------------------------------------------------------- Total 9 0 9 0 0 0 .0 .0

Page 20
2000-2001 Southeast Deer Survey Estimated Totals for Island by Community of Residence
Total Community Number of Number Number Number Number Average Average of Number Hunters of Days of of of Deer/ Days/ Island Residence of Hunters Successful Hunted Bucks Does Deer Hunter Deer ______________________ ____________________ __________ __________ __________ ______ ______ _______ __________ __________ Mainland/Juneau Area OUTSIDE ALASKA 5 5 11 5 0 5 1.0 2.2 JUNEAU 88 5 153 5 0 5 .1 30.6 --------------------------------------------------------------------------------------------------------------------------------------------------------------------------------------------------------- Total 93 10 164 10 0 10 .1 16.4 Mainland/Fanshaw-Stikine KETCHIKAN 6 0 12 0 0 0 .0 .0 PETERSBURG 115 31 430 40 0 40 .3 10.8 WRANGELL 5 0 46 0 0 0 .0 .0 --------------------------------------------------------------------------------------------------------------------------------------------------------------------------------------------------------- Total 126 31 488 40 0 40 .3 12.2 Mainland/Misty Fjords HYDER 3 0 40 0 0 0 .0 .0 KETCHIKAN 12 0 24 0 0 0 .0 .0 --------------------------------------------------------------------------------------------------------------------------------------------------------------------------------------------------------- Total 15 0 64 0 0 0 .0 .0 Mitkof/Woewodski JUNEAU 9 5 19 5 0 5 .5 4.0 PETERSBURG 354 137 1312 146 18 164 .5 8.0 SITKA 5 0 38 0 0 0 .0 .0 --------------------------------------------------------------------------------------------------------------------------------------------------------------------------------------------------------- Total 369 142 1368 151 18 169 .5 8.1 Outer Islands (Noyes, etc.) CRAIG 26 17 35 35 0 35 1.3 1.0 KLAWOCK 8 0 8 0 0 0 .0 .0 --------------------------------------------------------------------------------------------------------------------------------------------------------------------------------------------------------- Total 34 17 43 35 0 35 1.0 1.2 Prince of Wales OUTSIDE ALASKA 115 38 679 38 71 109 1.0 6.2 OTHER ALASKA 34 11 197 28 0 28 .8 7.0 COFFMAN COVE 56 48 392 128 0 128 2.3 3.1 CRAIG 546 338 3545 667 52 719 1.3 4.9 HAINES 9 5 18 0 5 5 .5 3.6 HOLLIS 35 25 145 55 10 65 1.9 2.2 HYDABURG 34 11 45 22 0 22 .7 2.0 HYDER 3 0 20 0 0 0 .0 .0 JUNEAU 23 23 106 42 0 42 1.8 2.6 KETCHIKAN 597 368 2935 717 12 729 1.2 4.0 KLAWOCK 228 157 944 275 8 283 1.2 3.3 METLAKATLA 6 6 50 6 6 13 2.0 3.8 MEYERS CHUCK 11 11 11 11 0 11 1.0 1.0 NAUKATI BAY 64 45 447 57 6 64 1.0 7.0 PETERSBURG 40 27 133 35 4 40 1.0 3.3 POINT BAKER 17 8 50 8 0 8 .5 6.3 SITKA 11 11 54 22 5 27 2.5 2.0 THORNE BAY 234 164 2826 322 14 336 1.4 8.4 WHALE PASS 33 24 405 61 0 61 1.9 6.6 WRANGELL 55 32 156 41 37 78 1.4 2.0 --------------------------------------------------------------------------------------------------------------------------------------------------------------------------------------------------------- Total 2149 1352 13160 2539 231 2770 1.3 4.8 Pleasant/Lemesurier OTHER ALASKA 11 6 17 6 0 6 .5 2.8 EXCURSION INLET CAMP 2 0 4 0 0 0 .0 .0 GUSTAVUS 58 25 173 18 29 47 .8 3.7 HAINES 5 0 5 0 0 0 .0 .0 JUNEAU 5 5 9 0 5 5 1.0 1.8 --------------------------------------------------------------------------------------------------------------------------------------------------------------------------------------------------------- Total 80 35 208 24 33 57 .7 3.6 Revillagigedo OUTSIDE ALASKA 5 0 66 0 0 0 .0 .0 OTHER ALASKA 11 0 17 0 0 0 .0 .0 KETCHIKAN 452 115 2441 157 6 163 .4 15.0 METLAKATLA 19 19 63 25 0 25 1.3 2.5 --------------------------------------------------------------------------------------------------------------------------------------------------------------------------------------------------------- Total 488 133 2586 182 6 188 .4 13.8

Page 21
2000-2001 Southeast Deer Survey Estimated Totals for Island by Community of Residence
Total Community Number of Number Number Number Number Average Average of Number Hunters of Days of of of Deer/ Days/ Island Residence of Hunters Successful Hunted Bucks Does Deer Hunter Deer ______________________ ____________________ __________ __________ __________ ______ ______ _______ __________ __________ Shelter/Lincoln OUTSIDE ALASKA 11 0 33 0 0 0 .0 .0 JUNEAU 157 51 389 46 19 65 .4 6.0 --------------------------------------------------------------------------------------------------------------------------------------------------------------------------------------------------------- Total 168 51 422 46 19 65 .4 6.5 Suemez CRAIG 43 43 87 52 0 52 1.2 1.7 JUNEAU 5 5 5 9 0 9 2.0 .6 KETCHIKAN 6 0 6 0 0 0 .0 .0 --------------------------------------------------------------------------------------------------------------------------------------------------------------------------------------------------------- Total 54 48 97 61 0 61 1.1 1.6 Woronkofski/Stikine Islands WRANGELL 14 5 14 5 0 5 .3 3.0 --------------------------------------------------------------------------------------------------------------------------------------------------------------------------------------------------------- Total 14 5 14 5 0 5 .3 3.0 Wrangell OTHER ALASKA 6 6 11 6 0 6 1.0 1.8 JUNEAU 9 5 32 5 0 5 .5 6.4 PETERSBURG 4 0 9 0 0 0 .0 .0 WRANGELL 179 69 1279 74 18 92 .5 13.9 --------------------------------------------------------------------------------------------------------------------------------------------------------------------------------------------------------- Total 199 79 1331 84 18 102 .5 12.9 Zarembo OTHER ALASKA 17 0 28 0 0 0 .0 .0 CRAIG 9 9 9 9 0 9 1.0 1.0 KETCHIKAN 12 0 24 0 0 0 .0 .0 PETERSBURG 120 62 417 89 0 89 .7 4.7 SITKA 11 11 70 11 0 11 1.0 6.5 WRANGELL 304 175 1366 322 0 322 1.1 4.2 --------------------------------------------------------------------------------------------------------------------------------------------------------------------------------------------------------- Total 472 256 1914 430 0 430 .9 4.4 Unknown/Missing CRAIG 17 17 352 35 0 35 2.0 10.1 JUNEAU 23 23 171 32 5 37 1.6 4.6 METLAKATLA 19 19 256 38 0 38 2.0 6.7 SITKA 16 16 59 11 5 16 1.0 3.7 THORNE BAY 5 5 103 5 0 5 1.0 20.6 WRANGELL 28 28 119 64 0 64 2.3 1.9 --------------------------------------------------------------------------------------------------------------------------------------------------------------------------------------------------------- Total 108 108 1092 184 10 194 1.8 5.6 --------------------------------------------------------------------------------------------------------------------------------------------------------------------------------------------------------- Grand Total 10118 5368 45990 8779 1768 10547 1.0 4.4
Page 22
2000-2001 Southeast Deer Survey Estimated Totals for Community of Residence by Island
Total Community Number of Number Number Number Number Average Average of Number Hunters of Days of of of Deer/ Days/ Residence Island of Hunters Successful Hunted Bucks Does Deer Hunter Deer ____________________ ________________________ __________ __________ __________ ______ ______ _______ __________ __________ OUTSIDE ALASKA Admiralty 11 11 38 22 5 27 2.5 1.4 Baranof 33 5 224 22 27 49 1.5 4.6 Chichagof/Yakobi 11 0 38 0 0 0 .0 .0 Kuiu 5 0 27 0 0 0 .0 .0 Mainland/Juneau Area 5 5 11 5 0 5 1.0 2.0 Prince of Wales 115 38 679 38 71 109 1.0 6.2 Revillagigedo 5 0 66 0 0 0 .0 .0 Shelter/Lincoln 11 0 33 0 0 0 .0 .0 --------------------------------------------------------------------------------------------------------------------------------------------------------------------------------------------------------- Total 197 60 1116 88 104 192 1.0 1.8 OTHER ALASKA Admiralty 39 28 124 34 6 39 1.0 3.1 Baranof 6 0 6 0 0 0 .0 .0 Chichagof/Yakobi 39 34 186 45 17 62 1.6 3.0 Douglas 6 0 6 0 0 0 .0 .0 Gravina 6 0 6 0 0 0 .0 .0 Kruzof 17 6 45 0 6 6 .3 8.0 Kupreanof 6 0 6 0 0 0 .0 .0 Prince of Wales 34 11 197 28 0 28 .8 7.0 Pleasant/Lemesurier 11 6 17 6 0 6 .5 3.0 Revillagigedo 11 0 17 0 0 0 .0 .0 Wrangell 6 6 11 6 0 6 1.0 2.0 Zarembo 17 0 28 0 0 0 .0 .0 --------------------------------------------------------------------------------------------------------------------------------------------------------------------------------------------------------- Total 197 90 649 118 28 147 .7 2.2 ANGOON Admiralty 37 37 266 89 52 140 3.8 1.9 Baranof 7 7 74 7 0 7 1.0 10.0 Chichagof/Yakobi 22 22 111 30 7 37 1.7 3.0 --------------------------------------------------------------------------------------------------------------------------------------------------------------------------------------------------------- Total 66 66 450 126 59 185 2.8 5.0 COFFMAN COVE Prince of Wales 56 48 392 128 0 128 2.3 3.1 --------------------------------------------------------------------------------------------------------------------------------------------------------------------------------------------------------- Total 56 48 392 128 0 128 2.3 3.1 CRAIG Dall/Long 17 9 43 9 0 9 .5 5.0 Kosciusko 9 0 9 0 0 0 .0 .0 Kupreanof 9 9 43 9 0 9 1.0 5.0 Outer Islands (Noyes, etc.) 26 17 35 35 0 35 1.3 1.0 Prince of Wales 546 338 3545 667 52 719 1.3 4.9 Suemez 43 43 87 52 0 52 1.2 1.7 Zarembo 9 9 9 9 0 9 1.0 1.0 Unknown/Missing 17 17 173 35 0 35 2.0 5.0 --------------------------------------------------------------------------------------------------------------------------------------------------------------------------------------------------------- Total 676 442 3943 815 52 867 1.3 2.9 CUBE COVE CAMP Admiralty 28 28 102 81 14 95 3.4 1.1 Chichagof/Yakobi 7 7 130 11 0 11 1.5 11.8 --------------------------------------------------------------------------------------------------------------------------------------------------------------------------------------------------------- Total 35 35 231 91 14 105 3.0 2.2 EDNA BAY Kosciusko 5 5 60 5 0 5 1.0 12.0 --------------------------------------------------------------------------------------------------------------------------------------------------------------------------------------------------------- Total 5 5 60 5 0 5 1.0 12.0 ELFIN COVE Baranof 4 0 8 0 0 0 .0 .0 Chichagof/Yakobi 19 15 184 27 8 35 1.8 5.3 --------------------------------------------------------------------------------------------------------------------------------------------------------------------------------------------------------- Total 23 15 192 27 8 35 1.5 5.5 EXCURSION INLET CAMP Pleasant/Lemesurier 2 0 4 0 0 0 .0 .0 --------------------------------------------------------------------------------------------------------------------------------------------------------------------------------------------------------- Total 2 0 4 0 0 0 .0 .0

Page 23
2000-2001 Southeast Deer Survey Estimated Totals for Community of Residence by Island
Total Community Number of Number Number Number Number Average Average of Number Hunters of Days of of of Deer/ Days/ Residence Island of Hunters Successful Hunted Bucks Does Deer Hunter Deer ____________________ ________________________ __________ __________ __________ ______ ______ _______ __________ __________ GAME CREEK Chichagof/Yakobi 9 6 48 9 9 18 2.0 2.7 --------------------------------------------------------------------------------------------------------------------------------------------------------------------------------------------------------- Total 9 6 48 9 9 18 2.0 2.7 GUSTAVUS Admiralty 4 0 4 0 0 0 .0 .0 Chichagof/Yakobi 25 11 43 11 0 11 .4 4.0 Pleasant/Lemesurier 58 25 173 18 29 47 .8 3.7 --------------------------------------------------------------------------------------------------------------------------------------------------------------------------------------------------------- Total 86 36 220 29 29 58 .7 3.8 HAINES Admiralty 14 14 150 23 5 27 2.0 5.5 Baranof 23 23 64 36 5 41 1.8 1.6 Chichagof/Yakobi 82 68 310 141 27 169 2.1 1.8 Douglas 5 0 5 0 0 0 .0 .0 Kruzof 9 9 36 32 5 36 4.0 1.0 Mainland/Chilkat Range 9 0 9 0 0 0 .0 .0 Prince of Wales 9 5 18 0 5 5 .5 3.6 Pleasant/Lemesurier 5 0 5 0 0 0 .0 .0 --------------------------------------------------------------------------------------------------------------------------------------------------------------------------------------------------------- Total 155 118 597 232 46 278 1.8 2.1 HIDDN FLLS HATCHERY Admiralty 1 1 1 1 0 1 1.0 1.0 Baranof 1 1 3 2 0 2 2.0 1.5 --------------------------------------------------------------------------------------------------------------------------------------------------------------------------------------------------------- Total 2 2 4 3 0 3 1.5 1.3 HOLLIS Prince of Wales 35 25 145 55 10 65 1.9 2.2 --------------------------------------------------------------------------------------------------------------------------------------------------------------------------------------------------------- Total 35 25 145 55 10 65 1.9 2.2 HOONAH Baranof 8 0 15 0 0 0 .0 .0 Chichagof/Yakobi 224 178 2260 557 186 743 3.3 3.0 --------------------------------------------------------------------------------------------------------------------------------------------------------------------------------------------------------- Total 232 178 2276 557 186 743 3.2 3.1 HYDABURG Prince of Wales 34 11 45 22 0 22 .7 2.0 --------------------------------------------------------------------------------------------------------------------------------------------------------------------------------------------------------- Total 34 11 45 22 0 22 .7 2.0 HYDER Mainland/Misty Fjords 3 0 40 0 0 0 .0 .0 Prince of Wales 3 0 20 0 0 0 .0 .0 --------------------------------------------------------------------------------------------------------------------------------------------------------------------------------------------------------- Total 5 0 60 0 0 0 .0 .0 JUNEAU Admiralty 1060 565 4226 778 259 1037 1.0 4.1 Baranof 74 28 278 42 0 42 .6 6.7 Chichagof/Yakobi 546 347 2245 555 106 662 1.2 3.4 Cleveland Peninsula 5 0 5 0 0 0 .0 .0 Douglas 602 116 1629 97 51 148 .2 11.0 Kruzof 14 14 32 5 9 14 1.0 2.3 Kupreanof 5 5 14 5 0 5 1.0 2.8 Mainland/Juneau Area 88 5 153 5 0 5 .1 30.6 Mitkof/Woewodski 9 5 19 5 0 5 .5 3.8 Prince of Wales 23 23 106 42 0 42 1.8 2.5 Pleasant/Lemesurier 5 5 9 0 5 5 1.0 1.8 Shelter/Lincoln 157 51 389 46 19 65 .4 6.0 Suemez 5 5 5 9 0 9 2.0 .6 Wrangell 9 5 32 5 0 5 .5 6.4 Unknown/Missing 23 23 111 32 5 37 1.6 3.0 --------------------------------------------------------------------------------------------------------------------------------------------------------------------------------------------------------- Total 2624 1194 9253 1625 454 2078 .8 4.4

Page 24
2000-2001 Southeast Deer Survey Estimated Totals for Community of Residence by Island
Total Community Number of Number Number Number Number Average Average of Number Hunters of Days of of of Deer/ Days/ Residence Island of Hunters Successful Hunted Bucks Does Deer Hunter Deer ____________________ ________________________ __________ __________ __________ ______ ______ _______ __________ __________ KAKE Admiralty 47 39 102 86 16 102 2.2 1.0 Baranof 8 0 16 0 0 0 .0 .0 Kupreanof 47 16 454 24 0 24 .5 18.9 --------------------------------------------------------------------------------------------------------------------------------------------------------------------------------------------------------- Total 102 55 572 110 16 125 1.2 4.5 KETCHIKAN Admiralty 6 0 12 0 0 0 .0 .0 Baranof 36 36 325 54 12 66 1.8 4.9 Chichagof/Yakobi 18 12 30 6 6 12 .7 2.5 Cleveland Peninsula 90 6 187 6 0 6 .1 31.0 Dall/Long 12 12 24 18 0 18 1.5 1.3 Etolin 24 12 96 18 0 18 .8 5.3 Gravina 163 24 597 36 0 36 .2 16.5 Heceta 12 12 60 24 0 24 2.0 2.5 Kosciusko 6 0 6 0 0 0 .0 .0 Kuiu 12 6 12 6 0 6 .5 2.0 Kupreanof 18 0 78 0 0 0 .0 .0 Mainland/Fanshaw-Stikine 6 0 12 0 0 0 .0 .0 Mainland/Misty Fjords 12 0 24 0 0 0 .0 .0 Prince of Wales 597 368 2935 717 12 729 1.2 4.0 Revillagigedo 452 115 2441 157 6 163 .4 15.0 Suemez 6 0 6 0 0 0 .0 .0 Zarembo 12 0 24 0 0 0 .0 .0 --------------------------------------------------------------------------------------------------------------------------------------------------------------------------------------------------------- Total 1483 603 6872 1043 36 1079 .7 6.4 KLAWOCK Dall/Long 8 0 8 0 0 0 .0 .0 Heceta 8 8 16 8 0 8 1.0 2.0 Outer Islands (Noyes, etc.) 8 0 8 0 0 0 .0 .0 Prince of Wales 228 157 944 275 8 283 1.2 3.3 --------------------------------------------------------------------------------------------------------------------------------------------------------------------------------------------------------- Total 252 165 976 283 8 291 1.2 3.4 METLAKATLA Gravina 19 0 44 0 0 0 .0 .0 Prince of Wales 6 6 50 6 6 13 2.0 4.0 Revillagigedo 19 19 63 25 0 25 1.3 2.5 Unknown/Missing 19 19 206 38 0 38 2.0 5.5 --------------------------------------------------------------------------------------------------------------------------------------------------------------------------------------------------------- Total 63 44 363 69 6 75 1.2 4.8 MEYERS CHUCK Heceta 6 6 28 22 0 22 4.0 1.3 Prince of Wales 11 11 11 11 0 11 1.0 1.0 --------------------------------------------------------------------------------------------------------------------------------------------------------------------------------------------------------- Total 17 17 39 33 0 33 2.0 1.2 NAUKATI BAY Prince of Wales 64 45 447 57 6 64 1.0 7.0 --------------------------------------------------------------------------------------------------------------------------------------------------------------------------------------------------------- Total 64 45 447 57 6 64 1.0 7.0 PELICAN Chichagof/Yakobi 33 24 132 47 9 57 1.7 2.3 --------------------------------------------------------------------------------------------------------------------------------------------------------------------------------------------------------- Total 33 24 132 47 9 57 1.7 2.3 PETERSBURG Admiralty 93 66 421 155 31 186 2.0 2.3 Baranof 9 9 9 13 0 13 1.5 .7 Douglas 4 4 27 4 0 4 1.0 6.8 Kosciusko 9 9 62 13 0 13 1.5 4.7 Kruzof 4 4 0 4 0 4 1.0 .0 Kuiu 13 4 44 4 0 4 .3 11.0 Kupreanof 164 84 576 146 0 146 .9 3.9 Mainland/Fanshaw-Stikine 115 31 430 40 0 40 .3 10.8 Mitkof/Woewodski 354 137 1312 146 18 164 .5 8.0 Prince of Wales 40 27 133 35 4 40 1.0 3.3 Wrangell 4 0 9 0 0 0 .0 .0 Zarembo 120 62 417 89 0 89 .7 4.7 --------------------------------------------------------------------------------------------------------------------------------------------------------------------------------------------------------- Total 931 439 3439 651 53 705 .8 4.9

Page 25
2000-2001 Southeast Deer Survey Estimated Totals for Community of Residence by Island
Total Community Number of Number Number Number Number Average Average of Number Hunters of Days of of of Deer/ Days/ Residence Island of Hunters Successful Hunted Bucks Does Deer Hunter Deer ____________________ ________________________ __________ __________ __________ ______ ______ _______ __________ __________ POINT BAKER Kuiu 17 17 101 17 0 17 1.0 6.0 Kupreanof 8 8 25 17 0 17 2.0 1.5 Prince of Wales 17 8 50 8 0 8 .5 6.3 --------------------------------------------------------------------------------------------------------------------------------------------------------------------------------------------------------- Total 42 34 176 42 0 42 1.0 4.2 PORT ALEXANDER Baranof 20 10 60 20 0 20 1.0 3.0 Kruzof 10 0 10 0 0 0 .0 .0 --------------------------------------------------------------------------------------------------------------------------------------------------------------------------------------------------------- Total 30 10 70 20 0 20 .7 3.5 SITKA Baranof 996 619 3877 959 377 1335 1.3 2.9 Chichagof/Yakobi 302 172 856 242 75 318 1.1 2.7 Etolin 5 0 27 0 0 0 .0 .0 Kruzof 237 156 533 205 70 275 1.2 1.9 Mitkof/Woewodski 5 0 38 0 0 0 .0 .0 Prince of Wales 11 11 54 22 5 27 2.5 2.0 Zarembo 11 11 70 11 0 11 1.0 6.5 Unknown/Missing 16 16 59 11 5 16 1.0 3.7 --------------------------------------------------------------------------------------------------------------------------------------------------------------------------------------------------------- Total 1583 985 5514 1449 533 1982 1.3 2.8 SKAGWAY Baranof 6 6 42 3 3 6 1.0 7.0 Chichagof/Yakobi 10 3 67 3 0 3 .3 22.3 --------------------------------------------------------------------------------------------------------------------------------------------------------------------------------------------------------- Total 16 10 109 6 3 10 .6 12.1 TENAKEE SPRINGS Chichagof/Yakobi 24 20 312 20 16 36 1.5 8.7 --------------------------------------------------------------------------------------------------------------------------------------------------------------------------------------------------------- Total 24 20 312 20 16 36 1.5 8.7 THORNE BAY Etolin 5 0 5 0 0 0 .0 .0 Prince of Wales 234 164 2826 322 14 336 1.4 8.4 Unknown/Missing 5 5 103 5 0 5 1.0 20.6 --------------------------------------------------------------------------------------------------------------------------------------------------------------------------------------------------------- Total 243 168 2934 327 14 341 1.4 8.6 WHALE PASS Prince of Wales 33 24 405 61 0 61 1.9 6.6 --------------------------------------------------------------------------------------------------------------------------------------------------------------------------------------------------------- Total 33 24 405 61 0 61 1.9 6.6 WHITESTONE CAMP Chichagof/Yakobi 33 22 169 33 0 33 1.0 5.2 --------------------------------------------------------------------------------------------------------------------------------------------------------------------------------------------------------- Total 33 22 169 33 0 33 1.0 5.2 WRANGELL Admiralty 9 9 60 23 9 32 3.5 1.9 Cleveland Peninsula 9 5 32 5 0 5 .5 6.4 Etolin 101 37 276 41 0 41 .4 6.7 Kosciusko 5 5 18 9 0 9 2.0 2.0 Kupreanof 14 5 55 9 0 9 .7 6.1 Mainland/Fanshaw-Stikine 5 0 46 0 0 0 .0 .0 Prince of Wales 55 32 156 41 37 78 1.4 2.0 Woronkofski/Stikine Islands 14 5 14 5 0 5 .3 3.0 Wrangell 179 69 1279 74 18 92 .5 13.9 Zarembo 304 175 1366 322 0 322 1.1 4.2 Unknown/Missing 28 28 110 64 0 64 2.3 1.7 --------------------------------------------------------------------------------------------------------------------------------------------------------------------------------------------------------- Total 722 368 3413 593 64 658 .9 5.2 YAKUTAT Admiralty 4 4 13 4 4 9 2.0 1.5 Chichagof/Yakobi 4 0 22 0 0 0 .0 .0 --------------------------------------------------------------------------------------------------------------------------------------------------------------------------------------------------------- Total 9 4 36 4 4 9 1.0 3.9 --------------------------------------------------------------------------------------------------------------------------------------------------------------------------------------------------------- Grand Total 10118 5368 45990 8779 1768 10547 1.0 4.4

Page 26
2000-2001 Southeast Deer Survey Estimated Totals by Major Hunt Area
Total Number of Number Number Number Number Average Average Number Hunters of Days of of of Percent Deer/ Days/ Major Hunt Area of Hunters Successful Hunted Bucks Does Deer Bucks Hunter Deer __________________________ __________ __________ __________ ______ ______ _______ _______ __________ __________ 1 Gravina Island 187 24 646 36 0 36 100% .2 17.9
2 Annette Island 19 19 194 31 0 31 100% 1.7 6.2
3 Duke Island 6 6 13 6 0 6 100% 1.0 2.0
4 Southern Revilla 337 103 1936 140 0 140 100% .4 13.9
5 Northern Revilla 175 30 561 42 6 48 88% .3 11.6
6 Lower Cleveland Peninsula 84 6 181 6 0 6 100% .1 30.0
8 Misty Fjords South 15 0 64 0 0 0 . .0 .0
9 Outside Islands 71 48 140 96 0 96 100% 1.4 1.5
10 Heceta Island 25 25 104 54 0 54 100% 2.1 1.9
11 SW. Coast and Islands 113 80 213 112 0 112 100% 1.0 1.9
12 SE. Prince of Wales 153 75 875 107 0 107 100% .7 8.2
13 Central Prince of Wales 1105 686 5868 1173 81 1254 94% 1.1 4.7
14 Northcentral Price of Wales 858 443 3765 598 108 706 85% .8 5.3
15 Northern P of W - Kosciusko 509 297 2201 499 37 536 93% 1.1 4.1
16 Mainland/Fanshaw-LeConte 112 31 406 40 0 40 100% .4 10.2
17 Mainland/LeConte-Stikine 13 0 81 0 0 0 . .0 .0
18 Mainland/South of Stikine 30 5 67 5 0 5 100% .2 14.6
19 Sumner/Ernest Islands 675 352 3704 596 18 615 97% .9 6.0
20 Mitkof Island 369 142 1368 151 18 169 89% .5 8.1
22 Sullivan-Endicott River 9 0 9 0 0 0 . .0 .0
25 Mainland/Juneau 93 10 164 10 0 10 100% .1 16.2
26 Shelter-Lincoln Islands 168 51 422 46 19 65 71% .4 6.5
27 Douglas Island 616 120 1666 102 51 153 67% .2 10.9
28 Mainland/Taku-Holkam 14 5 19 14 0 14 100% 1.0 1.3
30 Sitka Sound 807 458 2974 635 265 900 71% 1.1 3.3
31 Kruzof Island 286 184 646 240 89 330 73% 1.2 2.0
32 W. Baranof Is. 202 114 456 114 65 178 64% .9 2.6
33 Peril Strait 587 346 1913 475 154 630 76% 1.1 3.0
34 W. Chichagof/Yakobi 274 168 1136 274 55 329 83% 1.2 3.5
35 NE Chichagof Island 616 412 3384 768 222 989 78% 1.6 3.4
36 S. Shore Tenakee 171 107 717 156 45 201 78% 1.2 3.6
37 E. and S. Baranof Island 146 93 568 170 22 192 88% 1.3 3.0
38 N. Admiralty Island 563 284 1663 364 106 470 77% .8 3.5
39 SE. Admiralty Island 215 162 833 302 70 372 81% 1.7 2.2
40 W. Admiralty Island 231 147 1213 302 98 400 76% 1.7 3.0
41 Seymour Canal 387 212 1555 282 97 379 74% 1.0 4.1
42 Icy Strait 230 165 965 259 92 351 74% 1.5 2.8
45 Yakutat Forelands 4 0 9 0 0 0 . .0 .0
50 Kuiu/Coronation Islands 42 27 157 27 0 27 100% .6 5.8
51 Kupreanof Island 256 122 1211 205 0 205 100% .8 5.9
99 Missing/Unknown 239 239 1924 341 50 392 87% 1.6 4.9
--------------------------------------------------------------------------------------------------------------------------------------------------------------------------------------------------------- TOTAL 11015 5796 45990 8779 1768 10547 83% 1.0 4.4

Page 27
2000-2001 Southeast Deer Survey Estimated Totals for Major by Community of Residence
Total Community Number of Number Number Number Number Average Average of Number Hunters of Days of of of Deer/ Days/ Major Hunt Area Residence of Hunters Successful Hunted Bucks Does Deer Hunter Deer ________________________ __________ __________ __________ ______ ______ _______ _______ __________ __________ 1 Gravina Island OTHER ALASKA 6 0 6 0 0 0 .0 .0 KETCHIKAN 163 24 597 36 0 36 .2 16.5 METLAKATLA 19 0 44 0 0 0 .0 .0 --------------------------------------------------------------------------------------------------------------------------------------------------------------------------------------------------------- Total 187 24 646 36 0 36 .2 18.0 2 Annette Island METLAKATLA 19 19 194 31 0 31 1.7 6.2 --------------------------------------------------------------------------------------------------------------------------------------------------------------------------------------------------------- Total 19 19 194 31 0 31 1.7 6.2 3 Duke Island METLAKATLA 6 6 13 6 0 6 1.0 2.0 --------------------------------------------------------------------------------------------------------------------------------------------------------------------------------------------------------- Total 6 6 13 6 0 6 1.0 2.0 4 Southern Revilla OTHER ALASKA 11 0 17 0 0 0 .0 .0 KETCHIKAN 307 84 1857 115 0 115 .4 16.2 METLAKATLA 19 19 63 25 0 25 1.3 2.5 --------------------------------------------------------------------------------------------------------------------------------------------------------------------------------------------------------- Total 337 103 1936 140 0 140 .4 13.8 5 Northern Revilla KETCHIKAN 175 30 561 42 6 48 .3 11.6 --------------------------------------------------------------------------------------------------------------------------------------------------------------------------------------------------------- Total 175 30 561 42 6 48 .3 11.6 6 Lower Cleveland Peninsula KETCHIKAN 84 6 181 6 0 6 .1 30.0 --------------------------------------------------------------------------------------------------------------------------------------------------------------------------------------------------------- Total 84 6 181 6 0 6 .1 30.0 8 Misty Fjords South HYDER 3 0 40 0 0 0 .0 .0 KETCHIKAN 12 0 24 0 0 0 .0 .0 --------------------------------------------------------------------------------------------------------------------------------------------------------------------------------------------------------- Total 15 0 64 0 0 0 .0 .0 9 Outside Islands CRAIG 52 43 121 87 0 87 1.7 1.4 JUNEAU 5 5 5 9 0 9 2.0 .5 KETCHIKAN 6 0 6 0 0 0 .0 .0 KLAWOCK 8 0 8 0 0 0 .0 .0 --------------------------------------------------------------------------------------------------------------------------------------------------------------------------------------------------------- Total 71 48 140 96 0 96 1.4 1.5 10 Heceta Island KETCHIKAN 12 12 60 24 0 24 2.0 2.5 KLAWOCK 8 8 16 8 0 8 1.0 2.0 MEYERS CHUCK 6 6 28 22 0 22 4.0 1.3 --------------------------------------------------------------------------------------------------------------------------------------------------------------------------------------------------------- Total 25 25 104 54 0 54 2.1 1.9 11 SW. Coast and Islands CRAIG 43 35 78 43 0 43 1.0 1.8 HYDABURG 22 11 34 22 0 22 1.0 1.5 KETCHIKAN 24 18 54 30 0 30 1.3 1.8 KLAWOCK 24 16 47 16 0 16 .7 3.0 --------------------------------------------------------------------------------------------------------------------------------------------------------------------------------------------------------- Total 113 80 213 112 0 112 1.0 2.0 12 SE. Prince of Wales OUTSIDE ALASKA 5 0 22 0 0 0 .0 .0 CRAIG 52 26 633 52 0 52 1.0 12.2 JUNEAU 5 5 5 5 0 5 1.0 1.0 KETCHIKAN 54 24 133 30 0 30 .6 4.4 KLAWOCK 31 16 79 16 0 16 .5 5.0 THORNE BAY 5 5 5 5 0 5 1.0 1.0 --------------------------------------------------------------------------------------------------------------------------------------------------------------------------------------------------------- Total 153 75 875 107 0 107 .7 8.1

Page 28
2000-2001 Southeast Deer Survey Estimated Totals for Major by Community of Residence
Total Community Number of Number Number Number Number Average Average of Number Hunters of Days of of of Deer/ Days/ Major Hunt Area Residence of Hunters Successful Hunted Bucks Does Deer Hunter Deer ________________________ __________ __________ __________ ______ ______ _______ _______ __________ __________ 13 Central Prince of Wales OUTSIDE ALASKA 55 22 301 22 27 49 .9 6.1 OTHER ALASKA 11 0 96 0 0 0 .0 .0 COFFMAN COVE 16 16 32 16 0 16 1.0 2.0 CRAIG 399 243 1525 373 35 407 1.0 3.7 HOLLIS 35 25 140 50 10 60 1.7 2.3 HYDABURG 11 0 11 0 0 0 .0 .0 JUNEAU 9 9 37 19 0 19 2.0 2.0 KETCHIKAN 193 133 759 271 0 271 1.4 2.8 KLAWOCK 142 79 504 142 0 142 1.0 3.6 MEYERS CHUCK 6 6 6 6 0 6 1.0 1.0 PETERSBURG 4 4 4 4 0 4 1.0 1.0 THORNE BAY 220 149 2448 271 9 280 1.3 8.7 WRANGELL 5 0 5 0 0 0 .0 .0 --------------------------------------------------------------------------------------------------------------------------------------------------------------------------------------------------------- Total 1105 686 5868 1173 81 1254 1.1 4.7 14 Northcentral Price of Wales OUTSIDE ALASKA 16 5 71 0 44 44 2.7 1.6 OTHER ALASKA 6 0 17 0 0 0 .0 .0 COFFMAN COVE 56 48 360 112 0 112 2.0 3.2 CRAIG 251 130 1101 147 17 165 .7 6.7 HAINES 5 5 9 0 5 5 1.0 2.0 HOLLIS 5 5 5 5 0 5 1.0 1.0 JUNEAU 14 9 65 19 0 19 1.3 3.5 KETCHIKAN 235 108 1073 163 12 175 .7 6.1 KLAWOCK 126 55 283 63 8 71 .6 4.0 METLAKATLA 6 6 50 6 6 13 2.0 4.0 NAUKATI BAY 57 32 402 38 6 45 .8 9.0 PETERSBURG 4 4 18 4 0 4 1.0 4.5 SITKA 11 11 54 22 5 27 2.5 2.0 THORNE BAY 65 23 257 19 5 23 .4 11.0 --------------------------------------------------------------------------------------------------------------------------------------------------------------------------------------------------------- Total 858 443 3765 598 108 706 .8 5.3 15 Northern P of W - Kosciusko OUTSIDE ALASKA 11 0 82 0 0 0 .0 .0 OTHER ALASKA 11 6 51 17 0 17 1.5 3.0 CRAIG 95 52 234 78 0 78 .8 3.0 EDNA BAY 5 5 60 5 0 5 1.0 12.0 KETCHIKAN 163 90 729 163 0 163 1.0 4.5 KLAWOCK 16 16 16 16 0 16 1.0 1.0 MEYERS CHUCK 6 0 6 0 0 0 .0 .0 NAUKATI BAY 26 19 45 19 0 19 .7 2.3 PETERSBURG 49 27 208 40 4 44 .9 4.7 POINT BAKER 17 8 50 8 0 8 .5 6.3 THORNE BAY 19 14 117 14 0 14 .8 8.3 WHALE PASS 33 24 405 61 0 61 1.9 6.6 WRANGELL 60 37 198 78 32 110 1.8 1.8 --------------------------------------------------------------------------------------------------------------------------------------------------------------------------------------------------------- Total 509 297 2201 499 37 536 1.1 4.1 16 Mainland/Fanshaw-LeConte KETCHIKAN 6 0 12 0 0 0 .0 .0 PETERSBURG 106 31 394 40 0 40 .4 9.9 --------------------------------------------------------------------------------------------------------------------------------------------------------------------------------------------------------- Total 112 31 406 40 0 40 .4 10.2 17 Mainland/LeConte-Stikine PETERSBURG 9 0 35 0 0 0 .0 .0 WRANGELL 5 0 46 0 0 0 .0 .0 --------------------------------------------------------------------------------------------------------------------------------------------------------------------------------------------------------- Total 13 0 81 0 0 0 .0 .0 18 Mainland/South of Stikine JUNEAU 5 0 5 0 0 0 .0 .0 KETCHIKAN 12 0 12 0 0 0 .0 .0 WRANGELL 14 5 51 5 0 5 .3 10.2 --------------------------------------------------------------------------------------------------------------------------------------------------------------------------------------------------------- Total 30 5 67 5 0 5 .2 13.6

Page 29
2000-2001 Southeast Deer Survey Estimated Totals for Major by Community of Residence
Total Community Number of Number Number Number Number Average Average of Number Hunters of Days of of of Deer/ Days/ Major Hunt Area Residence of Hunters Successful Hunted Bucks Does Deer Hunter Deer ________________________ __________ __________ __________ ______ ______ _______ _______ __________ __________ 19 Sumner/Ernest Islands OTHER ALASKA 23 6 39 6 0 6 .3 6.5 CRAIG 9 9 9 9 0 9 1.0 1.0 JUNEAU 9 5 32 5 0 5 .5 6.4 KETCHIKAN 30 12 121 18 0 18 .6 6.7 PETERSBURG 129 62 434 89 0 89 .7 4.9 SITKA 16 11 97 11 0 11 .7 9.0 THORNE BAY 5 0 5 0 0 0 .0 .0 WRANGELL 455 248 2967 460 18 478 1.1 6.2 --------------------------------------------------------------------------------------------------------------------------------------------------------------------------------------------------------- Total 675 352 3704 596 18 615 .9 6.0 20 Mitkof Island JUNEAU 9 5 19 5 0 5 .5 4.0 PETERSBURG 354 137 1312 146 18 164 .5 8.0 SITKA 5 0 38 0 0 0 .0 .0 --------------------------------------------------------------------------------------------------------------------------------------------------------------------------------------------------------- Total 369 142 1368 151 18 169 .5 8.1 22 Sullivan-Endicott River HAINES 9 0 9 0 0 0 .0 .0 --------------------------------------------------------------------------------------------------------------------------------------------------------------------------------------------------------- Total 9 0 9 0 0 0 .0 .0 25 Mainland/Juneau OUTSIDE ALASKA 5 5 11 5 0 5 1.0 2.0 JUNEAU 88 5 153 5 0 5 .1 30.6 --------------------------------------------------------------------------------------------------------------------------------------------------------------------------------------------------------- Total 93 10 164 10 0 10 .1 16.4 26 Shelter-Lincoln Islands OUTSIDE ALASKA 11 0 33 0 0 0 .0 .0 JUNEAU 157 51 389 46 19 65 .4 6.0 --------------------------------------------------------------------------------------------------------------------------------------------------------------------------------------------------------- Total 168 51 422 46 19 65 .4 6.5 27 Douglas Island OTHER ALASKA 6 0 6 0 0 0 .0 .0 HAINES 5 0 5 0 0 0 .0 .0 JUNEAU 602 116 1629 97 51 148 .2 11.0 PETERSBURG 4 4 27 4 0 4 1.0 6.8 --------------------------------------------------------------------------------------------------------------------------------------------------------------------------------------------------------- Total 616 120 1666 102 51 153 .2 11.0 28 Mainland/Taku-Holkam JUNEAU 14 5 19 14 0 14 1.0 1.3 --------------------------------------------------------------------------------------------------------------------------------------------------------------------------------------------------------- Total 14 5 19 14 0 14 1.0 1.3 30 Sitka Sound OUTSIDE ALASKA 22 5 131 22 27 49 2.3 2.7 OTHER ALASKA 6 0 6 0 0 0 .0 .0 HAINES 5 5 5 5 0 5 1.0 1.0 JUNEAU 14 5 19 5 0 5 .3 4.0 KETCHIKAN 12 12 175 6 6 12 1.0 14.5 SITKA 749 431 2639 598 232 829 1.1 3.2 --------------------------------------------------------------------------------------------------------------------------------------------------------------------------------------------------------- Total 807 458 2974 635 265 900 1.1 3.3 31 Kruzof Island OTHER ALASKA 17 6 45 0 6 6 .3 7.5 HAINES 9 9 36 32 5 36 4.0 1.0 JUNEAU 14 14 32 5 9 14 1.0 2.3 PETERSBURG 4 4 0 4 0 4 1.0 .0 PORT ALEXANDER 10 0 10 0 0 0 .0 .0 SITKA 232 151 522 199 70 269 1.2 1.9 --------------------------------------------------------------------------------------------------------------------------------------------------------------------------------------------------------- Total 286 184 646 240 89 330 1.2 2.0 32 W. Baranof Is. JUNEAU 19 0 79 0 0 0 .0 .0 KETCHIKAN 6 6 6 6 0 6 1.0 1.0 SITKA 178 108 372 108 65 172 1.0 2.2 --------------------------------------------------------------------------------------------------------------------------------------------------------------------------------------------------------- Total 202 114 456 114 65 178 .9 2.6

Page 30
2000-2001 Southeast Deer Survey Estimated Totals for Major by Community of Residence
Total Community Number of Number Number Number Number Average Average of Number Hunters of Days of of of Deer/ Days/ Major Hunt Area Residence of Hunters Successful Hunted Bucks Does Deer Hunter Deer ________________________ __________ __________ __________ ______ ______ _______ _______ __________ __________ 33 Peril Strait OUTSIDE ALASKA 5 0 22 0 0 0 .0 .0 ANGOON 22 22 96 30 7 37 1.7 2.6 ELFIN COVE 4 0 8 0 0 0 .0 .0 GUSTAVUS 4 0 4 0 0 0 .0 .0 HAINES 14 14 46 18 5 23 1.7 2.0 HOONAH 8 0 15 0 0 0 .0 .0 JUNEAU 46 28 176 46 9 56 1.2 3.2 KETCHIKAN 12 12 48 12 6 18 1.5 2.7 SITKA 458 264 1427 366 124 490 1.1 2.9 SKAGWAY 6 6 42 3 3 6 1.0 7.0 TENAKEE SPRINGS 4 0 8 0 0 0 .0 .0 YAKUTAT 4 0 22 0 0 0 .0 .0 --------------------------------------------------------------------------------------------------------------------------------------------------------------------------------------------------------- Total 587 346 1913 475 154 630 1.1 3.0 34 W. Chichagof/Yakobi OUTSIDE ALASKA 5 0 16 0 0 0 .0 .0 OTHER ALASKA 6 6 28 17 0 17 3.0 1.7 ELFIN COVE 15 12 69 12 8 19 1.3 3.6 GUSTAVUS 14 7 18 7 0 7 .5 2.5 HAINES 32 27 100 50 9 59 1.9 1.7 HOONAH 8 0 23 0 0 0 .0 .0 JUNEAU 111 60 667 97 23 120 1.1 5.5 KETCHIKAN 6 0 6 0 0 0 .0 .0 PELICAN 33 24 128 43 9 52 1.6 2.5 SITKA 43 32 81 48 5 54 1.2 1.5 --------------------------------------------------------------------------------------------------------------------------------------------------------------------------------------------------------- Total 274 168 1136 274 55 329 1.2 3.5 35 NE Chichagof Island OTHER ALASKA 28 23 96 23 6 28 1.0 3.4 ANGOON 7 7 89 7 0 7 1.0 12.7 GAME CREEK 9 6 48 9 9 18 2.0 2.7 GUSTAVUS 11 0 18 0 0 0 .0 .0 HAINES 23 14 64 27 9 36 1.6 1.8 HOONAH 186 147 1749 387 147 534 2.9 3.3 JUNEAU 296 190 1014 278 51 329 1.1 3.1 SITKA 11 0 22 0 0 0 .0 .0 TENAKEE SPRINGS 12 4 116 4 0 4 .3 29.0 WHITESTONE CAMP 33 22 169 33 0 33 1.0 5.1 --------------------------------------------------------------------------------------------------------------------------------------------------------------------------------------------------------- Total 616 412 3384 768 222 989 1.6 3.4 36 S. Shore Tenakee OTHER ALASKA 6 6 28 6 6 11 2.0 2.5 CUBE COVE CAMP 7 7 130 11 0 11 1.5 11.8 HAINES 18 14 82 46 5 50 2.8 1.6 JUNEAU 97 56 241 74 19 93 1.0 2.6 PELICAN 5 5 5 5 0 5 1.0 1.0 SITKA 11 0 22 0 0 0 .0 .0 SKAGWAY 3 0 22 0 0 0 .0 .0 TENAKEE SPRINGS 24 20 188 16 16 32 1.3 5.9 --------------------------------------------------------------------------------------------------------------------------------------------------------------------------------------------------------- Total 171 107 717 156 45 201 1.2 3.6 37 E. and S. Baranof Island OUTSIDE ALASKA 5 0 55 0 0 0 .0 .0 HAINES 5 5 14 14 0 14 3.0 1.0 HIDDEN FALLS HATCHERY 1 1 3 2 0 2 2.0 1.5 JUNEAU 37 23 148 37 0 37 1.0 4.0 KAKE 8 0 16 0 0 0 .0 .0 KETCHIKAN 12 12 96 24 6 30 2.5 3.2 PETERSBURG 4 4 4 9 0 9 2.0 .5 PORT ALEXANDER 20 10 60 20 0 20 1.0 3.0 SITKA 54 38 172 65 16 81 1.5 2.1 --------------------------------------------------------------------------------------------------------------------------------------------------------------------------------------------------------- Total 146 93 568 170 22 192 1.3 2.9 38 N. Admiralty Island OTHER ALASKA 17 11 34 17 0 17 1.0 2.0 JUNEAU 542 268 1615 343 102 444 .8 3.6 YAKUTAT 4 4 13 4 4 9 2.0 1.5 --------------------------------------------------------------------------------------------------------------------------------------------------------------------------------------------------------- Total 563 284 1663 364 106 470 .8 3.5

Page 31
2000-2001 Southeast Deer Survey Estimated Totals for Major by Community of Residence
Total Community Number of Number Number Number Number Average Average of Number Hunters of Days of of of Deer/ Days/ Major Hunt Area Residence of Hunters Successful Hunted Bucks Does Deer Hunter Deer ________________________ __________ __________ __________ ______ ______ _______ _______ __________ __________ 39 SE. Admiralty Island OUTSIDE ALASKA 5 5 27 5 0 5 1.0 5.4 JUNEAU 69 51 301 60 28 88 1.3 3.4 KAKE 47 39 102 86 16 102 2.2 1.0 PETERSBURG 93 66 403 151 27 177 1.9 2.3 --------------------------------------------------------------------------------------------------------------------------------------------------------------------------------------------------------- Total 215 162 833 302 70 372 1.7 2.2 40 W. Admiralty Island OUTSIDE ALASKA 5 5 11 16 5 22 4.0 .5 ANGOON 30 30 177 52 37 89 3.0 2.0 CUBE COVE CAMP 28 28 102 81 14 95 3.4 1.1 GUSTAVUS 4 0 4 0 0 0 .0 .0 HAINES 5 5 23 9 0 9 2.0 2.5 HIDDEN FALLS HATCHERY 1 1 1 1 0 1 1.0 1.0 JUNEAU 143 69 824 120 32 153 1.1 5.4 KETCHIKAN 6 0 12 0 0 0 .0 .0 WRANGELL 9 9 60 23 9 32 3.5 1.9 --------------------------------------------------------------------------------------------------------------------------------------------------------------------------------------------------------- Total 231 147 1213 302 98 400 1.7 3.0 41 Seymour Canal OTHER ALASKA 6 6 0 6 0 6 1.0 .0 ANGOON 7 7 44 22 0 22 3.0 2.0 HAINES 9 9 128 14 5 18 2.0 7.0 JUNEAU 356 185 1365 236 88 324 .9 4.2 PETERSBURG 9 4 18 4 4 9 1.0 2.0 --------------------------------------------------------------------------------------------------------------------------------------------------------------------------------------------------------- Total 387 212 1555 282 97 379 1.0 4.1 42 Icy Strait OTHER ALASKA 17 11 51 6 6 11 .7 4.5 EXCURSION INLET CAMP 2 0 4 0 0 0 .0 .0 GUSTAVUS 61 29 176 22 29 50 .8 3.5 HAINES 14 9 36 9 5 14 1.0 2.7 HOONAH 85 77 472 170 39 209 2.5 2.3 JUNEAU 42 32 204 46 14 60 1.4 3.4 KETCHIKAN 6 6 6 6 0 6 1.0 1.0 SKAGWAY 3 0 16 0 0 0 .0 .0 --------------------------------------------------------------------------------------------------------------------------------------------------------------------------------------------------------- Total 230 165 965 259 92 351 1.5 2.8 45 Yakutat Forelands YAKUTAT 4 0 9 0 0 0 .0 .0 --------------------------------------------------------------------------------------------------------------------------------------------------------------------------------------------------------- Total 4 0 9 0 0 0 .0 .0 50 Kuiu/Coronation Islands KETCHIKAN 12 6 12 6 0 6 .5 2.0 PETERSBURG 13 4 44 4 0 4 .3 11.0 POINT BAKER 17 17 101 17 0 17 1.0 6.0 Total 42 27 157 27 0 27 .6 5.8 51 Kupreanof Island CRAIG 9 9 43 9 0 9 1.0 4.8 JUNEAU 5 5 14 5 0 5 1.0 2.8 KAKE 47 16 454 24 0 24 .5 18.9 KETCHIKAN 18 0 78 0 0 0 .0 .0 PETERSBURG 155 80 541 142 0 142 .9 3.8 POINT BAKER 8 8 25 17 0 17 2.0 1.5 WRANGELL 14 5 55 9 0 9 .7 6.1 --------------------------------------------------------------------------------------------------------------------------------------------------------------------------------------------------------- Total 256 122 1211 205 0 205 .8 5.9

Page 32
2000-2001 Southeast Deer Survey Estimated Totals for Major by Community of Residence
Total Community Number of Number Number Number Number Average Average of Number Hunters of Days of of of Deer/ Days/ Major Hunt Area Residence of Hunters Successful Hunted Bucks Does Deer Hunter Deer ________________________ __________ __________ __________ ______ ______ _______ _______ __________ __________ 99 Missing/Unknown OUTSIDE ALASKA 16 16 334 16 0 16 1.0 20.9 OTHER ALASKA 17 17 141 23 6 28 1.7 5.0 ANGOON 7 7 44 15 15 30 4.0 1.5 CRAIG 9 9 367 17 0 17 2.0 21.6 ELFIN COVE 8 8 115 15 0 15 2.0 7.5 HAINES 5 5 41 9 0 9 2.0 4.5 JUNEAU 23 23 265 51 9 60 2.6 4.4 KETCHIKAN 48 48 313 84 0 84 1.8 3.7 KLAWOCK 24 24 24 24 0 24 1.0 1.0 MEYERS CHUCK 6 6 6 6 0 6 1.0 1.0 PETERSBURG 9 9 40 9 0 9 1.0 4.5 SITKA 32 32 70 32 16 48 1.5 1.4 SKAGWAY 3 3 29 3 0 3 1.0 9.7 THORNE BAY 14 14 103 19 0 19 1.3 5.5 WRANGELL 18 18 32 18 5 23 1.3 1.4 --------------------------------------------------------------------------------------------------------------------------------------------------------------------------------------------------------- Total 239 239 1924 341 50 392 1.6 4.9 --------------------------------------------------------------------------------------------------------------------------------------------------------------------------------------------------------- Grand Total 11015 5796 45990 8779 1768 10547 1.0 4.4

Page 33
2000-2001 Southeast Deer Survey Estimated Totals for Community of Residence by Major
Total Community Number of Number Number Number Number Average Average of Number Hunters of Days of of of Deer/ Days/ Residence Major Hunt Area of Hunters Successful Hunted Bucks Does Deer Hunter Deer ____________________ ________________________ __________ __________ __________ ______ ______ _______ __________ __________ OUTSIDE ALASKA 12 SE. Prince of Wales 5 0 22 0 0 0 .0 .0 13 Central Prince of Wales 55 22 301 22 27 49 .9 6.1 14 Northcentral Prince of Wales 16 5 71 0 44 44 2.7 1.6 15 Northern P of W - Kosciusko 11 0 82 0 0 0 .0 .0 25 Mainland/Juneau 5 5 11 5 0 5 1.0 2.0 26 Shelter-Lincoln Islands 11 0 33 0 0 0 .0 .0 30 Sitka Sound 22 5 131 22 27 49 2.3 2.7 33 Peril Strait 5 0 22 0 0 0 .0 .0 34 W. Chichagof/Yakobi 5 0 16 0 0 0 .0 .0 37 E. and S. Baranof Island 5 0 55 0 0 0 .0 .0 39 SE. Admiralty Island 5 5 27 5 0 5 1.0 5.4 40 W. Admiralty Island 5 5 11 16 5 22 4.0 .5 99 Missing/Unknown 16 16 334 16 0 16 1.0 20.9 --------------------------------------------------------------------------------------------------------------------------------------------------------------------------------------------------------- Total 170 66 1116 88 104 192 1.1 5.9 OTHER ALASKA 1 Gravina Island 6 0 6 0 0 0 .0 .0 4 Southern Revilla 11 0 17 0 0 0 .0 .0 13 Central Prince of Wales 11 0 96 0 0 0 .0 .0 14 Northcentral Prince of Wales 6 0 17 0 0 0 .0 .0 15 Northern P of W - Kosciusko 11 6 51 17 0 17 1.5 3.0 19 Sumner/Ernest Islands 23 6 39 6 0 6 .3 6.5 27 Douglas Island 6 0 6 0 0 0 .0 .0 30 Sitka Sound 6 0 6 0 0 0 .0 .0 31 Kruzof Island 17 6 45 0 6 6 .3 7.5 34 W. Chichagof/Yakobi 6 6 28 17 0 17 3.0 1.7 35 NE Chichagof Island 28 23 96 23 6 28 1.0 3.4 36 S. Shore Tenakee 6 6 28 6 6 11 2.0 2.5 38 N. Admiralty Island 17 11 34 17 0 17 1.0 2.0 41 Seymour Canal 6 6 0 6 0 6 1.0 .0 42 Icy Strait 17 11 51 6 6 11 .7 4.5 99 Missing/Unknown 17 17 141 23 6 28 1.7 5.0 --------------------------------------------------------------------------------------------------------------------------------------------------------------------------------------------------------- Total 192 96 660 118 28 147 .8 4.5 ANGOON 33 Peril Strait 22 22 96 30 7 37 1.7 2.6 35 NE Chichagof Island 7 7 89 7 0 7 1.0 12.7 40 W. Admiralty Island 30 30 177 52 37 89 3.0 2.0 41 Seymour Canal 7 7 44 22 0 22 3.0 2.0 99 Missing/Unknown 7 7 44 15 15 30 4.0 1.5 --------------------------------------------------------------------------------------------------------------------------------------------------------------------------------------------------------- Total 74 74 450 126 59 185 2.5 2.4 COFFMAN COVE 13 Central Prince of Wales 16 16 32 16 0 16 1.0 2.0 14 Northcentral Prince of Wales 56 48 528 112 0 112 2.0 4.7 --------------------------------------------------------------------------------------------------------------------------------------------------------------------------------------------------------- Total 72 64 560 128 0 128 1.8 4.4 CRAIG 9 Outside Islands 52 43 121 87 0 87 1.7 1.4 11 SW. Coast and Islands 43 35 78 43 0 43 1.0 1.8 12 SE. Prince of Wales 52 26 633 52 0 52 1.0 12.2 13 Central Prince of Wales 399 243 1525 373 35 407 1.0 3.7 14 Northcentral Prince of Wales 251 130 1101 147 17 165 .7 6.7 15 Northern P of W - Kosciusko 95 52 234 78 0 78 .8 3.0 19 Sumner/Ernest Islands 9 9 9 9 0 9 1.0 1.0 51 Kupreanof Island 9 9 43 9 0 9 1.0 5.0 99 Missing/Unknown 9 9 199 17 0 17 2.0 11.5 --------------------------------------------------------------------------------------------------------------------------------------------------------------------------------------------------------- Total 919 555 3943 815 52 867 .9 4.5 CUBE COVE CAMP 36 S. Shore Tenakee 7 7 130 11 0 11 1.5 11.8 40 W. Admiralty Island 28 28 102 81 14 95 3.4 1.1 --------------------------------------------------------------------------------------------------------------------------------------------------------------------------------------------------------- Total 35 35 231 91 14 105 3.0 2.2 EDNA BAY 15 Northern P of W - Kosciusko 5 5 60 5 0 5 1.0 12.0 --------------------------------------------------------------------------------------------------------------------------------------------------------------------------------------------------------- Total 5 5 60 5 0 5 1.0 12.0
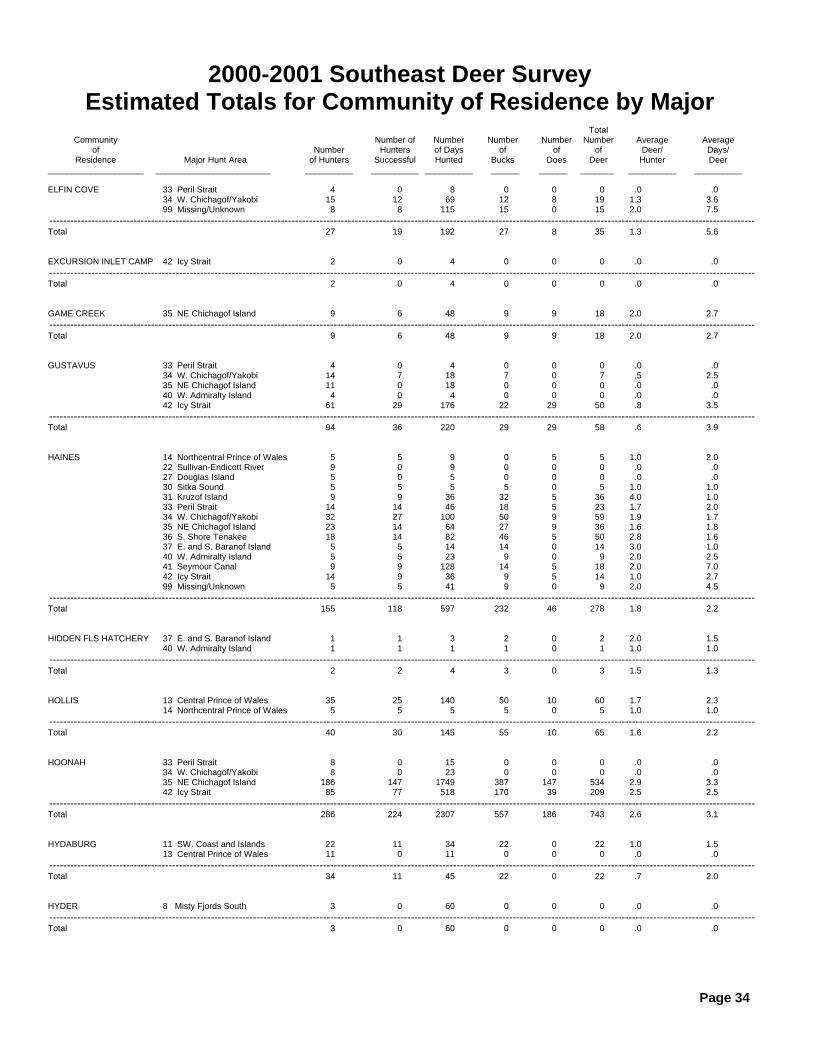
Page 34
2000-2001 Southeast Deer Survey Estimated Totals for Community of Residence by Major
Total Community Number of Number Number Number Number Average Average of Number Hunters of Days of of of Deer/ Days/ Residence Major Hunt Area of Hunters Successful Hunted Bucks Does Deer Hunter Deer ____________________ ________________________ __________ __________ __________ ______ ______ _______ __________ __________ ELFIN COVE 33 Peril Strait 4 0 8 0 0 0 .0 .0 34 W. Chichagof/Yakobi 15 12 69 12 8 19 1.3 3.6 99 Missing/Unknown 8 8 115 15 0 15 2.0 7.5 --------------------------------------------------------------------------------------------------------------------------------------------------------------------------------------------------------- Total 27 19 192 27 8 35 1.3 5.6 EXCURSION INLET CAMP 42 Icy Strait 2 0 4 0 0 0 .0 .0 --------------------------------------------------------------------------------------------------------------------------------------------------------------------------------------------------------- Total 2 0 4 0 0 0 .0 .0 GAME CREEK 35 NE Chichagof Island 9 6 48 9 9 18 2.0 2.7 --------------------------------------------------------------------------------------------------------------------------------------------------------------------------------------------------------- Total 9 6 48 9 9 18 2.0 2.7 GUSTAVUS 33 Peril Strait 4 0 4 0 0 0 .0 .0 34 W. Chichagof/Yakobi 14 7 18 7 0 7 .5 2.5 35 NE Chichagof Island 11 0 18 0 0 0 .0 .0 40 W. Admiralty Island 4 0 4 0 0 0 .0 .0 42 Icy Strait 61 29 176 22 29 50 .8 3.5 --------------------------------------------------------------------------------------------------------------------------------------------------------------------------------------------------------- Total 94 36 220 29 29 58 .6 3.9 HAINES 14 Northcentral Prince of Wales 5 5 9 0 5 5 1.0 2.0 22 Sullivan-Endicott River 9 0 9 0 0 0 .0 .0 27 Douglas Island 5 0 5 0 0 0 .0 .0 30 Sitka Sound 5 5 5 5 0 5 1.0 1.0 31 Kruzof Island 9 9 36 32 5 36 4.0 1.0 33 Peril Strait 14 14 46 18 5 23 1.7 2.0 34 W. Chichagof/Yakobi 32 27 100 50 9 59 1.9 1.7 35 NE Chichagof Island 23 14 64 27 9 36 1.6 1.8 36 S. Shore Tenakee 18 14 82 46 5 50 2.8 1.6 37 E. and S. Baranof Island 5 5 14 14 0 14 3.0 1.0 40 W. Admiralty Island 5 5 23 9 0 9 2.0 2.5 41 Seymour Canal 9 9 128 14 5 18 2.0 7.0 42 Icy Strait 14 9 36 9 5 14 1.0 2.7 99 Missing/Unknown 5 5 41 9 0 9 2.0 4.5 --------------------------------------------------------------------------------------------------------------------------------------------------------------------------------------------------------- Total 155 118 597 232 46 278 1.8 2.2 HIDDEN FLS HATCHERY 37 E. and S. Baranof Island 1 1 3 2 0 2 2.0 1.5 40 W. Admiralty Island 1 1 1 1 0 1 1.0 1.0 --------------------------------------------------------------------------------------------------------------------------------------------------------------------------------------------------------- Total 2 2 4 3 0 3 1.5 1.3 HOLLIS 13 Central Prince of Wales 35 25 140 50 10 60 1.7 2.3 14 Northcentral Prince of Wales 5 5 5 5 0 5 1.0 1.0 --------------------------------------------------------------------------------------------------------------------------------------------------------------------------------------------------------- Total 40 30 145 55 10 65 1.6 2.2 HOONAH 33 Peril Strait 8 0 15 0 0 0 .0 .0 34 W. Chichagof/Yakobi 8 0 23 0 0 0 .0 .0 35 NE Chichagof Island 186 147 1749 387 147 534 2.9 3.3 42 Icy Strait 85 77 518 170 39 209 2.5 2.5 --------------------------------------------------------------------------------------------------------------------------------------------------------------------------------------------------------- Total 286 224 2307 557 186 743 2.6 3.1 HYDABURG 11 SW. Coast and Islands 22 11 34 22 0 22 1.0 1.5 13 Central Prince of Wales 11 0 11 0 0 0 .0 .0 --------------------------------------------------------------------------------------------------------------------------------------------------------------------------------------------------------- Total 34 11 45 22 0 22 .7 2.0 HYDER 8 Misty Fjords South 3 0 60 0 0 0 .0 .0 --------------------------------------------------------------------------------------------------------------------------------------------------------------------------------------------------------- Total 3 0 60 0 0 0 .0 .0

Page 35
2000-2001 Southeast Deer Survey Estimated Totals for Community of Residence by Major
Total Community Number of Number Number Number Number Average Average of Number Hunters of Days of of of Deer/ Days/ Residence Major Hunt Area of Hunters Successful Hunted Bucks Does Deer Hunter Deer ____________________ ________________________ __________ __________ __________ ______ ______ _______ __________ __________ JUNEAU 9 Outside Islands 5 5 5 9 0 9 2.0 .5 12 SE. Prince of Wales 5 5 5 5 0 5 1.0 1.0 13 Central Prince of Wales 9 9 37 19 0 19 2.0 2.0 14 Northcentral Prince of Wales 14 9 65 19 0 19 1.3 3.5 18 Mainland/South of Stikine 5 0 5 0 0 0 .0 .0 19 Sumner/Ernest Islands 9 5 32 5 0 5 .5 6.4 20 Mitkof Island 9 5 19 5 0 5 .5 4.0 25 Mainland/Juneau 88 5 153 5 0 5 .1 30.6 26 Shelter-Lincoln Islands 157 51 389 46 19 65 .4 6.0 27 Douglas Island 602 116 1629 97 51 148 .2 11.0 28 Mainland/Taku-Holkam 14 5 19 14 0 14 1.0 1.3 30 Sitka Sound 14 5 19 5 0 5 .3 4.0 31 Kruzof Island 14 14 32 5 9 14 1.0 2.3 32 W. Baranof Is. 19 0 79 0 0 0 .0 .0 33 Peril Strait 46 28 176 46 9 56 1.2 3.2 34 W. Chichagof/Yakobi 111 60 667 97 23 120 1.1 5.5 35 NE Chichagof Island 296 190 1014 278 51 329 1.1 3.1 36 S. Shore Tenakee 97 56 241 74 19 93 1.0 2.6 37 E. and S. Baranof Island 37 23 148 37 0 37 1.0 4.0 38 N. Admiralty Island 542 268 1615 343 102 444 .8 3.6 39 SE. Admiralty Island 69 51 301 60 28 88 1.3 3.4 40 W. Admiralty Island 143 69 824 120 32 153 1.1 5.4 41 Seymour Canal 356 185 1365 236 88 324 .9 4.2 42 Icy Strait 42 32 204 46 14 60 1.4 3.4 51 Kupreanof Island 5 5 14 5 0 5 1.0 3.0 99 Missing/Unknown 23 23 199 51 9 60 2.6 3.3 --------------------------------------------------------------------------------------------------------------------------------------------------------------------------------------------------------- Total 2731 1222 9253 1625 454 2078 .8 4.4 KAKE 37 E. and S. Baranof Island 8 0 16 0 0 0 .0 .0 39 SE. Admiralty Island 47 39 102 86 16 102 2.2 1.0 51 Kupreanof Island 47 16 454 24 0 24 .5 18.9 --------------------------------------------------------------------------------------------------------------------------------------------------------------------------------------------------------- Total 102 55 572 110 16 125 1.2 4.5 KETCHIKAN 1 Gravina Island 163 24 597 36 0 36 .2 16.5 4 Southern Revilla 307 84 1857 115 0 115 .4 16.2 5 Northern Revilla 175 30 561 42 6 48 .3 11.6 6 Lower Cleveland Peninsula 84 6 181 6 0 6 .1 30.0 8 Misty Fjords South 12 0 24 0 0 0 .0 .0 9 Outside Islands 6 0 6 0 0 0 .0 .0 10 Heceta Island 12 12 60 24 0 24 2.0 2.5 11 SW. Coast and Islands 24 18 54 30 0 30 1.3 1.8 12 SE. Prince of Wales 54 24 133 30 0 30 .6 4.4 13 Central Prince of Wales 193 133 759 271 0 271 1.4 2.8 14 Northcentral Prince of Wales 235 108 1073 163 12 175 .7 6.1 15 Northern P of W - Kosciusko 163 90 729 163 0 163 1.0 4.5 16 Mainland/Fanshaw-LeConte 6 0 12 0 0 0 .0 .0 18 Mainland/South of Stikine 12 0 12 0 0 0 .0 .0 19 Sumner/Ernest Islands 30 12 121 18 0 18 .6 6.7 30 Sitka Sound 12 12 175 6 6 12 1.0 14.5 32 W. Baranof Is. 6 6 6 6 0 6 1.0 1.0 33 Peril Strait 12 12 48 12 6 18 1.5 2.7 34 W. Chichagof/Yakobi 6 0 6 0 0 0 .0 .0 37 E. and S. Baranof Island 12 12 96 24 6 30 2.5 3.2 40 W. Admiralty Island 6 0 12 0 0 0 .0 .0 42 Icy Strait 6 6 6 6 0 6 1.0 1.0 50 Kuiu/Coronation Islands 12 6 12 6 0 6 .5 2.0 51 Kupreanof Island 18 0 78 0 0 0 .0 .0 99 Missing/Unknown 48 48 313 84 0 84 1.8 3.7 --------------------------------------------------------------------------------------------------------------------------------------------------------------------------------------------------------- Total 1615 645 6932 1043 36 1079 .7 6.4 KLAWOCK 9 Outside Islands 8 0 8 0 0 0 .0 .0 10 Heceta Island 8 8 16 8 0 8 1.0 2.0 11 SW. Coast and Islands 24 16 47 16 0 16 .7 3.0 12 SE. Prince of Wales 31 16 79 16 0 16 .5 5.0 13 Central Prince of Wales 142 79 504 142 0 142 1.0 3.6 14 Northcentral Prince of Wales 126 55 283 63 8 71 .6 4.0 15 Northern P of W - Kosciusko 16 16 16 16 0 16 1.0 1.0 99 Missing/Unknown 24 24 24 24 0 24 1.0 1.0 --------------------------------------------------------------------------------------------------------------------------------------------------------------------------------------------------------- Total 378 212 976 283 8 291 .8 3.3

Page 36
2000-2001 Southeast Deer Survey Estimated Totals for Community of Residence by Major
Total Community Number of Number Number Number Number Average Average of Number Hunters of Days of of of Deer/ Days/ Residence Major Hunt Area of Hunters Successful Hunted Bucks Does Deer Hunter Deer ____________________ ________________________ __________ __________ __________ ______ ______ _______ __________ __________ METLAKATLA 1 Gravina Island 19 0 44 0 0 0 .0 .0 2 Annette Island 19 19 194 31 0 31 1.7 6.2 3 Duke Island 6 6 13 6 0 6 1.0 2.0 4 Southern Revilla 19 19 63 25 0 25 1.3 2.5 14 Northcentral Prince of Wales 6 6 50 6 6 13 2.0 4.0 --------------------------------------------------------------------------------------------------------------------------------------------------------------------------------------------------------- Total 69 50 363 69 6 75 1.1 4.9 MEYERS CHUCK 10 Heceta Island 6 6 28 22 0 22 4.0 1.3 13 Central Prince of Wales 6 6 6 6 0 6 1.0 1.0 15 Northern P of W - Kosciusko 6 0 6 0 0 0 .0 .0 99 Missing/Unknown 6 6 6 6 0 6 1.0 1.0 --------------------------------------------------------------------------------------------------------------------------------------------------------------------------------------------------------- Total 22 17 44 33 0 33 1.5 1.4 NAUKATI BAY 14 Northcentral Prince of Wales 57 32 402 38 6 45 .8 9.0 15 Northern P of W - Kosciusko 26 19 45 19 0 19 .7 2.3 --------------------------------------------------------------------------------------------------------------------------------------------------------------------------------------------------------- Total 83 51 447 57 6 64 .8 7.0 PELICAN 34 W. Chichagof/Yakobi 33 24 128 43 9 52 1.6 2.5 36 S. Shore Tenakee 5 5 5 5 0 5 1.0 1.0 --------------------------------------------------------------------------------------------------------------------------------------------------------------------------------------------------------- Total 38 28 132 47 9 57 1.5 2.3 PETERSBURG 13 Central Prince of Wales 4 4 4 4 0 4 1.0 1.0 14 Northcentral Prince of Wales 4 4 18 4 0 4 1.0 4.0 15 Northern P of W - Kosciusko 49 27 208 40 4 44 .9 4.7 16 Mainland/Fanshaw-LeConte 106 31 394 40 0 40 .4 9.9 17 Mainland/LeConte-Stikine 9 0 35 0 0 0 .0 .0 19 Sumner/Ernest Islands 129 62 434 89 0 89 .7 4.9 20 Mitkof Island 354 137 1312 146 18 164 .5 8.0 27 Douglas Island 4 4 27 4 0 4 1.0 6.8 31 Kruzof Island 4 4 0 4 0 4 1.0 .0 37 E. and S. Baranof Island 4 4 4 9 0 9 2.0 .5 39 SE. Admiralty Island 93 66 403 151 27 177 1.9 2.3 41 Seymour Canal 9 4 18 4 4 9 1.0 2.0 50 Kuiu/Coronation Islands 13 4 44 4 0 4 .3 11.0 51 Kupreanof Island 155 80 541 142 0 142 .9 3.8 99 Missing/Unknown 9 9 40 9 0 9 1.0 4.5 --------------------------------------------------------------------------------------------------------------------------------------------------------------------------------------------------------- Total 948 443 3483 651 53 705 .7 5.0 POINT BAKER 15 Northern P of W - Kosciusko 17 8 50 8 0 8 .5 6.3 50 Kuiu/Coronation Islands 17 17 101 17 0 17 1.0 6.0 51 Kupreanof Island 8 8 25 17 0 17 2.0 1.5 --------------------------------------------------------------------------------------------------------------------------------------------------------------------------------------------------------- Total 42 34 176 42 0 42 1.0 4.2 PORT ALEXANDER 31 Kruzof Island 10 0 10 0 0 0 .0 .0 37 E. and S. Baranof Island 20 10 60 20 0 20 1.0 3.0 --------------------------------------------------------------------------------------------------------------------------------------------------------------------------------------------------------- Total 30 10 70 20 0 20 .7 3.5 SITKA 14 Northcentral Prince of Wales 11 11 54 22 5 27 2.5 2.0 19 Sumner/Ernest Islands 16 11 97 11 0 11 .7 9.0 20 Mitkof Island 5 0 38 0 0 0 .0 .0 30 Sitka Sound 749 431 2639 598 232 829 1.1 3.2 31 Kruzof Island 232 151 522 199 70 269 1.2 1.9 32 W. Baranof Is. 178 108 372 108 65 172 1.0 2.2 33 Peril Strait 458 264 1427 366 124 490 1.1 2.9 34 W. Chichagof/Yakobi 43 32 81 48 5 54 1.2 1.5 35 NE Chichagof Island 11 0 22 0 0 0 .0 .0 36 S. Shore Tenakee 11 0 22 0 0 0 .0 .0 37 E. and S. Baranof Island 54 38 172 65 16 81 1.5 2.1 99 Missing/Unknown 32 32 70 32 16 48 1.5 1.4 --------------------------------------------------------------------------------------------------------------------------------------------------------------------------------------------------------- Total 1799 1077 5514 1449 533 1982 1.1 2.8

Page 37
2000-2001 Southeast Deer Survey Estimated Totals for Community of Residence by Major
Total Community Number of Number Number Number Number Average Average of Number Hunters of Days of of of Deer/ Days/ Residence Major Hunt Area of Hunters Successful Hunted Bucks Does Deer Hunter Deer ____________________ ________________________ __________ __________ __________ ______ ______ _______ __________ __________ SKAGWAY 33 Peril Strait 6 6 42 3 3 6 1.0 7.0 36 S. Shore Tenakee 3 0 22 0 0 0 .0 .0 42 Icy Strait 3 0 16 0 0 0 .0 .0 99 Missing/Unknown 3 3 29 3 0 3 1.0 9.7 --------------------------------------------------------------------------------------------------------------------------------------------------------------------------------------------------------- Total 16 10 109 6 3 10 .6 12.1 TENAKEE SPRINGS 33 Peril Strait 4 0 8 0 0 0 .0 .0 35 NE Chichagof Island 12 4 116 4 0 4 .3 29.0 36 S. Shore Tenakee 24 20 188 16 16 32 1.3 5.9 --------------------------------------------------------------------------------------------------------------------------------------------------------------------------------------------------------- Total 40 24 312 20 16 36 .9 8.7 THORNE BAY 12 SE. Prince of Wales 5 5 5 5 0 5 1.0 1.0 13 Central Prince of Wales 220 149 2448 271 9 280 1.3 8.7 14 Northcentral Prince of Wales 65 23 257 19 5 23 .4 11.0 15 Northern P of W - Kosciusko 19 14 117 14 0 14 .8 8.3 19 Sumner/Ernest Islands 5 0 5 0 0 0 .0 .0 99 Missing/Unknown 14 14 103 19 0 19 1.3 5.5 --------------------------------------------------------------------------------------------------------------------------------------------------------------------------------------------------------- Total 327 206 2934 327 14 341 1.0 8.6 WHALE PASS 15 Northern P of W - Kosciusko 33 24 405 61 0 61 1.9 6.6 --------------------------------------------------------------------------------------------------------------------------------------------------------------------------------------------------------- Total 33 24 405 61 0 61 1.9 6.6 WHITESTONE CAMP 35 NE Chichagof Island 33 22 169 33 0 33 1.0 5.2 --------------------------------------------------------------------------------------------------------------------------------------------------------------------------------------------------------- Total 33 22 169 33 0 33 1.0 5.2 WRANGELL 13 Central Prince of Wales 5 0 5 0 0 0 .0 .0 15 Northern P of W - Kosciusko 60 37 198 78 32 110 1.8 1.8 17 Mainland/LeConte-Stikine 5 0 46 0 0 0 .0 .0 18 Mainland/South of Stikine 14 5 51 5 0 5 .3 10.2 19 Sumner/Ernest Islands 455 248 2967 460 18 478 1.1 6.2 40 W. Admiralty Island 9 9 60 23 9 32 3.5 1.9 51 Kupreanof Island 14 5 55 9 0 9 .7 6.0 99 Missing/Unknown 18 18 32 18 5 23 1.3 1.4 --------------------------------------------------------------------------------------------------------------------------------------------------------------------------------------------------------- Total 580 322 3413 593 64 658 1.1 5.2 YAKUTAT 33 Peril Strait 4 0 22 0 0 0 .0 .0 38 N. Admiralty Island 4 4 13 4 4 9 2.0 1.5 45 Yakatat Forelands 4 0 9 0 0 0 .0 .0 --------------------------------------------------------------------------------------------------------------------------------------------------------------------------------------------------------- Total 13 4 45 4 4 9 .7 4.9 --------------------------------------------------------------------------------------------------------------------------------------------------------------------------------------------------------- Grand Total 11015 5796 45990 8779 1768 10547 1.0 4.4

Page 38
1999-2000 Southeast Deer Survey Estimated Totals by Wildlife Analysis Area
Total Number of Number Number Number Number Average Average Number Hunters of Days of of of Percent Deer/ Days/ Wildlife Analysis Area of Hunters Successful Hunted Bucks Does Deer Bucks Hunter Deer _____________________________________________ __________ __________ __________ ______ ______ _______ _______ __________ __________ 0101 GRAVINA IS. 187 24 646 36 0 36 100% .2 17.9 0202 ANNETTE IS. 19 19 194 31 0 31 100% 1.7 6.2 0303 DUKE IS. 6 6 13 6 0 6 100% 1.0 2.0 0404 EASTERN REVILLA IS. 48 18 85 25 0 25 100% .5 3.5 0405 THORNE ARM, REVILLA IS. 54 30 139 48 0 48 100% .9 2.9 0406 CARROL INLET 127 36 893 42 0 42 100% .3 21.1 0407 GEORGE INLET 78 6 223 6 0 6 100% .1 36.9 0408 KETCHIKAN 78 18 620 18 0 18 100% .2 17.0 0509 NAHA AREA 78 6 205 6 0 6 100% .1 34.0 0510 NEETS BAY AREA 96 24 332 36 6 42 86% .4 7.9 0612 EASTERN CLEVELAND PENIN. 18 6 36 6 0 6 100% .3 6.0 0613 HELM BAY 36 0 78 0 0 0 . .0 .0 0614 MEYERS CHUCK 6 0 12 0 0 0 . .0 .0 0822 BOCA DE QUADRA DRAINAGES 12 0 24 0 0 0 . .0 .0 0823 PEARSE CANAL 3 0 25 0 0 0 . .0 .0 0824 PEABODY MTNS. 3 0 15 0 0 0 . .0 .0 0901 SUEMEZ IS. 54 48 97 61 0 61 100% 1.1 1.6 0902 OUTSIDE ISLANDS 34 17 43 35 0 35 100% 1.0 1.2 1003 HECETA IS. 25 25 104 54 0 54 100% 2.1 1.9 1105 DALL IS. 17 9 17 9 0 9 100% .5 1.9 1106 LONG IS. 21 12 59 18 0 18 100% .9 3.3 1107 HYDABURG, HETTA INLET, SUKKWAN IS. 76 59 138 85 0 85 100% 1.1 1.6 1210 MOIRA SOUND 5 0 22 0 0 0 . .0 .0 1211 KITKUN, SOUTH ARM CHOLMONDELEY 27 9 33 26 0 26 100% 1.0 1.3 1212 CLOVER MTN. 6 6 18 6 0 6 100% 1.0 3.0 1214 SKOWL ARM, POLK INLET 114 60 802 75 0 75 100% .7 10.7 1315 KASAAN PENINSULA, THORNE BAY 433 266 2658 425 13 439 97% 1.0 6.1 1316 KARTA BAY 41 23 104 29 0 29 100% .7 3.6 1317 TWELVE MILE ARM, HARRIS RIVER 188 88 607 121 27 148 82% .8 4.1 1318 CRAIG, KLAWOCK AREAS 309 188 962 281 0 281 100% .9 3.4 1319 THORNE RIVER DRAINAGE 328 190 1302 235 41 276 85% .8 4.7 1323 WESTERN PRINCE OF WALES IS. 34 34 90 65 0 65 100% 1.9 1.4 1332 TROCADERO BAY, WATERFALL AREA 70 17 146 17 0 17 100% .2 8.8 1420 COFFMAN COVE, LUCK LAKE, RATZ HARBOR 293 163 1214 212 22 234 91% .8 5.2 1421 SWEETWATER LAKE, LOGJAM CREEK 111 72 406 80 62 142 56% 1.3 2.8 1422 STANEY CREEK, NAUKATI, SARKAR 566 254 2145 305 24 330 93% .6 6.5 1525 SOUTHERN KOSCIUSKO IS. 9 9 104 14 0 14 100% 1.5 7.5 1526 HOLBROOK MT., NORTHERN KOSCIUSKO IS. 24 9 51 14 0 14 100% .6 3.7 1527 PRINCE OF WALES EL CAPITAN AREA 56 36 169 43 0 43 100% .8 4.0 1528 SALMON BAY 72 34 223 53 4 58 92% .8 3.9 1529 MT. CALDER, RED BAY, PORT PROTECTION 209 114 713 155 0 155 100% .7 4.6 1530 EXCHANGE COVE, WHALE PASSAGE 165 97 709 172 32 204 84% 1.2 3.5 1531 TUXEKAN, MARBLE, SEA OTTER SOUND 37 18 188 50 0 50 100% 1.3 3.8 1602 FARRAGUT RIVER DRAINAGE 4 0 18 0 0 0 . .0 .0 1605 MUDDY RIVER, PATTERSON GLACIER 112 31 389 40 0 40 100% .4 9.7 1706 HORN CLIFFS, LE CONTE BAY 4 0 13 0 0 0 . .0 .0 1707 NORTH ARM OF THE STIKINE 4 0 22 0 0 0 . .0 .0 1708 STIKINE RIVER DRAINAGE 5 0 46 0 0 0 . .0 .0 1810 VIRGINIA LAKE, GARNET MTN. 5 0 18 0 0 0 . .0 .0 1814 EAGLE RIVER, S. SHORE BRADFIELD CANAL 6 0 6 0 0 0 . .0 .0 1817 VIXEN INLET, UNION BAY 20 5 43 5 0 5 100% .2 9.3 1901 NORTHERN ETOLIN IS. 90 28 224 32 0 32 100% .4 7.0 1903 WRANGELL IS. 199 79 1331 84 18 102 82% .5 13.0 1904 WORONKOFSKI AND STIKINE MOUTH IS. 14 5 14 5 0 5 100% .3 3.0 1905 ZAREMBO IS. 472 256 1914 430 0 430 100% .9 4.4 1906 KASHEVAROF ISLANDS 23 9 41 18 0 18 100% .8 2.2 1910 SOUTHERN ETOLIN IS. 55 21 180 27 0 27 100% .5 6.6 2007 MITKOF IS. 369 142 1368 151 18 169 89% .5 8.1 2202 SULLIVAN RIVER AND ISLAND 9 0 9 0 0 0 . .0 .0 2514 COWEE,DAVIES CREEKS 24 5 39 5 0 5 100% .2 7.1 2515 EAGLE RIVER-MENDENHALL RIVER AREA 37 0 56 0 0 0 . .0 .0 2517 JUNEAU AND LOWER TAKU 42 5 69 5 0 5 100% .1 15.0 2620 LINCOLN IS. 75 19 163 14 9 23 60% .3 7.0 2621 SHELTER IS. 113 32 259 32 9 42 78% .4 6.2 2722 DOUGLAS IS. 616 120 1666 102 51 153 67% .2 10.9 2823 SNETTISHAM INLET, SPEEL,WHITING RIVERS 14 5 19 14 0 14 100% 1.0 1.3 3001 NAKWASINA, NEVA STRAIT AREA 464 302 1083 361 168 528 68% 1.1 2.0 3002 SITKA ROAD SYSTEM 393 156 1443 178 87 264 67% .7 5.5 3003 SILVER BAY, DEEP INLET 145 58 442 102 11 112 90% .8 3.9 3104 NORTHERN KRUZOF IS. 164 105 441 160 74 234 68% 1.4 1.9 3105 SOUTHERN KRUZOF IS. 92 54 169 59 11 70 84% .8 2.4 3206 REDOUBT LAKE, NECKAR ISLANDS 101 44 222 38 38 76 50% .8 2.9 3207 CRAWFISH INLETS, NECKAR BAY 118 75 234 75 27 102 74% .9 2.3 3308 KOOK LAKE, SITKOH BAY, FALSE IS. 96 52 254 80 13 93 86% 1.0 2.7 3309 NORTHERN SHORE HOONAH SOUND 37 27 67 22 11 32 67% .9 2.1 3310 SOUTH ARM HOONAH SOUND 143 68 400 105 38 142 74% 1.0 2.8 3311 USHK BAY-KAKUL NARROWS 53 38 153 26 21 48 55% .9 3.2 3312 DUFFIELD PENIN., BEAR BAY 63 43 99 27 22 48 56% .8 2.0 3313 RODMAN AND SAOOK BAY DRAINAGES 90 63 279 89 26 115 77% 1.3 2.4 3314 FISH BAY DRAINAGES 160 60 309 55 16 71 77% .4 4.3 3315 CATHERINE ISLAND, LAKE EVA, HANUS BAY 55 40 227 42 3 45 93% .8 5.0 3416 KHAZ PENIN., SLOCUM ARM 46 41 92 66 5 72 92% 1.6 1.3 3417 WEST COAST CHICHAGOF 78 47 360 76 28 104 73% 1.3 3.5 3418 YAKOBI IS. 60 37 137 55 9 65 85% 1.1 2.1 3419 UPPER LISIANSKI INLET, LISIANSKI RIVER 38 24 117 24 5 28 84% .8 4.1

Page 39
1999-2000 Southeast Deer Survey Estimated Totals by Wildlife Analysis Area
Total Number of Number Number Number Number Average Average Number Hunters of Days of of of Percent Deer/ Days/ Wildlife Analysis Area of Hunters Successful Hunted Bucks Does Deer Bucks Hunter Deer _____________________________________________ __________ __________ __________ ______ ______ _______ _______ __________ __________ 3420 IDAHO INLET DRAINAGES 46 14 182 19 0 19 100% .4 9.8 3421 PORT ALTHORP, LOWER LISIANSKI, INIAN IS. 66 34 248 34 8 42 82% .6 5.9 3523 EAST SIDE PORT FREDERICK, GAME CREEK 141 110 756 150 35 185 81% 1.3 4.1 3524 HOONAH AREA 63 36 332 42 15 57 73% .9 5.8 3525 FRESHWATER BAY DRAINAGES 169 105 497 171 53 223 76% 1.3 2.2 3526 NORTH SHORE TENAKEE INLET 101 56 309 69 0 69 100% .7 4.5 3551 WHITESTONE HARBOR, FALSE BAY DRAINAGES 225 155 976 263 97 360 73% 1.6 2.7 3627 CORNER BAY, TRAP BAY 66 46 327 50 21 71 71% 1.1 4.6 3628 KADASHAN 8 4 19 4 0 4 100% .5 4.8 3629 SOUTHERN SHORE TENAKEE INLET 27 9 64 5 5 9 51% .3 6.9 3630 UPPER TENAKEE INLET 24 19 130 38 10 48 79% 2.0 2.7 3731 KELP BAY-TAKATZ BAY 42 42 220 85 11 97 88% 2.3 2.3 3732 WARM SPRINGS COAST 14 14 40 28 0 28 100% 1.9 1.4 3733 WHALE BAY DRAINAGES, WILDERNESS COAST 49 16 157 16 0 16 100% .3 9.7 3734 SOUTHERN BARANOF IS. 45 25 161 41 11 52 79% 1.1 3.1 3835 NORTHERN MANSFIELD PENIN. 312 130 817 177 46 223 79% .7 3.7 3836 HAWK INLET, YOUNG BAY DRAINAGES 288 154 753 155 56 210 74% .7 3.6 3837 WHEELER, GREENS CREEKS DRAINAGES 19 19 83 32 9 42 78% 2.3 2.0 3938 GAMBIER BAY DRAINAGES 69 46 293 73 36 109 67% 1.6 2.7 3939 PYBUS BAY DRAINAGES 93 75 288 131 29 161 82% 1.7 1.8 3940 PT. GARDNER, ELIZA HARBOR 46 41 181 70 4 75 94% 1.6 2.4 4041 WHITEWATER BAY, WILSON COVE 11 6 17 17 5 23 76% 2.1 .7 4042 ANGOON AREA 19 15 54 37 22 59 63% 3.0 .9 4043 CENTRAL ADMIRALTY LAKES 69 35 422 51 7 58 87% .8 7.3 4044 SHEE-ATIKA DRAINAGES 107 79 504 178 51 229 78% 2.1 2.2 4054 FISHERY, THAYER CREEKS 12 7 72 7 0 7 100% .6 9.8 4055 HOOD BAY, CHAIK BAY DRAINAGES 28 15 140 7 7 15 50% .5 9.5 4145 TIEDEMAN IS.-MOLE HARBOR AREA 44 35 219 54 14 68 80% 1.5 3.2 4146 WINDFALL HARBOR, SWAN COVE DRAINAGES 51 37 314 51 19 69 73% 1.4 4.5 4147 UPPER SEYMOUR CANAL 37 14 153 9 9 19 50% .5 8.3 4148 WEST SIDE GLASS PENIN. 41 18 106 18 5 23 80% .6 4.6 4149 EAST SIDE GLASS PENIN. 65 46 143 46 14 60 77% .9 2.4 4150 GRAND IS., OLIVER INLET, STINK CREEK 158 70 380 70 28 98 72% .6 3.9 4222 PT. ADOLPHUS, MUD BAY AREA 39 34 105 45 5 50 91% 1.3 2.1 4252 HUMPBACK, GALLAGHER CREEKS 94 86 540 113 54 167 68% 1.8 3.2 4253 NEKA BAY DRAINAGES 61 45 112 77 0 77 100% 1.3 1.5 4256 LEMESURIER, PLEASANT ISLANDS 80 35 208 24 33 57 41% .7 3.6 4504 YAKUTAT BAY ISLANDS 4 0 9 0 0 0 . .0 .0 5012 NORTHERN KUIU IS. 25 19 118 19 0 19 100% .8 6.3 5014 EASTERN KUIU IS., CONCLUSION IS. 8 8 17 8 0 8 100% 1.0 2.0 5017 SOUTHERN KUIU IS. 4 0 18 0 0 0 . .0 .0 5130 ROCKY PASS/KUPREANOF 21 4 77 4 0 4 100% .2 17.4 5131 HAMILTON CREEK, BIG JOHN BAY 22 0 204 0 0 0 . .0 .0 5132 KAKE AREA 43 13 321 18 0 18 100% .4 18.3 5133 WEST DUNCAN CANAL 52 30 172 34 0 34 100% .7 5.0 5134 SOUTH SHORE KUPREANOF 49 40 132 66 0 66 100% 1.4 2.0 5136 PORTAGE BAY, NW KUPREANOF 13 4 18 9 0 9 100% .7 2.0 5137 PETERSBURG CREEK 4 0 44 0 0 0 . .0 .0 5138 SOUTHERN LINDENBERG PENIN. 92 52 242 73 0 73 100% .8 3.3 9999 Blank/Missing 401 401 3196 584 99 683 85% 1.7 4.7 --------------------------------------------------------------------------------------------------------------------------------------------------------------------------------------------------------- TOTAL 12448 6448 45990 8779 1768 10547 83% .8 4.4
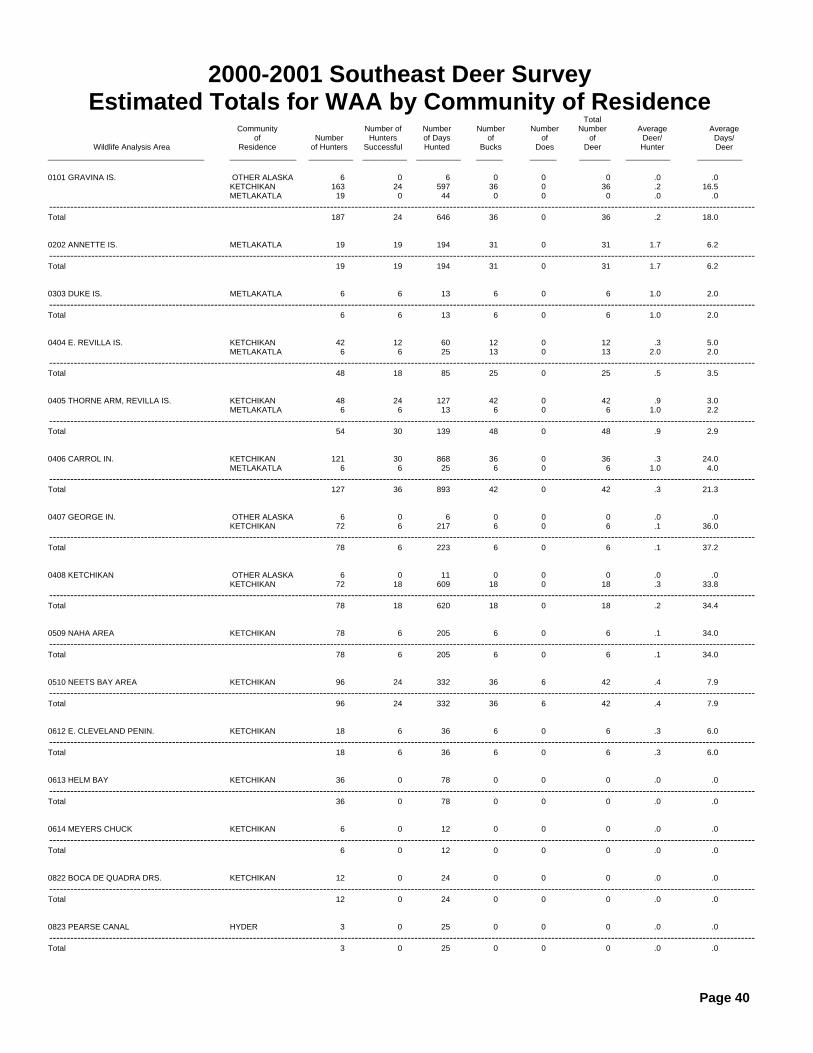
Page 40
2000-2001 Southeast Deer Survey Estimated Totals for WAA by Community of Residence
Total Community Number of Number Number Number Number Average Average of Number Hunters of Days of of of Deer/ Days/ Wildlife Analysis Area Residence of Hunters Successful Hunted Bucks Does Deer Hunter Deer ___________________________________ _______________ __________ __________ __________ ______ ______ _______ __________ __________ 0101 GRAVINA IS. OTHER ALASKA 6 0 6 0 0 0 .0 .0 KETCHIKAN 163 24 597 36 0 36 .2 16.5 METLAKATLA 19 0 44 0 0 0 .0 .0 --------------------------------------------------------------------------------------------------------------------------------------------------------------------------------------------------------- Total 187 24 646 36 0 36 .2 18.0 0202 ANNETTE IS. METLAKATLA 19 19 194 31 0 31 1.7 6.2 --------------------------------------------------------------------------------------------------------------------------------------------------------------------------------------------------------- Total 19 19 194 31 0 31 1.7 6.2 0303 DUKE IS. METLAKATLA 6 6 13 6 0 6 1.0 2.0 --------------------------------------------------------------------------------------------------------------------------------------------------------------------------------------------------------- Total 6 6 13 6 0 6 1.0 2.0 0404 E. REVILLA IS. KETCHIKAN 42 12 60 12 0 12 .3 5.0 METLAKATLA 6 6 25 13 0 13 2.0 2.0 --------------------------------------------------------------------------------------------------------------------------------------------------------------------------------------------------------- Total 48 18 85 25 0 25 .5 3.5 0405 THORNE ARM, REVILLA IS. KETCHIKAN 48 24 127 42 0 42 .9 3.0 METLAKATLA 6 6 13 6 0 6 1.0 2.2 --------------------------------------------------------------------------------------------------------------------------------------------------------------------------------------------------------- Total 54 30 139 48 0 48 .9 2.9 0406 CARROL IN. KETCHIKAN 121 30 868 36 0 36 .3 24.0 METLAKATLA 6 6 25 6 0 6 1.0 4.0 --------------------------------------------------------------------------------------------------------------------------------------------------------------------------------------------------------- Total 127 36 893 42 0 42 .3 21.3 0407 GEORGE IN. OTHER ALASKA 6 0 6 0 0 0 .0 .0 KETCHIKAN 72 6 217 6 0 6 .1 36.0 --------------------------------------------------------------------------------------------------------------------------------------------------------------------------------------------------------- Total 78 6 223 6 0 6 .1 37.2 0408 KETCHIKAN OTHER ALASKA 6 0 11 0 0 0 .0 .0 KETCHIKAN 72 18 609 18 0 18 .3 33.8 --------------------------------------------------------------------------------------------------------------------------------------------------------------------------------------------------------- Total 78 18 620 18 0 18 .2 34.4 0509 NAHA AREA KETCHIKAN 78 6 205 6 0 6 .1 34.0 --------------------------------------------------------------------------------------------------------------------------------------------------------------------------------------------------------- Total 78 6 205 6 0 6 .1 34.0 0510 NEETS BAY AREA KETCHIKAN 96 24 332 36 6 42 .4 7.9 --------------------------------------------------------------------------------------------------------------------------------------------------------------------------------------------------------- Total 96 24 332 36 6 42 .4 7.9 0612 E. CLEVELAND PENIN. KETCHIKAN 18 6 36 6 0 6 .3 6.0 --------------------------------------------------------------------------------------------------------------------------------------------------------------------------------------------------------- Total 18 6 36 6 0 6 .3 6.0 0613 HELM BAY KETCHIKAN 36 0 78 0 0 0 .0 .0 --------------------------------------------------------------------------------------------------------------------------------------------------------------------------------------------------------- Total 36 0 78 0 0 0 .0 .0 0614 MEYERS CHUCK KETCHIKAN 6 0 12 0 0 0 .0 .0 --------------------------------------------------------------------------------------------------------------------------------------------------------------------------------------------------------- Total 6 0 12 0 0 0 .0 .0 0822 BOCA DE QUADRA DRS. KETCHIKAN 12 0 24 0 0 0 .0 .0 --------------------------------------------------------------------------------------------------------------------------------------------------------------------------------------------------------- Total 12 0 24 0 0 0 .0 .0 0823 PEARSE CANAL HYDER 3 0 25 0 0 0 .0 .0 --------------------------------------------------------------------------------------------------------------------------------------------------------------------------------------------------------- Total 3 0 25 0 0 0 .0 .0

Page 41
2000-2001 Southeast Deer Survey Estimated Totals for WAA by Community of Residence
Total Community Number of Number Number Number Number Average Average of Number Hunters of Days of of of Deer/ Days/ Wildlife Analysis Area Residence of Hunters Successful Hunted Bucks Does Deer Hunter Deer ___________________________________ _______________ __________ __________ __________ ______ ______ _______ __________ __________ 0824 PEABODY MTNS. HYDER 3 0 15 0 0 0 .0 .0 --------------------------------------------------------------------------------------------------------------------------------------------------------------------------------------------------------- Total 3 0 15 0 0 0 .0 .0 0901 SUEMEZ IS. CRAIG 43 43 87 52 0 52 1.2 1.7 JUNEAU 5 5 5 9 0 9 2.0 .5 KETCHIKAN 6 0 6 0 0 0 .0 .0 --------------------------------------------------------------------------------------------------------------------------------------------------------------------------------------------------------- Total 54 48 97 61 0 61 1.1 1.6 0902 OUTSIDE IS. CRAIG 26 17 35 35 0 35 1.3 1.0 KLAWOCK 8 0 8 0 0 0 .0 .0 --------------------------------------------------------------------------------------------------------------------------------------------------------------------------------------------------------- Total 34 17 43 35 0 35 1.0 1.2 1003 HECETA IS. KETCHIKAN 12 12 60 24 0 24 2.0 2.5 KLAWOCK 8 8 16 8 0 8 1.0 2.0 MEYERS CHUCK 6 6 28 22 0 22 4.0 1.3 --------------------------------------------------------------------------------------------------------------------------------------------------------------------------------------------------------- Total 25 25 104 54 0 54 2.1 1.9 1105 DALL IS. CRAIG 9 9 9 9 0 9 1.0 1.0 KLAWOCK 8 0 8 0 0 0 .0 .0 --------------------------------------------------------------------------------------------------------------------------------------------------------------------------------------------------------- Total 17 9 17 9 0 9 .5 1.9 1106 LONG IS. CRAIG 9 0 35 0 0 0 .0 .0 KETCHIKAN 12 12 24 18 0 18 1.5 1.3 --------------------------------------------------------------------------------------------------------------------------------------------------------------------------------------------------------- Total 21 12 59 18 0 18 .9 3.3 1107 HYDABURG, HETTA IN., SUKKWAN IS. CRAIG 26 26 35 35 0 35 1.3 1.0 HYDABURG 22 11 34 22 0 22 1.0 1.5 KETCHIKAN 12 6 30 12 0 12 1.0 2.5 KLAWOCK 16 16 39 16 0 16 1.0 2.5 --------------------------------------------------------------------------------------------------------------------------------------------------------------------------------------------------------- Total 76 59 138 85 0 85 1.1 1.6 1210 MOIRA SND. OUTSIDE ALASKA 5 0 22 0 0 0 .0 .0 --------------------------------------------------------------------------------------------------------------------------------------------------------------------------------------------------------- Total 5 0 22 0 0 0 .0 .0 1211 KITKUN, S. ARM CHOLMONDELEY CRAIG 9 9 9 26 0 26 3.0 .3 KETCHIKAN 18 0 24 0 0 0 .0 .0 --------------------------------------------------------------------------------------------------------------------------------------------------------------------------------------------------------- Total 27 9 33 26 0 26 1.0 1.3 1212 CLOVER MTN. KETCHIKAN 6 6 18 6 0 6 1.0 3.0 --------------------------------------------------------------------------------------------------------------------------------------------------------------------------------------------------------- Total 6 6 18 6 0 6 1.0 3.0 1214 SKOWL ARM, POLK IN. CRAIG 43 17 624 26 0 26 .6 24.0 JUNEAU 5 5 5 5 0 5 1.0 1.0 KETCHIKAN 30 18 90 24 0 24 .8 3.8 KLAWOCK 31 16 79 16 0 16 .5 5.0 THORNE BAY 5 5 5 5 0 5 1.0 1.0 --------------------------------------------------------------------------------------------------------------------------------------------------------------------------------------------------------- Total 114 60 802 75 0 75 .7 10.6 1315 KASAAN PEN., THORNE BAY OUTSIDE ALASKA 16 5 104 5 0 5 .3 20.8 COFFMAN COVE 16 16 32 16 0 16 1.0 2.0 CRAIG 87 43 277 61 9 69 .8 4.0 KETCHIKAN 127 90 524 181 0 181 1.4 2.9 KLAWOCK 24 8 94 31 0 31 1.3 3.0 THORNE BAY 164 103 1626 131 5 135 .8 12.0 --------------------------------------------------------------------------------------------------------------------------------------------------------------------------------------------------------- Total 433 266 2658 425 13 439 1.0 6.1

Page 42
2000-2001 Southeast Deer Survey Estimated Totals for WAA by Community of Residence
Total Community Number of Number Number Number Number Average Average of Number Hunters of Days of of of Deer/ Days/ Wildlife Analysis Area Residence of Hunters Successful Hunted Bucks Does Deer Hunter Deer ___________________________________ _______________ __________ __________ __________ ______ ______ _______ __________ __________ 1316 KARTA BAY OUTSIDE ALASKA 5 0 38 0 0 0 .0 .0 HOLLIS 5 5 5 5 0 5 1.0 1.0 KETCHIKAN 30 18 60 24 0 24 .8 2.5 --------------------------------------------------------------------------------------------------------------------------------------------------------------------------------------------------------- Total 41 23 104 29 0 29 .7 3.6 1317 TWELVE MILE ARM, HARRIS R. OUTSIDE ALASKA 22 5 115 11 0 11 .5 10.5 CRAIG 104 52 277 69 17 87 .8 3.2 HOLLIS 30 20 115 30 10 40 1.3 2.9 KETCHIKAN 12 6 24 6 0 6 .5 4.0 KLAWOCK 16 0 71 0 0 0 .0 .0 THORNE BAY 5 5 5 5 0 5 1.0 1.0 --------------------------------------------------------------------------------------------------------------------------------------------------------------------------------------------------------- Total 188 88 607 121 27 148 .8 4.1 1318 CRAIG, KLAWOCK AREAS OUTSIDE ALASKA 5 5 5 5 0 5 1.0 1.0 OTHER ALASKA 6 0 11 0 0 0 .0 .0 CRAIG 182 104 581 165 0 165 .9 3.5 HOLLIS 5 5 15 5 0 5 1.0 3.0 JUNEAU 9 9 37 19 0 19 2.0 2.0 KETCHIKAN 6 0 12 0 0 0 .0 .0 KLAWOCK 87 55 291 79 0 79 .9 3.7 PETERSBURG 4 4 4 4 0 4 1.0 1.0 THORNE BAY 5 5 5 5 0 5 1.0 1.0 --------------------------------------------------------------------------------------------------------------------------------------------------------------------------------------------------------- Total 309 188 962 281 0 281 .9 3.4 1319 THORNE R. DRAINAGE OUTSIDE ALASKA 5 5 38 0 27 27 5.0 1.4 OTHER ALASKA 6 0 85 0 0 0 .0 .0 CRAIG 113 69 260 61 9 69 .6 3.8 HYDABURG 11 0 11 0 0 0 .0 .0 KETCHIKAN 36 18 66 30 0 30 .8 2.2 KLAWOCK 16 8 24 8 0 8 .5 3.0 MEYERS CHUCK 6 6 6 6 0 6 1.0 1.0 THORNE BAY 135 84 813 131 5 135 1.0 6.0 --------------------------------------------------------------------------------------------------------------------------------------------------------------------------------------------------------- Total 328 190 1302 235 41 276 .8 4.7 1323 W. POW IS. CRAIG 9 9 9 9 0 9 1.0 1.0 HOLLIS 5 5 5 10 0 10 2.0 .5 KETCHIKAN 12 12 60 30 0 30 2.5 2.0 KLAWOCK 8 8 16 16 0 16 2.0 1.0 --------------------------------------------------------------------------------------------------------------------------------------------------------------------------------------------------------- Total 34 34 90 65 0 65 1.9 1.4 1332 TROCADERO BAY, WATERFALL AREA CRAIG 43 9 121 9 0 9 .2 13.4 KETCHIKAN 6 0 12 0 0 0 .0 .0 KLAWOCK 16 8 8 8 0 8 .5 1.0 WRANGELL 5 0 5 0 0 0 .0 .0 --------------------------------------------------------------------------------------------------------------------------------------------------------------------------------------------------------- Total 70 17 146 17 0 17 .2 8.6 1420 COFFMAN CV, LUCK L., RATZ HBR. OTHER ALASKA 6 0 17 0 0 0 .0 .0 COFFMAN COVE 56 40 264 88 0 88 1.6 3.0 CRAIG 95 52 425 52 17 69 .7 6.1 HAINES 5 5 9 0 5 5 1.0 2.0 JUNEAU 9 5 51 5 0 5 .5 10.2 KETCHIKAN 66 30 223 36 0 36 .5 6.2 KLAWOCK 31 16 47 16 0 16 .5 3.0 NAUKATI BAY 6 6 128 6 0 6 1.0 21.3 PETERSBURG 4 4 18 4 0 4 1.0 4.5 THORNE BAY 14 5 33 5 0 5 .3 6.6 --------------------------------------------------------------------------------------------------------------------------------------------------------------------------------------------------------- Total 293 163 1214 212 22 234 .8 5.2 1421 SWEETWATER L., LOGJAM CR. OUTSIDE ALASKA 5 5 38 0 44 44 8.0 .9 COFFMAN COVE 16 16 80 24 0 24 1.5 3.3 CRAIG 43 26 121 26 0 26 .6 4.7 KETCHIKAN 18 18 66 24 12 36 2.0 1.8 KLAWOCK 8 0 8 0 0 0 .0 .0 METLAKATLA 6 6 50 6 6 13 2.0 3.8 THORNE BAY 14 0 42 0 0 0 .0 .0 --------------------------------------------------------------------------------------------------------------------------------------------------------------------------------------------------------- Total 111 72 406 80 62 142 1.3 2.8

Page 43
2000-2001 Southeast Deer Survey Estimated Totals for WAA by Community of Residence
Total Community Number of Number Number Number Number Average Average of Number Hunters of Days of of of Deer/ Days/ Wildlife Analysis Area Residence of Hunters Successful Hunted Bucks Does Deer Hunter Deer ___________________________________ _______________ __________ __________ __________ ______ ______ _______ __________ __________ 1422 STANEY CR., NAUKATI, SARKAR OUTSIDE ALASKA 11 0 33 0 0 0 .0 .0 COFFMAN COVE 8 0 16 0 0 0 .0 .0 CRAIG 156 69 555 69 0 69 .4 8.0 HOLLIS 5 5 5 5 0 5 1.0 1.0 JUNEAU 5 5 14 14 0 14 3.0 1.0 KETCHIKAN 169 66 784 102 0 102 .6 7.6 KLAWOCK 102 47 228 47 8 55 .5 4.1 NAUKATI BAY 57 32 275 32 6 38 .7 7.2 SITKA 11 11 54 22 5 27 2.5 2.0 THORNE BAY 42 19 182 14 5 19 .4 9.8 --------------------------------------------------------------------------------------------------------------------------------------------------------------------------------------------------------- Total 566 254 2145 305 24 330 .6 6.5 1525 S. KOSCIUSKO IS. EDNA BAY 5 5 60 5 0 5 1.0 12.0 PETERSBURG 4 4 44 9 0 9 2.0 5.0 --------------------------------------------------------------------------------------------------------------------------------------------------------------------------------------------------------- Total 9 9 104 14 0 14 1.5 7.4 1526 HOLBROOK MT., N. KOSCIUSKO IS. CRAIG 9 0 9 0 0 0 .0 .0 KETCHIKAN 6 0 6 0 0 0 .0 .0 PETERSBURG 4 4 18 4 0 4 1.0 4.5 WRANGELL 5 5 18 9 0 9 2.0 2.0 --------------------------------------------------------------------------------------------------------------------------------------------------------------------------------------------------------- Total 24 9 51 14 0 14 .6 3.9 1527 POW EL CAPITAN AREA CRAIG 17 9 17 9 0 9 .5 2.0 KETCHIKAN 18 12 84 18 0 18 1.0 4.7 NAUKATI BAY 6 6 6 6 0 6 1.0 1.0 THORNE BAY 5 5 9 5 0 5 1.0 2.0 WHALE PASS 9 5 52 5 0 5 .5 10.4 --------------------------------------------------------------------------------------------------------------------------------------------------------------------------------------------------------- Total 56 36 169 43 0 43 .8 3.9 1528 SALMON BAY OUTSIDE ALASKA 5 0 44 0 0 0 .0 .0 CRAIG 9 9 26 17 0 17 2.0 1.5 KETCHIKAN 18 12 42 18 0 18 1.0 2.3 PETERSBURG 22 13 75 18 4 22 1.0 3.4 POINT BAKER 8 0 8 0 0 0 .0 .0 WRANGELL 9 0 28 0 0 0 .0 .0 --------------------------------------------------------------------------------------------------------------------------------------------------------------------------------------------------------- Total 72 34 223 53 4 58 .8 3.9 1529 MT. CALDER, RED BAY, PT. PROT. OUTSIDE ALASKA 5 0 38 0 0 0 .0 .0 OTHER ALASKA 6 0 6 0 0 0 .0 .0 CRAIG 52 26 147 35 0 35 .7 4.3 KETCHIKAN 66 42 283 60 0 60 .9 4.7 KLAWOCK 16 16 16 16 0 16 1.0 1.0 NAUKATI BAY 19 13 32 13 0 13 .7 2.5 PETERSBURG 9 4 22 4 0 4 .5 5.5 POINT BAKER 17 8 42 8 0 8 .5 5.3 WHALE PASS 14 5 113 19 0 19 1.3 6.0 WRANGELL 5 0 14 0 0 0 .0 .0 --------------------------------------------------------------------------------------------------------------------------------------------------------------------------------------------------------- Total 209 114 713 155 0 155 .7 4.6 1530 EXCHANGE CV, WHALE PASSAGE OTHER ALASKA 6 6 45 17 0 17 3.0 2.7 CRAIG 17 0 17 0 0 0 .0 .0 KETCHIKAN 66 36 271 66 0 66 1.0 4.1 NAUKATI BAY 6 0 6 0 0 0 .0 .0 PETERSBURG 4 4 13 4 0 4 1.0 3.3 THORNE BAY 9 9 23 9 0 9 1.0 2.5 WHALE PASS 24 19 240 38 0 38 1.6 6.4 WRANGELL 32 23 92 37 32 69 2.1 1.3 --------------------------------------------------------------------------------------------------------------------------------------------------------------------------------------------------------- Total 165 97 709 172 32 204 1.2 3.5 1531 TUXEKAN, MARBLE, SEA OTTER SND. CRAIG 9 9 17 17 0 17 2.0 1.0 MEYERS CHUCK 6 0 6 0 0 0 .0 .0 PETERSBURG 9 0 35 0 0 0 .0 .0 THORNE BAY 5 0 84 0 0 0 .0 .0 WRANGELL 9 9 46 32 0 32 3.5 1.4 --------------------------------------------------------------------------------------------------------------------------------------------------------------------------------------------------------- Total 37 18 188 50 0 50 1.3 3.8 1602 FARRAGUT R. DRAINAGE PETERSBURG 4 0 18 0 0 0 .0 .0 --------------------------------------------------------------------------------------------------------------------------------------------------------------------------------------------------------- Total 4 0 18 0 0 0 .0 .0

Page 44
2000-2001 Southeast Deer Survey Estimated Totals for WAA by Community of Residence
Total Community Number of Number Number Number Number Average Average of Number Hunters of Days of of of Deer/ Days/ Wildlife Analysis Area Residence of Hunters Successful Hunted Bucks Does Deer Hunter Deer ___________________________________ _______________ __________ __________ __________ ______ ______ _______ __________ __________ 1605 MUDDY R., PATTERSON GLACIER KETCHIKAN 6 0 12 0 0 0 .0 .0 PETERSBURG 106 31 377 40 0 40 .4 9.4 --------------------------------------------------------------------------------------------------------------------------------------------------------------------------------------------------------- Total 112 31 389 40 0 40 .4 9.7 1706 HORN CLIFFS, LE CONTE BAY PETERSBURG 4 0 13 0 0 0 .0 .0 --------------------------------------------------------------------------------------------------------------------------------------------------------------------------------------------------------- Total 4 0 13 0 0 0 .0 .0 1707 N. ARM OF THE STIKINE PETERSBURG 4 0 22 0 0 0 .0 .0 --------------------------------------------------------------------------------------------------------------------------------------------------------------------------------------------------------- Total 4 0 22 0 0 0 .0 .0 1708 STIKINE R. DRAINAGE WRANGELL 5 0 46 0 0 0 .0 .0 --------------------------------------------------------------------------------------------------------------------------------------------------------------------------------------------------------- Total 5 0 46 0 0 0 .0 .0 1810 VIRGINIA L., GARNET MTN. WRANGELL 5 0 18 0 0 0 .0 .0 --------------------------------------------------------------------------------------------------------------------------------------------------------------------------------------------------------- Total 5 0 18 0 0 0 .0 .0 1814 EAGLE R., S. SH. BRADFIELD CANAL KETCHIKAN 6 0 6 0 0 0 .0 .0 --------------------------------------------------------------------------------------------------------------------------------------------------------------------------------------------------------- Total 6 0 6 0 0 0 .0 .0 1817 VIXEN IN., UNION BAY JUNEAU 5 0 5 0 0 0 .0 .0 KETCHIKAN 6 0 6 0 0 0 .0 .0 WRANGELL 9 5 32 5 0 5 .5 6.4 --------------------------------------------------------------------------------------------------------------------------------------------------------------------------------------------------------- Total 20 5 43 5 0 5 .2 8.6 1901 N. ETOLIN IS. KETCHIKAN 6 0 18 0 0 0 .0 .0 SITKA 5 0 27 0 0 0 .0 .0 WRANGELL 78 28 179 32 0 32 .4 5.6 --------------------------------------------------------------------------------------------------------------------------------------------------------------------------------------------------------- Total 90 28 224 32 0 32 .4 7.0 1903 WRANGELL IS. OTHER ALASKA 6 6 11 6 0 6 1.0 1.8 JUNEAU 9 5 32 5 0 5 .5 6.4 PETERSBURG 4 0 9 0 0 0 .0 .0 WRANGELL 179 69 1279 74 18 92 .5 3.0 --------------------------------------------------------------------------------------------------------------------------------------------------------------------------------------------------------- Total 199 79 1331 84 18 102 .5 3.2 1904 WORONKOFSKI AND STIKINE MOUTH IS. WRANGELL 14 5 14 5 0 5 .3 3.0 --------------------------------------------------------------------------------------------------------------------------------------------------------------------------------------------------------- Total 14 5 14 5 0 5 .3 3.0 1905 ZAREMBO IS. OTHER ALASKA 17 0 28 0 0 0 .0 .0 CRAIG 9 9 9 9 0 9 1.0 1.0 KETCHIKAN 12 0 24 0 0 0 .0 .0 PETERSBURG 120 62 417 89 0 89 .7 4.7 SITKA 11 11 70 11 0 11 1.0 6.5 WRANGELL 304 175 1366 322 0 322 1.1 4.2 --------------------------------------------------------------------------------------------------------------------------------------------------------------------------------------------------------- Total 472 256 1914 430 0 430 .9 4.4 1906 KASHEVAROF IS. PETERSBURG 4 0 9 0 0 0 .0 .0 WRANGELL 18 9 32 18 0 18 1.0 1.8 --------------------------------------------------------------------------------------------------------------------------------------------------------------------------------------------------------- Total 23 9 41 18 0 18 .8 2.3 1910 S. ETOLIN IS. KETCHIKAN 18 12 78 18 0 18 1.0 4.3 THORNE BAY 5 0 5 0 0 0 .0 .0 WRANGELL 32 9 97 9 0 9 .3 10.5 --------------------------------------------------------------------------------------------------------------------------------------------------------------------------------------------------------- Total 55 21 180 27 0 27 .5 6.7

Page 45
2000-2001 Southeast Deer Survey Estimated Totals for WAA by Community of Residence
Total Community Number of Number Number Number Number Average Average of Number Hunters of Days of of of Deer/ Days/ Wildlife Analysis Area Residence of Hunters Successful Hunted Bucks Does Deer Hunter Deer ___________________________________ _______________ __________ __________ __________ ______ ______ _______ __________ __________ 2007 MITKOF IS. JUNEAU 9 5 19 5 0 5 .5 4.0 PETERSBURG 354 137 1312 146 18 164 .5 8.0 SITKA 5 0 38 0 0 0 .0 .0 --------------------------------------------------------------------------------------------------------------------------------------------------------------------------------------------------------- Total 369 142 1368 151 18 169 .5 8.1 2202 SULLIVAN R. AND ISL. HAINES 9 0 9 0 0 0 .0 .0 --------------------------------------------------------------------------------------------------------------------------------------------------------------------------------------------------------- Total 9 0 9 0 0 0 .0 .0 2514 COWEE,DAVIES CR.S OUTSIDE ALASKA 5 5 11 5 0 5 1.0 2.0 JUNEAU 19 0 28 0 0 0 .0 .0 --------------------------------------------------------------------------------------------------------------------------------------------------------------------------------------------------------- Total 24 5 39 5 0 5 .2 7.8 2515 EAGLE R.-MENDENHALL R. AREA JUNEAU 37 0 56 0 0 0 .0 .0 --------------------------------------------------------------------------------------------------------------------------------------------------------------------------------------------------------- Total 37 0 56 0 0 0 .0 .0 2517 JUNEAU AND LR. TAKU JUNEAU 42 5 69 5 0 5 .1 13.8 --------------------------------------------------------------------------------------------------------------------------------------------------------------------------------------------------------- Total 42 5 69 5 0 5 .1 13.8 2620 LINCOLN IS. OUTSIDE ALASKA 5 0 5 0 0 0 .0 .0 JUNEAU 69 19 157 14 9 23 .3 6.8 --------------------------------------------------------------------------------------------------------------------------------------------------------------------------------------------------------- Total 75 19 163 14 9 23 .3 7.0 2621 SHELTER IS. OUTSIDE ALASKA 11 0 27 0 0 0 .0 .0 JUNEAU 102 32 231 32 9 42 .4 5.6 --------------------------------------------------------------------------------------------------------------------------------------------------------------------------------------------------------- Total 113 32 259 32 9 42 .4 6.1 2722 DOUGLAS IS. OTHER ALASKA 6 0 6 0 0 0 .0 .0 HAINES 5 0 5 0 0 0 .0 .0 JUNEAU 602 116 1629 97 51 148 .2 11.0 PETERSBURG 4 4 27 4 0 4 1.0 6.8 --------------------------------------------------------------------------------------------------------------------------------------------------------------------------------------------------------- Total 616 120 1666 102 51 153 .2 11.0 2823 SNETTISHAM IN., SPEEL,WHITING R.S JUNEAU 14 5 19 14 0 14 1.0 1.3 --------------------------------------------------------------------------------------------------------------------------------------------------------------------------------------------------------- Total 14 5 19 14 0 14 1.0 1.3 3001 NAKWASINA, NEVA STRAIT AREA KETCHIKAN 6 6 6 0 6 6 1.0 1.0 SITKA 458 296 1077 361 162 522 1.1 2.1 --------------------------------------------------------------------------------------------------------------------------------------------------------------------------------------------------------- Total 464 302 1083 361 168 528 1.1 2.1 3002 SITKA ROAD SYSTEM OUTSIDE ALASKA 22 5 131 22 27 49 2.3 2.7 OTHER ALASKA 6 0 6 0 0 0 .0 .0 HAINES 5 5 5 5 0 5 1.0 1.0 JUNEAU 5 0 5 0 0 0 .0 .0 KETCHIKAN 6 6 145 6 0 6 1.0 24.2 SITKA 350 140 1152 145 59 205 .6 5.6 --------------------------------------------------------------------------------------------------------------------------------------------------------------------------------------------------------- Total 393 156 1443 178 87 264 .7 5.4 3003 SILVER BAY, DEEP IN. JUNEAU 9 5 14 5 0 5 .5 3.0 KETCHIKAN 6 0 24 0 0 0 .0 .0 SITKA 129 54 404 97 11 108 .8 3.8 --------------------------------------------------------------------------------------------------------------------------------------------------------------------------------------------------------- Total 145 58 442 102 11 112 .8 3.9 3104 N. KRUZOF IS. HAINES 9 9 36 32 5 36 4.0 1.0 JUNEAU 9 9 28 5 5 9 1.0 3.0 SITKA 145 86 377 124 65 188 1.3 2.0 --------------------------------------------------------------------------------------------------------------------------------------------------------------------------------------------------------- Total 164 105 441 160 74 234 1.4 2.0

Page 46
2000-2001 Southeast Deer Survey Estimated Totals for WAA by Community of Residence
Total Community Number of Number Number Number Number Average Average of Number Hunters of Days of of of Deer/ Days/ Wildlife Analysis Area Residence of Hunters Successful Hunted Bucks Does Deer Hunter Deer ___________________________________ _______________ __________ __________ __________ ______ ______ _______ __________ __________ 3105 S. KRUZOF IS. OTHER ALASKA 17 6 45 0 6 6 .3 7.5 SITKA 75 48 124 59 5 65 .9 1.9 --------------------------------------------------------------------------------------------------------------------------------------------------------------------------------------------------------- Total 92 54 169 59 11 70 .8 2.4 3206 REDOUBT L., NECKAR IS. JUNEAU 14 0 60 0 0 0 .0 .0 KETCHIKAN 6 6 6 6 0 6 1.0 1.0 SITKA 81 38 156 32 38 70 .9 2.2 --------------------------------------------------------------------------------------------------------------------------------------------------------------------------------------------------------- Total 101 44 222 38 38 76 .8 2.9 3207 CRAWFISH IN.S, NECKAR BAY JUNEAU 5 0 19 0 0 0 .0 .0 SITKA 113 75 215 75 27 102 .9 2.1 --------------------------------------------------------------------------------------------------------------------------------------------------------------------------------------------------------- Total 118 75 234 75 27 102 .9 2.3 3308 KOOK L., SITKOH BAY, FALSE IS. OUTSIDE ALASKA 5 0 22 0 0 0 .0 .0 ANGOON 15 15 22 22 7 30 2.0 .7 GUSTAVUS 4 0 4 0 0 0 .0 .0 JUNEAU 9 5 37 9 0 9 1.0 4.0 SITKA 59 32 162 48 5 54 .9 3.0 TENAKEE SPRINGS 4 0 8 0 0 0 .0 .0 --------------------------------------------------------------------------------------------------------------------------------------------------------------------------------------------------------- Total 96 52 254 80 13 93 1.0 2.7 3309 N. SH. HOONAH SND. JUNEAU 5 0 19 0 0 0 .0 .0 SITKA 32 27 48 22 11 32 1.0 1.5 --------------------------------------------------------------------------------------------------------------------------------------------------------------------------------------------------------- Total 37 27 67 22 11 32 .9 2.1 3310 S. ARM HOONAH SND. JUNEAU 14 9 23 19 0 19 1.3 1.3 SITKA 129 59 377 86 38 124 1.0 3.0 --------------------------------------------------------------------------------------------------------------------------------------------------------------------------------------------------------- Total 143 68 400 105 38 142 1.0 2.8 3311 USHK BAY-KAKUL NARROWS JUNEAU 5 5 0 5 5 9 2.0 .0 KETCHIKAN 6 6 18 0 6 6 1.0 3.0 SITKA 38 27 113 22 11 32 .9 3.5 YAKUTAT 4 0 22 0 0 0 .0 .0 --------------------------------------------------------------------------------------------------------------------------------------------------------------------------------------------------------- Total 53 38 153 26 21 48 .9 3.3 3312 DUFFIELD PENIN., BEAR BAY ELFIN COVE 4 0 8 0 0 0 .0 .0 SITKA 59 43 92 27 22 48 .8 1.9 --------------------------------------------------------------------------------------------------------------------------------------------------------------------------------------------------------- Total 63 43 99 27 22 48 .8 2.1 3313 RODMAN AND SAOOK BAY DRS. HAINES 9 9 36 14 5 18 2.0 2.0 SITKA 81 54 242 75 22 97 1.2 2.5 --------------------------------------------------------------------------------------------------------------------------------------------------------------------------------------------------------- Total 90 63 279 89 26 115 1.3 2.3 3314 FISH BAY DRS. HOONAH 8 0 15 0 0 0 .0 .0 KETCHIKAN 12 6 30 12 0 12 1.0 2.5 SITKA 140 54 264 43 16 59 .4 4.5 --------------------------------------------------------------------------------------------------------------------------------------------------------------------------------------------------------- Total 160 60 309 55 16 71 .4 4.4 3315 CATHERINE ISL., L. EVA, HANUS BAY ANGOON 7 7 74 7 0 7 1.0 10.6 HAINES 5 5 9 5 0 5 1.0 2.0 JUNEAU 5 0 32 0 0 0 .0 .0 SITKA 32 22 70 27 0 27 .8 2.6 SKAGWAY 6 6 42 3 3 6 1.0 7.0 --------------------------------------------------------------------------------------------------------------------------------------------------------------------------------------------------------- Total 55 40 227 42 3 45 .8 5.0 3416 KHAZ PENIN., SLOCUM ARM JUNEAU 14 14 32 23 0 23 1.7 1.4 SITKA 32 27 59 43 5 48 1.5 1.2 --------------------------------------------------------------------------------------------------------------------------------------------------------------------------------------------------------- Total 46 41 92 66 5 72 1.6 1.3

Page 47
2000-2001 Southeast Deer Survey Estimated Totals for WAA by Community of Residence
Total Community Number of Number Number Number Number Average Average of Number Hunters of Days of of of Deer/ Days/ Wildlife Analysis Area Residence of Hunters Successful Hunted Bucks Does Deer Hunter Deer ___________________________________ _______________ __________ __________ __________ ______ ______ _______ __________ __________ 3417 WEST COAST CHICHAGOF OTHER ALASKA 6 6 23 11 0 11 2.0 2.0 GUSTAVUS 11 4 14 4 0 4 .3 3.5 HAINES 5 5 5 0 9 9 2.0 .6 JUNEAU 37 23 273 51 19 69 1.9 4.0 PELICAN 9 5 24 5 0 5 .5 5.0 SITKA 11 5 22 5 0 5 .5 4.4 --------------------------------------------------------------------------------------------------------------------------------------------------------------------------------------------------------- Total 78 47 360 76 28 104 1.3 3.5 3418 YAKOBI IS. OTHER ALASKA 6 6 6 6 0 6 1.0 1.0 ELFIN COVE 4 4 12 4 0 4 1.0 3.0 HAINES 23 18 59 36 0 36 1.6 1.6 JUNEAU 9 0 19 0 0 0 .0 .0 PELICAN 19 9 43 9 9 19 1.0 2.3 --------------------------------------------------------------------------------------------------------------------------------------------------------------------------------------------------------- Total 60 37 137 55 9 65 1.1 2.1 3419 UPPER LISIANSKI IN., LISIANSKI R. JUNEAU 9 5 60 0 5 5 .5 12.0 PELICAN 28 19 57 24 0 24 .8 2.4 --------------------------------------------------------------------------------------------------------------------------------------------------------------------------------------------------------- Total 38 24 117 24 5 28 .8 4.0 3420 IDAHO IN. DRS. HOONAH 8 0 23 0 0 0 .0 .0 JUNEAU 32 14 153 19 0 19 .6 8.1 KETCHIKAN 6 0 6 0 0 0 .0 .0 --------------------------------------------------------------------------------------------------------------------------------------------------------------------------------------------------------- Total 46 14 182 19 0 19 .4 9.6 3421 PT. ALTHORP, LR. LISIANSKI, INIAN IS. OUTSIDE ALASKA 5 0 16 0 0 0 .0 .0 ELFIN COVE 15 12 58 8 8 15 1.0 3.8 GUSTAVUS 4 4 4 4 0 4 1.0 1.0 HAINES 23 9 36 14 0 14 .6 2.7 JUNEAU 14 5 130 5 0 5 .3 26.0 PELICAN 5 5 5 5 0 5 1.0 1.0 --------------------------------------------------------------------------------------------------------------------------------------------------------------------------------------------------------- Total 66 34 248 34 8 42 .6 5.8 3523 E. SIDE PT. FREDERICK, GAME CR. OTHER ALASKA 6 6 34 6 6 11 2.0 3.0 GAME CREEK 6 3 6 3 0 3 .5 2.0 HAINES 5 5 23 5 5 9 2.0 2.5 HOONAH 70 62 511 93 15 108 1.6 4.7 JUNEAU 28 19 74 28 9 37 1.3 2.0 WHITESTONE CAMP 27 16 109 16 0 16 .6 6.7 --------------------------------------------------------------------------------------------------------------------------------------------------------------------------------------------------------- Total 141 110 756 150 35 185 1.3 4.1 3524 HOONAH AREA HOONAH 46 31 294 31 15 46 1.0 6.3 WHITESTONE CAMP 16 5 38 11 0 11 .7 3.5 --------------------------------------------------------------------------------------------------------------------------------------------------------------------------------------------------------- Total 63 36 332 42 15 57 .9 5.8 3525 FRESHWATER BAY DRS. OTHER ALASKA 6 6 0 6 0 6 1.0 .0 GUSTAVUS 7 0 11 0 0 0 .0 .0 HAINES 9 9 27 23 5 27 3.0 1.0 HOONAH 62 39 139 77 39 116 1.9 1.2 JUNEAU 65 42 204 56 9 65 1.0 3.1 TENAKEE SPRINGS 4 4 100 4 0 4 1.0 25.0 WHITESTONE CAMP 16 5 16 5 0 5 .3 3.2 --------------------------------------------------------------------------------------------------------------------------------------------------------------------------------------------------------- Total 169 105 497 171 53 223 1.3 2.2 3526 N. SH. TENAKEE IN. HAINES 5 0 9 0 0 0 .0 .0 JUNEAU 83 56 273 69 0 69 .8 3.9 SITKA 5 0 11 0 0 0 .0 .0 TENAKEE SPRINGS 8 0 16 0 0 0 .0 .0 --------------------------------------------------------------------------------------------------------------------------------------------------------------------------------------------------------- Total 101 56 309 69 0 69 .7 4.5 3551 WHTSTN. HBR., FALSE BAY DRS. OTHER ALASKA 11 11 45 11 0 11 1.0 4.0 ANGOON 7 7 89 7 0 7 1.0 12.7 HAINES 5 0 5 0 0 0 .0 .0 HOONAH 132 85 596 170 70 240 1.8 2.5 JUNEAU 65 51 236 74 28 102 1.6 2.3 WHITESTONE CAMP 5 0 5 0 0 0 .0 .0 --------------------------------------------------------------------------------------------------------------------------------------------------------------------------------------------------------- Total 225 155 976 263 97 360 1.6 2.7

Page 48
2000-2001 Southeast Deer Survey Estimated Totals for WAA by Community of Residence
Total Community Number of Number Number Number Number Average Average of Number Hunters of Days of of of Deer/ Days/ Wildlife Analysis Area Residence of Hunters Successful Hunted Bucks Does Deer Hunter Deer ___________________________________ _______________ __________ __________ __________ ______ ______ _______ __________ __________ 3627 CORNER BAY, TRAP BAY CUBE COVE CAMP 7 7 123 11 0 11 1.5 11.7 JUNEAU 28 19 23 28 5 32 1.2 .7 SITKA 11 0 22 0 0 0 .0 .0 TENAKEE SPRINGS 20 20 160 12 16 28 1.4 5.7 --------------------------------------------------------------------------------------------------------------------------------------------------------------------------------------------------------- Total 66 46 327 50 21 71 1.1 4.5 3628 KADASHAN CUBE COVE CAMP 4 0 7 0 0 0 .0 .0 TENAKEE SPRINGS 4 4 12 4 0 4 1.0 3.0 --------------------------------------------------------------------------------------------------------------------------------------------------------------------------------------------------------- Total 8 4 19 4 0 4 .5 4.8 3629 S. SH. TENAKEE IN. JUNEAU 19 5 56 0 5 5 .3 11.2 PELICAN 5 5 5 5 0 5 1.0 1.0 TENAKEE SPRINGS 4 0 4 0 0 0 .0 .0 --------------------------------------------------------------------------------------------------------------------------------------------------------------------------------------------------------- Total 27 9 64 5 5 9 .3 6.5 3630 UPPER TENAKEE IN. OTHER ALASKA 6 6 28 6 6 11 2.0 2.5 HAINES 5 5 23 14 0 14 3.0 1.7 JUNEAU 14 9 79 19 5 23 1.7 3.4 --------------------------------------------------------------------------------------------------------------------------------------------------------------------------------------------------------- Total 24 19 130 38 10 48 2.0 2.7 3731 KELP BAY-TAKATZ BAY HID. FALLS HATCHERY 1 1 3 2 0 2 2.0 1.5 JUNEAU 19 19 83 32 0 32 1.8 2.6 KETCHIKAN 12 12 96 24 6 30 2.5 3.2 SITKA 11 11 38 27 5 32 3.0 1.2 --------------------------------------------------------------------------------------------------------------------------------------------------------------------------------------------------------- Total 42 42 220 85 11 97 2.3 2.3 3732 WARM SPRINGS COAST HAINES 5 5 14 14 0 14 3.0 1.0 PETERSBURG 4 4 4 9 0 9 2.0 .5 SITKA 5 5 22 5 0 5 1.0 4.4 --------------------------------------------------------------------------------------------------------------------------------------------------------------------------------------------------------- Total 14 14 40 28 0 28 1.9 1.4 3733 WHALE BAY DRS., WILD. COAST OUTSIDE ALASKA 5 0 55 0 0 0 .0 .0 JUNEAU 9 0 28 0 0 0 .0 .0 KAKE 8 0 16 0 0 0 .0 .0 SITKA 27 16 59 16 0 16 .6 3.7 --------------------------------------------------------------------------------------------------------------------------------------------------------------------------------------------------------- Total 49 16 157 16 0 16 .3 9.9 3734 S. BARANOF IS. JUNEAU 9 5 37 5 0 5 .5 7.4 PORT ALEXANDER 20 10 70 20 0 20 1.0 3.5 SITKA 16 11 54 16 11 27 1.7 2.0 --------------------------------------------------------------------------------------------------------------------------------------------------------------------------------------------------------- Total 45 25 161 41 11 52 1.1 3.1 3835 N. MANSFIELD PENIN. OTHER ALASKA 11 6 17 6 0 6 .5 3.0 JUNEAU 296 120 787 167 42 208 .7 3.8 YAKUTAT 4 4 13 4 4 9 2.0 1.5 --------------------------------------------------------------------------------------------------------------------------------------------------------------------------------------------------------- Total 312 130 817 177 46 223 .7 3.7 3836 HAWK IN., YOUNG BAY DRS. OTHER ALASKA 6 6 17 11 0 11 2.0 1.5 JUNEAU 282 148 736 143 56 199 .7 3.7 --------------------------------------------------------------------------------------------------------------------------------------------------------------------------------------------------------- Total 288 154 753 155 56 210 .7 3.6 3837 WHEELER, GREENS CR.S DRS. JUNEAU 19 19 83 32 9 42 2.3 2.0 --------------------------------------------------------------------------------------------------------------------------------------------------------------------------------------------------------- Total 19 19 83 32 9 42 2.3 2.0 3938 GAMBIER BAY DRS. JUNEAU 51 32 222 46 19 65 1.3 3.4 PETERSBURG 18 13 71 27 18 44 2.5 1.6 --------------------------------------------------------------------------------------------------------------------------------------------------------------------------------------------------------- Total 69 46 293 73 36 109 1.6 2.7

Page 49
2000-2001 Southeast Deer Survey Estimated Totals for WAA by Community of Residence
Total Community Number of Number Number Number Number Average Average of Number Hunters of Days of of of Deer/ Days/ Wildlife Analysis Area Residence of Hunters Successful Hunted Bucks Does Deer Hunter Deer ___________________________________ _______________ __________ __________ __________ ______ ______ _______ __________ __________ 3939 PYBUS BAY DRS. OUTSIDE ALASKA 5 5 27 5 0 5 1.0 5.0 JUNEAU 14 14 65 9 9 19 1.3 3.5 KAKE 16 16 24 24 16 39 2.5 .6 PETERSBURG 58 40 173 93 4 97 1.7 1.8 --------------------------------------------------------------------------------------------------------------------------------------------------------------------------------------------------------- Total 93 75 288 131 29 161 1.7 1.8 3940 PT. GARDNER, ELIZA HBR. KAKE 24 24 39 39 0 39 1.7 1.0 PETERSBURG 22 18 142 31 4 35 1.6 4.0 --------------------------------------------------------------------------------------------------------------------------------------------------------------------------------------------------------- Total 46 41 181 70 4 75 1.6 2.5 4041 WHITEWATER BAY, WILSON CV OUTSIDE ALASKA 5 5 11 16 5 22 4.0 .5 HID. FALLS HATCHERY 1 1 1 1 0 1 1.0 1.0 JUNEAU 5 0 5 0 0 0 .0 .0 --------------------------------------------------------------------------------------------------------------------------------------------------------------------------------------------------------- Total 11 6 17 17 5 23 2.1 .7 4042 ANGOON AREA ANGOON 15 15 44 37 22 59 4.0 .7 JUNEAU 5 0 9 0 0 0 .0 .0 --------------------------------------------------------------------------------------------------------------------------------------------------------------------------------------------------------- Total 19 15 54 37 22 59 3.0 .9 4043 CENTRAL ADMIRALTY L. ANGOON 7 7 7 0 7 7 1.0 1.0 HAINES 5 5 23 9 0 9 2.0 2.5 JUNEAU 51 23 380 42 0 42 .8 9.1 KETCHIKAN 6 0 12 0 0 0 .0 .0 --------------------------------------------------------------------------------------------------------------------------------------------------------------------------------------------------------- Total 69 35 422 51 7 58 .8 7.3 4044 SHEE-ATIKA DRS. CUBE COVE CAMP 28 28 102 81 14 95 3.4 1.1 JUNEAU 69 42 343 74 28 102 1.5 3.4 WRANGELL 9 9 60 23 9 32 3.5 1.9 --------------------------------------------------------------------------------------------------------------------------------------------------------------------------------------------------------- Total 107 79 504 178 51 229 2.1 2.2 4054 FISHERY, THAYER CR.S ANGOON 7 7 44 7 0 7 1.0 6.3 JUNEAU 5 0 28 0 0 0 .0 .0 --------------------------------------------------------------------------------------------------------------------------------------------------------------------------------------------------------- Total 12 7 72 7 0 7 .6 10.3 4055 HOOD BAY, CHAIK BAY DRS. ANGOON 15 15 81 7 7 15 1.0 5.5 GUSTAVUS 4 0 4 0 0 0 .0 .0 JUNEAU 9 0 56 0 0 0 .0 .0 --------------------------------------------------------------------------------------------------------------------------------------------------------------------------------------------------------- Total 28 15 140 7 7 15 .5 9.4 4145 TIEDEMAN IS.-MOLE HBR. AREA ANGOON 7 7 44 22 0 22 3.0 2.0 HAINES 9 9 55 5 5 9 1.0 6.0 JUNEAU 19 14 106 23 5 28 1.5 3.8 PETERSBURG 9 4 13 4 4 9 1.0 1.5 --------------------------------------------------------------------------------------------------------------------------------------------------------------------------------------------------------- Total 44 35 219 54 14 68 1.5 3.2 4146 WINDFALL HBR., SWAN CV DRS. HAINES 5 5 36 5 0 5 1.0 7.2 JUNEAU 46 32 278 46 19 65 1.4 4.3 --------------------------------------------------------------------------------------------------------------------------------------------------------------------------------------------------------- Total 51 37 314 51 19 69 1.4 4.5 4147 UPPER SEYMOUR CANAL JUNEAU 37 14 153 9 9 19 .5 8.3 --------------------------------------------------------------------------------------------------------------------------------------------------------------------------------------------------------- Total 37 14 153 9 9 19 .5 8.3 4148 WEST SIDE GLASS PENIN. HAINES 5 5 36 5 0 5 1.0 7.2 JUNEAU 32 14 65 14 5 19 .6 3.5 PETERSBURG 4 0 4 0 0 0 .0 .0 --------------------------------------------------------------------------------------------------------------------------------------------------------------------------------------------------------- Total 41 18 106 18 5 23 .6 4.4

Page 50
2000-2001 Southeast Deer Survey Estimated Totals for WAA by Community of Residence
Total Community Number of Number Number Number Number Average Average of Number Hunters of Days of of of Deer/ Days/ Wildlife Analysis Area Residence of Hunters Successful Hunted Bucks Does Deer Hunter Deer ___________________________________ _______________ __________ __________ __________ ______ ______ _______ __________ __________ 4149 E. SIDE GLASS PENIN. JUNEAU 65 46 143 46 14 60 .9 2.4 --------------------------------------------------------------------------------------------------------------------------------------------------------------------------------------------------------- Total 65 46 143 46 14 60 .9 2.4 4150 GRAND IS., OLIVER IN., STINK CR. OTHER ALASKA 6 6 0 6 0 6 1.0 .0 JUNEAU 153 65 380 65 28 93 .6 4.1 --------------------------------------------------------------------------------------------------------------------------------------------------------------------------------------------------------- Total 158 70 380 70 28 98 .6 3.8 4222 PT. ADOLPHUS, MUD BAY AREA GUSTAVUS 4 4 4 4 0 4 1.0 1.0 HAINES 5 5 14 0 5 5 1.0 3.0 HOONAH 15 15 54 31 0 31 2.0 1.8 JUNEAU 9 5 28 5 0 5 .5 5.6 KETCHIKAN 6 6 6 6 0 6 1.0 1.0 --------------------------------------------------------------------------------------------------------------------------------------------------------------------------------------------------------- Total 39 34 105 45 5 50 1.3 2.1 4252 HUMPBACK, GALLAGHER CRS. OTHER ALASKA 6 6 11 0 6 6 1.0 1.8 HOONAH 62 62 379 85 39 124 2.0 3.1 JUNEAU 23 19 143 28 9 37 1.6 3.9 SKAGWAY 3 0 6 0 0 0 .0 .0 --------------------------------------------------------------------------------------------------------------------------------------------------------------------------------------------------------- Total 94 86 540 113 54 167 1.8 3.2 4253 NEKA BAY DRS. OTHER ALASKA 6 0 23 0 0 0 .0 .0 HAINES 5 5 18 9 0 9 2.0 2.0 HOONAH 39 31 39 54 0 54 1.4 .7 JUNEAU 9 9 23 14 0 14 1.5 1.7 SKAGWAY 3 0 10 0 0 0 .0 .0 --------------------------------------------------------------------------------------------------------------------------------------------------------------------------------------------------------- Total 61 45 112 77 0 77 1.3 1.5 4256 LEMESURIER, PLEASANT IS. OTHER ALASKA 11 6 17 6 0 6 .5 3.0 EXCURSION INLET CAMP 2 0 4 0 0 0 .0 .0 GUSTAVUS 58 25 173 18 29 47 .8 3.7 HAINES 5 0 5 0 0 0 .0 .0 JUNEAU 5 5 9 0 5 5 1.0 2.0 --------------------------------------------------------------------------------------------------------------------------------------------------------------------------------------------------------- Total 80 35 208 24 33 57 .7 3.6 4504 YAKUTAT BAY IS. YAKUTAT 4 0 9 0 0 0 .0 .0 --------------------------------------------------------------------------------------------------------------------------------------------------------------------------------------------------------- Total 4 0 9 0 0 0 .0 .0 5012 N. KUIU IS. KETCHIKAN 12 6 12 6 0 6 .5 2.0 PETERSBURG 4 4 22 4 0 4 1.0 5.5 POINT BAKER 8 8 84 8 0 8 1.0 10.5 --------------------------------------------------------------------------------------------------------------------------------------------------------------------------------------------------------- Total 25 19 118 19 0 19 .8 6.6 5014 E. KUIU IS., CONCLUSION IS. POINT BAKER 8 8 17 8 0 8 1.0 2.0 --------------------------------------------------------------------------------------------------------------------------------------------------------------------------------------------------------- Total 8 8 17 8 0 8 1.0 2.0 5017 S. KUIU IS. PETERSBURG 4 0 18 0 0 0 .0 .0 --------------------------------------------------------------------------------------------------------------------------------------------------------------------------------------------------------- Total 4 0 18 0 0 0 .0 .0 5130 ROCKY PASS/KUPR. KETCHIKAN 12 0 36 0 0 0 .0 .0 PETERSBURG 4 4 9 4 0 4 1.0 2.3 WRANGELL 5 0 32 0 0 0 .0 .0 --------------------------------------------------------------------------------------------------------------------------------------------------------------------------------------------------------- Total 21 4 77 4 0 4 .2 19.3 5131 HAMILTON CR., BIG JOHN BAY KAKE 16 0 180 0 0 0 .0 .0 KETCHIKAN 6 0 24 0 0 0 .0 .0 --------------------------------------------------------------------------------------------------------------------------------------------------------------------------------------------------------- Total 22 0 204 0 0 0 .0 .0

Page 51
2000-2001 Southeast Deer Survey Estimated Totals for WAA by Community of Residence
Total Community Number of Number Number Number Number Average Average of Number Hunters of Days of of of Deer/ Days/ Wildlife Analysis Area Residence of Hunters Successful Hunted Bucks Does Deer Hunter Deer ___________________________________ _______________ __________ __________ __________ ______ ______ _______ __________ __________ 5132 KAKE AREA CRAIG 9 9 43 9 0 9 1.0 4.8 KAKE 24 0 251 0 0 0 .0 .0 KETCHIKAN 6 0 18 0 0 0 .0 .0 PETERSBURG 4 4 9 9 0 9 2.0 1.0 --------------------------------------------------------------------------------------------------------------------------------------------------------------------------------------------------------- Total 43 13 321 18 0 18 .4 17.8 5133 WEST DUNCAN CANAL KAKE 8 8 8 8 0 8 1.0 1.0 PETERSBURG 44 22 164 27 0 27 .6 6.2 --------------------------------------------------------------------------------------------------------------------------------------------------------------------------------------------------------- Total 52 30 172 34 0 34 .7 4.9 5134 S. SH. KUPR. PETERSBURG 31 27 84 40 0 40 1.3 2.1 POINT BAKER 8 8 25 17 0 17 2.0 1.5 WRANGELL 9 5 23 9 0 9 1.0 2.5 --------------------------------------------------------------------------------------------------------------------------------------------------------------------------------------------------------- Total 49 40 132 66 0 66 1.4 2.0 5136 PORTAGE BAY, NW KUPR. PETERSBURG 13 4 18 9 0 9 .7 2.0 --------------------------------------------------------------------------------------------------------------------------------------------------------------------------------------------------------- Total 13 4 18 9 0 9 .7 2.0 5137 PETERSBURG CR. PETERSBURG 4 0 44 0 0 0 .0 .0 --------------------------------------------------------------------------------------------------------------------------------------------------------------------------------------------------------- Total 4 0 44 0 0 0 .0 .0 5138 S. LINDENBERG PENIN. JUNEAU 5 5 14 5 0 5 1.0 3.0 KAKE 8 8 16 16 0 16 2.0 1.0 PETERSBURG 80 40 213 53 0 53 .7 4.0 --------------------------------------------------------------------------------------------------------------------------------------------------------------------------------------------------------- Total 92 52 242 73 0 73 .8 3.3 9999 Blank/Missing OUTSIDE ALASKA 16 16 334 16 0 16 1.0 20.9 OTHER ALASKA 17 17 158 23 6 28 1.7 5.6 ANGOON 7 7 44 15 15 30 4.0 1.5 CRAIG 9 9 199 17 0 17 2.0 11.7 ELFIN COVE 8 8 115 15 0 15 2.0 7.7 GAME CREEK 3 3 42 6 9 15 5.0 2.8 HAINES 14 14 107 41 5 46 3.3 2.3 HOONAH 23 23 255 15 8 23 1.0 11.1 JUNEAU 111 111 1033 185 37 222 2.0 4.7 KAKE 8 8 39 24 0 24 3.0 1.7 KETCHIKAN 48 48 410 84 0 84 1.8 4.9 KLAWOCK 24 24 24 24 0 24 1.0 1.0 MEYERS CHUCK 6 6 6 6 0 6 1.0 1.0 PETERSBURG 13 13 62 13 0 13 1.0 4.8 SITKA 59 59 167 59 16 75 1.3 2.2 SKAGWAY 3 3 51 3 0 3 1.0 17.0 THORNE BAY 14 14 115 19 0 19 1.3 6.1 WRANGELL 18 18 32 18 5 23 1.3 1.4 --------------------------------------------------------------------------------------------------------------------------------------------------------------------------------------------------------- Total 401 401 3196 584 99 683 1.7 4.7 --------------------------------------------------------------------------------------------------------------------------------------------------------------------------------------------------------- Grand Total 12448 6448 45990 8779 1768 10547 .8 4.4

Page 52
2000-2001 Southeast Deer Survey Estimated Totals for Community of Residence by WAA
Total Community Number of Number Number Number Number Average Average of Number Hunters of Days of of of Deer/ Days/ Residence Wildlife Analysis Area of Hunters Successful Hunted Bucks Does Deer Hunter Deer _________________ ________________________________ __________ __________ __________ ______ ______ _______ __________ __________ OUTSIDE ALASKA 1210 MOIRA SND. 5 0 22 0 0 0 .0 .0 1315 KASAAN PEN., THORNE BAY 16 5 104 5 0 5 .3 20.8 1316 KARTA BAY 5 0 38 0 0 0 .0 .0 1317 TWELVE MILE ARM, HARRIS R. 22 5 115 11 0 11 .5 10.5 1318 CRAIG, KLAWOCK AREAS 5 5 5 5 0 5 1.0 1.0 1319 THORNE R. DRAINAGE 5 5 38 0 27 27 5.0 1.4 1421 SWEETWATER L., LOGJAM CR. 5 5 38 0 44 44 8.0 .9 1422 STANEY CR., NAUKATI, SARKAR 11 0 33 0 0 0 .0 .0 1528 SALMON BAY 5 0 44 0 0 0 .0 .0 1529 MT. CALDER, RED BAY, PT. PROT. 5 0 38 0 0 0 .0 .0 2514 COWEE,DAVIES CR.S 5 5 11 5 0 5 1.0 2.0 2620 LINCOLN IS. 5 0 5 0 0 0 .0 .0 2621 SHELTER IS. 11 0 27 0 0 0 .0 .0 3002 SITKA ROAD SYSTEM 22 5 131 22 27 49 2.3 2.7 3308 KOOK L., SITKOH BAY, FALSE IS. 5 0 22 0 0 0 .0 .0 3421 PT. ALTHORP, LR. LISIANSKI, INIAN IS. 5 0 16 0 0 0 .0 .0 3733 WHALE BAY DRS., WILD. COAST 5 0 55 0 0 0 .0 .0 3939 PYBUS BAY DRS. 5 5 27 5 0 5 1.0 5.4 4041 WHITEWATER BAY, WILSON CV 5 5 11 16 5 22 4.0 .5 9999 Blank/Missing 16 16 334 16 0 16 1.0 20.9 --------------------------------------------------------------------------------------------------------------------------------------------------------------------------------------------------------- Total 175 66 1116 88 104 192 1.1 5.9 OTHER ALASKA 0101 GRAVINA IS. 6 0 6 0 0 0 .0 .0 0407 GEORGE IN. 6 0 6 0 0 0 .0 .0 0408 KETCHIKAN 6 0 11 0 0 0 .0 .0 1318 CRAIG, KLAWOCK AREAS 6 0 11 0 0 0 .0 .0 1319 THORNE R. DRAINAGE 6 0 85 0 0 0 .0 .0 1420 COFFMAN CV, LUCK L., RATZ HBR. 6 0 17 0 0 0 .0 .0 1529 MT. CALDER, RED BAY, PT. PROT. 6 0 6 0 0 0 .0 .0 1530 EXCHANGE CV, WHALE PASSAGE 6 6 45 17 0 17 3.0 2.7 1903 WRANGELL IS. 6 6 11 6 0 6 1.0 2.0 1905 ZAREMBO IS. 17 0 28 0 0 0 .0 .0 2722 DOUGLAS IS. 6 0 6 0 0 0 .0 .0 3002 SITKA ROAD SYSTEM 6 0 6 0 0 0 .0 .0 3105 S. KRUZOF IS. 17 6 45 0 6 6 .3 7.5 3417 WEST COAST CHICHAGOF 6 6 23 11 0 11 2.0 2.0 3418 YAKOBI IS. 6 6 6 6 0 6 1.0 1.0 3523 E. SIDE PT. FREDERICK, GAME CR. 6 6 34 6 6 11 2.0 3.0 3525 FRESHWATER BAY DRS. 6 6 0 6 0 6 1.0 .0 3551 WHTSTN. HBR., FALSE BAY DRS. 11 11 45 11 0 11 1.0 4.0 3630 UPPER TENAKEE IN. 6 6 28 6 6 11 2.0 2.5 3835 N. MANSFIELD PENIN. 11 6 17 6 0 6 .5 3.0 3836 HAWK IN., YOUNG BAY DRS. 6 6 17 11 0 11 2.0 1.5 4150 GRAND IS., OLIVER IN., STINK CR. 6 6 0 6 0 6 1.0 .0 4252 HUMPBACK, GALLAGHER CR.S 6 6 11 0 6 6 1.0 2.0 4253 NEKA BAY DRS. 6 0 23 0 0 0 .0 .0 4256 LEMESURIER, PLEASANT IS. 11 6 17 6 0 6 .5 2.8 9999 Blank/Missing 17 17 158 23 6 28 1.7 5.6 --------------------------------------------------------------------------------------------------------------------------------------------------------------------------------------------------------- Total 197 102 660 118 28 147 .7 4.5 ANGOON 3308 KOOK L., SITKOH BAY, FALSE IS. 15 15 22 22 7 30 2.0 .7 3315 CATHERINE ISL., L. EVA, HANUS BAY 7 7 74 7 0 7 1.0 10.6 3551 WHTSTN. HBR., FALSE BAY DRS. 7 7 89 7 0 7 1.0 12.7 4042 ANGOON AREA 15 15 44 37 22 59 4.0 .7 4043 CENTRAL ADMIRALTY L. 7 7 7 0 7 7 1.0 1.0 4054 FISHERY, THAYER CR.S 7 7 44 7 0 7 1.0 6.3 4055 HOOD BAY, CHAIK BAY DRS. 15 15 81 7 7 15 1.0 5.5 4145 TIEDEMAN IS.-MOLE HBR. AREA 7 7 44 22 0 22 3.0 2.0 9999 Blank/Missing 7 7 44 15 15 30 4.0 1.5 --------------------------------------------------------------------------------------------------------------------------------------------------------------------------------------------------------- Total 89 89 450 126 59 185 2.1 2.4 COFFMAN COVE 1315 KASAAN PEN., THORNE BAY 16 16 32 16 0 16 1.0 2.0 1420 COFFMAN CV, LUCK L., RATZ HBR. 56 40 432 88 0 88 1.6 4.9 1421 SWEETWATER L., LOGJAM CR. 16 16 80 24 0 24 1.5 3.3 1422 STANEY CR., NAUKATI, SARKAR 8 0 16 0 0 0 .0 .0 --------------------------------------------------------------------------------------------------------------------------------------------------------------------------------------------------------- Total 96 72 560 128 0 128 1.3 4.4

Page 53
2000-2001 Southeast Deer Survey Estimated Totals for Community of Residence by WAA
Total Community Number of Number Number Number Number Average Average of Number Hunters of Days of of of Deer/ Days/ Residence Wildlife Analysis Area of Hunters Successful Hunted Bucks Does Deer Hunter Deer _________________ ________________________________ __________ __________ __________ ______ ______ _______ __________ __________ CRAIG 0901 SUEMEZ IS. 43 43 87 52 0 52 1.2 1.7 0902 OUTSIDE IS. 26 17 35 35 0 35 1.3 1.0 1105 DALL IS. 9 9 9 9 0 9 1.0 1.0 1106 LONG IS. 9 0 35 0 0 0 .0 .0 1107 HYDABURG, HETTA IN., SUKKWAN IS. 26 26 35 35 0 35 1.3 1.0 1211 KITKUN, S. ARM CHOLMONDELEY 9 9 9 26 0 26 3.0 .3 1214 SKOWL ARM, POLK IN. 43 17 624 26 0 26 .6 24.0 1315 KASAAN PEN., THORNE BAY 87 43 277 61 9 69 .8 4.0 1317 TWELVE MILE ARM, HARRIS R. 104 52 277 69 17 87 .8 3.2 1318 CRAIG, KLAWOCK AREAS 182 104 581 165 0 165 .9 3.5 1319 THORNE R. DRAINAGE 113 69 260 61 9 69 .6 3.8 1323 W. POW IS. 9 9 9 9 0 9 1.0 1.0 1332 TROCADERO BAY, WATERFALL AREA 43 9 121 9 0 9 .2 13.4 1420 COFFMAN CV, LUCK L., RATZ HBR. 95 52 425 52 17 69 .7 6.1 1421 SWEETWATER L., LOGJAM CR. 43 26 121 26 0 26 .6 4.7 1422 STANEY CR., NAUKATI, SARKAR 156 69 555 69 0 69 .4 8.0 1526 HOLBROOK MT., N. KOSCIUSKO IS. 9 0 9 0 0 0 .0 .0 1527 POW EL CAPITAN AREA 17 9 17 9 0 9 .5 2.0 1528 SALMON BAY 9 9 26 17 0 17 2.0 1.5 1529 MT. CALDER, RED BAY, PT. PROT. 52 26 147 35 0 35 .7 4.3 1530 EXCHANGE CV, WHALE PASSAGE 17 0 17 0 0 0 .0 .0 1531 TUXEKAN, MARBLE, SEA OTTER SND. 9 9 17 17 0 17 2.0 1.0 1905 ZAREMBO IS. 9 9 9 9 0 9 1.0 1.0 5132 KAKE AREA 9 9 43 9 0 9 1.0 5.0 9999 Blank/Missing 9 9 199 17 0 17 2.0 11.5 --------------------------------------------------------------------------------------------------------------------------------------------------------------------------------------------------------- Total 1135 633 3943 815 52 867 .8 4.5 CUBE COVE CAMP 3627 CORNER BAY, TRAP BAY 7 7 123 11 0 11 1.5 11.2 3628 KADASHAN 4 0 7 0 0 0 .0 .0 4044 SHEE-ATIKA DRS. 28 28 102 81 14 95 3.4 1.1 --------------------------------------------------------------------------------------------------------------------------------------------------------------------------------------------------------- Total 39 35 231 91 14 105 2.7 2.2 EDNA BAY 1525 S. KOSCIUSKO IS. 5 5 60 5 0 5 1.0 12.0 --------------------------------------------------------------------------------------------------------------------------------------------------------------------------------------------------------- Total 5 5 60 5 0 5 1.0 12.0 ELFIN COVE 3312 DUFFIELD PENIN., BEAR BAY 4 0 8 0 0 0 .0 .0 3418 YAKOBI IS. 4 4 12 4 0 4 1.0 3.0 3421 PT. ALTHORP, LR. LISIANSKI, INIAN IS. 15 12 58 8 8 15 1.0 3.8 9999 Blank/Missing 8 8 115 15 0 15 2.0 7.5 --------------------------------------------------------------------------------------------------------------------------------------------------------------------------------------------------------- Total 31 23 192 27 8 35 1.1 5.7 EXCURSION INLET CAMP 4256 LEMESURIER, PLEASANT IS. 2 0 4 0 0 0 .0 .0 --------------------------------------------------------------------------------------------------------------------------------------------------------------------------------------------------------- Total 2 0 4 0 0 0 .0 .0 GAME CREEK 3523 E. SIDE PT. FREDERICK, GAME CR. 6 3 6 3 0 3 .5 2.0 9999 Blank/Missing 3 3 42 6 9 15 5.0 2.8 --------------------------------------------------------------------------------------------------------------------------------------------------------------------------------------------------------- Total 9 6 48 9 9 18 2.0 2.7 GUSTAVUS 3308 KOOK L., SITKOH BAY, FALSE IS. 4 0 4 0 0 0 .0 .0 3417 WEST COAST CHICHAGOF 11 4 14 4 0 4 .3 3.5 3421 PT. ALTHORP, LR. LISIANSKI, INIAN IS. 4 4 4 4 0 4 1.0 1.0 3525 FRESHWATER BAY DRS. 7 0 11 0 0 0 .0 .0 4055 HOOD BAY, CHAIK BAY DRS. 4 0 4 0 0 0 .0 .0 4222 PT. ADOLPHUS, MUD BAY AREA 4 4 4 4 0 4 1.0 1.0 4256 LEMESURIER, PLEASANT IS. 58 25 180 18 29 47 .8 3.8 --------------------------------------------------------------------------------------------------------------------------------------------------------------------------------------------------------- Total 90 36 220 29 29 58 .6 3.7

Page 54
2000-2001 Southeast Deer Survey Estimated Totals for Community of Residence by WAA
Total Community Number of Number Number Number Number Average Average of Number Hunters of Days of of of Deer/ Days/ Residence Wildlife Analysis Area of Hunters Successful Hunted Bucks Does Deer Hunter Deer _________________ ________________________________ __________ __________ __________ ______ ______ _______ __________ __________ HAINES 1420 COFFMAN CV, LUCK L., RATZ HBR. 5 5 9 0 5 5 1.0 2.0 2202 SULLIVAN R. AND ISL. 9 0 9 0 0 0 .0 .0 2722 DOUGLAS IS. 5 0 5 0 0 0 .0 .0 3002 SITKA ROAD SYSTEM 5 5 5 5 0 5 1.0 1.0 3104 N. KRUZOF IS. 9 9 36 32 5 36 4.0 1.0 3313 RODMAN AND SAOOK BAY DRS. 9 9 36 14 5 18 2.0 2.0 3315 CATHERINE ISL., L. EVA, HANUS BAY 5 5 9 5 0 5 1.0 2.0 3417 WEST COAST CHICHAGOF 5 5 5 0 9 9 2.0 .5 3418 YAKOBI IS. 23 18 59 36 0 36 1.6 1.6 3421 PT. ALTHORP, LR. LISIANSKI, INIAN IS. 23 9 36 14 0 14 .6 2.7 3523 E. SIDE PT. FREDERICK, GAME CR. 5 5 23 5 5 9 2.0 2.5 3525 FRESHWATER BAY DRS. 9 9 27 23 5 27 3.0 1.0 3526 N. SH. TENAKEE IN. 5 0 9 0 0 0 .0 .0 3551 WHTSTN. HBR., FALSE BAY DRS. 5 0 5 0 0 0 .0 .0 3630 UPPER TENAKEE IN. 5 5 23 14 0 14 3.0 1.7 3732 WARM SPRINGS COAST 5 5 14 14 0 14 3.0 1.0 4043 CENTRAL ADMIRALTY L. 5 5 23 9 0 9 2.0 2.5 4145 TIEDEMAN IS.-MOLE HBR. AREA 9 9 55 5 5 9 1.0 6.0 4146 WINDFALL HBR., SWAN CV DRS. 5 5 36 5 0 5 1.0 7.2 4148 WEST SIDE GLASS PENIN. 5 5 36 5 0 5 1.0 7.2 4222 PT. ADOLPHUS, MUD BAY AREA 5 5 14 0 5 5 1.0 3.0 4253 NEKA BAY DRS. 5 5 18 9 0 9 2.0 2.0 4256 LEMESURIER, PLEASANT IS. 5 0 5 0 0 0 .0 .0 9999 Blank/Missing 14 14 100 41 5 46 3.3 2.2 --------------------------------------------------------------------------------------------------------------------------------------------------------------------------------------------------------- Total 178 132 597 232 46 278 1.6 2.1 HID. FALLS HATCHERY 3731 KELP BAY-TAKATZ BAY 1 1 3 2 0 2 2.0 1.5 4041 WHITEWATER BAY, WILSON CV 1 1 1 1 0 1 1.0 1.0 --------------------------------------------------------------------------------------------------------------------------------------------------------------------------------------------------------- Total 2 2 4 3 0 3 1.5 1.3 HOLLIS 1316 KARTA BAY 5 5 5 5 0 5 1.0 1.0 1317 TWELVE MILE ARM, HARRIS R. 30 20 115 30 10 40 1.3 2.9 1318 CRAIG, KLAWOCK AREAS 5 5 15 5 0 5 1.0 3.0 1323 W. POW IS. 5 5 5 10 0 10 2.0 .5 1422 STANEY CR., NAUKATI, SARKAR 5 5 5 5 0 5 1.0 1.0 --------------------------------------------------------------------------------------------------------------------------------------------------------------------------------------------------------- Total 50 40 145 55 10 65 1.3 2.2 HOONAH 3314 FISH BAY DRS. 8 0 15 0 0 0 .0 .0 3420 IDAHO IN. DRS. 8 0 23 0 0 0 .0 .0 3523 E. SIDE PT. FREDERICK, GAME CR. 70 62 511 93 15 108 1.6 4.7 3524 HOONAH AREA 46 31 294 31 15 46 1.0 6.3 3525 FRESHWATER BAY DRS. 62 39 139 77 39 116 1.9 1.2 3551 WHTSTN. HBR., FALSE BAY DRS. 132 85 596 170 70 240 1.8 2.5 4222 PT. ADOLPHUS, MUD BAY AREA 15 15 54 31 0 31 2.0 1.8 4252 HUMPBACK, GALLAGHER CR.S 62 62 379 85 39 124 2.0 3.1 4253 NEKA BAY DRS. 39 31 39 54 0 54 1.4 .7 9999 Blank/Missing 23 23 255 15 8 23 1.0 11.0 --------------------------------------------------------------------------------------------------------------------------------------------------------------------------------------------------------- Total 464 348 2307 557 186 743 1.6 3.1 HYDABURG 1107 HYDABURG, HETTA IN., SUKKWAN IS. 22 11 34 22 0 22 1.0 1.5 1319 THORNE R. DRAINAGE 11 0 11 0 0 0 .0 .0 --------------------------------------------------------------------------------------------------------------------------------------------------------------------------------------------------------- Total 34 11 45 22 0 22 .7 2.0 HYDER 0823 PEARSE CANAL 3 0 45 0 0 0 .0 .0 0824 PEABODY MTNS. 3 0 15 0 0 0 .0 .0 --------------------------------------------------------------------------------------------------------------------------------------------------------------------------------------------------------- Total 5 0 60 0 0 0 .0 .0 JUNEAU 0901 SUEMEZ IS. 5 5 5 9 0 9 0.6 .5 1214 SKOWL ARM, POLK IN. 5 5 5 5 0 5 1.0 1.0 1318 CRAIG, KLAWOCK AREAS 9 9 37 19 0 19 2.0 2.0 1420 COFFMAN CV, LUCK L., RATZ HBR. 9 5 51 5 0 5 1.0 10.2 1422 STANEY CR., NAUKATI, SARKAR 5 5 14 14 0 14 3.0 1.0 1817 VIXEN IN., UNION BAY 5 0 5 0 0 0 .0 .0 1903 WRANGELL IS. 9 5 32 5 0 5 .5 6.4 2007 MITKOF IS. 9 5 19 5 0 5 .5 4.0 2514 COWEE,DAVIES CR.S 19 0 28 0 0 0 .0 .0 2515 EAGLE R.-MENDENHALL R. AREA 37 0 56 0 0 0 .0 .0 2517 JUNEAU AND LR. TAKU 42 5 69 5 0 5 .1 13.8 2620 LINCOLN IS. 69 19 157 14 9 23 .3 6.8 2621 SHELTER IS. 102 32 231 32 9 42 .4 5.6

Page 55
2000-2001 Southeast Deer Survey Estimated Totals for Community of Residence by WAA
Total Community Number of Number Number Number Number Average Average of Number Hunters of Days of of of Deer/ Days/ Residence Wildlife Analysis Area of Hunters Successful Hunted Bucks Does Deer Hunter Deer _________________ ________________________________ __________ __________ __________ ______ ______ _______ __________ __________ JUNEAU (cont) 2722 DOUGLAS IS. 602 116 1629 97 51 148 .2 11.0 2823 SNETTISHAM IN., SPEEL,WHITING R.S 14 5 19 14 0 14 1.0 1.3 3002 SITKA ROAD SYSTEM 5 0 5 0 0 0 .0 .0 3003 SILVER BAY, DEEP IN. 9 5 14 5 0 5 .5 3.0 3104 N. KRUZOF IS. 9 9 28 5 5 9 1.0 3.0 3206 REDOUBT L., NECKAR IS. 14 0 60 0 0 0 .0 .0 3207 CRAWFISH IN.S, NECKAR BAY 5 0 19 0 0 0 .0 .0 3308 KOOK L., SITKOH BAY, FALSE IS. 9 5 37 9 0 9 1.0 4.0 3309 N. SH. HOONAH SND. 5 0 19 0 0 0 .0 .0 3310 S. ARM HOONAH SND. 14 9 23 19 0 19 1.3 1.3 3311 USHK BAY-KAKUL NARROWS 5 5 0 5 5 9 2.0 .0 3315 CATHERINE ISL., L. EVA, HANUS BAY 5 0 32 0 0 0 .0 .0 3416 KHAZ PENIN., SLOCUM ARM 14 14 32 23 0 23 1.7 1.4 3417 WEST COAST CHICHAGOF 37 23 273 51 19 69 1.9 3.9 3418 YAKOBI IS. 9 0 19 0 0 0 .0 .0 3419 UPPER LISIANSKI IN., LISIANSKI R. 9 5 60 0 5 5 .5 12.0 3420 IDAHO IN. DRS. 32 14 153 19 0 19 .6 8.3 3421 PT. ALTHORP, LR. LISIANSKI, INIAN IS. 14 5 130 5 0 5 .3 26.0 3523 E. SIDE PT. FREDERICK, GAME CR. 28 19 74 28 9 37 1.3 2.0 3525 FRESHWATER BAY DRS. 65 42 204 56 9 65 1.0 3.1 3526 N. SH. TENAKEE IN. 83 56 273 69 0 69 .8 3.9 3551 WHTSTN. HBR., FALSE BAY DRS. 65 51 236 74 28 102 1.6 2.3 3627 CORNER BAY, TRAP BAY 28 19 23 28 5 32 1.2 .7 3629 S. SH. TENAKEE IN. 19 5 56 0 5 5 .3 11.2 3630 UPPER TENAKEE IN. 14 9 79 19 5 23 1.7 3.4 3731 KELP BAY-TAKATZ BAY 19 19 83 32 0 32 1.8 2.6 3733 WHALE BAY DRS., WILD. COAST 9 0 28 0 0 0 .0 .0 3734 S. BARANOF IS. 9 5 37 5 0 5 .5 7.4 3835 N. MANSFIELD PENIN. 296 120 787 167 42 208 .7 3.8 3836 HAWK IN., YOUNG BAY DRS. 282 148 736 143 56 199 .7 3.7 3837 WHEELER, GREENS CR.S DRS. 19 19 83 32 9 42 2.3 2.0 3938 GAMBIER BAY DRS. 51 32 222 46 19 65 1.3 3.4 3939 PYBUS BAY DRS. 14 14 65 9 9 19 1.3 3.5 4041 WHITEWATER BAY, WILSON CV 5 0 5 0 0 0 .0 .0 4042 ANGOON AREA 5 0 9 0 0 0 .0 .0 4043 CENTRAL ADMIRALTY L. 51 23 380 42 0 42 .8 9.1 4044 SHEE-ATIKA DRS. 69 42 343 74 28 102 1.5 3.4 4054 FISHERY, THAYER CR.S 5 0 28 0 0 0 .0 .0 4055 HOOD BAY, CHAIK BAY DRS. 9 0 56 0 0 0 .0 .0 4145 TIEDEMAN IS.-MOLE HBR. AREA 19 14 106 23 5 28 1.5 3.8 4146 WINDFALL HBR., SWAN CV DRS. 46 32 278 46 19 65 1.4 4.3 4147 UPPER SEYMOUR CANAL 37 14 153 9 9 19 .5 8.1 4148 WEST SIDE GLASS PENIN. 32 14 65 14 5 19 .6 3.5 4149 E. SIDE GLASS PENIN. 65 46 143 46 14 60 .9 2.4 4150 GRAND IS., OLIVER IN., STINK CR. 153 65 380 65 28 93 .6 4.1 4222 PT. ADOLPHUS, MUD BAY AREA 9 5 28 5 0 5 .5 5.6 4252 HUMPBACK, GALLAGHER CR.S 23 19 143 28 9 37 1.6 3.9 4253 NEKA BAY DRS. 9 9 23 14 0 14 1.5 1.7 4256 LEMESURIER, PLEASANT IS. 5 5 9 0 5 5 1.0 2.0 5138 S. LINDENBERG PENIN. 5 5 14 5 0 5 1.0 3.0 9999 Blank/Missing 111 111 847 185 37 222 2.0 3.8 --------------------------------------------------------------------------------------------------------------------------------------------------------------------------------------------------------- Total 2791 1264 9253 1625 454 2078 .7 4.4 KAKE 3733 WHALE BAY DRS., WILD. COAST 8 0 16 0 0 0 .0 .0 3939 PYBUS BAY DRS. 16 16 24 24 16 39 2.5 .6 3940 PT. GARDNER, ELIZA HBR. 24 24 39 39 0 39 1.7 1.0 5131 HAMILTON CR., BIG JOHN BAY 16 0 180 0 0 0 .0 .0 5132 KAKE AREA 24 0 251 0 0 0 .0 .0 5133 WEST DUNCAN CANAL 8 8 8 8 0 8 1.0 1.0 5138 S. LINDENBERG PENIN. 8 8 16 16 0 16 2.0 1.0 9999 Blank/Missing 8 8 39 24 0 24 3.0 1.7 --------------------------------------------------------------------------------------------------------------------------------------------------------------------------------------------------------- Total 110 63 572 110 16 125 1.1 4.5 KETCHIKAN 0101 GRAVINA IS. 163 24 597 36 0 36 .2 16.5 0404 E. REVILLA IS. 42 12 60 12 0 12 .3 5.0 0405 THORNE ARM, REVILLA IS. 48 24 127 42 0 42 .9 3.0 0406 CARROL IN. 121 30 868 36 0 36 .3 24.0 0407 GEORGE IN. 72 6 217 6 0 6 .1 36.0 0408 KETCHIKAN 72 18 609 18 0 18 .3 33.8 0509 NAHA AREA 78 6 205 6 0 6 .1 34.2 0510 NEETS BAY AREA 96 24 332 36 6 42 .4 7.9 0612 E. CLEVELAND PENIN. 18 6 36 6 0 6 .3 6.0 0613 HELM BAY 36 0 78 0 0 0 .0 .0 0614 MEYERS CHUCK 6 0 12 0 0 0 .0 .0 0822 BOCA DE QUADRA DRS. 12 0 24 0 0 0 .0 .0 0901 SUEMEZ IS. 6 0 6 0 0 0 .0 .0 1003 HECETA IS. 12 12 60 24 0 24 2.0 2.5 1106 LONG IS. 12 12 24 18 0 18 1.5 1.3 1107 HYDABURG, HETTA IN., SUKKWAN IS. 12 6 30 12 0 12 1.0 2.5

Page 56
2000-2001 Southeast Deer Survey Estimated Totals for Community of Residence by WAA
Total Community Number of Number Number Number Number Average Average of Number Hunters of Days of of of Deer/ Days/ Residence Wildlife Analysis Area of Hunters Successful Hunted Bucks Does Deer Hunter Deer _________________ ________________________________ __________ __________ __________ ______ ______ _______ __________ __________ KETCHIKAN (cont) 1211 KITKUN, S. ARM CHOLMONDELEY 18 0 24 0 0 0 .0 .0 1212 CLOVER MTN. 6 6 18 6 0 6 1.0 3.0 1214 SKOWL ARM, POLK IN. 30 18 90 24 0 24 .8 3.8 1315 KASAAN PEN., THORNE BAY 127 90 524 181 0 181 1.4 2.9 1316 KARTA BAY 30 18 60 24 0 24 .8 2.5 1317 TWELVE MILE ARM, HARRIS R. 12 6 24 6 0 6 .5 4.0 1318 CRAIG, KLAWOCK AREAS 6 0 12 0 0 0 .0 .0 1319 THORNE R. DRAINAGE 36 18 66 30 0 30 .8 2.2 1323 W. POW IS. 12 12 60 30 0 30 2.5 2.0 1332 TROCADERO BAY, WATERFALL AREA 6 0 12 0 0 0 .0 .0 1420 COFFMAN CV, LUCK L., RATZ HBR. 66 30 223 36 0 36 .5 6.2 1421 SWEETWATER L., LOGJAM CR. 18 18 66 24 12 36 2.0 1.8 1422 STANEY CR., NAUKATI, SARKAR 169 66 784 102 0 102 .6 7.6 1526 HOLBROOK MT., N. KOSCIUSKO IS. 6 0 6 0 0 0 .0 .0 1527 POW EL CAPITAN AREA 18 12 84 18 0 18 1.0 4.7 1528 SALMON BAY 18 12 42 18 0 18 1.0 2.3 1529 MT. CALDER, RED BAY, PT. PROT. 66 42 283 60 0 60 .9 4.7 1530 EXCHANGE CV, WHALE PASSAGE 66 36 271 66 0 66 1.0 4.1 1605 MUDDY R., PATTERSON GLACIER 6 0 12 0 0 0 .0 .0 1814 EAGLE R., S. SH. BRADFIELD CANAL 6 0 6 0 0 0 .0 .0 1817 VIXEN IN., UNION BAY 6 0 6 0 0 0 .0 .0 1901 N. ETOLIN IS. 6 0 18 0 0 0 .0 .0 1905 ZAREMBO IS. 12 0 24 0 0 0 .0 .0 1910 S. ETOLIN IS. 18 12 78 18 0 18 1.0 4.3 3001 NAKWASINA, NEVA STRAIT AREA 6 6 6 0 6 6 1.0 1.0 3002 SITKA ROAD SYSTEM 6 6 145 6 0 6 1.0 24.0 3003 SILVER BAY, DEEP IN. 6 0 24 0 0 0 .0 .0 3206 REDOUBT L., NECKAR IS. 6 6 6 6 0 6 1.0 1.0 3311 USHK BAY-KAKUL NARROWS 6 6 18 0 6 6 1.0 3.0 3314 FISH BAY DRS. 12 6 30 12 0 12 1.0 2.5 3420 IDAHO IN. DRS. 6 0 6 0 0 0 .0 .0 3731 KELP BAY-TAKATZ BAY 12 12 96 24 6 30 2.5 3.2 4043 CENTRAL ADMIRALTY L. 6 0 12 0 0 0 .0 .0 4222 PT. ADOLPHUS, MUD BAY AREA 6 6 6 6 0 6 1.0 1.0 5012 N. KUIU IS. 12 6 12 6 0 6 .5 2.0 5130 ROCKY PASS/KUPR. 12 0 36 0 0 0 .0 .0 5131 HAMILTON CR., BIG JOHN BAY 6 0 24 0 0 0 .0 .0 5132 KAKE AREA 6 0 18 0 0 0 .0 .0 9999 Blank/Missing 48 48 410 84 0 84 1.8 4.9 --------------------------------------------------------------------------------------------------------------------------------------------------------------------------------------------------------- Total 1730 681 6932 1043 36 1079 .6 6.4 KLAWOCK 0902 OUTSIDE IS. 8 0 8 0 0 0 .0 .0 1003 HECETA IS. 8 8 16 8 0 8 1.0 2.0 1105 DALL IS. 8 0 8 0 0 0 .0 .0 1107 HYDABURG, HETTA IN., SUKKWAN IS. 16 16 39 16 0 16 1.0 2.5 1214 SKOWL ARM, POLK IN. 31 16 79 16 0 16 .5 5.0 1315 KASAAN PEN., THORNE BAY 24 8 94 31 0 31 1.3 3.0 1317 TWELVE MILE ARM, HARRIS R. 16 0 71 0 0 0 .0 .0 1318 CRAIG, KLAWOCK AREAS 87 55 291 79 0 79 .9 3.7 1319 THORNE R. DRAINAGE 16 8 24 8 0 8 .5 3.0 1323 W. POW IS. 8 8 16 16 0 16 2.0 1.0 1332 TROCADERO BAY, WATERFALL AREA 16 8 8 8 0 8 .5 1.0 1420 COFFMAN CV, LUCK L., RATZ HBR. 31 16 47 16 0 16 .5 3.0 1421 SWEETWATER L., LOGJAM CR. 8 0 8 0 0 0 .0 .0 1422 STANEY CR., NAUKATI, SARKAR 102 47 228 47 8 55 .5 4.1 1529 MT. CALDER, RED BAY, PT. PROT. 16 16 16 16 0 16 1.0 1.0 9999 Blank/Missing 24 24 24 24 0 24 1.0 1.0 --------------------------------------------------------------------------------------------------------------------------------------------------------------------------------------------------------- Total 417 228 976 283 8 291 .7 3.3 METLAKATLA 0101 GRAVINA IS. 19 0 44 0 0 0 .0 .0 0202 ANNETTE IS. 19 19 194 31 0 31 1.7 6.2 0303 DUKE IS. 6 6 13 6 0 6 1.0 2.0 0404 E. REVILLA IS. 6 6 25 13 0 13 2.0 2.0 0405 THORNE ARM, REVILLA IS. 6 6 13 6 0 6 1.0 2.0 0406 CARROL IN. 6 6 25 6 0 6 1.0 4.0 1421 SWEETWATER L., LOGJAM CR. 6 6 50 6 6 13 2.0 4.0 --------------------------------------------------------------------------------------------------------------------------------------------------------------------------------------------------------- Total 69 50 363 69 6 75 1.1 4.9 MEYERS CHUCK 1003 HECETA IS. 6 6 28 22 0 22 4.0 1.3 1319 THORNE R. DRAINAGE 6 6 6 6 0 6 1.0 1.0 1531 TUXEKAN, MARBLE, SEA OTTER SND. 6 0 6 0 0 0 .0 .0 9999 Blank/Missing 6 6 6 6 0 6 1.0 1.0 --------------------------------------------------------------------------------------------------------------------------------------------------------------------------------------------------------- Total 22 17 44 33 0 33 1.5 1.4

Page 57
2000-2001 Southeast Deer Survey Estimated Totals for Community of Residence by WAA
Total Community Number of Number Number Number Number Average Average of Number Hunters of Days of of of Deer/ Days/ Residence Wildlife Analysis Area of Hunters Successful Hunted Bucks Does Deer Hunter Deer _________________ ________________________________ __________ __________ __________ ______ ______ _______ __________ __________ NAUKATI BAY 1420 COFFMAN CV, LUCK L., RATZ HBR. 6 6 128 6 0 6 1.0 21.3 1422 STANEY CR., NAUKATI, SARKAR 57 32 275 32 6 38 .7 7.2 1527 POW EL CAPITAN AREA 6 6 6 6 0 6 1.0 1.0 1529 MT. CALDER, RED BAY, PT. PROT. 19 13 32 13 0 13 .7 2.5 1530 EXCHANGE CV, WHALE PASSAGE 6 0 6 0 0 0 .0 .0 --------------------------------------------------------------------------------------------------------------------------------------------------------------------------------------------------------- Total 96 57 447 57 6 64 .7 7.1 PELICAN 3417 WEST COAST CHICHAGOF 9 5 24 5 0 5 .5 5.0 3418 YAKOBI IS. 19 9 43 9 9 19 1.0 2.3 3419 UPPER LISIANSKI IN., LISIANSKI R. 28 19 57 24 0 24 .8 2.4 3421 PT. ALTHORP, LR. LISIANSKI, INIAN IS. 5 5 5 5 0 5 1.0 1.0 3629 S. SH. TENAKEE IN. 5 5 5 5 0 5 1.0 1.0 --------------------------------------------------------------------------------------------------------------------------------------------------------------------------------------------------------- Total 66 43 132 47 9 57 .9 2.3 PETERSBURG 1318 CRAIG, KLAWOCK AREAS 4 4 4 4 0 4 1.0 1.0 1420 COFFMAN CV, LUCK L., RATZ HBR. 4 4 18 4 0 4 1.0 4.5 1525 S. KOSCIUSKO IS. 4 4 44 9 0 9 2.0 5.0 1526 HOLBROOK MT., N. KOSCIUSKO IS. 4 4 18 4 0 4 1.0 4.5 1528 SALMON BAY 22 13 75 18 4 22 1.0 3.4 1529 MT. CALDER, RED BAY, PT. PROT. 9 4 22 4 0 4 .5 5.5 1530 EXCHANGE CV, WHALE PASSAGE 4 4 13 4 0 4 1.0 3.3 1531 TUXEKAN, MARBLE, SEA OTTER SND. 9 0 35 0 0 0 .0 .0 1602 FARRAGUT R. DRAINAGE 4 0 18 0 0 0 .0 .0 1605 MUDDY R., PATTERSON GLACIER 106 31 377 40 0 40 .4 9.4 1706 HORN CLIFFS, LE CONTE BAY 4 0 13 0 0 0 .0 .0 1707 N. ARM OF THE STIKINE 4 0 22 0 0 0 .0 .0 1903 WRANGELL IS. 4 0 9 0 0 0 .0 .0 1905 ZAREMBO IS. 120 62 417 89 0 89 .7 4.7 1906 KASHEVAROF IS. 4 0 9 0 0 0 .0 .0 2007 MITKOF IS. 354 137 1312 146 18 164 .5 8.0 2722 DOUGLAS IS. 4 4 27 4 0 4 1.0 6.8 3732 WARM SPRINGS COAST 4 4 4 9 0 9 2.0 .5 3938 GAMBIER BAY DRS. 18 13 71 27 18 44 2.5 1.6 3939 PYBUS BAY DRS. 58 40 173 93 4 97 1.7 1.8 3940 PT. GARDNER, ELIZA HBR. 22 18 142 31 4 35 1.6 4.0 4145 TIEDEMAN IS.-MOLE HBR. AREA 9 4 13 4 4 9 1.0 1.5 4148 WEST SIDE GLASS PENIN. 4 0 4 0 0 0 .0 .0 5012 N. KUIU IS. 4 4 22 4 0 4 1.0 5.5 5017 S. KUIU IS. 4 0 18 0 0 0 .0 .0 5130 ROCKY PASS/KUPR. 4 4 9 4 0 4 1.0 2.3 5132 KAKE AREA 4 4 9 9 0 9 2.0 1.0 5133 WEST DUNCAN CANAL 44 22 164 27 0 27 .6 6.2 5134 S. SH. KUPR. 31 27 84 40 0 40 1.3 2.1 5136 PORTAGE BAY, NW KUPR. 13 4 18 9 0 9 .7 2.0 5137 PETERSBURG CR. 4 0 44 0 0 0 .0 .0 5138 S. LINDENBERG PENIN. 80 40 213 53 0 53 .7 4.0 9999 Blank/Missing 13 13 62 13 0 13 1.0 4.7 --------------------------------------------------------------------------------------------------------------------------------------------------------------------------------------------------------- Total 988 474 3483 651 53 705 .7 5.0 POINT BAKER 1528 SALMON BAY 8 0 8 0 0 0 .0 .0 1529 MT. CALDER, RED BAY, PT. PROT. 17 8 42 8 0 8 .5 5.3 5012 N. KUIU IS. 8 8 84 8 0 8 1.0 10.5 5014 E. KUIU IS., CONCLUSION IS. 8 8 17 8 0 8 1.0 2.0 5134 S. SH. KUPR. 8 8 25 17 0 17 2.0 1.5 --------------------------------------------------------------------------------------------------------------------------------------------------------------------------------------------------------- Total 50 34 176 42 0 42 .8 4.3 PORT ALEXANDER 3734 S. BARANOF IS. 20 10 70 20 0 20 1.0 3.5 --------------------------------------------------------------------------------------------------------------------------------------------------------------------------------------------------------- Total 20 10 70 20 0 20 1.0 3.5 SITKA 1422 STANEY CR., NAUKATI, SARKAR 11 11 54 22 5 27 2.5 2.0 1901 N. ETOLIN IS. 5 0 27 0 0 0 .0 .0 1905 ZAREMBO IS. 11 11 70 11 0 11 1.0 6.5 2007 MITKOF IS. 5 0 38 0 0 0 .0 .0 3001 NAKWASINA, NEVA STRAIT AREA 458 296 1077 361 162 522 1.1 2.1 3002 SITKA ROAD SYSTEM 350 140 1152 145 59 205 .6 5.6 3003 SILVER BAY, DEEP IN. 129 54 404 97 11 108 .8 3.8 3104 N. KRUZOF IS. 145 86 377 124 65 188 1.3 2.0 3105 S. KRUZOF IS. 75 48 124 59 5 65 .9 1.9 3206 REDOUBT L., NECKAR IS. 81 38 156 32 38 70 .9 2.2 3207 CRAWFISH IN.S, NECKAR BAY 113 75 215 75 27 102 .9 2.1 3308 KOOK L., SITKOH BAY, FALSE IS. 59 32 162 48 5 54 .9 3.0 3309 N. SH. HOONAH SND. 32 27 48 22 11 32 1.0 1.5

Page 58
2000-2001 Southeast Deer Survey Estimated Totals for Community of Residence by WAA
Total Community Number of Number Number Number Number Average Average of Number Hunters of Days of of of Deer/ Days/ Residence Wildlife Analysis Area of Hunters Successful Hunted Bucks Does Deer Hunter Deer _________________ ________________________________ __________ __________ __________ ______ ______ _______ __________ __________ SITKA (cont) 3310 S. ARM HOONAH SND. 129 59 377 86 38 124 1.0 3.0 3311 USHK BAY-KAKUL NARROWS 38 27 113 22 11 32 .9 3.5 3312 DUFFIELD PENIN., BEAR BAY 59 43 92 27 22 48 .8 1.9 3313 RODMAN AND SAOOK BAY DRS. 81 54 242 75 22 97 1.2 2.5 3314 FISH BAY DRS. 140 54 264 43 16 59 .4 4.5 3315 CATHERINE ISL., L. EVA, HANUS BAY 32 22 70 27 0 27 .8 2.6 3416 KHAZ PENIN., SLOCUM ARM 32 27 59 43 5 48 1.5 1.2 3417 WEST COAST CHICHAGOF 11 5 22 5 0 5 .5 4.4 3526 N. SH. TENAKEE IN. 5 0 11 0 0 0 .0 .0 3627 CORNER BAY, TRAP BAY 11 0 22 0 0 0 .0 .0 3731 KELP BAY-TAKATZ BAY 11 11 38 27 5 32 3.0 1.2 3732 WARM SPRINGS COAST 5 5 22 5 0 5 1.0 4.4 3733 WHALE BAY DRS., WILD. COAST 27 16 59 16 0 16 .6 3.7 3734 S. BARANOF IS. 16 11 54 16 11 27 1.7 2.0 9999 Blank/Missing 59 59 167 59 16 75 1.3 2.2 --------------------------------------------------------------------------------------------------------------------------------------------------------------------------------------------------------- Total 2132 1212 5514 1449 533 1982 .9 2.8 SKAGWAY 3315 CATHERINE ISL., L. EVA, HANUS BAY 6 6 42 3 3 6 1.0 7.0 4252 HUMPBACK, GALLAGHER CR.S 3 0 6 0 0 0 .0 .0 4253 NEKA BAY DRS. 3 0 10 0 0 0 .0 .0 9999 Blank/Missing 3 3 51 3 0 3 1.0 17.0 --------------------------------------------------------------------------------------------------------------------------------------------------------------------------------------------------------- Total 16 10 109 6 3 10 .6 12.1 TENAKEE SPRINGS 3308 KOOK L., SITKOH BAY, FALSE IS. 4 0 8 0 0 0 .0 .0 3525 FRESHWATER BAY DRS. 4 4 100 4 0 4 1.0 25.0 3526 N. SH. TENAKEE IN. 8 0 16 0 0 0 .0 .0 3627 CORNER BAY, TRAP BAY 20 20 160 12 16 28 1.4 5.7 3628 KADASHAN 4 4 12 4 0 4 1.0 3.0 3629 S. SH. TENAKEE IN. 4 0 4 0 0 0 .0 .0 9999 Blank/Missing 0 0 12 0 0 0 . .0 --------------------------------------------------------------------------------------------------------------------------------------------------------------------------------------------------------- Total 44 28 312 20 16 36 .8 8.7 THORNE BAY 1214 SKOWL ARM, POLK IN. 5 5 5 5 0 5 1.0 1.0 1315 KASAAN PEN., THORNE BAY 164 103 1626 131 5 135 .8 12.0 1317 TWELVE MILE ARM, HARRIS R. 5 5 5 5 0 5 1.0 1.0 1318 CRAIG, KLAWOCK AREAS 5 5 5 5 0 5 1.0 1.0 1319 THORNE R. DRAINAGE 135 84 813 131 5 135 1.0 6.0 1420 COFFMAN CV, LUCK L., RATZ HBR. 14 5 33 5 0 5 .3 6.6 1421 SWEETWATER L., LOGJAM CR. 14 0 42 0 0 0 .0 .0 1422 STANEY CR., NAUKATI, SARKAR 42 19 182 14 5 19 .4 9.6 1527 POW EL CAPITAN AREA 5 5 9 5 0 5 1.0 1.8 1530 EXCHANGE CV, WHALE PASSAGE 9 9 23 9 0 9 1.0 2.5 1531 TUXEKAN, MARBLE, SEA OTTER SND. 5 0 84 0 0 0 .0 .0 1910 S. ETOLIN IS. 5 0 5 0 0 0 .0 .0 9999 Blank/Missing 14 14 103 19 0 19 1.3 5.5 --------------------------------------------------------------------------------------------------------------------------------------------------------------------------------------------------------- Total 420 252 2934 327 14 341 .8 8.6 WHALE PASS 1527 POW EL CAPITAN AREA 9 5 52 5 0 5 .5 10.4 1529 MT. CALDER, RED BAY, PT. PROT. 14 5 113 19 0 19 1.3 6.0 1530 EXCHANGE CV, WHALE PASSAGE 24 19 240 38 0 38 1.6 6.4 --------------------------------------------------------------------------------------------------------------------------------------------------------------------------------------------------------- Total 47 28 405 61 0 61 1.3 6.5 WHITESTONE CAMP 3523 E. SIDE PT. FREDERICK, GAME CR. 27 16 109 16 0 16 .6 6.7 3524 HOONAH AREA 16 5 38 11 0 11 .7 3.5 3525 FRESHWATER BAY DRS. 16 5 16 5 0 5 .3 3.0 3551 WHTSTN. HBR., FALSE BAY DRS. 5 0 5 0 0 0 .0 .0 --------------------------------------------------------------------------------------------------------------------------------------------------------------------------------------------------------- Total 65 27 169 33 0 33 .5 5.3 WRANGELL 1332 TROCADERO BAY, WATERFALL AREA 5 0 5 0 0 0 .0 .0 1526 HOLBROOK MT., N. KOSCIUSKO IS. 5 5 18 9 0 9 2.0 2.0 1528 SALMON BAY 9 0 28 0 0 0 .0 .0 1529 MT. CALDER, RED BAY, PT. PROT. 5 0 14 0 0 0 .0 .0 1530 EXCHANGE CV, WHALE PASSAGE 32 23 92 37 32 69 2.1 1.3 1531 TUXEKAN, MARBLE, SEA OTTER SND. 9 9 46 32 0 32 3.5 1.4 1708 STIKINE R. DRAINAGE 5 0 46 0 0 0 .0 .0 1810 VIRGINIA L., GARNET MTN. 5 0 18 0 0 0 .0 .0 1817 VIXEN IN., UNION BAY 9 5 32 5 0 5 .5 6.4 1901 N. ETOLIN IS. 78 28 179 32 0 32 .4 5.6 1903 WRANGELL IS. 179 69 1279 74 18 92 .5 13.9

Page 59
2000-2001 Southeast Deer Survey Estimated Totals for Community of Residence by WAA
Total Community Number of Number Number Number Number Average Average of Number Hunters of Days of of of Deer/ Days/ Residence Wildlife Analysis Area of Hunters Successful Hunted Bucks Does Deer Hunter Deer _________________ ________________________________ __________ __________ __________ ______ ______ _______ __________ __________ WRANGELL (cont) 1904 WORONKOFSKI AND STIKINE MOUTH IS. 14 5 14 5 0 5 .3 3.0 1905 ZAREMBO IS. 304 175 1366 322 0 322 1.1 4.2 1906 KASHEVAROF IS. 18 9 32 18 0 18 1.0 1.8 1910 S. ETOLIN IS. 32 9 97 9 0 9 .3 10.8 4044 SHEE-ATIKA DRS. 9 9 60 23 9 32 3.5 1.9 5130 ROCKY PASS/KUPR. 5 0 32 0 0 0 .0 .0 5134 S. SH. KUPR. 9 5 23 9 0 9 1.0 2.5 9999 Blank/Missing 18 18 32 18 5 23 1.3 1.4 --------------------------------------------------------------------------------------------------------------------------------------------------------------------------------------------------------- Total 750 368 3413 593 64 658 .9 5.2 YAKUTAT 3311 USHK BAY-KAKUL NARROWS 4 0 22 0 0 0 .0 .0 3835 N. MANSFIELD PENIN. 4 4 13 4 4 9 2.0 1.5 4504 YAKUTAT BAY IS. 4 0 9 0 0 0 .0 .0 --------------------------------------------------------------------------------------------------------------------------------------------------------------------------------------------------------- Total 13 4 45 4 4 9 .7 4.9 --------------------------------------------------------------------------------------------------------------------------------------------------------------------------------------------------------- Grand Total 12448 6448 45990 8779 1768 10547 .8 4.4

Page 60
2000-2001 Southeast Deer Survey Estimated Totals for Proxy Hunters
by Community of Residence
Number Percent Total Number of of Number of Suc. Proxy of Proxy Proxy Hunters Proxy Community Hunters Hunters Suc. Deer _____________________ _______ _______ _______ _______
ANGOON 7 7 100.0% 15
CRAIG 9 9 100.0% 9
GAME CREEK 3 0 .0% 0
HAINES 14 5 33.3% 9
HOLLIS 5 5 100.0% 5
HOONAH 15 15 100.0% 101
JUNEAU 28 9 33.3% 14
KETCHIKAN 18 12 66.7% 30
KLAWOCK 8 8 100.0% 8
MEYERS CHUCK 6 0 .0% 0
PETERSBURG 35 22 62.5% 27
SITKA 11 11 100.0% 43
WRANGELL 32 18 57.1% 28
------------------------------------------------------------------------------------------------------------------------------------------------------------------ TOTAL 191 122 63.7% 287

Page 61
2000-2001 Southeast Deer Survey Estimated Totals for Federal "Designated" Hunters
by Community of Residence
Number Percent Total Number of of Number of Suc. Federal of Federal Federal Hunters Federal Community Hunters Hunters Suc. Deer _____________________ _______ _______ _______ _______
CRAIG 9 9 100.0% 9
GUSTAVUS 4 4 100.0% 11
HAINES 5 0 .0% 0
HOONAH 15 15 100.0% 70
JUNEAU 5 5 100.0% 5
KETCHIKAN 6 6 100.0% 24
PETERSBURG 66 49 73.3% 115
SITKA 22 22 100.0% 81
THORNE BAY 9 9 100.0% 19
WRANGELL 55 32 58.3% 64
------------------------------------------------------------------------------------------------------------------------------------------------------------------ TOTAL 196 150 76.8% 397
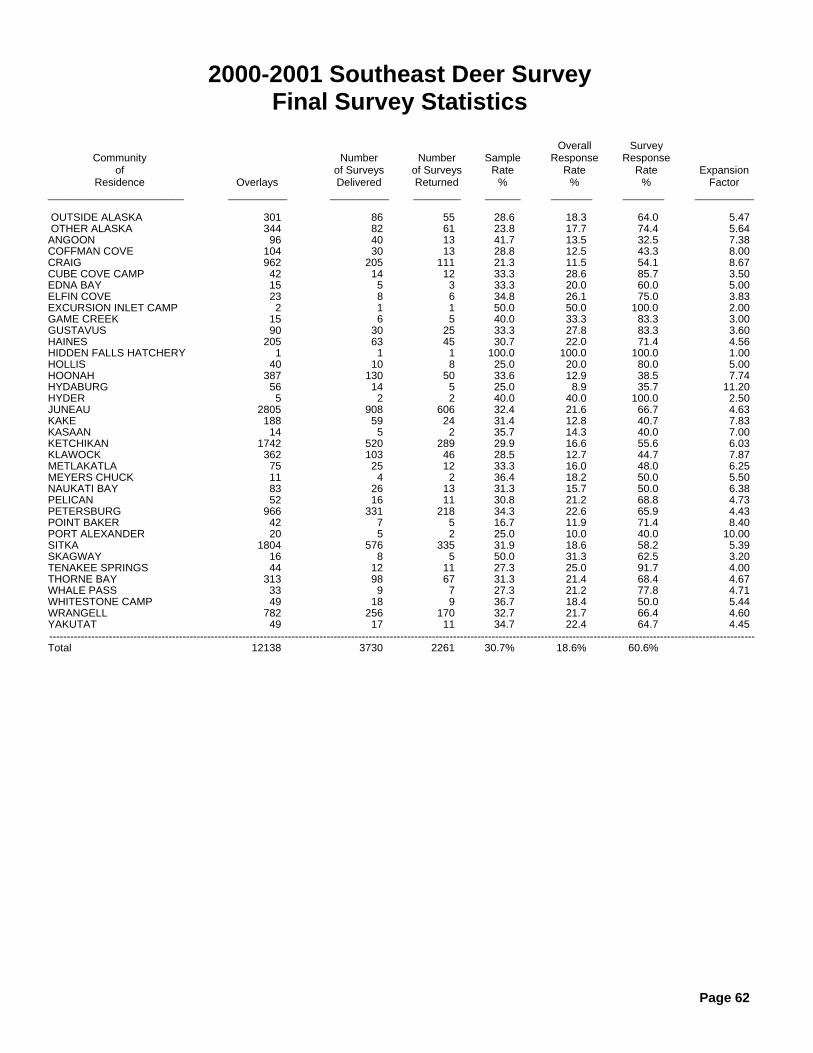
Page 62
2000-2001 Southeast Deer Survey Final Survey Statistics
Overall Survey Community Number Number Sample Response Response of of Surveys of Surveys Rate Rate Rate Expansion Residence Overlays Delivered Returned % % % Factor _______________________ __________ __________ ________ ______ _______ _______ __________ OUTSIDE ALASKA 301 86 55 28.6 18.3 64.0 5.47 OTHER ALASKA 344 82 61 23.8 17.7 74.4 5.64 ANGOON 96 40 13 41.7 13.5 32.5 7.38 COFFMAN COVE 104 30 13 28.8 12.5 43.3 8.00 CRAIG 962 205 111 21.3 11.5 54.1 8.67 CUBE COVE CAMP 42 14 12 33.3 28.6 85.7 3.50 EDNA BAY 15 5 3 33.3 20.0 60.0 5.00 ELFIN COVE 23 8 6 34.8 26.1 75.0 3.83 EXCURSION INLET CAMP 2 1 1 50.0 50.0 100.0 2.00 GAME CREEK 15 6 5 40.0 33.3 83.3 3.00 GUSTAVUS 90 30 25 33.3 27.8 83.3 3.60 HAINES 205 63 45 30.7 22.0 71.4 4.56 HIDDEN FALLS HATCHERY 1 1 1 100.0 100.0 100.0 1.00 HOLLIS 40 10 8 25.0 20.0 80.0 5.00 HOONAH 387 130 50 33.6 12.9 38.5 7.74 HYDABURG 56 14 5 25.0 8.9 35.7 11.20 HYDER 5 2 2 40.0 40.0 100.0 2.50 JUNEAU 2805 908 606 32.4 21.6 66.7 4.63 KAKE 188 59 24 31.4 12.8 40.7 7.83 KASAAN 14 5 2 35.7 14.3 40.0 7.00 KETCHIKAN 1742 520 289 29.9 16.6 55.6 6.03 KLAWOCK 362 103 46 28.5 12.7 44.7 7.87 METLAKATLA 75 25 12 33.3 16.0 48.0 6.25 MEYERS CHUCK 11 4 2 36.4 18.2 50.0 5.50 NAUKATI BAY 83 26 13 31.3 15.7 50.0 6.38 PELICAN 52 16 11 30.8 21.2 68.8 4.73 PETERSBURG 966 331 218 34.3 22.6 65.9 4.43 POINT BAKER 42 7 5 16.7 11.9 71.4 8.40 PORT ALEXANDER 20 5 2 25.0 10.0 40.0 10.00 SITKA 1804 576 335 31.9 18.6 58.2 5.39 SKAGWAY 16 8 5 50.0 31.3 62.5 3.20 TENAKEE SPRINGS 44 12 11 27.3 25.0 91.7 4.00 THORNE BAY 313 98 67 31.3 21.4 68.4 4.67 WHALE PASS 33 9 7 27.3 21.2 77.8 4.71 WHITESTONE CAMP 49 18 9 36.7 18.4 50.0 5.44 WRANGELL 782 256 170 32.7 21.7 66.4 4.60 YAKUTAT 49 17 11 34.7 22.4 64.7 4.45 --------------------------------------------------------------------------------------------------------------------------------------------------------------------------------------------------------- Total 12138 3730 2261 30.7% 18.6% 60.6%

Page 63
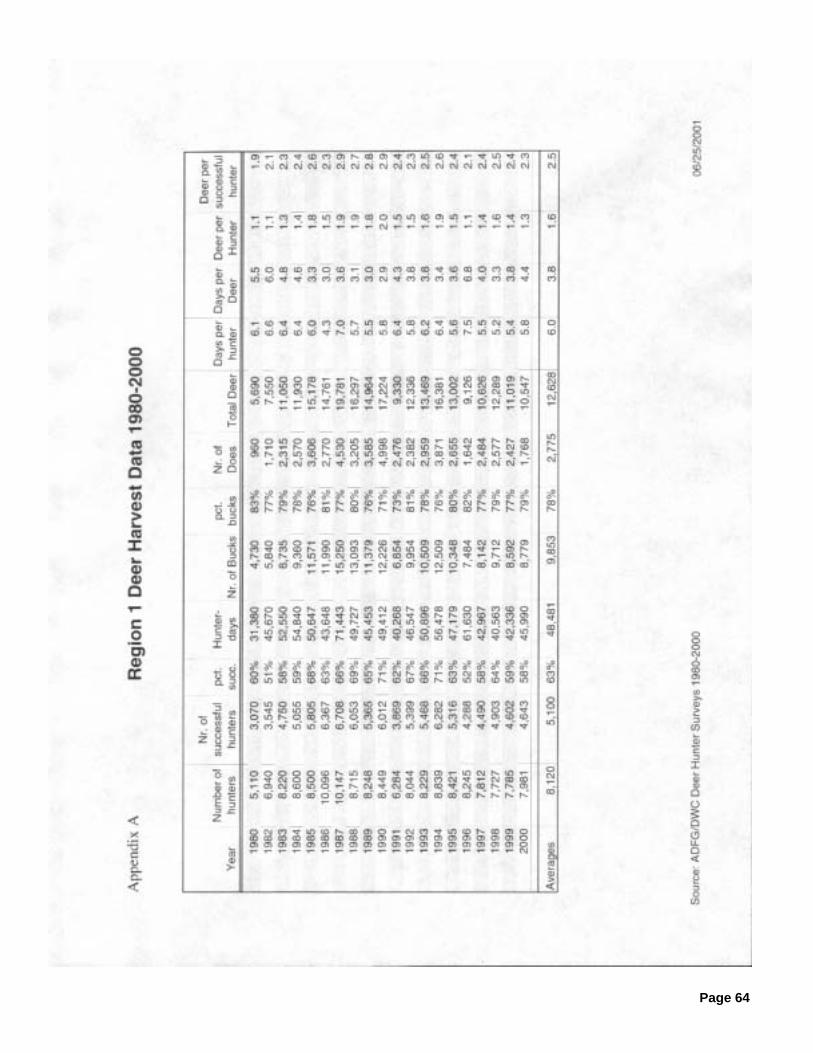
Page 64
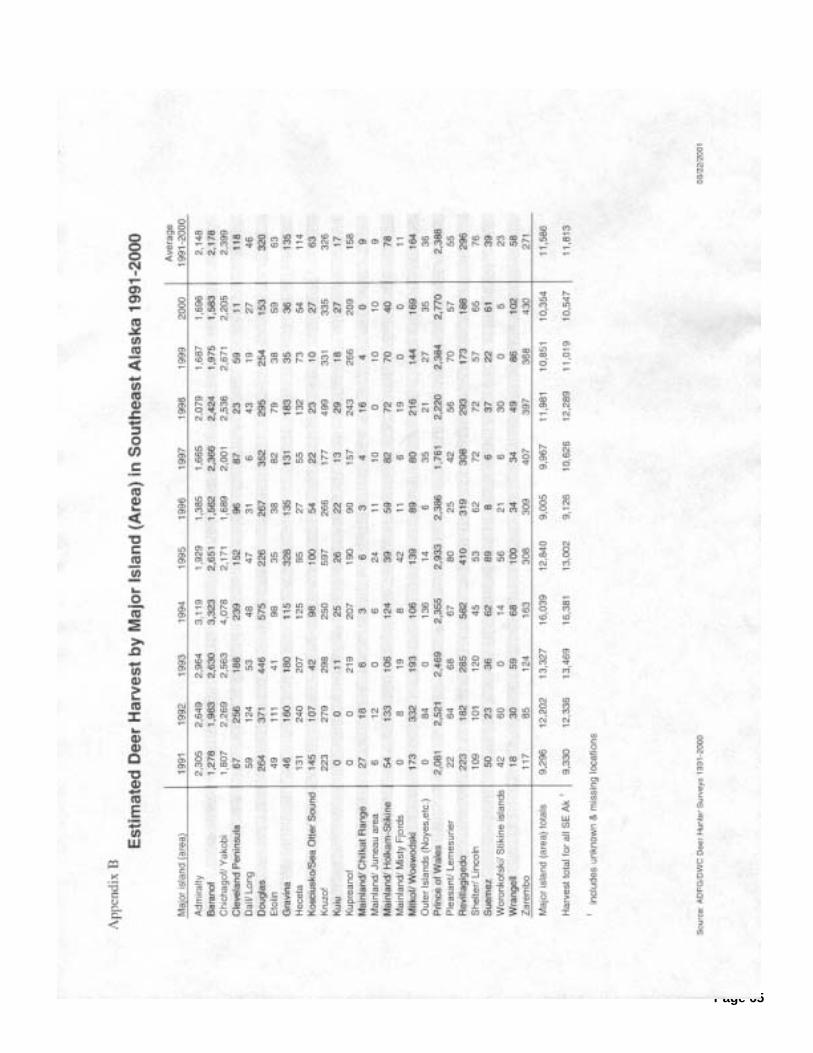
Page 65

Page 66

Page 67

Page 68