20 March 2013 Volume 9 Issue 5 Cover Story
21
Automated Analysis Determining glyphosate residues in water and food 2 Automated Derivatization, Cleanup and LC–MS–MS Determination of Glyphosate and AMPA Norbert Helle and Franziska Chmelka, TeLA GmbH, Bremerhaven, Germany. A reliable and sensitive determination of glyphosate residues in water and food is discussed. Cover Story Features 13 Verifying Data Quality of an Untargeted Approach to Analyse Terroir in Wine Grape Juice Mark Dreyer 1 , Paul Tarr 2 and Michael Athanas 1 , 1 Thermo Fisher Scientific, San Jose California, USA, 2 California Institute of Technology, Pasadena, California, USA. A careful approach to data handling is important for the understanding of how certain procedures alter the metabolic profile of samples. Regulars 9 News Using breath as an indicator of stress levels, a biomarker for river blindness is discovered, Agilent supports cancer research and Bruker expands its reach in India. 11 Incognito A Testing Time... Incognito espouses the benefits of a rigorous testing procedure in the workplace. 18 CHROMacademy Update on what’s new on the professional site for chromatographers. 19 Training Courses and Events 21 Staff 20 March 2013 Volume 9 Issue 5
Transcript of 20 March 2013 Volume 9 Issue 5 Cover Story

Automated Analysis
Determining glyphosate residues in water and food
2 Automated Derivatization, Cleanup and LC–MS–MS Determination of Glyphosate and AMPA
Norbert Helle and Franziska Chmelka, TeLA GmbH,
Bremerhaven, Germany. A reliable and sensitive determination of glyphosate residues in
water and food is discussed.
Cover Story
Features13 Verifying Data Quality of an Untargeted Approach to Analyse Terroir in Wine Grape Juice Mark Dreyer1, Paul Tarr2 and Michael Athanas1,1Thermo Fisher Scientific,
San Jose California, USA, 2California Institute of Technology, Pasadena,
California, USA.
A careful approach to data handling is important for the understanding of
how certain procedures alter the metabolic profile of samples.
Regulars
9 News
Using breath as an indicator of stress levels, a biomarker for river
blindness is discovered, Agilent supports cancer research and Bruker expands
its reach in India.
11 Incognito A Testing Time... Incognito espouses the benefits of a rigorous testing procedure in the workplace.
18 CHROMacademy
Update on what’s new on the professional site for chromatographers.
19 Training Courses and Events
21 Staff
20 March 2013 Volume 9 Issue 5
Ph
oto
Cre
dit
: W
esl
ey H
itt/
Ge
tty I
ma
ge
s
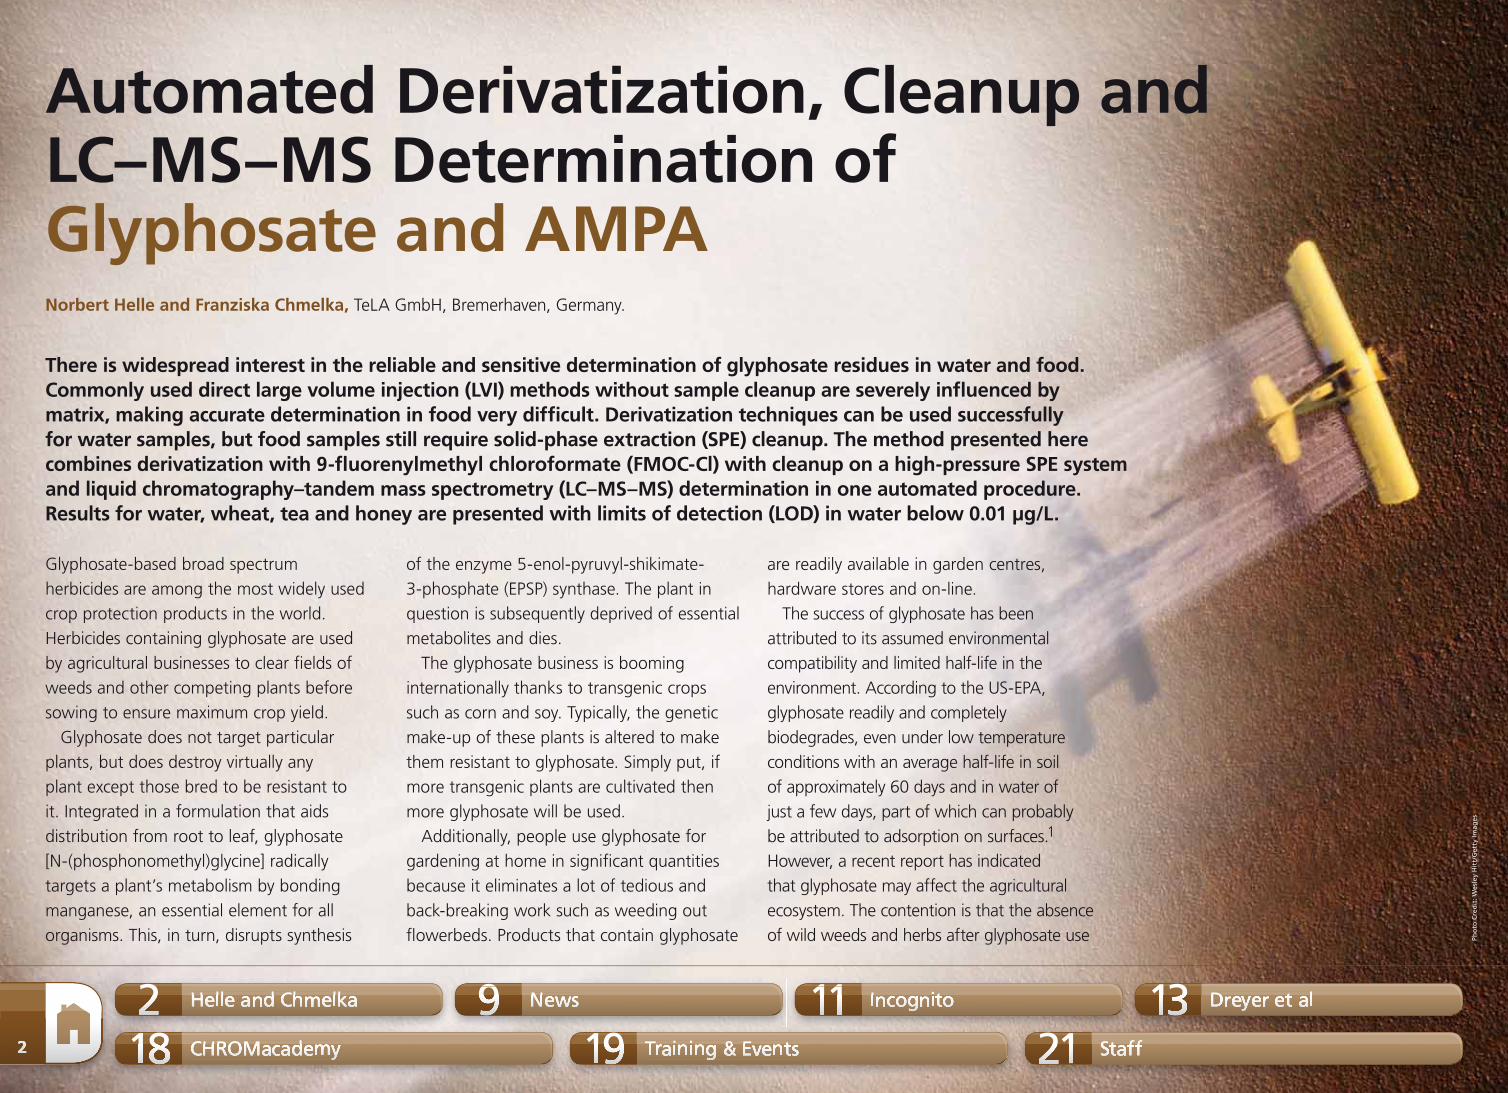
Automated Derivatization, Cleanup and LC–MS–MS Determination of Glyphosate and AMPA
There is widespread interest in the reliable and sensitive determination of glyphosate residues in water and food.
Commonly used direct large volume injection (LVI) methods without sample cleanup are severely infl uenced by
matrix, making accurate determination in food very diffi cult. Derivatization techniques can be used successfully
for water samples, but food samples still require solid-phase extraction (SPE) cleanup. The method presented here
combines derivatization with 9-fl uorenylmethyl chloroformate (FMOC-Cl) with cleanup on a high-pressure SPE system
and liquid chromatography–tandem mass spectrometry (LC–MS–MS) determination in one automated procedure.
Results for water, wheat, tea and honey are presented with limits of detection (LOD) in water below 0.01 μg/L.
Norbert Helle and Franziska Chmelka, TeLA GmbH, Bremerhaven, Germany.
Glyphosate-based broad spectrum
herbicides are among the most widely used
crop protection products in the world.
Herbicides containing glyphosate are used
by agricultural businesses to clear fi elds of
weeds and other competing plants before
sowing to ensure maximum crop yield.
Glyphosate does not target particular
plants, but does destroy virtually any
plant except those bred to be resistant to
it. Integrated in a formulation that aids
distribution from root to leaf, glyphosate
[N-(phosphonomethyl)glycine] radically
targets a plant’s metabolism by bonding
manganese, an essential element for all
organisms. This, in turn, disrupts synthesis
of the enzyme 5-enol-pyruvyl-shikimate-
3-phosphate (EPSP) synthase. The plant in
question is subsequently deprived of essential
metabolites and dies.
The glyphosate business is booming
internationally thanks to transgenic crops
such as corn and soy. Typically, the genetic
make-up of these plants is altered to make
them resistant to glyphosate. Simply put, if
more transgenic plants are cultivated then
more glyphosate will be used.
Additionally, people use glyphosate for
gardening at home in signifi cant quantities
because it eliminates a lot of tedious and
back-breaking work such as weeding out
fl owerbeds. Products that contain glyphosate
are readily available in garden centres,
hardware stores and on-line.
The success of glyphosate has been
attributed to its assumed environmental
compatibility and limited half-life in the
environment. According to the US-EPA,
glyphosate readily and completely
biodegrades, even under low temperature
conditions with an average half-life in soil
of approximately 60 days and in water of
just a few days, part of which can probably
be attributed to adsorption on surfaces.1
However, a recent report has indicated
that glyphosate may affect the agricultural
ecosystem. The contention is that the absence
of wild weeds and herbs after glyphosate use
2
Helle and Chmelka2 News9 Incognito11 Dreyer et al1399 11CHROMacademy18 Training & Events19 Staff21

The Column www.chromatographyonline.com
reduces biodiversity in the food chain and is suspected of making plants more susceptible to diseases and of reducing the availability of nutrients for plants. This, in turn, could trigger an increased reliance on pesticides and fertilizers. According to the same report, more herbicide will ultimately be used in the medium term because more weeds are developing resistance to glyphosate.2 For these reasons, environmentalists are demanding that the widespread herbicidal use of glyphosate be addressed with renewed urgency, pointing to plans for cultivating glyphosate-resistant, genetically modifi ed plants in Europe.
Conversely, Germany’s infl uential Federal Institute for Risk Assessment (BfR) has concluded that there is no risk to human reproduction as alleged by environmentalists. According to the BfR: “Not only the EU but also the WHO and the US-EPA have come to the conclusion that glyphosate is detrimental neither to the reproduction nor the development of mammals including humans.”3
Whether there is cause for alarm or not, the increased awareness has led to growing demand for reliable and sensitive determination of glyphosate. Monitoring
OHOH
O
O
OCl
OCI
OH
OH
OH
H2N
O
P
HO
NH
O
OO
OH
HO
P
HO
OHP
O
O
O O
N
Glyphosate
AMPA
FMOC-CI
FMOC-CI
Glyphosate–FMOCMonoisotopic mass = 391
AMPA–FMOCMonoisotopic mass = 333
NHO
O
P +
+
Figure 1: Structural representations of glyphosate, AMPA and their FMOC-derivatives.
Helle and Chmelka
33
Helle and Chmelka2 Helle and Chmelka2 News9 Incognito11 Dreyer et al13 Dreyer et al131399 News99 11 Incognito11CHROMacademy18 CHROMacademy1818 Training & Events19 Training & Events1919 Staff21 Staff21

The Column www.chromatographyonline.com
them for higher throughput, lower limits of
detection (LOD) and improved accuracy while
using standard systems. In particular, we
wanted to improve method sensitivity using
a concentration step. Because of their high
polarity, glyphosate and its main metabolite,
aminomethylphosphonic acid (AMPA) are
diffi cult to analyse directly using HPLC.
However, the compounds can be derivatized
using 9-fl uorenylmethyl chloroformate
(FMOC-Cl) as described in method DIN/
ISO 214587,4 which has been used for this
would apply both to agricultural products,
for food safety reasons, and to environmental
samples such as soil and water.
Analysis Method
Glyphosate and its most important
metabolite, aminomethylphosphonic acid
(AMPA), are generally determined using
high performance liquid chromatography
(HPLC) coupled with multidimensional
mass selective detection (MS–MS). When
we developed our method, we wanted to
achieve liquid chromatography–tandem
mass spectrometry (LC–MS–MS) trace-level
determination of glyphosate and AMPA in
water using direct injection. The focus was
not on copying existing methods, but rather
on developing them further and automating
Overlay chromatograms of Glyphosate and AMPA in wheat matrix at 0.01 and 0.1 mg/kg respectively after derivatization and cleanup
x10
2
x10
2
0.5
0.75
1
1.25
1.5
1.75
2
2.25
2.5
2.75
3
3.25
3.5
3.75
4
4.25
4.5
4.75
5
5.25
5.5
5.75
6
6.25
6.5
6.75
7
7.25
7.5
7.75
8
8.25
8.5
8.75-ESI MRM Frag=80.0V CID@** (390.1000 -> 168.0000) GLY-AMPA-532.d Smooth
1 22 33 44
Counts vs. Acquisition Time (min)
2 2.5 3 3.5 4 4.5 5 5.5 6 6.5 7 7.5 8 8.5 9 9.5 10 10.5
0.5
0.75
1
1.25
1.5
1.75
2
2.25
2.5
2.75
3
3.25
3.5
3.75
4
4.25
4.5
4.75
5
5.25
5.5
5.75
6
6.25
6.5
6.75
7
7.25
7.5
7.75
8
8.25
8.5
8.75
9
-ESI MRM Frag=80.0V CID@** (332.2000 -> 109.9000) GLY-AMPA-532.d Smooth
1 22 33 4
Counts vs. Acquisition Time (min)
2 2.5 3 3.5 4 4.5 5 5.5 6 6.5 7 7.5 8 8.5 9 9.5 10 10.5
Figure 3: Chromatograms resulting from the extraction of spiked wheat samples. Glyphosate concentrations 0.01 mg/kg (red trace) and 0.1 mg/kg (green trace), respectively. AMPA concentrations 0.01 mg/kg (green trace) and 0.1 mg/kg (red trace), respectively. Mass transitions monitored for glyphosate: 390 --> 168 and 390 --> 150; for AMPA 332 --> 136 and 332 --> 110.
Glyphosate FMOC - 4 Levels, 4 Levels Used, 5 Points, 5 Points Used, 0 QCs
Concentration (ng/ml)
0 0.5 1 1.5 2 2.5 3 3.5 4 4.5 5
y = 7881.396964 * x + 196.319238R^2 = 0.99913072
AMPA FMOC - 3 Levels, 3 Levels Used, 4 Points, 4 Points Used, 0 QCs
Concentration (ng/ ml)
0 0.5 1 1.5 2 2.5 3 3.5 4 4.5 5
Re
spo
nse
s
x104
0
0.5
1
1.5
2
2.5
3
3.5
4
4.5
Re
spo
nse
s
x104
0
0.5
1
1.5
2
2.5
3
3.5
y = 9553.422022 * x - 287.590988R^2 = 0.99976155
Glyphosate-FMOCcalibration curve(peak areas)
AMPA-FMOCcalibration curve(peak areas)
Figure 2: Calibration curves for Glyphosate-FMOC (top) and AMPA-FMOC (bottom) in water. R2 for both curves were >0.999 from 0.1 –5 ng/mL.
Helle and Chmelka
4
Helle and Chmelka2 News9 Incognito11 Dreyer et al1399 11CHROMacademy18 Training & Events19 Staff21

The Column www.chromatographyonline.com
analysis based on HPLC with fl uorescence
detection for many years. Derivatization in
our case was performed using a combined
multipurpose autosampler and liquid
handling robot (MultiPurpose Sampler,
Gerstel). While derivatization combined
with direct injection to the analysis system
is used successfully for water samples, food
samples require additional SPE cleanup.
Commonly used direct large volume injection
(LVI) methods without sample cleanup
are severely infl uenced by matrix, making
accurate and reliable determination in food
very diffi cult. The method presented here
combines derivatization using FMOC-Cl with
cleanup on an on-line high pressure SPExos
SPE system (Gerstel) positioned between the
autosampler and the 1290 UHPLC system
(Agilent Technologies).
The SPE system used has small cartridges
with only 50 mg of sorbent, which allows
elution to be carried out with small volumes
of solvent.
Automated sample preparation takes
20 min and is performed simultaneously
with the ultrahigh-performance liquid
x10
2
0.5
0.75
1.25
1.5
1.75
2.25
2.5
2.75
3.25
3.5
3.75
4.25
4.5
4.75
5.25
5.5
5.75
6.25
6.5
6.75
7.25
7
6
5
4
3
2
1
7.5
7.75
8.25
8
8.5
8.751 2 2 3 3 4
Counts vs. Acquisition Time
2 2.5 3 3.5 4 4.5 5 5.5 6 6.5 7 7.5 8 8.5 9 9.5 10 10.5
-ESI MRM Frag=80.0V CID@** (390.1000 -> 168.0000) GLY-AMPA-531.d
Glyphosate
Figure 4: Overlay chromatograms showing glyphosate in tea spiked at 0.01 mg/kg and 0.1 mg/kg respectively, dilution 1:125. Mass transitions monitored for glyphosate: 390 --> 168 and 390 --> 150.
Helle and Chmelka
5
Helle and Chmelka2 News9 Incognito11 Dreyer et al1399 11CHROMacademy18 Training & Events19 Staff21

The Column www.chromatographyonline.com
chromatography (UHPLC) analysis run of the
preceding sample. This means that overall
analysis time for each sample in a batch of
samples is 20 min. The timing of the sample
preparation can be controlled to ensure that
samples are injected at exactly the point in
time when the HPLC run of the previous
sample has fi nished. A 6460 TripleQuad mass
spectrometer (Agilent Technologies) was used
as MS–MS detector. The FMOC derivatives
of glyphosate and AMPA were detected in
negative ion mode [electrospray ionization
(ESI)]. The mass transitions monitored were
390 Da to 168 Da and 390 Da to 150 Da for
glyphosate; for AMPA, 332 Da to 136 Da and
332 Da to 110 Da were monitored.
Sample Preparation:
Extraction: Blended wheat was extracted
with acidifi ed water, neutralized and
diluted with water. Honey was dissolved in
water at approximately 60 °C. Soil samples
were extracted using water. Blended tea
leaves were extracted with acidifi ed water,
neutralized and diluted with water.
Derivatization: Following extraction, extracts
were placed in the autosampler, which
added derivatization reagent to each extract
and fi nally injected a 1000 µL aliquot of
Counts vs. Acquisition Time
4.2
0.1
0.2
0.3
0.4
0.5
0.6
0.7
0.8
0.9
1
1.1
1.2
1.3
1.4
1.5
1.6
1.7
1.8
1.9
2
2.1
2.2
2.3
2.4
2.5
2.6
2.7
2.8
2.9
3
3.1
4.4 4.6 4.8 5 5.2 5.4 5.6 5.8 6 6.2 6.4 6.6 6.8 7 7.2 7.4 7.6 7.8 8 8.2 8.4 8.6 8.8 9 9.2 9.4 9.6 9.8 10 10.2 10.4 10.6 10.8 11 11.2 11.4 11.6 11.8 12 12.2 12.4
x10
2
1 2 2 3 3 4
-ESI MRM Frag=80.0V CID@** (332.2000 -> 135.8000) GLY-AMPA-716.d
Glyphosate
AMPA
Figure 5: Chromatogram resulting from the extraction of a soil sample from Tenerife. Glyphosate concentration found: Approximately 740 µg/kg; AMPA concentration approximately 17 µg/kg. The two traces shown for each compound refl ect the two transitions monitored for each compound.
Helle and Chmelka
6
Helle and Chmelka2 News9 Incognito11 Dreyer et al1399 11CHROMacademy18 Training & Events19 Staff21
Chromatography Online: A Trusted Resource for Separation ScientistsLCGC’s website, www.chromatographyonline.com, spans across the world providing original and fresh material across all key segments including food analysis, bioanalysis, environmental analysis, pharmaceutical analysis and petroleum and biofuels research.
Access the most comprehensive and essential resource for professionals in the chromatography industry providing up to date news, interactive web seminars, podcasts, archived articles and opinion surveys.
www.chromatographyonline.com
ES212545_LCTC032013_V6.pgs 03.12.2013 23:24 ADV blackyellowmagentacyan

The Column www.chromatographyonline.com
ª�Rinse the cartridge with 2 mL of water.
ª�Introduce 1000 μL of sample.
ª�Wash the cartridge adsorbent bed with
1100 μL of water.
ª�Switch the SPE system from MPS mode,
that is, sample preparation and extraction
mode, to injection mode for transfer of
the eluate to the HPLC system.
ª�Elution and derivatization of the next
sample.
All steps were fully automated. The sample
preparation was completed in 20 min.
The HPLC–MS–MS analysis cycle time was
around 20 min.
the extract into the on-line SPE system for
cleanup.
Solid-Phase Extraction and On-line
Sample Introduction: Listed below are the
individual sample preparation steps that
are performed synchronizing automated
derivatization and SPE cleanup with the LC–
MS–MS analysis. During LC–MS–MS analysis
of a sample, the next sample is prepared so
that it is ready for injection when the LC–
MS–MS system becomes ready:
ª�Load the on-line SPE cartridge.
ª�Condition the cartridge with 1 mL of
methanol.
4
4.25
4.5
4.75
3
3.25
3.5
3.75
2
2.25
2.5
2.75
1
1.25
1.5
1.75
0.25
0.5
0.75
5
5.25
5.5
5.75
6
x10
3
2 3 3 41 2
-ESI MRM Frag=80.0V CID@** (332.2000 -> 135.8000) GLY-1069.d
Glyphosate
Counts vs. Acquisition Time
2 2.5 3 3.5 4 4.5 5 5.5 6 6.5 7 7.5 8 8.5 9 9.5 10 10.5 11 11.5 12 12.5 13 13.5 14 14.5 15 15.5 16 16.5 17 17.5 18 18.5 19 19.5 20 20.5 21 21.5 22 22.5 23 23.5
Figure 6: Chromatogram resulting from the extraction of a one-year-old honey sample from an area where glyphosate is being used. Glyphosate concentration found: Approximately 4 mg/kg, 80 times the allowable concentration; AMPA concentration: Not detected. The two traces shown for the compound refl ect the two transitions monitored for reliable detection. According to EU regulation requirements, the glyphosate concentration in honey must not exceed 0.05 mg/kg.
Helle and Chmelka
7
Helle and Chmelka2 News9 Incognito11 Dreyer et al1399 11CHROMacademy18 Training & Events19 Staff21
IAIB
IC
ID
IE
IF
move easilymove reliably
move quickly
moveahead
Chiral Technologies Europe
www.chiral.fr
Tel: +33 (0)3 88 79 52 00
move ahead with confidence
visit www.immobilizedchiralcolumns.com
t��%BJDFM�2VBMJUZ
t��4PMWFOU�'MFYJCJMJUZ
t��4VQFSJPS�%VSBCJMJUZ
Immobilised Chiral Stationary
Phases and Columns
&OTVSF�GBTUFS�EJTDPWFSZ��GBTUFS�TFQBSBUJPOT�
XJUI�PVS�HSPXJOH�TFMFDUJPO�PG�JNNPCJMJTFE�
DIJSBM�TUBUJPOBSZ�QIBTFT�

The Column www.chromatographyonline.com
Results and Discussion
The analysis method enables the
determination of glyphosate and AMPA
in wheat, water, tea leaves and honey at
suffi ciently low limits of detection and
limits of quantitation to meet EU guideline
requirements as shown in Table 1. In
Figure 2, calibration curves for glyphosate
and AMPA in water are seen. For both
compounds, R2-values of > 0.999 are
reached.
Conclusion
The presented automated method for
derivatization, on-line SPE and
HPLC–MS–MS determination of glyphosate
and its most important metabolite
aminomethylphosphonic acid (AMPA) was
successfully implemented for a variety of
samples, including: spiked water samples, tea
leaves, wheat, honey and soil. Determination
of a dilution series produced excellent
linearity in the order of 0.999 and low limits
of quantitation (LOQ) of 10 ng/L for both
glyphosate and AMPA in water. Recovery of
glyphosate and AMPA in water, wheat and
tea leaves was found to be in the range of
90% to 105%.
The automated method resulted in LOQs
below 1 μg/kg for both glyphosate and
AMPA in wheat, tea and honey, easily
meeting EU and US requirements. The
same LOQs were reached for soil samples.
Variation coeffi cients reached using the
automated system were lower than those
typically achieved using manual procedures
since the timing of each individual step
is accurately and uniformly controlled for
all samples so that any decomposition
of derivatized analytes would not impact
accuracy.
We would like to emphasize that the AMPA
concentrations found in non-spiked real
samples of soil and honey were surprisingly
low relative to the glyphosate concentrations.
This indicates that glyphosate could be more
stable than is widely assumed. The same was
found to be the case in real-world samples of
wheat that we have analysed.
In future research, we will pursue the
automation of further methods that currently
require manual liquid sample preparation and
SPE cleanup.
References
1. US EPA “Technical Fact Sheet on: GLYPHOSATE”
(http://www.epa.gov/ogwdw/pdfs/factsheets/
soc/tech/glyphosa.pdf)
2. Greenpeace Report, Herbicide tolerance and GM
crops, www.greenpeace.de/fi leadmin/gpd/user_
upload/themen/gentechnik/Herbicide_tolerance_
and_GM_crops_lo_res.pdf
3. Frequently Asked Questions on the Health Risk
Assessment of Glyphosate, BfR FAQs, November
11, 2011; http://www.bfr.bund.de/cm/349/
frequently-asked-questions-on-the-health-risk-
assessment-of-glyphosate.pdf
4. International Organization for Standardization
(ISO) Technical Committee ISO/TC 147, Water
quality, subcommittee SC2, Physical, chemical
and biochemical methods: Determination of
Glyphosate and AMPA using high performance
liquid chromatography (HPLC) with fl uorescence
detection.
Norbert Helle, PhD, is the owner and
general manager of TeLA GmbH, a contract
laboratory in the fi eld of food safety
analysis. Norbert Helle has more than 15
years experience working in food safety and
environmental analysis for various German
Federal and State agencies, mainly in the fi eld
of HPLC–MS. He chairs two working groups
under the German § 64 Foodstuffs and
Commodities Act charged with developing
food safety analysis methods for phycotoxins
and biogenic amines.
Franziska Chmelka is the Head of
Research and Development at TeLA GmbH,
including method development on HPLC–
MS and HPLC–MS–MS instruments for the
determination of residues of pesticides,
biotoxins and drugs. She oversees work on
various German Federal research projects
on preparative and analytical HPLC–MS and
HPLC–MS–MS work in the area of food
safety.
E-mail:[email protected] Website: www.tela-bremerhaven.de
Sample LOQ LOD
Wheat < 1.0 μg/kg < 0.3 μg/kg
Water < 10 ng/L < 3.0 ng/L
Tea leaves < 1.0 μg/kg < 0.3 μg/kg
Honey < 1.0 μg/kg < 0.3 μg/kg
Note: Maximum Residue Level (MRL) in the EU for glyphosate in wheat: 10 mg/kg (US: 30 mg/kg). The LOQ achieved here is substantially lower.
EU regulations require glyphosate levels in water to be below 100 ng/L (US: 700 μg/L*). The LOQ achieved using the presented method is substantially lower.
Maximum Residue Level (MRL) in the EU for glyphosate in tea leaves: 2 mg/kg (US: 1 mg/kg). The LOQ achieved here is substantially lower.
The MRL in honey according to EU regulations is 0.05 mg/kg. As can be seen, the LOQ achieved using the presented method is substantially lower. * http://water.epa.gov/drink/contaminants/index.cfm
US EPA: Drinking Water Standards Maximum Contaminant Level (MCL): 0.7 mg/L
USDA: MRL Wheat: 30 ppm (EU: 10 ppm)
Table 1: The limit of quantifi cation (LOQ) and limit of detection (LOD) of glyphosate and AMPA in wheat, water, tea leaves and honey samples.
Helle and Chmelka
8
Helle and Chmelka2 News9 Incognito11 Dreyer et al1399 11CHROMacademy18 Training & Events19 Staff21

Agilent supports cancer research centerDr Ronald A. DePinho — president of the University of Texas MD Anderson Cancer
Center (Texas, USA) — has received an Agilent Thought Leader Award. Agilent
Technologies (California, USA) will provide financial support for personnel as well as
instrumentation for the center.
The work of DePinho has resulted in the development of improved cancer detection
methods and cancer drug development. His research group focuses broadly on
basic-to-translational research programmes for brain, colorectal, pancreas and prostate
cancers, as well as ageing and neuro-degeneration.
The award will support DePinho and his team in their research into reprogramming
the metabolome at the initial stages of cancer. Specifically, the instrumentation
will “enhance” the investigation of metabolic adaptions during the development of
pancreatic cancer, according to Dr Guilio Draetta, director of the Institute for Applied
Cancer Science.
Pancreatic cancer is a major concern of DePinho’s group because survival rates of
patients have not significantly improved over the past two decades. Depinho said:
“This technology will allow us to rapidly identify new targets that drive the formation,
progression and maintenance of pancreatic cancer. Discoveries from this research
will also lead to the development of effective early detection biomarkers and novel
therapeutic interventions.”
Patrick Kaltenbach, Agilent VP and general manager of the Liquid Phase division,
said: “We are proud to support Dr DePinho’s exciting translational research
programme, which will make use of metabolomics and integrated biology workflows
and solutions in biomarker discovery.”
Draetta added: “Armed with novel biomarkers, earlier diagnosis and treatment will
be possible, leading to improved patient outcomes. Additional opportunities for novel
therapeutic intervention will also emerge from this work.”
For more information please visit: www.agilent.com
Bruker expands Indian operationsBruker (Massachusetts, USA) has built on its 30-year history in India by opening
two new centres of excellence in Mumbai and Bengaluru. During this time,
Bruker has established itself in many of India’s major cities including New Delhi,
Mumbai, Bengaluru, Chennai, Kolkata, Lucknow and Hyderabad.
The new centres of excellence will offer customer support for scientifi c and
analytical instrumentation for the growing Indian market. The locations of
the centres were selected based on their proximity to major academic,
government and industrial research laboratories.
Dr Frank Laukien, Bruker’s President and CEO, commented: “With this
signifi cant investment
in our two new centres
of excellence, Bruker
has taken a major step
forward in India to provide
highest-level support
for the outstanding and
rapidly growing Indian
research, industrial and
clinical communities.”
For more information,
please visit: www.bruker.
comPh
oto
Cre
dit
: C
ou
rte
sy o
f th
e a
uth
or
9
Helle and Chmelka2 News9 Incognito11 Dreyer et al1399 11CHROMacademy18 Training & Events19 Staff21

The Column www.chromatographyonline.com
Biomarker for river blindness discoveredScientists at The Scripps Institute (California, USA) have used liquid chromatography–mass spectrometry (LC–MS) to identify a new biomarker for the diagnosis of river blindness.1 The discovery is an important step towards the development of a portable diagnostic test for use in the fi eld.
River blindness affects 37 million people worldwide and is focused specifi cally in sub-Saharan Africa, Central and South America and Yemen. The disease is caused by nematode (Onchocerca volvulus) larvae transmitted by blackfl y (Simulium sp.). In an attempt to kill the larvae, the body mounts an infl ammatory immune response, indirectly damaging the eye and other body tissues.
The team analysed the urinary metabolome of infected and uninfected patients, identifying one particular protein that became elevated in the urine of infected patients. High performance liquid chromatography (HPLC) was performed to concentrate the protein and LC–MS was able to identify the chemical structure as N-acetyltyramine-O,ß-glucoronide.
The analysis was not as straightforward as initially hoped. The small, then unknown, molecule was not immediately identifi able. Daniel Globisch, a postdoctoral fellow in the Janda laboratory, studied the available literature referencing the metabolome of the nematode and pinpointed the metabolite
source. The molecule was a breakdown product of a neurotransmitter produced by young larvae, excreted into the urine at higher
levels during an active infection.“It’s a spectacular fi nd in terms of biomarkers as it does not occur naturally in humans,” said Globisch. Lead
investigator Professor Janda advanced on this stating that for the fi ndings to be of value in Third World countries it would need to be developed into a portable instrument, “basically distilling our fi nding to a test that can be carted around in a backpack”.
According to the authors, the theory behind the investigation should be applicable to the diagnosis of
other worm infection-induced diseases.
Reference1. D. Globisch, A. Moreno, M.S Hixon, A.A.K. Nunes, J.R. Denery,
S. Specht, A. Hoerauf and K.D. Janda, PNAS, DOI: 10.1073/
pnas.1221969110 (2013).
GC–MS detects stress levelsBreath may be an indicator of stress levels according to a study published in the Journal of Breath Research.1
The breath samples of 22 individuals were analysed by performing thermal desporption–gas chromatography–mass spectrometry (TD–GC–MS) to pinpoint six stress sensitive compounds.
Stress is the by-product of the evolutionary “fight-or-flight” response. In a situation percieved to be challenging, or in some cases threatening, the body’s biological processes change in preparation. The most obvious change induced by fear or anticipation is an increase in heart rate and blood pressure.
The study hypothesized that this would result in a change in the chemical profile of breath samples. These samples were collected from subjects following psychological interventions — designed to either induce stress or maintain a relaxed state of mind. One intervention used was a mental arithmetic test, while another was listening to classical music.
The four compounds identified to be elevated following induced stress were indole, 2-hydroxy-1-phenylethanone, benzaldehyde and 2-ethylhexan-1-ol. 2-methylpentadecane was tentatively identified and another componenent remained undetermined.
It is plausible that this non-invasive test could be used in clinical settings to determine the stress levels of patients.
Reference 1. M.A. Turner, S. Bandelow, L. Edwards, P. Patel, H.J. Martin, I.D. Wilson
and C.L.P. Thomas, Journal of Breath Research, DOI: 10.1088/1752-
7155/7/1/017102 (2013).
Ph
oto
Cre
dit
: St
ock
by
te/G
ett
y I
ma
ge
s
News
10
Helle and Chmelka2 News9 Incognito11 Dreyer et al1399 11CHROMacademy18 Training & Events19 Staff21

11
Helle and Chmelka2 News9 Incognito11 Dreyer et al1399 11CHROMacademy18 Training & Events19 Staff21
So there I was in the laboratory
discussing an analytical application with
a young trainee when his supervisor
approached and commented that
the neophyte was undergoing some
“analyst validation” and was a little
nervous because they were “doing their
assessment”. I’m not a fan of the term
“analyst validation” but I smiled as the
background radio played “Learning to
Fly” by Tom Petty and Heartbreakers
— not a particular favourite of mine (a
little too “soft rock”), but very fitting
nonetheless.
I get more and more requests across
my desk for staff to attend “webcast
training”. Now to some this may seem
pedantic, I return every note with a
considered yea or nay, but always with
the word “training” scored out and
replaced with “development”. To even
describe some of these webcasts as
“development” is questionable.
My question which ties these two
situations together is this: in this
information-rich age, what is the best
way to translate all of this information
into business advantage via our analytical
staff at all levels of the business? Of
course, whilst business advantage
ultimately means profit, there are other
“softer” factors such as efficiency,
compliance, competitiveness and
technology advantage. What training
and development is really necessary or
most effective and how do we harness
it properly? Most important of all,
how do we verify that learning has
happened?
We need to realize first that
information isn’t knowledge and that
knowledge isn’t skills or aptitude — the
latter can only happen if the former is
delivered effectively in each case. This
cascade and the verification of learning
at each stage is badly done in our
organization and I could say the same
about many organizations the world over.
Our regulators (irrespective of industry
type) love statements such as “trained Ph
oto
Cre
dit
: A
nth
on
y M
ars
lan
d/G
ett
y I
ma
ge
s
A Testing Time…
Incognito espouses the benefi ts of a rigorous testing procedure in the workplace.

The Column www.chromatographyonline.com
12
Helle and Chmelka2 News9 Incognito11 Dreyer et al1399 11CHROMacademy18 Training & Events19 Staff21
to the correct level of expertise to carry
out analysis”, “periodic retraining”, “have
the correct knowledge”, “demonstrate
competent performance”, and my
favourite — “continued competence must
be monitored, for example, using quality
control techniques.”
So here’s my problem: If you can’t
get someone to demonstrate skills
or knowledge they can’t be verified,
and areas for improvement don’t get
highlighted and problems therefore
don’t get fixed.
Let’s look at the world from
the perspective of an “average”
laboratory-based analytical chemist.
You have access to vendor training and
application information, independent
face-to-face training events, web-based
training courses, live web training,
webcasts, internal training courses,
the experience of other analysts and
managers, trade and academic journals
and magazines and so forth. Which of
these do you participate in? How do
know that these make your performance
better? How does your business know
that these things are improving your
knowledge or skills?
Back then to “analyst validation” —
it’s such a crass description that it raises
a smile — however, the demonstration
of competence that it provides is
exactly what our regulators require
and what our businesses need in order
to gain that extra advantage. And it’s
success depends largely on you being
“examined” to some extent on how
good you are, or how much you
understand about your job. We typically
go through an exercise in which the
learner carries out a “test protocol”. For
high pressure liquid chromatography
(HPLC) this involves correctly making
up an eluent (which tests skills and
knowledge in gravimetry and volumetry),
setting up the instrument and data
system and performing an analysis on a
test solution in which the result has to
fall within certain limits. Combine this
with testing of the underlying knowledge
and one begins to move towards
a system in which competence is
demonstrable. Other organizations
have similar training using specific
analyses which the analyst will perform,
with “test” solutions of known
concentration.
The key to this approach is being
tested, examined, questioned and
challenged in a rigorous but fair manner
and being able to demonstrate that you
can perform to a required standard.
There should be no wriggle room, no
“grandfathering”, no going through
on “a nod and a wink”, no benefit of
the doubt. Many of us shy away from
rigorous work-based performance
testing of our staff — why? We produce
data which may affect people’s health,
wellbeing or standard of life. Why
should we not expect to meet exacting
standards?
How many webcasts have you ever
attended that have a mandatory test
at the end? How many training courses
which have given you a certificate of
attendance, which is duly filed into your
training record without a subsequent
practical or theory examination. I suspect
the answer is pretty much every
webcast or course you ever attended
after your academic study. Then ask
yourself if this helps with demonstrating
that you learned anything, or to what
extent they improve your laboratory
performance? My experience is certainly
that “testing” focuses the mind,
highlights what you are not capable of or
do not know and allows these gaps to be
filled. Good testing needs to have many
facets — multiple choice questions
Contact author: IncognitoE-mail: [email protected]
alone tend not to be so effective! Verbal
reasoning, demonstration, inference,
analysis and synthesis (of concepts
not chemicals!) are all necessary
depending upon what is being studied
and to what level.
Our “analyst validation” programme
contains many of the testing elements
described above, and whatever name you
chose for it, it does validate competence
and demonstrate ability and knowledge.
Yes, people do get nervous about
their “test”. Yes, it does cause the odd
dispute, because, quite frankly, not
everyone passes the “test” first time,
and some not at all. But we will
continue to rigorously test the skills,
knowledge and aptitude of our staff, I’m
even thinking of writing post-webcast
questions for those folks who request
time to attend these events. The strains
of Tom Petty have long since subsided —
but why not aim for the sky in training
and development. Long live testing — it’s
what we do every day.
Incognito

Verifying Data Quality of an Untargeted Approach to Analyse Terroir in Wine Grape Juice Mark Dreyer1, Paul Tarr2 and Michael Athanas1, 1Thermo Fisher Scientifi c, San Jose,
California, USA, 2California Institute of Technology, Pasadena, California, USA.
Data quality and instrument performance can be easily monitored using several high performance liquid chromatography–mass spectrometry (HPLC–MS) parameters. This allows for the possibility of large-scale data acquisition within one experiment to assess metabolic changes over long time periods or during any number of sample processing steps. In addition, when analysing raw data, taking the time to look at how the data is affected by different processing techniques enables one to gain a better understanding of the changes within the samples and how post-processing can manipulate the results. Careful attention needs to be paid to ensure that data processing does not remove or minimize important data points that may be critical for the understanding of how certain procedures alter the metabolic profi le of samples.
a particular target class of molecules within
wine, must or juice samples. More recent
studies have begun to use high-resolution
mass spectral techniques to take an
untargeted approach to understand the
impact of oak wood on the fi nal wine product
to characterize the surface active aerosols
of champagne wines, and to characterize
varietal, origin, vintage and quality attributes
in wine.
The article, “A Metabolomics-based
Approach for Under-standing the Infl uence
of Terroir in Vitis Vinifera L.”1 aims to
understand how the metabolomic
signatures are infl uenced by terroir
(cultivation conditions on both the
micro and macro-environmental scale)
and varietal character (the genetic
determination of grape berry
physiology). Using high pressure liquid
chromatography (HPLC) coupled in
tandem with a high resolution mass
spectrometer, we analysed 41 samples of
various varietal compositions from several
designated AVA’s (American Viti-cultural
Areas) in Santa Barbara County, USA. In this
Wine is a complex mixture that is infl uenced
by many genetic, environmental and
production factors. Strategies for consistent
and robust qualitative and quantitative analysis
at various stages during the production
sequence is becoming increasingly important
in viticulture for both the production of wine,
table grapes, juice and raisins.
Much of the chemical analysis has focused
on the identifi cation of certain classes of
compounds in a wine sample, primarily the
phenolic compounds. While informative,
these studies are limited to understanding Ph
oto
Cre
dit
: O
xa
na
Afa
na
sye
va
/Ge
tty I
ma
ge
s
13
Helle and Chmelka2 News9 Incognito11 Dreyer et al1399 11CHROMacademy18 Training & Events19 Staff21

The Column www.chromatographyonline.com
(a)
(b)
-3.00
-2.00
-1.00
0.00
1.00
2.00
3.00
9.5500
9.5700
9.5900
9.6100
9.6300
9.6500
9.6700
9.6900
Sample Number50403020100
Sample Number50403020100
Mas
s Er
ror
(pp
m)
Rete
n�on
Tim
e (m
in)
y = 0.0048x + 1.4066
y = 0.0008x + 9.6152
(c)
(d)
Sample Number50403020100
Retention Time (min)8.35 8.40 8.45 8.50 8.558.308.258.208.158.10
Mas
s Er
ror
(pp
m)
0.0100
0.0150
0.0200
0.0250
0.0300
0.0350
0.0400
0.0450
0.0500
0.E+00
1.E+08
2.E+08
3.E+08
4.E+08
5.E+08
6.E+08
7.E+08
8.E+08
9.E+08
1.E+09
-3.00
-2.00
-1.00
0.00
1.00
2.00
3.00
Peak
Wid
th (
min
)
Peak
Inte
nsi
ty (
cou
nts
)
Figure 1: Various characteristics of the spiked internal standard nordiazepam are measured over the course of the 41 sample/52 h experiment. All parameters are plotted using acquisition time as the x-axis.: (a) The mass error for nordiazepam using positive ionization mode, in PPM, calculated using the formula ∆M/M * 1000000, illustrates that the mass drift, while slightly negative, is well within the instrument specifi cation of ±3 PPM and the slope of the line is 0.0014. (b) Chromatographic retention time showing a very slight positive drift of approximately 0.045 min or 2.7 s (slope = 0.0303) over the course of the experiment. (c) The nordiazepam peak width had a negligible change over the timeframe of this experiment ~-0.0002 min. (d) The error in PPM of a concentrated peak, quercetin, is plotted along with the mass error in PPM, highlighting that there is not an effect of peak intensity on the mass error when the instrument is properly setup.
Dreyer et al
1414
Helle and Chmelka2 Helle and Chmelka2 News9 Incognito11 Dreyer et al13 Dreyer et al131399 News99 11 Incognito11CHROMacademy18 CHROMacademy1818 Training & Events19 Training & Events1919 Staff21 Staff21

The Column www.chromatographyonline.com
ISs nordiazepam (m/z 271.0633) for positive
polarity and chloramphenicol (m/z 323.0196)
for negative polarity. The mass stability was
assessed for the base peak mass in each
sample during the run. Only the positive
data will be presented here because of space
considerations.
Understanding how viticultural decisions
impact the metabolome of grape berries
and the vinifi cation of grape juice is of great
interest to the grape and wine industry.
To begin to understand the relationship
between each of the samples analysed, we
focused on hierarchical clustering analysis.
Following standard convention data from
published studies, we normalized the data
output from SIEVE software for differential
expression (Thermo Fisher Scientifi c) and LOG
transformed this to better visualize the entire
data set. This allowed us to visualize all the
data points at the extremes of the data set in
the fi nal graphic output.
However, we found this data smoothing
approach minimized component information
by diminishing the infl uence of highly
discriminating data points within the complete
data set. To illustrate this point, Figure 2(a)
and (b) show the hierarchical clustering
results from the terroir grape juice subset
of the 41 data samples processed by LOG
transformation followed by hierarchical
clustering [Figure 2(a)], or hierarchical
clustering of the original data set with no
LOG transformation [Figure 2(b)]. While the
LOG transformed data set displays more
of the components from the data set, it
article we outline the procedures that were
used to assess the data quality following
the metabolomic analysis of the chemical
composition from the 41 samples. To ensure
that data quality remained high across
extended chromatographic runs, several
methods to analyse instrument performance
were chosen and monitored to ensure
consistent results. These parameters included:
HPLC peak retention time, chromatographic
peak width, base peak mass accuracy of the
internal standard and data transformation.
Experimental
Chromatography was performed using an
Ultimate 3000 HPLC system (Thermo Fisher
Scientifi c), injecting 10 μl directly onto an
Accucore C18 column (Thermo Fisher Scientifi c)
(100 × 2.1 mm, 2.6 μm particle), equilibrated
in 95% solvent A (0.1% aqueous solution
of formic acid), 5% solvent B (methanol
containing 0.1% formic acid). The HPLC
column temperature was maintained at 40 °C
and the autosampler sample compartment
at 10 °C. The compounds were eluted from
the column using a fl ow rate of 300 μL/min
by linearly increasing solvent B concentration
from 5% to 95% over 15 min. The column was
then washed with 95% solvent B (2 min) and
re-equilibrated in 95% solvent A, 5% solvent B.
The total run time, including column wash and
equilibration, was 20 min.
Mass spectrometry was performed using
a Q Exactive mass spectrometer (Thermo
Fisher Scientifi c) operated using electrospray
with positive and negative polarities
at 70,000 resolving power (defi ned as
FWHM @ m/z 200), IT = 250 ms and AGC
Target = 1,000,000, for full scan analysis
(mass range 70–1000 amu). Source conditions
for both ionization polarities were: spray
voltage: 3.5 kV; sheath gas: 45 arb units;
auxillary gas: 20 arb units; sweep gas: 2 arb
units; heater temperature: 450 °C; cap
temperature: 300 °C; S-Lens RF level: 50. The
instrument was calibrated using Calibration
Solution (Thermo Fisher Scientifi c) before
beginning the analysis. Nordiazepam and
chloramphenicol were added to each sample
as an internal standard at a fi nal concentration
of 10 ng/mL.
Samples were run in positive mode
followed by a duplicate run in negative mode,
using the same parameters as positive to
maximize the data collected in each polarity.
For each mode, solvent blanks containing the
internal standards (ISs) were run before and
between each sample set of fi ve samples.
In an effort to assess the data quality,
we looked at several measures of HPLC
stability, mass spectrometer stability and
mass accuracy. To assess the stability and
reproducibility of the HPLC, we looked at
the base peak mass retention time of the
(a) (b) 0.0 10 .0
EC
R-G
r
WR
-Gr
WR
-HH
-Sy
WR
-FM
-Sy
WR
-LB
-Sy
EC
R-G
r
WR
-HH
-Sy
WR
-FM
-Sy
WR
-Gr
WR
-LB
-Sy
Figure 2: (a) The hierarchical clustering result obtained from the LOG transformed data set. (b) shows the hierarchical clustering result from the average peak intensity values obtained from the software output.
Dreyer et al
15
Helle and Chmelka2 News9 Incognito11 Dreyer et al1399 11CHROMacademy18 Training & Events19 Staff21

The Column www.chromatographyonline.com
misses the fact that there are two statistically
distinct sets of components in the data
set [see Figure 2(b)], not the high values
at the top and bottom of the clustering
plot. Because the differential expression
software requires a reference to be selected
before chromatographic peak alignment
and component extraction, the output from
the software is normalized, to allow for
direct statistical analysis. The result obtained
from LOG transformation and subsequent
hierarchical clustering demonstrated that
varietal character was a dominant inf uence
in the clustering of the samples with a minor
inf uence of terroir [Figure 2(a)].
However, hierarchical clustering of the
average peak intensities from the normalized
software output shows a more complex
interaction where distinct clusters in the data
set are inf uencing the data so that varietal
character is no longer the dominant factor
[Figure 2(a) vs. Figure 2(b)]. From a statistical
perspective this is the correct approach
because prior data smoothing runs the risk
of eliminating important clusters within the
data. Further analysis of the data is needed
to determine what components of the data
set are responsible for inf uencing similarities
and differences in these complex metabolome
data sets. Of particular interest will be the
analysis of the full diverse 41-sample data
set to determine what component clusters
are linked to values such as varietal character
or terroir. Molecular identif cation of these
components promises to identify the origin
or phase of the viticultural and vinif cation
process from which these metabolomic
differences arise.
In both Figure 2(a) and 2(b), hierarchical
clustering was done with Euclidean distance
with complete linkage. Two vineyards are
represented in the data set: the El Camino
Real (ECR) vineyard and the Windmill Ranch
(WR) vineyard both in the Santa Ynez AVA
of Santa Barbara County, USA. Gr represents
juice sample from grenache clone 1A from
the El Camino Real vineyard (ECR-Gr) and
the Windmill Ranch vineyard (WR-Gr). Sy
represents three syrah clone 877 (Sy) juice
samples taken from three distinct vineyard
blocks within Windmill Ranch, Fat Man (FM)
Little Boy (LB) and High Hill (HH).
Conclusion
Data quality and instrument performance can
be easily monitored using retention time shift,
chromatographic peak width, mass accuracy
versus. time and mass accuracy across a
chromatographic peak. In our study, there was
minimal, if any, shift in any of the parameters,
indicating that the instrument performance
remained excellent across the duration of
the analysis. This allows for the possibility
of large-scale data acquisition within one
Dreyer et al
16
Helle and Chmelka2 News9 Incognito11 Dreyer et al1399 11CHROMacademy18 Training & Events19 Staff21
Subscribe to LCGC North America’s e-Newsletters
Unique electronic newsletters covering the most up-to-date industry topics delivered on a weekly basis
e-Separation Solutions
e-Separation Solutions is LCGC’s weekly e-newsletter covering all of the hottest chromatography topics,
techniques, and applications. Each e-newsletter is dedicated to a different area of separation science.
e-Application Note Alert
LCGC’s e-Application Note Alert is a monthly e-newsletter showcasing useful applications by technique.
Webcasts | Events | Chromatographyonline.com | Application Notes | The Peak | Subscribe | Contact Us
Follow us on:
Technology Forum
Bioanalysis: LC–MS-MS, Sample Prep, and Dried Blood Spot Analysis Bioanalysis uses a variety of separation techniques to analyze samples ranging from plasma and urine to dried blood spots. Participants in this Technology Forum are Ling Bei, Patrik Appelblad, and Dave Lentz of EMD Millipore; Nadine Boudreau of PharmaNet Canada; Diab Elmashni, Jeff Zonderman, and Simon Szwandt of Thermo Fisher Scientific; and Debadeep Bhattacharya of Waters Corporation. More...
Name your budget or application—the Agilent 1200 Infinity Series has you covered. From our affordable 1220 Infinity LC starting at just $15,000 to our cutting-edge 1290 Infinity LC, we have a solution that’s right for you. Plus, our most popular 1200 Infinity Series LC configurations are now available with a 3-5 year up-and-running guarantee. Read more.
Featured News
Health Sciences Unit LaunchedLGC has launched a new business unit, Health Sciences, which combines the group's sport, food, consumer safety and pharmaceutical testing activities within a single entity. More...
KNAUER is now offering its PLATINblue UHPLC systems with the MSQ Plus mass detector in a special package deal. PLATINblue systems and the MSQ Plus are an ideal combination for high-throughput applications. For a limited-time only, the UHPLC-MS package is being offered at a very special price. Don’t miss out!
Performance Materials Supplier AcquiredAmerican-based Avantor Performance Materials will acquire Polish Performance Materials Supplier (POCH S.A.). More...
Your brilliance. Our know-how. Collaborative Life Science. It all joins forces at EMD Millipore. Now your organization can leverage the combined synergies of two leading Life Science companies – for deep insight and know-how along every step of the biotherapeutic value chain. Find out how at www.emdmillipore.com
Featured Vidcast
Using LC–MS with Online Sample Preparation to Survey Metabolites Formed In VitrolAn Interview with Samuel Yang, University of Texas at Arlington. More...
Featured Products
EXP® Products for UHPLC
The EXP® Product Family offers hand-tight fittings, filters,
traps and guards – rated to 20,000+ psi. This advanced
GC HPLC Sample Prep GPC Hyphenated Miscellaneous
Subscribe Go to Application Note Library
Featured Application Note:Screening and Quantification of Multiple Drugs in Urine Using Automated Online Sample Preparation
and Tandem Mass Spectrometry Barbora Brazdova and Marta Kozak, Thermo Fisher Scientific
Learn about a 9-min, sensitive (LOQ 1Ñ50 ng/mL) method to quantitate 30 immunosuppressant
drugs using TurboFlow technology and LCÐMS-MS.
Evaluation of the Ultra Inert Liner Deactivation for Active Compounds Analysis by GCLimian Zhao, David Mao, and Allen Vickers, Agilent Technologies
Endrin and DDT breakdown and active semivolatiles tests were used for the Ultra Inert liner deactivation performance evaluation. The results indicate that the Ultra Inert deactivated liners provide superior inertness for analysis of active compounds.
Food Analysis of PAHs Using GCxGC-TOFMS and QuEChERSLECO CorporationThe combination of QuEChERS extraction and GCxGC-TOFMS is a fast and accurate method for
detecting and identifying PAH contaminants in complicated foodstuff matrices such as liquid infant formula and blended blueberries.
Screening and Identification with High Confidence Based on High Resolution and Accurate Mass LC–MS-MSAndre Schreiber and David Cox, AB SciexThis note describes a workflow and tools to identify targeted and nontargeted pesticides in fruits and vegetables. High resolution, accurate mass LCÐMS-MS data is mined using advanced
software tools to identify components based on retention times, accurate mass, isotopic pattern, and MS-MS library searching.
Highly Sensitive UV Analysis with the Agilent 1290 Infinity LC System for Fast and Reliable Cleaning Validation – Part 1Edgar Naegele and Katja Kornetzky, Agilent TechnologiesThis application note demonstrates high sensitivity measurement of pharmaceutical compounds
with the Agilent 1290 Infinity LC. It also demonstrates a performance comparison of different flow cells with the Agilent 1290 Infinity LC diode array detector (DAD) for highly sensitive UV measurement including calibration, validation, and determination of LOD and LOQ.
Pesticides in Fatty MatricesDon Shelly, UCT"Fat is where it's at" when it comes to finding most pesticides. Extracting the pesticides and not
the lipids can be a challenge! This months featured application is easy, quick, effective, rugged, and inexpensive.
Which GPC Column First? Bruce Kempf, Tosoh BioscienceMost manufacturers recommend the installation of SEC columns in order of decreasing pore size when running columns in series. Scientists at Tosoh Bioscience tested the validity of this recommendation.
Ultra-Fast Analytical Method for the Sample Cleanup and LC–MS-MS Analysis of
Chloramphenicol in Shrimp and Other Marine Food ProductsPhilip J. Koerner, Matthew Trass, Liming Peng, and Jeff Layne, PhenomenexA method for the analysis of chloramphenicol in shrimp has been developed with a limit of quantitation (LOQ) of 0.001 ng/g in shrimp (0.001 ppb) based on the calibration standards. This is 300 times lower than the current U. S. Food and Drug Administration (USFDA) method. The method described uses Strata-X solid phase extraction (SPE) cartridges for sample cleanup and
concentration, followed by ultra-fast LCÐMS-MS analysis (<5 min) using a Kinetex core-shell column.
Topics and categories include: HPLC • GC • Sample Prep • LC-MS and GC-MS • Emerging techniques
www.chromatographyonline.com/enews
ES212645_LCTC032013_V16.pgs 03.12.2013 23:46 ADV blackyellowmagentacyan

The Column www.chromatographyonline.com
experiment to assess metabolic changes over
long time periods or during any number of
sample processing steps, such as those that
occur during vinifi cation of grape juice. In
addition, when analysing raw data, taking the
time to look at how the data is affected by
different processing techniques enables one
to gain a better understanding of the changes
within the samples and how post-processing
can manipulate the results. Careful attention
needs to be paid to ensure that data
processing does not remove or minimize
important data points that may be critical for
the understanding of how certain procedures
alter the metabolic profi le of samples.
Reference
1. Paul T. Tarr, Mark L. Dreyer, Michael Athanas, Mona
Shahgholi, Keith Saarloos and Tonya P. Second,
Metabolomics Special Issue: Mass Spectrometry for
Metabolomics 9(1) Supplement, 170–177 (2013).
Mark Dreyer has over 20 years of
industry experience developing methods in
chromatography and mass spectrometry,
including 15 years working in small
pharmaceutical laboratories developing analytical
HPLC–MS methods. Dreyer joined Thermo
Fisher Scientifi c in 2010 and has responsibility
for supporting the sales representatives and
prospective customers in pre-sales and post-sales
activities focusing on the chromatography of
small molecules, both profi ling and quantitation,
wine analysis and surfactants.
Paul Tarr is a post-doctoral research scholar
at the California Institute of Technology,
Pasadena, California, USA. His research focuses
on the genetic control of metabolism. His
current research interests include understanding
how a paracrine hormone regulates cell-cell
communication within plant stem cell niches
and its impact on the cellular metabolome;
and understanding the metabolic changes
that occur during the cultivation of grapes for
viticulture and the impact of vinifi cation on the
metabolome of wine.
Michael Athanas, PhD, is an informatics
solution architect at Thermo Fisher Scientifi c,
focused on melding statistical analysis,
scalable computing, deep data mining
and extreme visualization into new and
contemporary approaches in scientifi c analysis.
Previously, Athanas was a scientifi c informatics
consultant and founder of VAST Scientifi c.
E-mail: [email protected]: http://www.thermoscientific.com
Dreyer et al
17
Helle and Chmelka2 News9 Incognito11 Dreyer et al1399 11CHROMacademy18 Training & Events19 Staff21

18
Helle and Chmelka2 News9 Incognito11 Dreyer et al1399 11CHROMacademy18 Training & Events19 Staff21
powered by
Building on the success of our ground-breaking HPLC Troubleshooter, we are excited to announce the GC version.
In 3 simple steps we can help you overcome your instrument, separation and quantitation issues.
Step 1. Select from over 40 different chromatographic symptoms, which
deal with separation, peak shape, baseline and quantitation issues.
Step 2. Select from nearly 50 different instrument symptoms which deal
with pressure and fl ow problems as well as a host of inlet and detector
issues.
Step 3. The troubleshooter returns a list of possible causes ranked by an
algorithm, developed by chromatography experts. Each cause has a concise
summary of the problem and recommended solutions.
Our promiseIf you don’t fi nd a satisfactory solution or just need more information, ask
our experts and we‘ll have your answer within 24 hours.
With its ease of use, self explanatory graphics and a huge database of resources to draw from, the CHROMacademy HPLC troubleshooter is invaluable.
CHROMacademy is announcing the launch of the interactive GC Troubleshooter, sponsored by Thermo Scientifi c. The GC Interactive Troubleshooter - Test Drive Now!
CHROMacademy is a professional development site for chromatographers developed in collaboration with the -$t($�UFBN�BOE�$SBXGPSE�4DJFOUJå�D�
Visit the new CHROMacademy Forum today, as a Lite Member you will have access to:
t� $)30.BDBEFNZ�'PSVNt� .POUIMZ�XFCDBTU�BOE�UVUPSJBMt� 4FMFDUFE�F-FBSOJOH�NPEVMFTt� 'FBUVSFE�$)30.BDBEFNZ�DPOUFOU
To sign up click here: http://www.chromacademy.com/forum.html
If you have any questions or concerns contact us

The Column www.chromatographyonline.com Training & Events
19
Helle and Chmelka2 News9 Incognito11 Dreyer et al1399 11CHROMacademy18 Training & Events19 Staff21
GCFundamental GC 2 April 2013Hilton Glasgow Grosvenor, Great Western Road, Glasgow, UKWebsite: http://www.crawfordscientific.com/training-online-calendar.asp
GC & GC–MS Troubleshooting & Maintenance12 April 2013University of Nottingham, UKWebsite: http://anthias.co.uk/content/1-day-anthias-gc-gc-ms-troubleshooting-
maintenance
Gas Chromatography: Fundamentals, Troubleshooting and Method Development15–18 April 2013
Chicago, Illinois, USA
Website: http://proed.acs.org/course-
catalog/courses/GCPC/
Absolute Basics of GC & GC–MS20 May 2013
The Open University, Milton Keynes, UK
Website: http://anthias.co.uk/content/1-
day-anthias-absolute-basics-gc-gc-ms
HPLC/LC–MSLC–MS Interpretation3 April 2013
Training CoursesHilton Milton Keynes, Milton Keynes, UK
Website: http://www.crawfordscientific.
com/training-online-calendar.asp
How to Troubleshoot HPLC21 May 2013
Dublin, Ireland
Website: http://www.
mournetrainingservices.co.uk/course_list.
html#htth
Metabonomics Shortcourse — Metabolic Phenotyping in Disease Diagnosis & Personalized Health Care 17–21 June 2013
Imperial College London
Website: http://www1.imperial.ac.uk/
surgeryandcancer/divisionofsurgery/
biomol_med/education/short_courses/
metabonomicsshortcourse/
The Theory of HPLCOn-line training from CHROMacademy
Website: http://www.chromacademy.com/
lc-hplc-overview.asp
Basics of Preparative HPLCOn-line training from CHROMacademy
Website: http://www.chromacademy.com/
Preparative_HPLC_Essential_Guide.
asp?tpm=1_2
Fundamental LC–MSOn-line training from CHROMacademy
Website: http://www.chromacademy.com/
mass_spec-overview.asp
HPLC TroubleshooterOn-line training from CHROMacademy
Website: http://www.chromacademy.com/
hplc_troubleshooting.html
METHOD VALIDATIONIntroduction to Analytical Method Validation23 April 2013
Hilton Milton Keynes, Milton Keynes, UK
Website: http://www.crawfordscientific.
com/training-online-calendar.asp
Validation of Analytical Methods for Pharmaceutical Analysis6–7 May 2013
Berlin, Germany
Website: http://www.
mournetrainingservices.co.uk/course_list.
html#vampa
SAMPLE PREPARATIONSolid-Phase ExtractionOn-line training from CHROMacademy
Website: http://www.chromacademy.com/
sample-prep-training.html
GPC/SECPolyRMC GPC Academy20–22 May 2013PolyRMC Facilities at Tulane University in
New Orleans, LA, USA
Website: http://tulane.edu/sse/
polyRMC/polyrmc-gpc-academy.cfm
MISCELLANEOUS Polymer Chemistry: Principles and Practice 24–29 March 2013Blacksburg, Virginia, USA
Website: http://proed.acs.org/course-
catalog/courses/PCPP/
Light Scattering Training16–18 April 2013Santa Barbara, California, USA
Website: http://www.wyatt.com/
training/training/light-scattering-
training.html
Please send your event and training course information to Kate Mosford [email protected]

The Column www.chromatographyonline.com Training & Events
20
Helle and Chmelka2 News9 Incognito11 Dreyer et al1399 11CHROMacademy18 Training & Events19 Staff21
16–20 June 2013HPLC2013 Amsterdam
Amsterdam RAI Conference Centre, Amsterdam, The Netherlands
Co-chairs: Peter Schoenmakers and Wim Kok
E-mail: [email protected]
Website: www.hplc2013.org
1–4 July 2013 9th Annual Conference of the Metabolomics Society
Scottish Exhibition and Conference Centre (SECC), Glasgow, Scotland, UK
Organizers: Metabolomics Society
Tel: +44 (0)131 339 9235
Fax: +44 (0)131 339 9798
E-mail: [email protected]
Website: www.metabolomics2013.org
28 July–2 August 2013ICMGP International Conference on Mercury as a Global Pollutant
Edinburgh, Scotland
Organizers: International Labmate Ltd
Tel: +44 (0)1727858840
Fax: +44 (0)1727840310
E-mail: [email protected]
Website: www.mercury2013.com
6–9 October 2013 20th International Symposium on Electro- and Liquid-Phase Separation
Techniques, ITP2013
Puerto de la Cruz, Tenerife, Canary Islands, Spain
Tel: +34 922 318990
Fax: +34 922 318003
E-mail: [email protected]
Website: http://www.itp2013.ull.es
Event News
HPLC
powered by
LIVE on the web
www.chromacademy.com
t� 1SFTFOUFE�CZ�$)30.BDBEFNZ�T�DISPNBUPHSBQIZ�FYQFSUT
t� $PNQSFIFOTJWF�USBJOJOH�DPVSTF������Y���IPVS�MJWF�XFC�TFTTJPOT
t� "TTFTTNFOUT���1%'�USBJOJOH�NBUFSJBMT
t� .VMUJNFEJB�UFBDIJOH�BOE�MFBSOJOH�NBUFSJBMT
t� ,FZ�DPODFQUT�IJHIMJHIUFE�VTJOH�SFBM�MJGF�NFUIPET�BOE�DISPNBUPHSBNT
t� $MJDL�)FSF�GPS�NPSF�JOGPSNBUJPO�BOE�TQFDJBM�EJTDPVOUT
Fundamentals of HPLCInstructor led HPLC training without leaving your desk
'JOE�PVU�NPSF�BU

Contact Information
Group PublisherMichael J. [email protected]
Sales ManagerValeria [email protected]
Senior Sales Executive Lindsay [email protected]
Sales Operations AssistantSarah [email protected]
Editor-in-ChiefAlasdair [email protected]
Managing Editor Kate [email protected]
Assistant Editor Bethany [email protected]
Advanstar CommunicationsBridgegate Pavilions, 4AChester Business Park,Wrexham Road,Chester, CH4 9QH, UKTel: +44 (0) 1244 629 300Fax: +44 (0) 1244 678 00
Mission Statement The Column is the analytical chemist’s companion within the dynamic world of chromatography. Interactive and accessible, it provides a broad understanding of technical applications and products while engaging, stimulating and challenging the global community with thought-provoking commentary that connects its members to each other and the industries they serve. Whilst every effort is made to ensure the accuracy of the information supplied, Advanstar Communications accepts no responsibility for the opinions and statements expressed.
Group PublisherMichael J. [email protected]
Associate Publisher Edward [email protected]
East Coast Sales ManagerStephanie [email protected]
Editorial Director,Analytical SciencesLaura [email protected]
Group Technical Editor Stephen A. [email protected]
Managing Editor Megan [email protected]
Administation and Sales OfficesWoodbridge Corporate Plaza,485 Route 1 South,Building F, First floor, Iselin,NJ 08830, USATel: +1 732 596 0276Fax: +1 732 225 0211
Corporate Office, 641 Lexington Ave., 8th Floor, New York, NY 10022-4503, USA
Eu
rop
eN
ort
h A
meri
ca
©2013 Advanstar Communications Inc. All rights reserved. No part of this publication may be reproduced or transmitted in any form or by any means, electronic or mechanical including by photocopy, recording, or information storage and retrieval without permission in writing from the publisher. Authorization to photocopy items for internal/educational or personal use, or the internal/educational or personal use of specific clients is granted by Advanstar Communications Inc. for libraries and other users registered with the Copyright Clearance Center, 222 Rosewood Dr. Danvers, MA 01923, 978-750-8400 fax 978-646-8700 or visit http://www.copyright.com online. For uses beyond those listed above, please direct your written request to Permission Dept. fax 440-756-5255 or email: [email protected].
Chief Executive Officer Joe Loggia
Chief Executive Officer Fashion Group, Executive Vice-PresidentTom Florio
Executive Vice-President,Chief Administrative Officer & Chief Financial Officer Tom Ehardt
Executive Vice-President,Chief Marketing Officer Steve Sturm
Executive Vice-PresidentGeorgiann DeCenzo
Executive Vice-PresidentChris DeMoulin
Executive Vice-PresidentRon Wall
Executive Vice-President,Business SystemsRebecca Evangelou
Sr Vice-PresidentTracy Harris
Vice-President,Media OperationsFrancis Heid
Vice-President,LegalMichael Bernstein
Vice-President,Human ResourcesNancy Nugent
Vice-President,Electronic Information TechnologyJ Vaughn
21
Helle and Chmelka2 News9 Incognito11 Dreyer et al1399 11CHROMacademy18 Training & Events19 Staff21