Chi Square Test Dealing with categorical dependant variable.

χχχχ2 tests 1) 1 categorical variable
χχχχ2 test for goodness-of-fit
2) 2 categorical variables
χχχχ2 test for independence (association, contingency)
3) 2 categorical variables
McNemar's test for change
∑∑∑∑
−−−−====χχχχk
1 i
2iidf
2
E)EO(
normal approximation to χχχχ2
df > 30

χχχχ2 goodness-of-fit test In a random sample of 1000 housewives, 55% state a preference for Brand A and 45% for Brand B. Is this result consistent with the hypothesis that 50% of all housewives prefer Brand A (i.e., no brand preference)?
category #observed #expected Oi Ei Oi -Ei (Oi -Ei )2
i
2ii
E)EO( −−−−
A 550 500 50 2500 5 B 450 500 -50 2500 5 ∑∑∑∑=n 1000 1000 0 10
Ho: O1 = O2 = O3 = … OK H1: not Ho
∑∑∑∑
−−−−====χχχχk
1 i
2iidf
2
E)EO(
df = k-1 where k = #categories χχχχ2
1 = 10 critical χχχχ2
1, .05 = 3.84, reject Ho

nE
Onn2E
OEO2E
O
EE
EOE2
EO
EE
EOE2
EO
EEOE2O
E)EO(
222
2222
22k
1 i
2iidf
2
−−−−∑∑∑∑
====++++−−−−∑∑∑∑
====∑∑∑∑++++∑∑∑∑−−−−∑∑∑∑
====
∑∑∑∑
++++∑∑∑∑
−−−−∑∑∑∑
====∑∑∑∑
++++−−−−====
∑∑∑∑
++++−−−−====∑∑∑∑
−−−−====χχχχ
Oi Ei Oi
2
i
2i
EO
A 550 500 302500 605 B 450 500 202500 405 ∑∑∑∑=n 1000 1000 1010
χχχχ21 = 1010 - 1000 = 10
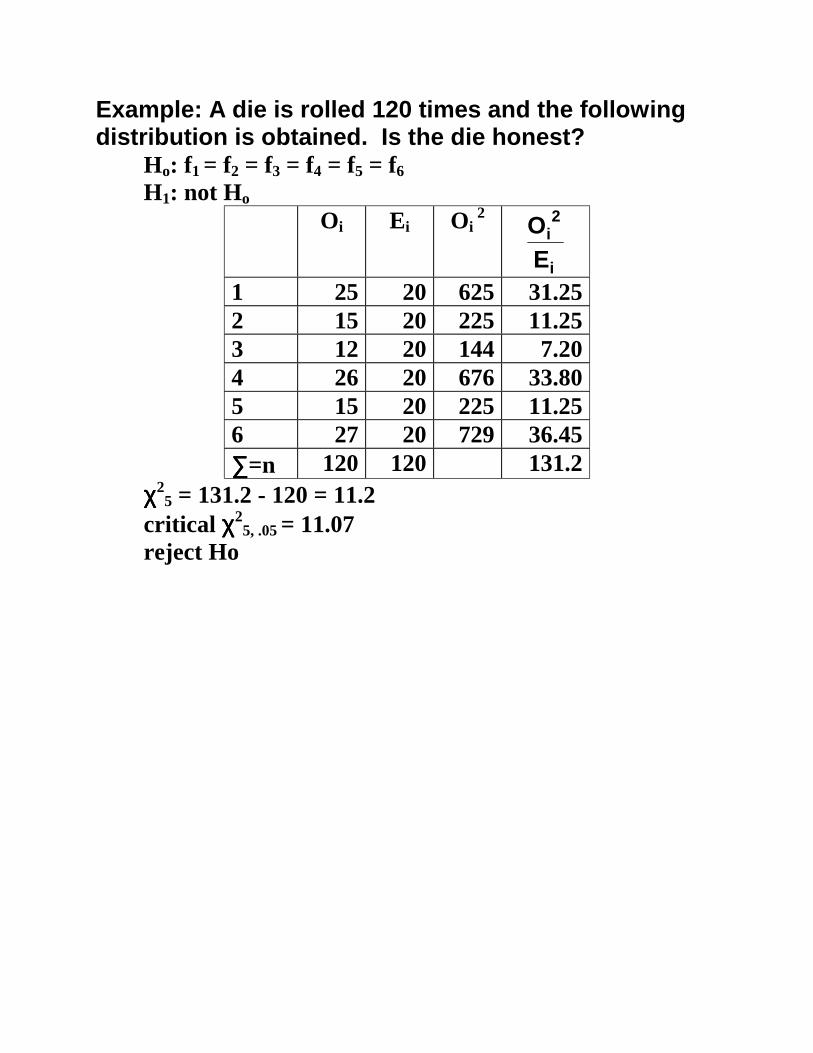
Example: A die is rolled 120 times and the following distribution is obtained. Is the die honest?
Ho: f1 = f2 = f3 = f4 = f5 = f6 H1: not Ho
Oi Ei Oi 2
i
2i
EO
1 25 20 625 31.25 2 15 20 225 11.25 3 12 20 144 7.20 4 26 20 676 33.80 5 15 20 225 11.25 6 27 20 729 36.45 ∑∑∑∑=n 120 120 131.2
χχχχ25 = 131.2 - 120 = 11.2
critical χχχχ25, .05 = 11.07
reject Ho
χχχχ2 test for independence (association, contingency)

A college professor distributes a teacher-effectiveness questionnaire to 200 students registered in a statistics class. One question is: How do you rate the instructor in her ability to explain difficult concepts (above average, average, below average). The results are summarized by rating and Level. Do ratings depend on level?
I (C1) II (C2) III (C3) above (R1) 34 36 30 100 average (R2) 12 24 24 60 below (R3) 4 20 16 40 50 80 70 200
Ho: the 2 variables are independent H1: the 2 variables are dependent
expected frequencies are determined assuming Ho is true
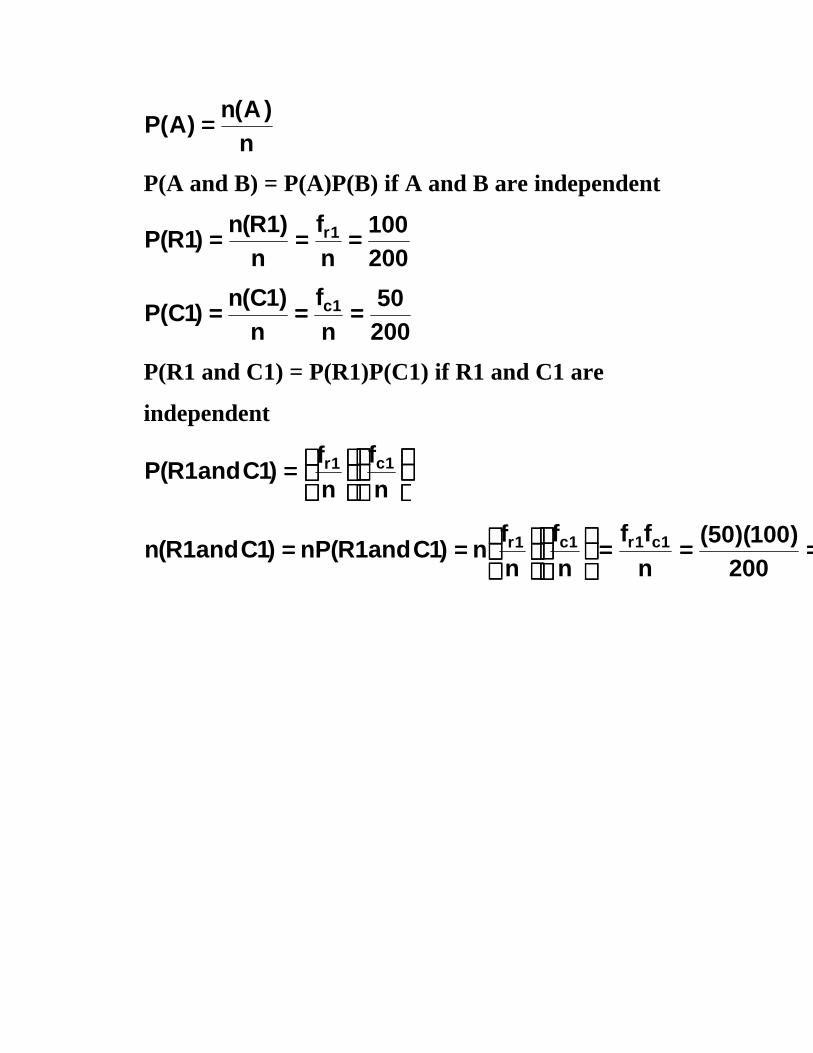
n)A(n)A(P ====
P(A and B) = P(A)P(B) if A and B are independent
200100
nf
n)1R(n)1R(P 1r ============
20050
nf
n)1C(n)1C(P 1c ============
P(R1 and C1) = P(R1)P(C1) if R1 and C1 are
independent
====
nf
nf)1Cand1R(P 1c1r
200)100)(50(
nff
nf
nfn)1Cand1R(nP)1Cand1R(n 1c1r1c1r ============
========

I (C1) II (C2) III (C3) above (R1) 34 (25) 36 (40) 30 (35) 100 average (R2) 12(15) 24(24) 24(21) 60 below (R3) 4(10) 20(16) 16(14) 40 50 80 70 200
Oi Ei Oi -Ei (Oi -Ei )2
i
2ii
E)EO( −−−−
Oi 2
i
2i
EO
34 25 9 81 3.24 1156 46.24 12 15 -3 9 .6 144 9.6 4 10 -6 36 3.6 16 1.6 36 40 -4 16 .4 1296 32.4 24 24 0 0 0 576 24 16 14 2 4 .2857 256 18.2857 20 16 4 16 1 400 25 30 35 -5 25 .7143 900 25.714 24 21 3 9 .4286 576 27.4285 ∑∑∑∑=n 200 200 0 10.2686 210.268
df = (r-1)(c-1)
∑∑∑∑
−−−−====χχχχk
1 i
2iidf
2
E)EO(
χχχχ24 = 10.2686
nEO
i
2idf
2 −−−−∑∑∑∑
====χχχχ
χχχχ24 = 210.268 - 200 = 10.268
critical χχχχ24, .05 = 9.49
reject Ho


McNemar Change Test This test studies the change in a group of 75 respondents measured twice on a dichotomous variable. One group of voters is asked twice about their voting intention, before and after a television debate. 13 respondents changed their preference from Carter to Reagan while 7 respondents changed their preference from Reagan to Carter. Is the number of respondents changing similar in the direction from Reagan to Carter as in the other direction.
a b c d
before Reagan Carter
Reagan 27 7 (10) 34 after Carter 13 (10) 28 41 40 35 75
H0: the two changes are the same H0: the two changes are different
(((( )))) 8.110
)1013(10
)107(E
EO 222
12 ====−−−−++++−−−−====∑∑∑∑
−−−−====χχχχ

before Reagan Carter
Reagan 27 7 34 after Carter 13 28 41 40 35 75
8.12036
206
137)137(
cb)cb( 222
12 ============
++++−−−−====
++++−−−−====χχχχ
before Carter Reagan
Reagan 7 27 34 after Carter 28 13 41 35 40 75
8.12036
206
137)137(
da)da( 222
12 ============
++++−−−−====
++++−−−−====χχχχ

before yes no
yes 6 20 (15) 26 after no 10 (15) 14 24 16 34 50
(((( )))) 33.31550
15)1510(
15)1520(
EEO 222
12 ========−−−−++++−−−−====∑∑∑∑
−−−−====χχχχ
33.330
10030
101020
)1020(cb)cb( 222
12 ============
++++−−−−====
++++−−−−====χχχχ
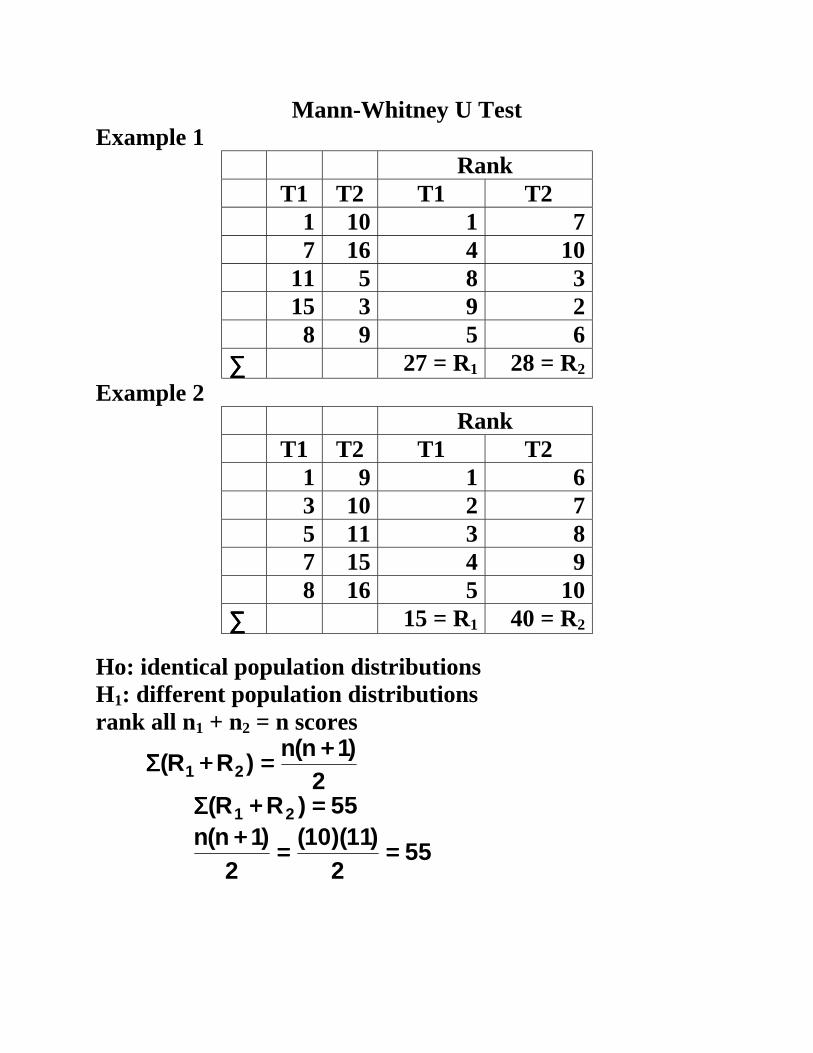
Mann-Whitney U Test Example 1
Rank T1 T2 T1 T2
1 10 1 7 7 16 4 10 11 5 8 3 15 3 9 2 8 9 5 6 ∑∑∑∑ 27 = R1 28 = R2
Example 2 Rank T1 T2 T1 T2
1 9 1 6 3 10 2 7 5 11 3 8 7 15 4 9 8 16 5 10 ∑∑∑∑ 15 = R1 40 = R2
Ho: identical population distributions H1: different population distributions rank all n1 + n2 = n scores
2)1n(n)RR( 21
++++====++++ΣΣΣΣ
55)RR( 21 ====++++ΣΣΣΣ
552
)11)(10(2
)1n(n ========++++

Example 1
13271525272
)6)(5()5)(5(R2
)1n(nnnU 111
211 ====−−−−++++====−−−−++++====−−−−++++++++====
12281525282
)6)(5()5)(5(R2
)1n(nnnU 222
212 ====−−−−++++====−−−−++++====−−−−++++++++====
U1 + U2 = n1n2 = 25 Uobs is the smaller of U1 and U2 Uobs = 12
Example 2
25151525152
)6)(5()5)(5(R2
)1n(nnnU 111
211 ====−−−−++++====−−−−++++====−−−−++++++++====
0401525402
)6)(5()5)(5(R2
)1n(nnnU 222
212 ====−−−−++++====−−−−++++====−−−−++++++++====
U1 + U2 = n1n2 = 25 Uobs is the smaller of U1 and U2 Uobs = 0

Rank A B A B
8 14 4 9 13 11 8 7 6 16 2 11 5 10 1 6 9 7 5 3 15 10 ∑∑∑∑ 20 = R1 46 = R2
Ho: identical population distributions H1: different population distributions
662
)1n(n)RR( 21 ====++++====++++ΣΣΣΣ
25201530202
)6)(5()6)(5(R2
)1n(nnnU 111
211 ====−−−−++++====−−−−++++====−−−−++++++++====
5462130462
)7)(6()6)(5(R2
)1n(nnnU 222
212 ====−−−−++++====−−−−++++====−−−−++++++++====
U1 + U2 = n1n2 = 30 Uobs = 5

U distribution - Table A6
reject if Uobs ≤≤≤≤ UCV
UCV, .05 = 3
Uobs = 5
do not reject Ho

Rank A B A B
6.1 9.1 1 16 9.2 8.2 17 8 8.7 8.6 12 11 8.9 6.9 13.5 2 7.6 7.5 5 4 7.1 7.9 3 7 9.5 8.3 18 9.5 8.3 7.8 9.5 6 9.0 8.9 15 13.5
∑∑∑∑ R1 = 94 R2 = 77

Ho: identical population distributions H1: different population distributions ΣΣΣΣ(R1 + R2) = 94 + 77 = 171
1712
)19)(18(2
)1n(n ========++++
31944581942
)10)(9()9)(9(R2
)1n(nnnU 111
211 ====−−−−++++====−−−−++++====−−−−++++++++====
49774581772
)10)(9()9)(9(R2
)1n(nnnU 222
212 ====−−−−++++====−−−−++++====−−−−++++++++====
U1 + U2 = n1n2 = 81 Uobs = 31 critical value of U.05 = 17 do not reject Ho

normal approximation to U distribution U = 200 n1 = n2 = 25
20 are n and n if 2nn
2121
U >>>>====µµµµ
5.3122
)25)(25(2nn 21
U ============µµµµ
12)1nn(nn 2121
U++++++++====σσσσ
54.5125.265612
)12525)(25)(25(12
)1nn(nn 2121U ========++++++++====
++++++++====σσσσ
18.254.51
5.312200UZU
Uobs −−−−====−−−−====σσσσ
µµµµ−−−−====
critical Z = +1.96 reject Ho

Wilcoxon Matched-Pairs Signed-Ranks Test Example 1
X Y d= X-Y rank of |d| signed 5 9 -4 3.5 -3.5 7 3 4 3.5 3.5 2 8 -6 6 -6 10 5 5 5 5 1 3 -2 1.5 -1.5 4 2 2 1.5 1.5 ∑∑∑∑R 21
Example 2 X Y d= X-Y rank of |d| signed 1 3 -2 2.5 -2.5 2 5 -3 4 -4 7 9 -2 2.5 -2.5 4 9 -5 5 -5 2 8 -6 6 -6 5 6 -1 1 -1 ∑∑∑∑R 21
Ho: identical population distributions H1: different population distributions
sdifference zero-non of # n where2
)1n(nR ====++++====∑∑∑∑
21 R ====∑∑∑∑
21 2
(6)(7)2
)1n(n ========++++

Example 1
T(+) = 10
T(-) = 11
Tobs = smaller of T(+) and T(-) = 10
Example 2
T(+) = 0
T(-) = 21
Tobs = smaller of T(+) and T(-) = 0
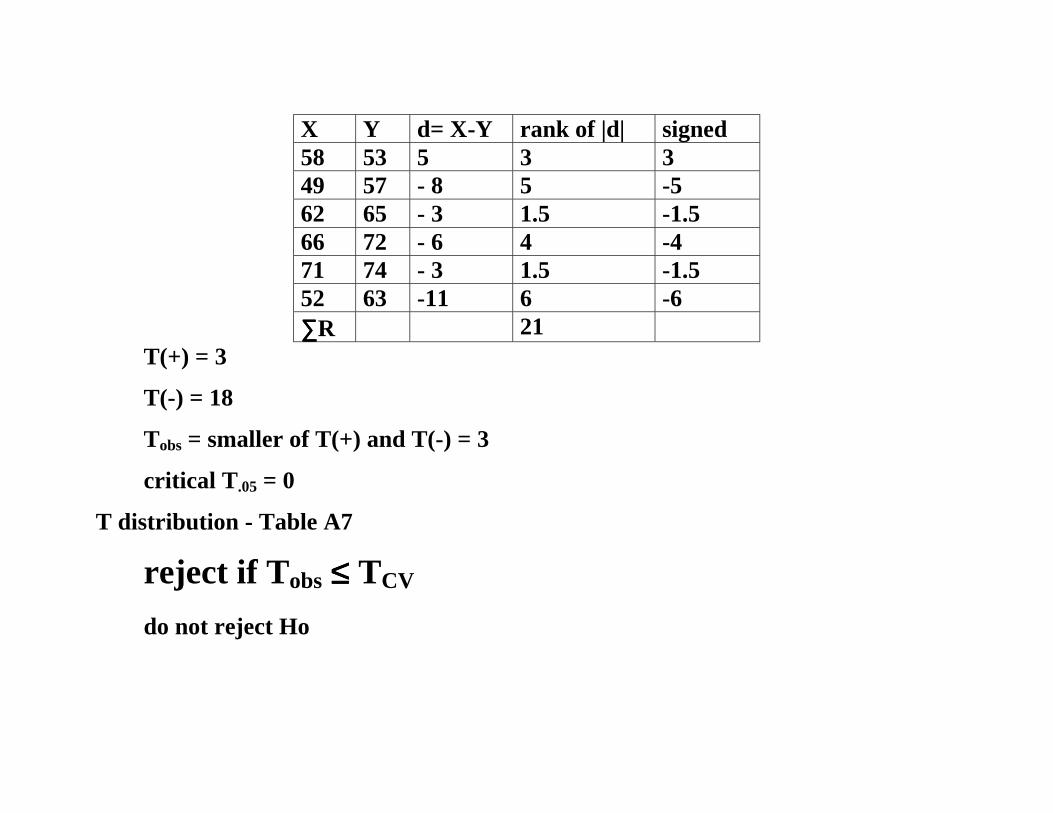
X Y d= X-Y rank of |d| signed 58 53 5 3 3 49 57 - 8 5 -5 62 65 - 3 1.5 -1.5 66 72 - 6 4 -4 71 74 - 3 1.5 -1.5 52 63 -11 6 -6 ∑∑∑∑R 21
T(+) = 3
T(-) = 18
Tobs = smaller of T(+) and T(-) = 3
critical T.05 = 0
T distribution - Table A7
reject if Tobs ≤≤≤≤ TCV do not reject Ho

normal approximation to the T distribution
n = 60 T = 615
9154
)61)(60(4
)1n(nT ========++++====µµµµ
84.1355.1845224
)121)(61)(60(24
)1n2)(1n(nST ============++++++++====
21.284.135915615TZ
T
T −−−−====−−−−====σσσσ
µµµµ−−−−====
critical Z.05 = +1.96
reject Ho

Kruskal-Wallis H Test for k independent samples Ranks G1 G2 G3 G1 G2 G3 6 6 11 3.5 3.5 8.5 9 11 15 6.5 8.5 11 3 12 17 1.5 10 12 3 7 9 1.5 5 6.5 ΣΣΣΣ 13 27 38
Ho: identical populations H1: at least 1 is different rank all n1 + n2 + … + nk = n scores
78 2
)1n(nR ====++++====∑∑∑∑
subjects of # totaln where)1n(3n
R)1n(n
12Hj
2j ====++++−−−−∑∑∑∑
++++====
6.04 39 - 45.038 5.5)(.0769)(58 )112(34
384
274
13)112(12
12H222
============++++−−−−
++++++++
++++====
H = χχχχ2(k-1) where k = # groups
critical χχχχ22, .05 = 5.99
reject Ho

T1 T2 T3
35 21 31 32 39 16 41 44 28 29 43 33 50 57 32 36 47 18 40 48 42 45 58 38
H = 8.349 critical χχχχ2
2, .05 = 5.99 reject Ho

Friedman Test for k dependent samples Ranks A1 A2 A3 A1 A2 A3 6 7 9 1 2 3 5 9 15 1 2 3 6 9 10 1 2 3 8 6 12 2 1 3 10 14 11 1 3 2 10 8 15 2 1 3 ΣΣΣΣ 8 11 17
Ho: identical populations H1: at least 1 is different
subjects of number the is n where)1k(n3R)1k(nk
12F 2jr ++++−−−−∑∑∑∑
++++====
)13)(6)(3(]17118[)13)(3)(6(
12F 222r ++++−−−−++++++++
++++==== = 7
Fr = χχχχ2(k-1) where k = # groups
critical χχχχ22, .05 = 5.99
reject Ho

Summary Design parametric nonparametric - ranks 2 independent samples t-test Mann-Whitney U 2 dependent samples t-test Wilcoxon k independent samples ANOVA between Kruskal-Wallis k dependent samples ANOVA within Friedman
POWER
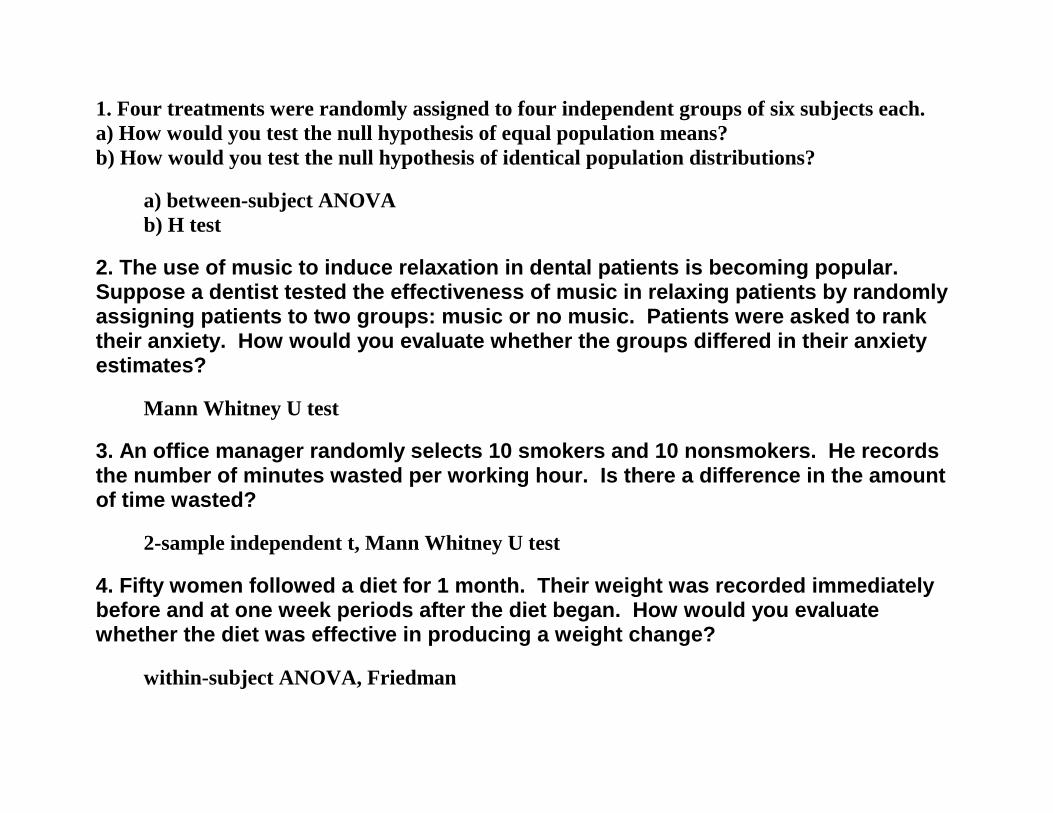
1. Four treatments were randomly assigned to four independent groups of six subjects each. a) How would you test the null hypothesis of equal population means? b) How would you test the null hypothesis of identical population distributions?
a) between-subject ANOVA b) H test
2. The use of music to induce relaxation in dental patients is becoming popular. Suppose a dentist tested the effectiveness of music in relaxing patients by randomly assigning patients to two groups: music or no music. Patients were asked to rank their anxiety. How would you evaluate whether the groups differed in their anxiety estimates?
Mann Whitney U test
3. An office manager randomly selects 10 smokers and 10 nonsmokers. He records the number of minutes wasted per working hour. Is there a difference in the amount of time wasted?
2-sample independent t, Mann Whitney U test
4. Fifty women followed a diet for 1 month. Their weight was recorded immediately before and at one week periods after the diet began. How would you evaluate whether the diet was effective in producing a weight change?
within-subject ANOVA, Friedman