2 Surface Texture Characterization and Evaluation … Surface Texture Characterization and...
30
2 Surface Texture Characterization and Evaluation Related to Machining Georgios P. Petropoulos 1 , Constantinos N. Pandazaras 1 , J. Paulo Davim 2 1 Department of Mechanical and Industrial Engineering, University of Thessaly, Pedion Areos, 38334 Volos, Greece, E-mail: [email protected], E-mail: [email protected] 2 Department of Mechanical Engineering, University of Aveiro, Campus Santiago, 3810-193 Aveiro, Portugal, E-mail: [email protected] Τhis chapter is aimed at providing current knowledge on the association of surface texture with machining, along with recent advances in surface characterization and evaluation. Various texture parameters, adopted by ISO standards or not, are de- scribed and their distinctive power is considered. Arithmetic parameters, statistical and random process functions serve as measures for rendering in-height and in- length surface characteristics and allow multiparameter analysis of the surface, something quite necessary under current high requirements for precision and op- eration. Theoretical models for roughness parameters and experimental trends with regard to machining conditions are discussed. Isotropy of machined surfaces is also considered and methods for surface typology are finally discussed. 2.1 General Concepts of Surface Topography 2.1.1 Introductory Remarks The various manufacturing processes applied in industry produce the desired shapes in the components within the prescribed dimensional tolerances and surface quality requirements. Surface topography and texture is a foremost characteristic among the surface integrity magnitudes and properties imparted by the tools used in the processes, machining mostly, and especially their finishing versions.
Transcript of 2 Surface Texture Characterization and Evaluation … Surface Texture Characterization and...
2
Surface Texture Characterization and Evaluation Related to Machining
Georgios P. Petropoulos1, Constantinos N. Pandazaras1, J. Paulo Davim2
1 Department of Mechanical and Industrial Engineering, University of Thessaly, Pedion Areos, 38334 Volos, Greece, E-mail: [email protected], E-mail: [email protected] 2 Department of Mechanical Engineering, University of Aveiro, Campus Santiago, 3810-193 Aveiro, Portugal, E-mail: [email protected]
Τhis chapter is aimed at providing current knowledge on the association of surface texture with machining, along with recent advances in surface characterization and evaluation. Various texture parameters, adopted by ISO standards or not, are de-scribed and their distinctive power is considered. Arithmetic parameters, statistical and random process functions serve as measures for rendering in-height and in-length surface characteristics and allow multiparameter analysis of the surface, something quite necessary under current high requirements for precision and op-eration. Theoretical models for roughness parameters and experimental trends with regard to machining conditions are discussed. Isotropy of machined surfaces is also considered and methods for surface typology are finally discussed.
2.1 General Concepts of Surface Topography
2.1.1 Introductory Remarks
The various manufacturing processes applied in industry produce the desired shapes in the components within the prescribed dimensional tolerances and surface quality requirements.
Surface topography and texture is a foremost characteristic among the surface integrity magnitudes and properties imparted by the tools used in the processes, machining mostly, and especially their finishing versions.

38 G.P. Petropoulos, C.N. Pandazaras, J.P. Davim
And it has to be considered from two standpoints, i.e., process control and tri-bological function, in the context that to achieve the proper functionally oriented surface the appropriate manufacturing method must be performed along with the inverse problem of controlling the forms of texture that various processes generate related also to the improvement of the latter and of the machine tools, accordingly.
Over the years the characterization and evaluation of engineering surface texture has constituted a challenging metrological problem that has remained open so far, especially when high-precision and/or functional performance requirements exist. This fact is attributed to the usually complicated form of surface textures and the need to obtain a satisfying description globally, as well as at various levels.
Traditionally, surface texture has been used more as an index of the variation in the process due to tool wear, machine tool vibration, damaged machine elements, etc., than as a measure of the performance of the component; a stable process com-bined with the specification of the arithmetic average, Ra, was considered to be enough in industrial practice.
Emerging technological advances put new limits in manufacturing tolerances and better understanding of tribological phenomena on the other hand, implied the need for functional surface characterization, which in turn caused a proliferation of parameters.
A vast amount of research works towards a concise and proper characterization of surface texture is met in the literature with an inevitable emphasis on the asso-ciation of profile characteristics with the manufacturing process parameters.
Surface typology, the classification of textures according to their shape followed by an exhaustive investigation on the capability of various manufacturing proc-esses of producing these classes would be the most ambitious research goal.
The problem of achieving the necessary surface quality, in general, embraces the following:
• correlation between surface quality and the desirable function of the surface; • selection of the manufacturing process or processes, as well as the implemen-
tation of optimal process parameters; and • measurement of suitable representative surface characteristics.
2.1.2 Essential Definitions
A technological or engineering surface means any surface generated by manufac-turing methods, such as cutting and grinding (mostly), forming and non-conven-tional material-removal processes (electrodischarge machining, waterjet, laser machining, etc.). The engineering surface achieves, after the relevant process, new properties and characteristics compared to the initial one, that constitute what we call surface integrity. This term refers to:
1. the geometric characteristics (texture, topography); and 2. physical-chemical, crystallographic characteristics and mechanical properties of
the surface, like microhardness, residual stresses, plastically deformed or frac-tured layers, corrosion resistance, absorption, surface energy and others.

2 Surface Texture Characterization and Evaluation Related to Machining 39
Surface integrity, as defined, is associated with the manufacturing process, as well as the environment for free surface, and the interface and working conditions in tribological systems.
Next, we will focus on the characterization and analysis of surface texture and mainly of surface roughness. It is worth giving here some useful definitions:
• Nominal surface: The workpiece surface with form and dimensions prescribed in the drawing; no surface irregularities are considered.
• Real profile: The surface profile representation as rendered by mechanical or optical measuring instruments. It should be noted that profile measurements are undertaken in the direction of a characteristic orientation of surface asperities, which usually coincides with a direction normal to the axis of the process (nor-mal to cutting speed in cutting operations). A cut surface exhibits minimum un-evenness parallel to the axis, whereas maximum asperity heights are encoun-tered in the normal direction.
In this regard, the geometric deviations from the nominal surface fall within the following categories:
1. Macrogeometric deviations (errors): They are the first- and second-order devia-tions called form errors and waviness, respectively.
2. Microgeometric deviations: Third- and higher-order deviations, which corres-pond to the surface microform (surface roughness).
The different deviations are listed in Table 2.1, together with their principal sources. The above surface features along with possible corresponding causes are limited to cutting processes but are representative, as most of the industrial finishing operations are as such and the majority of them are used in tribological applications.
Table 2.1. Geometric deviations of machined surfaces (DIN 4760)
Order Deviations Causes
1st Form errors (flatness, roundness, straight-ness, cylindricity, etc.)
Errors of machine tool slides, elastic deformations, erro-neous fixation of tool or workpiece, severe tool wear
2nd Waviness Eccentric rotation of workpiece or tool, vibrations in the manufacturing system (process-tool−workpiece−machine-tool environment), tool wear, inhomogeneity of processed material
3rd Grooves Tool edge form, process kinematics, chip morphology
4th Cracks Tool-nose wear, built-up-edge formation, mode of chip formation, galvanic procedures
5th Crystalline structure Crystallization mode, irregularities due to chemical reac-tions, corrosive damage
6th Crystalline formation Physical and chemical alterations in the material fine structure, deformations of lattice

40 G.P. Petropoulos, C.N. Pandazaras, J.P. Davim
It is evident that errors of form and waviness can be restricted in many cases. On the other hand, surface roughness is inevitable, as it is caused by the influence of the cutting tool during the chip-removal procedure. In this way, roughness is the domi-nant magnitude related to the machinability of the processed material, the tool form, the machining conditions, the tolerance requirements (form and dimensional), tri-bological phenomena (friction, wear) and, in general, to functioning of technologi-cal surfaces. Furthermore, special knowledge and analysis of roughness effectively assists problems in simulations, optimization, adaptive control, etc., mainly in ap-plications of modern manufacturing systems (CNC, FMS, CAD/CAM, CIM).
The requirements of current mechanical systems concerning the roughness of mating surfaces can be summarized as:
• The desirable degree of surface roughness for a given application has to be clearly specified in order to compromise the effective function of the surface and the minimization of production time and cost.
• Knowledge of roughness that can be achieved by the various machining proc-esses is necessary, as well as the effect of the practical range of machining con-ditions employed.
• Standardization of representative roughness magnitudes is a must for developing instrumentation for relevant characterization and evaluation.
Also, an attempt should be made to set a limit for the minimum degree of rough-ness, as a higher class of roughness than necessary is not advantageous, exerting a negative effect on the process time and cost, whereas in the opposite case, sur-faces imparted with higher unevenness are not acceptable as they show functional discrepancies.
A simple scheme of the interdependence of surface characteristics, the machin-ing process system and the function of the surface is presented in Figure 2.1. Obvi-ously, any approach to the problem of achieving the desirable roughness must consider these outlines.
Function of the surface
Dynamic characteristics of the machining system
Unprocessed workpiece
MaterialGeometryDimensions
Machining process
Machining methodTechnological data
Machined surface
MeasurementMethodMagnitude
Functional behaviour
Desirable quantities and properties for
measuring
Friction and wear conditions
Figure 2.1. Scheme of interconnection among machined surface, process characteristics and surface function

2 Surface Texture Characterization and Evaluation Related to Machining 41
2.2 Surface Texture Parameters
A plethora of surface parameters has been adopted by international standards and proposed in view of numerous research studies [1−4]. As aforementioned, this fact is ascribed to the usually complex form of surface profiles, and on the other hand to the need for the detailed description required in functional applications.
The parameters presented, with brief definitions and comments, in Sec-tions 2.2.1 and 2.2.2 are mostly included in ISO 13565-2: 1997 standard, which is based on the “M” (mean line system).
2.2.1 Arithmetic Parameters
Amplitude Parameters
• Ra (CLA), arithmetic average roughness (center line average): the arithmetic average value of filtered roughness profile determined from deviations about the center line within the evaluation length; the most popular parameter for a machining process and product quality control. This parameter is easy to de-fine, easy to measure even in the least sophisticated profilometers and gives a general description of surface amplitude. Though it lacks physical signifi-cance, it is established in almost every national standard for measuring rough-ness. On the other hand, it is insensitive to small variations in the profile and gives no information on the in-length characteristics, also no distinction is made between peaks and valleys.
An indicative calculation of Ra is shown in Figure 2.2.
Figure 2.2. Mean line system and definition of Ra
• Rt, maximum peak to valley, the maximum peak to valley height of the filtered profile over the evaluation length; it is very sensitive to large deviations from the mean line and scratches. Very commonly used along with Ra as a general in-dicator.
• Rz, average peak to valley height; it smoothens large deviations that are not representative of the surface finish compared to Rt.

42 G.P. Petropoulos, C.N. Pandazaras, J.P. Davim
• Rq, root mean square or RMS roughness: the root mean square average of the roughness profile ordinates; it is more sensitive to peaks and valleys than Ra.
• Rp, the value of the highest single peak above the center line; it is sensitive to material removal from peaks.
• Rpm, the mean leveling depth; it gives proper characterization of bearing and sliding surfaces, and substrates to be coated.
• Rv, the deepest valley below the center line; it is an indicator of oil retention or the mechanical behavior of the surface under high stress.
In Figure 2.3 the representation of different characteristics by Rt, Rp and Rv is shown.
Figure 2.3. Definition of the Rt, Rp and Rv amplitude parameters
Spacing Parameters
• Rsm, the mean spacing of the asperities at the level of the central line; it provides approximation of the distance between successive peaks.
• λa, the average wavelength in the profile; the principal wavelength of the profile can be related to machining condition (feed, for instance).
• m, peak count: the number of profile peaks per unit length; it is useful in adhe-sive and coating applications.
• n(0), number of intersections of the profile at the mean line; it gives rough in-formation about the peak form.
Hybrid Parameters
• RΔa, the average slope of the profile; it is closely associated with friction and hydrodynamic lubrication.
• RΔq, the root mean square slope of the profile; it is more sensitive than RΔa to drastic changes in the profile due to wear.
• rp, the average radius of asperities; a crucial parameter closely related to contact mechanics, wear and fatigue.
• Rlo, the developed length of the profile; it is a measure of the profile openness related directly to the profile slope and is a useful parameter for coating applica-tions.

2 Surface Texture Characterization and Evaluation Related to Machining 43
Surface Waviness
Surface roughness has attracted a lot of attention as an important machinability parameter. Surface waviness is usually considered more as a symptom of malfunc-tions in the machine tool system or poor machining, than a dependent machining variable.
Regarding its characteristics it is characterized by introduction of equivalent to roughness arithmetic and statistical function parameters in the corresponding stan-dards.
• Wa, mean value of the waviness of the unfiltered profile. • Wt, maximum value of the waviness of the unfiltered profile.
Both parameters should be considered in the case of severe vibration within the machine tool or from an external source, or eccentricity of the tool or the work-piece.
2.2.2 Statistical and Random Process Functions and Parameters
Surface texture analysis obtained by statistical and random process tools is more sophisticated and of scientific foundation than evaluation by arithmetic parameters.
Considering that a real profile y(x) of a machined surface is one out of a statisti-cal ensemble of possible profiles, it can be represented by a random process that can be sufficiently described by two functions; the height statistical distribution function f(y) and the autocorrelation function R(λ) or equivalently by the spectral density function or autospectrum S(ω), being the Fourier transform of R(λ).
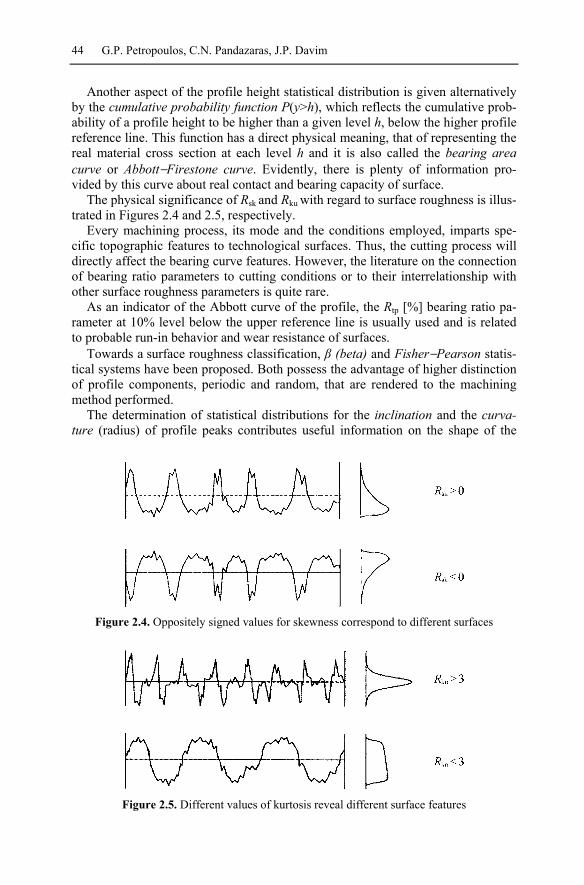
The height distribution f(y) assigns a probability to some ordinate of the profile to lie at a given depth in regard to the central line. The most widespread distribu-tion model is typically a Gaussian distribution that matches with reasonable ap-proximation a significant number of engineering surfaces. f(y) gives evidence and sometimes characterization of the profile shape and is directly associated with surface loading, wear, corrosion, etc. Interesting parameters are the central mo-ments of first up to fourth order. The first-order central moment is the average height Ra and the second-order central moment stands for variance σ2 (or Rq = σ2). The third- and fourth-order central moments are skewness and kurtosis, accord-ingly; both provide more information on the real profile form.
Skewness ζ (Rsk = ζ) evaluates the degree of asymmetry in cases of asymmetric distribution and is characterized as positive or negative, relevantly. Surfaces “emp-ty” of material exhibit positive skewness, whereas negative skewness is presented by “full” surfaces. It is a significant parameter for tribological applications, such as bearing surface functionality, wear control and others. A Gaussian distribution presents ζ = 0.
Kurtosis ξ (Rku = ξ) describes the distribution sharpness and takes the value 3 for the normal distribution. For ξ>3 the surface is dominated by sharp peaks (spiky), whereas if ξ<3 the peaks are bumpy. In this regard, information is provided on the real area of contact and wear resistance, it is also possible to detect the periodicity of the profile (ξ<3).
44 G.P. Petropoulos, C.N. Pandazaras, J.P. Davim
Another aspect of the profile height statistical distribution is given alternatively by the cumulative probability function P(y>h), which reflects the cumulative prob-ability of a profile height to be higher than a given level h, below the higher profile reference line. This function has a direct physical meaning, that of representing the real material cross section at each level h and it is also called the bearing area curve or Abbott−Firestone curve. Evidently, there is plenty of information pro-vided by this curve about real contact and bearing capacity of surface.
The physical significance of Rsk and Rku with regard to surface roughness is illus-trated in Figures 2.4 and 2.5, respectively.
Every machining process, its mode and the conditions employed, imparts spe-cific topographic features to technological surfaces. Thus, the cutting process will directly affect the bearing curve features. However, the literature on the connection of bearing ratio parameters to cutting conditions or to their interrelationship with other surface roughness parameters is quite rare.
As an indicator of the Abbott curve of the profile, the Rtp [%] bearing ratio pa-rameter at 10% level below the upper reference line is usually used and is related to probable run-in behavior and wear resistance of surfaces.
Towards a surface roughness classification, β (beta) and Fisher−Pearson statis-tical systems have been proposed. Both possess the advantage of higher distinction of profile components, periodic and random, that are rendered to the machining method performed.
The determination of statistical distributions for the inclination and the curva-ture (radius) of profile peaks contributes useful information on the shape of the
Figure 2.4. Oppositely signed values for skewness correspond to different surfaces
Figure 2.5. Different values of kurtosis reveal different surface features

2 Surface Texture Characterization and Evaluation Related to Machining 45
asperities and further, about the machining process (for instance, the form of the tool nose during cutting), as well as the tribological behavior of the surface (elasto-hydrodynamic lubrication, thermal contacts, etc.).
The autocorrelation function Ryy(λ) or R(λ) describes rigorously some surface features and its form reveals periodic and random characteristics of the profile. It is possible to analyze R(λ) into a declining exponential term that corresponds to the random component and a trigonometric term that is relevant to a periodic compo-nent. The initial slope and the dropping rate are also indicators of randomness.
Different forms of autocorrelation along with the corresponding height distribu-tion for different machining processes are shown in Figure 2.6.
μm 500 finish shaping
μm 20
f(z)
λ
r(λ)
Finish shaping (1.40 μm)
μm 100 finish turning
μm 5
f(z)
λ
r(λ)
Finish turning (1.0 μm)
μm 100 grinding
μm 5
f(z)
λ
r(λ)
Grinding (1.0 μm)
μm 20 supergrinding
μm 0,2
f(z)
λ
r(λ)
Supergrinding (0.18 μm)
Figure 2.6. Shapes of height distribution and autocorrelation functions for given machining processes

46 G.P. Petropoulos, C.N. Pandazaras, J.P. Davim
Useful parameters of the autocorrelation function are:
• The correlation length λ* is defined as the necessary length for reducing R(λ) to 1/10 of its initial value R(0), which is also its maximal value. The physical in-terpretation of λ* is that it expresses the minimal distance between two profile points not interrelated; their generation is due to different causes during the ma-chining operation or in the process of wear.
• The mean correlation wavelength λw indicates the mean wavelength of the pro-file asperities.
• In the case of three-dimensional illustration of the surface, the cross correlation function Rxy (λ) characterizes the orientation of the asperities in regard to the third dimension (z).
The spectral density function Syy(ω) constitutes an equivalent to the autocorre-lation function, interconnected through a Fourier transform and expresses the spac-ing profile characteristics in the frequency domain. It offers direct evaluation of the periodic components of the profile under the form of discrete peaks.
The parameters for surface roughness analysis according to ISO 13565-2: 1997 standard are given in Table 2.2.
Table 2.2. The “conventional” ISO I13565-2: 1997 parameters
Parameter Description
Ra Profile average height
Rt Maximum profile height
Rq Standard deviation of the profile height distribution
Rp Maximum profile peak height
Rv Maximum profile valley depth
RDelA Average slope of the profile
Rsk Skewness of the profile height distribution
Rku Kurtosis of the profile height distribution
Rsm Mean spacing of the profile
RDelQ Root mean square slope of the profile
Rz Average maximum height of the profile
Rtp Bearing length ratio of the profile
2.2.3 Other Morphological Parameters
The surface motif combination is a method of analyzing surface texture alter-natively to the “M” system and was introduced in the French automotive industry [5]. Now it is issued as an international standard, ISO 12085: 1996. It provides
2 Surface Texture Characterization and Evaluation Related to Machining 47
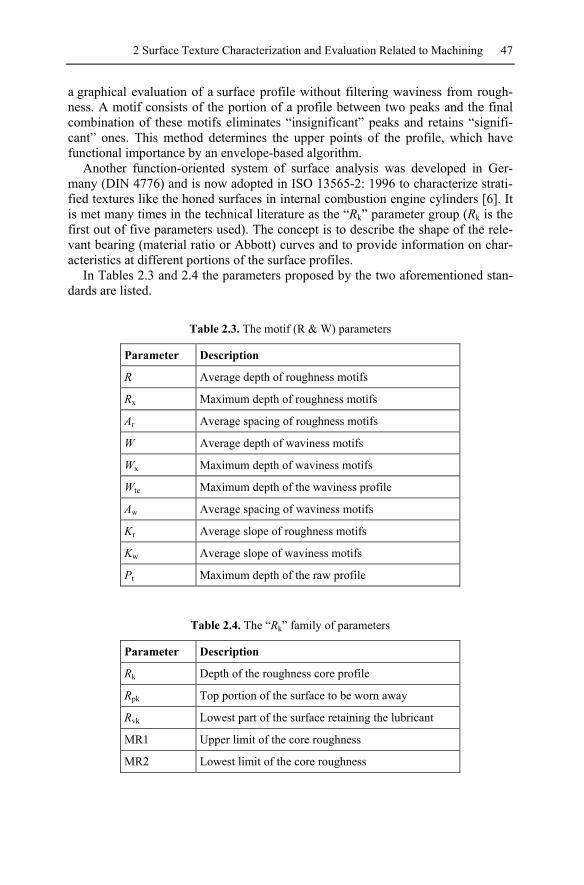
a graphical evaluation of a surface profile without filtering waviness from rough-ness. A motif consists of the portion of a profile between two peaks and the final combination of these motifs eliminates “insignificant” peaks and retains “signifi-cant” ones. This method determines the upper points of the profile, which have functional importance by an envelope-based algorithm.
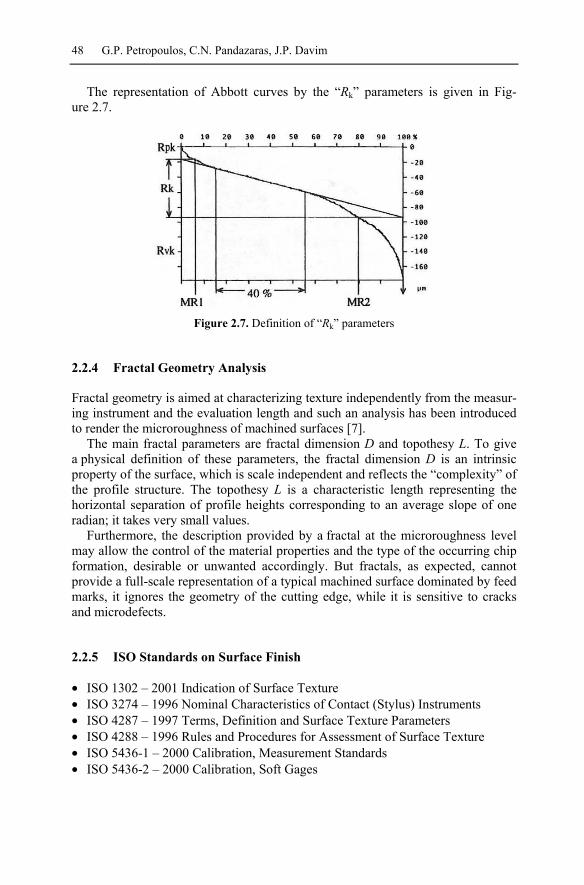
Another function-oriented system of surface analysis was developed in Ger-many (DIN 4776) and is now adopted in ISO 13565-2: 1996 to characterize strati-fied textures like the honed surfaces in internal combustion engine cylinders [6]. It is met many times in the technical literature as the “Rk” parameter group (Rk is the first out of five parameters used). The concept is to describe the shape of the rele-vant bearing (material ratio or Abbott) curves and to provide information on char-acteristics at different portions of the surface profiles.
In Tables 2.3 and 2.4 the parameters proposed by the two aforementioned stan-dards are listed.
Table 2.3. The motif (R & W) parameters
Parameter Description
R Average depth of roughness motifs
Rx Maximum depth of roughness motifs
Ar Average spacing of roughness motifs
W Average depth of waviness motifs
Wx Maximum depth of waviness motifs
Wte Maximum depth of the waviness profile
Aw Average spacing of waviness motifs
Kr Average slope of roughness motifs
Kw Average slope of waviness motifs
Pt Maximum depth of the raw profile
Table 2.4. The “Rk” family of parameters
Parameter Description
Rk Depth of the roughness core profile
Rpk Top portion of the surface to be worn away
Rvk Lowest part of the surface retaining the lubricant
MR1 Upper limit of the core roughness
MR2 Lowest limit of the core roughness
48 G.P. Petropoulos, C.N. Pandazaras, J.P. Davim
The representation of Abbott curves by the “Rk” parameters is given in Fig-ure 2.7.
Figure 2.7. Definition of “Rk” parameters
2.2.4 Fractal Geometry Analysis
Fractal geometry is aimed at characterizing texture independently from the measur-ing instrument and the evaluation length and such an analysis has been introduced to render the microroughness of machined surfaces [7].
The main fractal parameters are fractal dimension D and topothesy L. To give a physical definition of these parameters, the fractal dimension D is an intrinsic property of the surface, which is scale independent and reflects the “complexity” of the profile structure. The topothesy L is a characteristic length representing the horizontal separation of profile heights corresponding to an average slope of one radian; it takes very small values.
Furthermore, the description provided by a fractal at the microroughness level may allow the control of the material properties and the type of the occurring chip formation, desirable or unwanted accordingly. But fractals, as expected, cannot provide a full-scale representation of a typical machined surface dominated by feed marks, it ignores the geometry of the cutting edge, while it is sensitive to cracks and microdefects.
2.2.5 ISO Standards on Surface Finish
• ISO 1302 – 2001 Indication of Surface Texture • ISO 3274 – 1996 Nominal Characteristics of Contact (Stylus) Instruments • ISO 4287 – 1997 Terms, Definition and Surface Texture Parameters • ISO 4288 – 1996 Rules and Procedures for Assessment of Surface Texture • ISO 5436-1 – 2000 Calibration, Measurement Standards • ISO 5436-2 – 2000 Calibration, Soft Gages

2 Surface Texture Characterization and Evaluation Related to Machining 49
• ISO 8785 – 1999 Surface Imperfections – Terms, Definitions and Parameters • ISO 11562 – 1996 Metrological Characteristics of Phase Correct Filters • ISO 12179 – 2000 Calibration of Contact (Stylus) Instruments • ISO 12085 – 1996 Surface Roughness and Waviness – Motif Method • ISO 13565-2 – 1996; Geometrical Product Specifications (GPS) − Surface tex-
ture: Profile method; Surfaces having stratified functional properties − Part 2: Height Characterization using the linear material ratio curve.
2.3 Shape Characterization of Surface Roughness Profiles
High functional requirements nowadays imply the control of profile shapes every manufacturing process imparts on the surface. Characteristics like periodicity or randomness, “emptiness” or “fullness” of the profile play an important role.
The following parameters, parameter ratios and functions are proposed and/or established to be sensitive in profile form [8]. They will be briefly discussed in view of their distinctive power and tribological significance.
Arithmetic Amplitude Parameters
These parameters cannot be considered alone, as they do not give information about the shape of the profile. Some combined ratios have been proposed though, as follows:
a) Ra/Rq: for the extreme theoretical cases of a sinusoidal and a random profile conforming to the Gaussian distribution this ratio takes the values 0.9003 and 0.7979, respectively; this ratio is simply indicative.
b) Rp/Rt: provides only general information on the “emptiness” or “fullness” of the surface, and is related to skewness of the profile height distribution
c) K: is called the solidity surface ratio, which is defined as K = (Rt − Rp)/Rt and is associated with skewness.
Spacing parameters
a) Rsm: a characteristic magnitude in periodic profiles (e.g., turning, milling), where it corresponds to the feed rate value employed.
b) λa: gives relevant information with Sm. It can be used as a general measure of the mean distance of asperities on random profiles.
c) n(0): detects existing periodicity of the profile without providing further infor-mation.
d) m: is correlated with n(0) and directly to the machining process.
All three aforementioned parameters describe the number of microcontacts from the tribological standpoint.

50 G.P. Petropoulos, C.N. Pandazaras, J.P. Davim
Hybrid Parameters
a) RΔa: is possible to characterize the machining process and is affected by the machining conditions, but does not determine the profile shape sufficiently.
b) r: is affected to a similar degree by the machining process, but does not describe particular profile features.
c) Rlr: the developed profile length to evaluation length ratio is connected to the profile openness and controls the corrosion resistance; by definition, it is pro-portional to RΔa.
All these parameters, however, may describe indirectly the shape of the profile peaks.
Statistical Parameters
a) Profile height distribution The form of this statistical function is very important as it is sensitive to the geo-metric features of the surface and to their variation. Multiparameter statistical sys-tems like log-normal, beta, and Fisher–Pearson are used to model a variety of pro-file shapes and could contribute to any acceptable typology of machined surfaces. Apart from the shape of the distribution, the corresponding statistical moments are evaluated:
The standard deviation σ is equal to the Rq parameter. The third- and fourth-order moments – skewness and kurtosis – express geometric and physical features of the surface, respectively. The skewness controls the amount of existing material in the surface against voids. Kurtosis defines the sharpness of the peaks of the asperities. Low kurtosis values correspond to broad tips, whereas the opposite characterizes sharp “hills”.
b) Bearing area or Abbott curve This is equivalent to the cumulative probability of the profile heights and is di-rectly related to the surface tribological behavior, and particularly, with the real contact area, asperities strength, and wear. The bearing area curve has been widely used in recent studies, and with the introduction of a relatively new standard, it can easily distinguish between random and periodic profiles and give functional de-scriptions by the “Rk” parameters (ISO 13565-2: 1997).
c) Autocorrelation function and autospectrum • The profile autocorrelation function permits the qualitative discrimination of
periodic and random components. The first attempt made towards surface typol-ogy.
• by Peklenik [19] defined five different autocorrelation forms, with the extreme cases corresponding to sinusoidal band white noise, respectively.
• The autocorrelation length β* denotes the minimal distance between profile characteristics of different origin.
• The spectral density function, or autospectrum, enables the quantitative assess-ment of the various profile components, periodic and random, and is the Fourier transform of the autocorrelation function. Strongly periodic profiles, for in-stance, are characterized by the fundamental component (at the feed value), fol-lowed by a series of higher harmonics.
2 Surface Texture Characterization and Evaluation Related to Machining 51
2.3.1 Functional Significance of Parameters
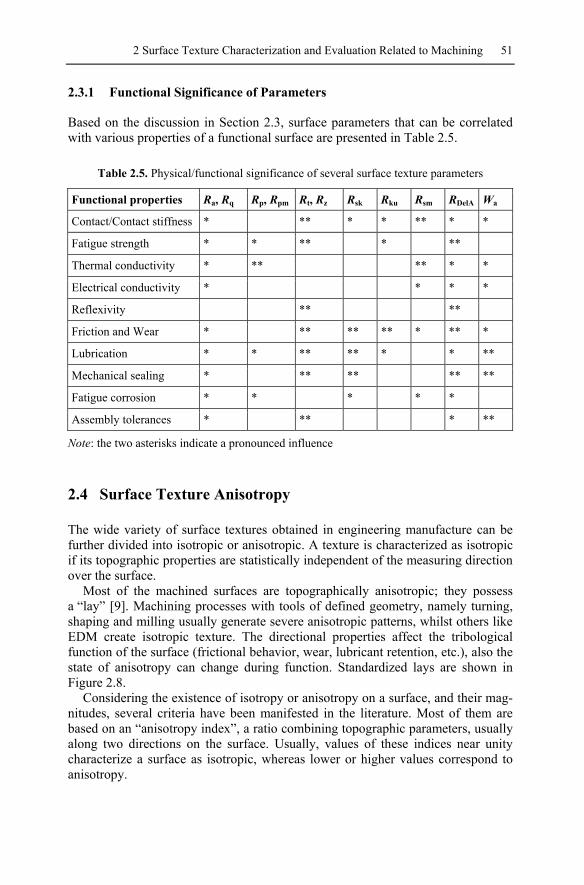
Based on the discussion in Section 2.3, surface parameters that can be correlated with various properties of a functional surface are presented in Table 2.5.
Table 2.5. Physical/functional significance of several surface texture parameters
Functional properties Ra, Rq Rp, Rpm Rt, Rz Rsk Rku Rsm RDelA Wa
Contact/Contact stiffness * ** * * ** * *
Fatigue strength * * ** * **
Thermal conductivity * ** ** * *
Electrical conductivity * * * *
Reflexivity ** **
Friction and Wear * ** ** ** * ** *
Lubrication * * ** ** * * **
Mechanical sealing * ** ** ** **
Fatigue corrosion * * * * *
Assembly tolerances * ** * **
Note: the two asterisks indicate a pronounced influence
2.4 Surface Texture Anisotropy
The wide variety of surface textures obtained in engineering manufacture can be further divided into isotropic or anisotropic. A texture is characterized as isotropic if its topographic properties are statistically independent of the measuring direction over the surface.
Most of the machined surfaces are topographically anisotropic; they possess a “lay” [9]. Machining processes with tools of defined geometry, namely turning, shaping and milling usually generate severe anisotropic patterns, whilst others like EDM create isotropic texture. The directional properties affect the tribological function of the surface (frictional behavior, wear, lubricant retention, etc.), also the state of anisotropy can change during function. Standardized lays are shown in Figure 2.8.
Considering the existence of isotropy or anisotropy on a surface, and their mag-nitudes, several criteria have been manifested in the literature. Most of them are based on an “anisotropy index”, a ratio combining topographic parameters, usually along two directions on the surface. Usually, values of these indices near unity characterize a surface as isotropic, whereas lower or higher values correspond to anisotropy.

52 G.P. Petropoulos, C.N. Pandazaras, J.P. Davim
TYPE LAY SYMBOL
Parallel =
Perpendicular
Crossed X
Multidirectional M
Particulate P
Circular C
Radial R
Figure 2.8. Different kinds of lay and associated symbols [9]
Some of the existing methods for evaluating surface texture anisotropy in view of the literature are:
a) The ratio γ of the autocorrelation lengths of two representative profiles along the
principal axes of the surface, called the anisotropy index xx
yy
5.0
5.0
λλ
γ =
b) The ratio of the unfiltered or raw profile of the minimum and maximum RMS
slope values over the profile qxx
qyy
ΔΔ
=γ .
c) The long crestedness 0220
21102202
mmmmm
+−
=Λ considers seven independent combi-
nations of moments of the surface power spectral density function. d) Fractal dimension and topothesy appear sensitive to the existence of anisotropy . e) A parameter Str defined as the ratio between the axes of an ellipse fitted to
a “rose plot” of Hurst coefficients can characterize anisotropy.
2 Surface Texture Characterization and Evaluation Related to Machining 53
New suggestions for full-scale and morphological evaluation of surface anisot-ropy are, as follows:
The waviness component of the surface texture has to be considered in critical and high-precision applications, as well as in highly anisotropic textures, where the waviness shows the same directional variations with roughness (not necessarily with the same trend) and an integral texture anisotropy index could be proposed.
Abbott curves would offer a measure of anisotropy via corresponding parame-ters, standardized (ISO 13565-2: 1996) or not.
2.5 Association of Roughness Parameters with Machining Conditions
2.5.1 Theoretical Formulae
Τheoretical or kinematic roughness: it is the lowest roughness possible that can be achieved for any machining process performed and given machining factors.
Theoretical roughness values can be determined analytically depending on the process kinematics and tool geometry [10].
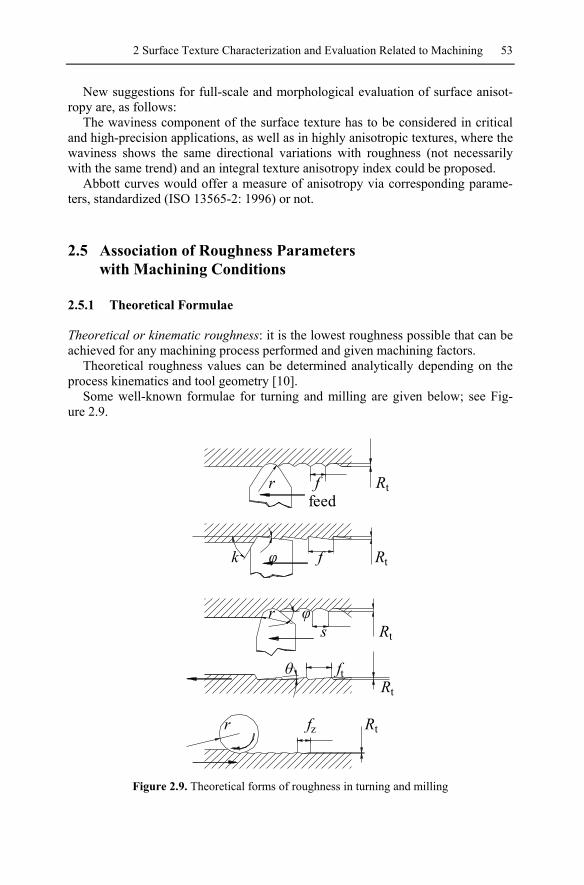
Some well-known formulae for turning and milling are given below; see Fig-ure 2.9.
Figure 2.9. Theoretical forms of roughness in turning and milling
54 G.P. Petropoulos, C.N. Pandazaras, J.P. Davim
Turning
The maximum roughness value Rt is expressed as
a) 2
t18
fRr
= [mm], (2.1)
for a rounded tool tip with radius r in mm and feed f in mm/rev
b) t cot cotfR
κ ϕ=
+ [mm], (2.2)
for a perfectly sharp tool; κ and φ are edge angles with regard to feed
c) 2 3t tan tan 2 tan
2rR f f rϕ ϕ ϕ⋅ + − ⋅ ⋅ ⋅ [mm], (2.3)
where 2 tanf r ϕ≥ ⋅ ⋅ . The average roughness height Ra for the (a) and (b) cases is given accordingly
by
Ra = 0.0321 ⋅2f
r [mm] (2.4)
atan
4 (1 tan )fR ϕ
ϕ⋅=
⋅ + [mm]. (2.5)
Face milling
The maximum roughness height is approximated by
t tanzR f ϑ [mm], (2.6)
where fz is feed per tooth [mm/tooth] and θ is the tooth cut-off angle.
Peripheral (up) milling
The Rt and Ra parameters are calculated by
2
t18
zfRr
[mm] (2.7)
2
a 0.0321 zfRr
= ⋅ [mm], (2.8)
where r is the cutter radius in mm.

2 Surface Texture Characterization and Evaluation Related to Machining 55
2.5.2 Actual Surface Roughness
As established by experimental tests, the actual roughness values obtained are usually much higher than the theoretical ones. A decisive factor for the generation of the actual or natural roughness in cutting operations is the chip-formation mode (built-up-edge, discontinuous chip, thermal variations, shear zone expansion to workpiece subsurface, etc.) [11, 12]. Furthermore, other causes may be: chatter in the machine tool system, processed material defects, cutting-tool wear, irregulari-ties in the feed mechanism, eccentric motion of rotating parts and others.
It is evident that actual roughness constitutes a complex problem in machining and it depends on the machining method, as well as the machining factors em-ployed each time. The following factors have significant impact in cutting proc-esses:
• cutting conditions (feed, cutting speed, depth of cut); • process kinematics; • cutting tool form and material; • mechanical properties of the processed material; • vibrations in the machine-tool system; • precision-rigidity- working and service condition of the machine tool.
2.5.3 Experimental Trends of Roughness Against Machining Conditions
There is a plenty of data, in articles and project reports, in the literature on actual roughness for every machining process and a wide range of machining parameters.
In cases where it was possible, empirical predictive empirical models for the impact of various machining factors on roughness parameters were developed, exhibiting a varied degree of correlation. Also, data-mining techniques and artifi-cial intelligence methods (genetic algorithms, artificial neural networks) were em-ployed for this purpose [13].
A survey of such models is out of the scope of this section and in the following established experimental trends will be presented for typical conventional and non-conventional machining processes [14, 15]. The relevant diagrams describe quali-tatively the association of Ra with machining conditions.
Turning
Feed exerts the major influence on roughness exhibiting an increasing trend; it is evident that the lowest feed values give an inferior finish because of the very small chip thickness leading to poor surface formation. At very low and low cutting speeds roughness is deteriorated due to discontinuous chip and built-up-edge for-mation, respectively. The depth of cut implies a slight increase in roughness and is not shown; this is true for stable (chatter-free) cutting.

56 G.P. Petropoulos, C.N. Pandazaras, J.P. Davim
feed
Ra
cutting speed
Ra
(a) (b) Figure 2.10. Surface roughness Ra against cutting conditions in turning: (a) feed rate, and (b) cutting speed
Electrodischarge Machining (EDM)
Roughness in EDM increases, when both controlling parameters increase. As pulse current increases, discharges strike the surface more intensely, and the more pro-nounced erosion affect roughness. If pulse-on time increases, the amount of heat energy transferred increases and surface roughness is affected negatively by more material melting.
pulse current
Ra
pulse on time
Ra
(a) (b) Figure 2.11. Surface roughness Ra against cutting conditions in EDM: (a) pulse current, and (b) pulse on time
Abrasive Waterjet Machining (AWM)
An increase in stand-off distance implies an increase in surface roughness; this can be attributed to waterjet divergence with regard to stand-off distance, resulting in deteriorated roughness. Increased water pressure up to 300 MPa leads to better surface finish. Traverse speed causes a slight increase in roughness, as the cuts become wider and fewer abrasive particles act on the surface.

2 Surface Texture Characterization and Evaluation Related to Machining 57
stand off distance
Ra
water pressure
Ra
(a) (b)
traverse speed
Ra
(c) Figure 2.12. Surface roughness Ra against cutting conditions in AWM: (a) stand-off dis-tance, (b) water pressure, and (c) traverse speed
2.5.3.1 Case Study (Influence of Cutting Conditions on the Surface Roughness Obtained by Turning) [16]
Surface finish is an important outcome in manufacturing engineering, as stressed many times in the foregoing. It is a characteristic that affects directly the perform-ance of mechanical components and the production costs. Due to these facts, re-search developments have been carried out with the objective of optimizing the cutting conditions, to obtain a determined surface finish.
This study presents the influence of cutting conditions (cutting speed, feed and depth of cut − DOC) on the surface finish obtained by turning. It should be borne in mind that turning is regarded as a reference cutting process due to its relatively simple geometry and kinematics, and machinability data obtained in turning is of crucial importance.
In order to achieve the goal of this study, mainly the establishment of a correla-tion between cutting conditions and surface roughness, turning tests were effected with different cutting conditions, aiming at simulating them for finishing.
The material used in the tests of controlled turning was the free machining steel, 12L 13 (AISI). Cemented carbide inserts of TPUN 160308 P10 (ISO) type with a nose radius of 0.8 mm were used.
The measurements were undertaken over the turned surfaces using a profilome-ter and the surface optical examination was made by a scanning electron micro-scope (SEM).

58 G.P. Petropoulos, C.N. Pandazaras, J.P. Davim
Feed
In cylindrical turning, as in other cutting operations, the tool leaves a spiral profile (feed marks) on the machined surface. Figure 2.13 shows the influence of feed on surface roughness. If different feeds are compared possessing the same nose radius, the larger feed increases the separation between feed marks, leading to an increase in the value of the geometric theoretical surface roughness. The surface roughness increases with the feed according to the geometric theoretical model (Equation 2.1).
Figure 2.13. Surface roughness profiles for Vc = 283 m/min and DOC = 0.5 mm: (a) f = 0.10 mm/rev, (b) f = 0.16 mm/rev, and (c) f = 0.25 mm/rev
2 Surface Texture Characterization and Evaluation Related to Machining 59
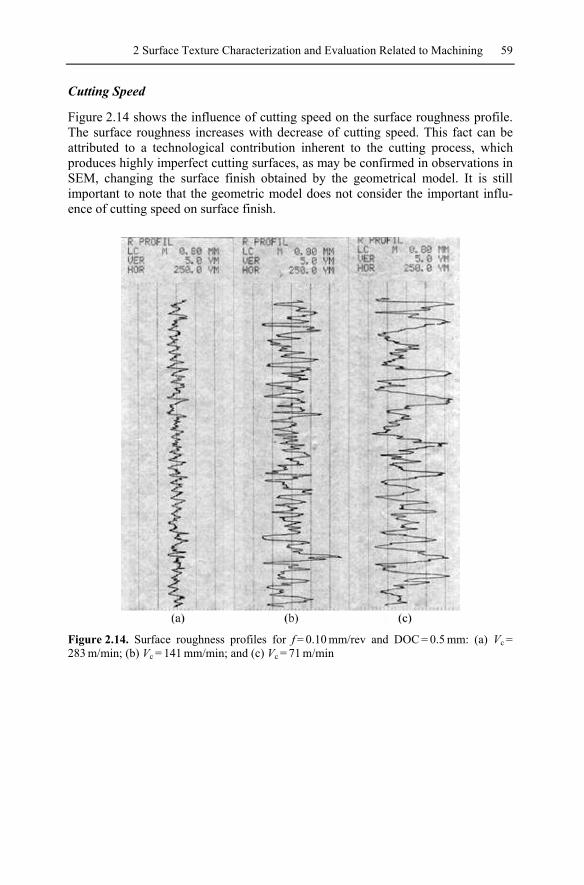
Cutting Speed
Figure 2.14 shows the influence of cutting speed on the surface roughness profile. The surface roughness increases with decrease of cutting speed. This fact can be attributed to a technological contribution inherent to the cutting process, which produces highly imperfect cutting surfaces, as may be confirmed in observations in SEM, changing the surface finish obtained by the geometrical model. It is still important to note that the geometric model does not consider the important influ-ence of cutting speed on surface finish.
Figure 2.14. Surface roughness profiles for f = 0.10 mm/rev and DOC = 0.5 mm: (a) Vc = 283 m/min; (b) Vc = 141 mm/min; and (c) Vc = 71 m/min

60 G.P. Petropoulos, C.N. Pandazaras, J.P. Davim
Depth of Cut Figure 2.15 shows the effect of DOC on the surface roughness profile. In the range of finishing the increase of DOC has no significant influence on the surface rough-ness.
Figure 2.15. Surface roughness profiles for Vc = 283 m/min and DOC = 0.5 mm: (a) f = 0.10 mm/rev; (b) f=0.16 mm/rev; and (c) f=0.25 mm/rev
SEM Examination Figures 2.16 and 2.17 present surfaces produced on steel by cutting with regard to feed, as observed with a SEM, for cutting speeds of 283 and 71 m/min, respectively. When cutting steel at low cutting speeds (Figure 2.17) an irregular type of rough-ness is frequently observed due to subsurface fracture and plastic deformation. Above a certain value of cutting speed these sources of roughness disappear. Fac-tors influencing surface roughness at low cutting speeds are surface plastic defor-mation, tearing, cracking, etc., mainly due to built-up-edge formation.
The feed exerts the main influence on the surface finish obtained as rendered by the geometric theoretical model. The cutting speed is the cutting condition that has a great influence on the roughness right after the feed because of the technological contribution inherent to the cutting process; it becomes dominant in the presence of a built-up edge. Finally, the depth of cut has no significant influence on roughness in finishing operations.

2 Surface Texture Characterization and Evaluation Related to Machining 61
Figure 2.16. Surfaces produced on steel by turning, as observed with a SEM, Vc = 283 m/min and DOC = 0.50 mm: (a) f = 0.10 mm/rev; (b) f = 0.16 mm/rev; and (c) f = 0.25 mm/rev
Figure 2.17. Surfaces produced on steel by turning, as observed with a SEM, Vc = 71 m/min and DOC = 0.50 mm: (a) f = 0.10 mm/rev; (b) f = 0.16 mm/rev; and (c) f = 0.25 mm/rev

62 G.P. Petropoulos, C.N. Pandazaras, J.P. Davim
2.5.3.2 Subsets of Roughness Parameters
Contemporary research studies are oriented towards reduction of roughness pa-rameters in appropriate subsets, where every parameter introduced would corre-spond to different surface characteristics [17]. Such a goal will facilitate the ex-change of scientific information on surface roughness prediction and quality control in research and industry.
Concerning turning operations, as turning is a reference cutting process, ampli-tude roughness parameters are associated with feed rate and cutting speed but other statistical or hybrid parameters do not correlate with cutting conditions over their whole practical range. Parameters that are uncorrelated to cutting conditions, as well as with other parameters, can make up a desirable subset because each single parameter is considered to quantify different characteristics of the surface.
Regarding the whole spectrum of the cutting conditions employed, a minimum concise set of parameters for basic research should be Ra, Rsk, Rku, RDelQ and Rlo [18].
2.5.4 Range of Roughness – Cutting Processes
Surface roughness obtained by different cutting processes varies due to different process kinematics, different chip-formation modes, different tool geometry, dif-ferent tool-wear modes, cutting fluid. In this way, amplitude parameters like Ra take significantly higher or lower values, when cutting the same material by differ-ent methods. In Table 2.6 ranges of achieved Ra values according to the usual cut-ting methods are presented.
Table 2.6. Ra values obtained by different machining processes
Turning (roughing)
Sawing (chipping)
Grinding (roughing)
DrillingMilling
ReamingPlunge grindingCylindrical grindingGear Cutting (Hobbing, Fellows)
Diamond turningPrecision grindingHoningLappingSupergrinding
5 0 2 5 1 2 . 5 6 . 2 5 3 . 1 1 . 6 0 . 8 0 . 4 0 . 2 0 . 1 (mm)0.05
Boring
Usual average of RaTotal range of Ra

2 Surface Texture Characterization and Evaluation Related to Machining 63
2.6 Correlation of Surface Roughness and Dimensional Tolerances
The existence of surface roughness produces an amount of uncertainty in the meas-urement of workpiece dimensions. In this regard, the variation of dimension in-duced due to roughness, should conform to the corresponding tolerance field [19].
Predictive mathematical models for relating roughness to tolerances have not been developed in view of the literature and the following data is obtained from standards to serve as a guide in practice.
Recommended relationships between the maximum roughness height Rt and the tolerance field of a nominal dimension T are, as follows:
• Rt = 0.25 T for rough surfaces; • Rt = 0.125 T for finished surfaces.
In the Italian surface roughness standard UNI 3963 dimensional tolerances are related to roughness, as presented in Table 2.7.
ISO 286 implements 20 grades of accuracy to satisfy the requirements of differ-ent industries. (IT01, IT0, IT1, IT2, IT3, IT4, IT5, IT6). Production of gauges and instruments;. (IT5, IT6, IT7, IT8, I9, IT10, IT11, IT12). Precision and general In-dustry; (IT11, IT14, IT15, IT16) Semi-finished products; (IT16, IT17, IT18) Struc-tural engineering.
Table 2.7. Maximum allowable Ra values in regard to nominal dimensions and their as-signed tolerances according to ISO 286
Dimensional range
≤3 >3≤18 >8≤80 >80 ≤250 >250 Tolerance according to ISO
T (μm)
Ra (μm)
T (μm)
Ra (μm)
T (μm)
Ra (μm)
T (μm)
Ra (μm)
T (μm)
Ra (μm)
IT6 6 0.2 8−11 0.3 13−19 0.5 22−29 0.8 32−40 1.2
IT7 10 0.3 12−18 0.5 21−30 0.8 35−46 1.2 52−63 2
IT8 14 0.5 18−27 0.8 33−46 1.2 54−72 2 81−97 3
IT9 25 0.8 30−43 1.2 52−74 2 87−115 3 130−155 5
IT10 40 1.2 48−70 2 84−120 3 140−185 5 210−250 8
IT11 60 2 75−110 3 130−190 5 220−290 8 320−400 12
IT12 100 3 120−180 5 210−300 8 350−460 12 520−630 20
IT13 140 5 180−270 8 330−460 12 540−720 20 810−970 –
IT14 250 8 300−430 12 520−740 20 870−1150 - 1300−1550 –

64 G.P. Petropoulos, C.N. Pandazaras, J.P. Davim
2.7 Surface Typology
The main goal of the numerous roughness parameters should be a proper texture shape classification with the aid of statistical or random process analysis, which has been called the typology of surfaces. This had gained much attention in the late 1960s and the 1970s especially in the research works of Peklenik [20] and White-house [21], proposing the autocorrelation function and the beta statistical model, respectively, as means for the desired typology and a big relevant project carried out by the CIRP [22], where a great number of machining operations and rough-ness parameters, was evaluated.
Unfortunately, no agreement has been reached and this subject remains a long standing problem unsolved if not too ambitious up to now. Probably, this happens due to the very high demands nowadays for the components functionality, which led to the proliferation of the parameters proposed and standardized in order to describe almost every aspect of texture.
However, contemporary evolutions like 3D profilometry and different mathe-matical approaches like fractal and Markov analysis give the opportunity of intro-ducing new functionally oriented parameters that could be more successful for this task; but it is too early to appreciate their effectiveness.
In conjunction with these developments, an exhaustive investigation must be carried out into the particular surface texture characteristics every individual ma-chining process creates, taking into account apart from the workpiece material, the different kinematic modes it possesses and covering a wide range of cutting factors employed in practice.
2.7.1 Typology Charts
An effort on expanding these approaches was made with more data, systematically obtained in view of correlating turned profiles of different shapes with the cutting conditions applied [8].
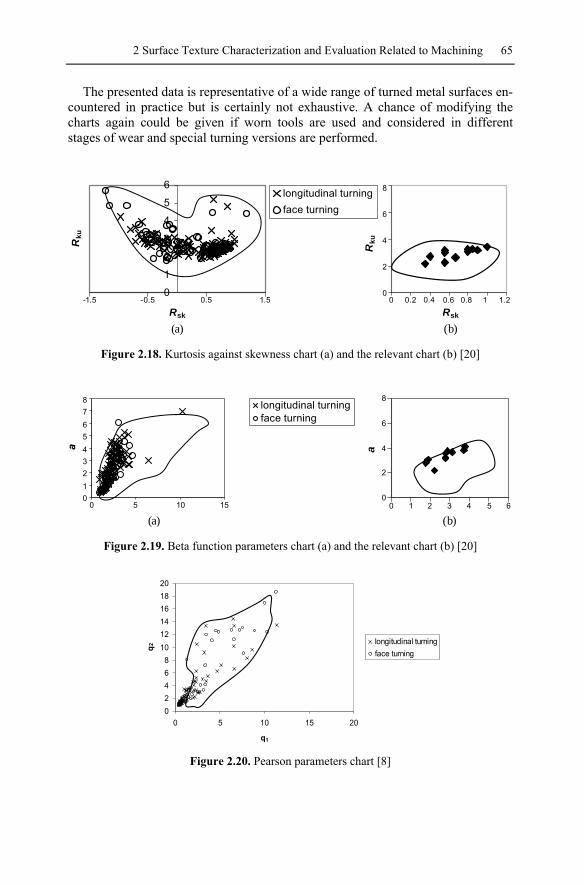
The corresponding results are interpreted in the form of charts compared with the relevant “classical” charts. In Figure 2.18 the kurtosis and skewness of the meas-ured surfaces are shown. A cluster of points appears, as kurtosis and skewness are not interrelated but can fix the boundaries of surface textures in view of the shape for a wide range of cutting conditions employed. The area of high concentration of values located at the lower-right side of the diagram corresponds to regular chip formation.
A chart comprising the parameters of the beta statistical function is illustrated in Figure 2.19. The values are less scattered now and compared to the Whitehouse beta function typology (Figure 2.19(b)) the range is wider due to the fact explained before.
An approach through the Fisher−Pearson parameters is proposed and the corre-sponding chart is shown in Figure 2.20. It has a resemblance to the beta function, as expected, but it may distinguish more explicitly between different texture shapes [13]; so it could be considered as a satisfactory method towards the desired process identification.
2 Surface Texture Characterization and Evaluation Related to Machining 65
The presented data is representative of a wide range of turned metal surfaces en-countered in practice but is certainly not exhaustive. A chance of modifying the charts again could be given if worn tools are used and considered in different stages of wear and special turning versions are performed.
0
2
4
6
8
Rsk
Rku
0
1
2
3
4
5
6
Rsk
Rku
longitudinal turningface turning
01.50.5-0.5-1.5 0.2 0.4 0.6 0.8 1 1.2
(a) (b) Figure 2.18. Kurtosis against skewness chart (a) and the relevant chart (b) [20]
longitudinal turningface turning
a
0
2
4
6
8
0 1 2 3 4 5012345678
0 5 10 15
(a) (b) Figure 2.19. Beta function parameters chart (a) and the relevant chart (b) [20]
Figure 2.20. Pearson parameters chart [8]
02468
101214161820
0 5 10 15 20
q1
q2
longitudinal turningface turning

66 G.P. Petropoulos, C.N. Pandazaras, J.P. Davim
References
[1] Dagnall Η. (1996) Exploring Surface Texture, Taylor Hobson Publishing Ltd, Leices-ter
[2] Whitehouse D (1996) Handbook of Surface Metrology, Institute of Physics Publishing for Rank Taylor-Hobson Co., Bristol
[3] Humienny Z. (ed.) (2001) Geometrical Product Specifications, Chapter 16: “Rough-ness, Waviness and Primary Profile” by L. Blunt and X. Jiang, Warsaw University Printing House, Warsaw
[4] MacDonald B.C. and Co Basic Components & Elements of Surface Topography http://www.bcmac.com/PDF_files/Surface%20Finish%20101.pdf
[5] Dietzsch M., Papenfluss K, Hartmann, T. (1998) The MOTIF-method (ISO 12085) – A suitable description for functional, manufactural and metrological requirements, In-ternational Journal of Machine Tools and Manufacture, 38, No 5–6, 625–632
[6] King T G, Houghton N E (1995) Describing distribution shape: RK and central mo-ment approaches compared, International Journal of Machine Tools and Manufacture, 35/2, 247–252
[7] Hasegawa M, Liu, J, Okuda K, Nunobiki M (1996) Calculation of the fractal dimen-sions of machined surface profiles, Wear, 192, 40–45
[8] Petropoulos G P Pandazaras C N, Vaxevanidis N M, Antoniadis A (2006) Multi-para-meter identification and control of turned surface textures, Ιnternational Journal of Advanced Manufacturing Technology, 29, No. 1 & 2, 118–128
[9] Thomas T R, Rosen B-G, Amini N, (1999) Fractal characterization of the anisotropy of rough surfaces, Wear, 232, 41–50
[10] Boothroyd G (1975) Fundamentals of Metal Machining and Machine Tools, Scripta Book Company, Washington. DC
[11] Armarego E J A, Brown R H (1969) The Machining of Metals, Prentice-Hall, New Jersey
[12] Petropoulos P G (1973) The effect of feed rate and of tool nose radius on the rough-ness of oblique finish turned surfaces, Wear, 23, 299–310
[13] Benardos P G, Vosniakos G-C (2003) Predicting surface roughness in machining: a review, International Journal of Machine Tools & Manufacture, 43, 833–844
[14] Gosh A, Mallik A K (1995) Manufacturing Science, East West Press, New Delhi [15] Kruszynski B, van Luttervelt K A (1989) The influence of manufacturing processes
on surface properties, Advanced Manufacturing Engineering, 1, 187–202 [16] Davim J.P. (1991) Influência das condições de corte na microgeometria das super-
fícies obtidas por torneamento, MSc thesis, University of Porto, Porto (in portuguese) [17] Nowicki B (1985) Multi-parameter representation of surface roughness, Wear, 102,
161–176 [18] Petropoulos G, Pandazaras C, Vaxevanidis N, Ntziantzias I, Korlos A, (2007) Select-
ing subsets of mutually uncorrelated surface roughness parameters in turning, Interna-tional Journal of Computational Materials Science and Surface Engineering, 1, Nr. 1, 114–128
[19] S. Kalpakjian (2006) Manufacturing Engineering and Technology, 5th edn, Addison-Wesley Publishing Company.
[20] Peklenik J (1967) Investigation of the surface typology, Annals of the CIRP, Vol. 15 [21] Whitehouse D J (1978) Beta functions for surface typologie?, Annals of the CIRP, 27,
No. 1, 539–553 [22] Peters J, Vanherck P, Sastrodinoto M. (1979) Assessment of surface typology analysis
techniques, Annals of the CIRP, 28, No. 25, 39–553