Security Markets Objectives Primary market Secondary Market.

www.nseindia.com
Primary Market ISMR21
2. Primary Market
IntroductionThe primary market is an important part of capital market, which deals with issuance of new securities. It enables corporates, public sector institutions as well as the government to raise resources (through issuance of debt or equity based securities), to meet their capital requirements. In addition, the primary market also provides an exit opportunity to private equity and venture capitalists by allowing them to off-load their stake to the public.
Initial Public Offer (IPO) is the most common way for firms to raise capital in the primary market. In an IPO, a company or a group floats new securities for subscription by the public. In return, the issuing conglomerate receives cash proceeds from the sale, which are then used to fund operations or expand the business. It is only after an IPO that a security becomes available for trading in the secondary market of the stock exchange platform. The price at which the securities are issued is decided through the book building mechanism; in the case of oversubscription, the shares are allotted on a pro-rata basis. When securities are offered exclusively to the existing shareholders of a company, as opposed to the general public, it is known as the Rights Issue. Another mechanism whereby a listed company can issue equity shares (as well as fully and partially convertible debentures, which can later be converted into equity shares), to a Qualified Institutional Buyer (QIB) is termed as Qualified Institutional Placement. In addition to domestic market, companies can also raise capital in the international market through the issuance of American Depository Receipts (ADRs), Global Depository Receipts (GDRs) and also by way of External Commercial Borrowings (ECBs).
The securities can be issued and capital raised either through public issues or through private placement (which involves issuance of securities to a relatively small number of select investors). Table 2-1 provides statistics on the resources mobilized by corporates and the government from domestic as well as international markets. It can be noted from the table that, total resources mobilized through issuance of securities by corporates and the government in 2013–14 increased by 7.4 percent to ` 13,004 billion (USD 217 billion).

www.nseindia.com
Primary MarketISMR 22
Table 2-1: Resource Mobilisation by Government and Corporate Sector
Issues 2011-12 (` bn)
2012-13 (` bn)
2013-14 (` bn)
2011-12 (US $ bn)
2012-13 (US $ bn)
2013-14 (US $ bn)
Corporate Securities 2,336 3,451 4,033 46 63 67 Domestic Issues 2,308 3,441 4,032 45 63 67
Public Issues* 129 139 133 3 3 2
Non-Govt. Public Companies - - - - - -
PSU Bonds - - - - - -
Govt. Companies - - - - - -
Banks & FIs - - - - - - Private Placement 2,180 3,302 3,899 43 61 65 Euro Issues 27 10 1 0.5 0.1 0.02 Government Securities*1 7,590 8,658 8,971 148 159 150 Central Government # 6,004 6,885 7,005 117 126.7 117 State Governments 1,586 1,773 1,967 31 33 33 Total 9,926 12,109 13,004 194 223 217
* This is equity public issue only.*1 These are gross market borrowings of Central and State Governments.# only includes amount raised through dated securities.Source: RBI
Corporate SecuritiesThe resource mobilization by corporates in the primary market, rose by 16.9 percent in 2013-14 to ` 4,033 billion (US $ 67 billion). This expansion was driven by an increase in resources mobilized through private placement route; capital raised through private placement went up by 18.1 percent to ` 3,899 billion (US $ 65 billion). However, resources mobilized through public issues witnessed a drop of 4.4 percent to ̀ 133 billion (US $ 2 billion), accounting for a mere 1 percent of the total resources mobilized domestically.
However, the resources raised by Indian corporates from the international capital market through the issuance of FCCBs, GDRs, and ADRs continued on a downward trajectory (declining by 88 percent in 2013–14, on the back of 63 percent fall in 2012-13), reflecting weak sentiment for the Indian economy. Indian corporates, raised ` 1 billion (US $ 0.02 billion) from international capital markets in 2013-14, as against ` 10 billion (US $ 0.19 billion) in the previous year. This accounted for an insignificant proportion of the total resources mobilized by the government and the corporate sector in 2013-14 (Table 2-1).
Public and Rights IssuesIn 2013-14, resources mobilized from public and rights issue increased unlike that of the previous year. In particular, capital raised from public and rights issue surged by 71.4 percent (on the back of 33 percent decline in 2012-13) to ` 557 billion (US $ 9.3 billion). (Table 2.2)
Total number of public issues (equity and debt) also rose in 2013-14 as opposed to the preceding year; public issues increased from 53 issues in 2012-13 to 75 in 2013-14. In the equities, a total of 38 IPOs were launched during 2013-14, as compared to 33 in 2012-13. However, the total capital raised by way of IPOs declined (despite the increase in number of IPOs) to ` 12 billion in 2013–14 from ` 65 billion in 2012–13. (Table 2.2)
In the debt segment, the number of public issues increased to 35 during 2013-14 as compared to 20 in the previous year. This was accompanied by a massive increase in their amount of mobilized resources (from ` 170 billion in 2012-13 to ` 424 billion in 2013-14).
The mobilization of resources through right issues recorded a drop of 48.3 percent in 2013–2014, following a 276 percent surge witnessed in 2012-13. Resource mobilization through rights issue recorded a decline from ` 89 billion in 2012–13 to ` 46 billion in 2013–14. In 2013-14, the no. of companies using the rights route to raise capital stood at 15 (as against 16 in the previous year).

www.nseindia.com
Primary Market ISMR23
Table 2-2: Resource Mobilisation from Public and Rights Issues
Public and Rights Issues 2012-13 2013-14 Apr - Sep'14
Number Amount(` bn)
Amount(US $ bn)
Number Amount (` bn)
Amount(US $ bn)
Number Amount(` bn)
Amount(US $ bn)
1. Public Issues (i) +(ii) 53 235 4.3 75 511 8.5 37 54 0.9
i. Public Issues 33 65 1.2 40 87 1.5 25 10 0.2
Public Issues (IPO) 33 65 1.2 38 12 0.2 25 10 0.2
Public Issues (FPO) 0 0 0 2 75 1.2 0 0 0
ii. Public Issues (Bond/NCD) 20 170 3.1 35 424 7.1 12 44 0.7
2. Rights Issues 16 89 1.6 15 46 0.8 10 28 0.5
Total (1+2) 69 325 6.0 90 557 9.3 47 82 1.3
Source: SEBI
During 2013-14, the private issuers raised ` 11.7 billion — a fall of 34 percent over the previous year. Further, the public issuers, witnessed a significant increase (197.8 percent) in the amount of resources mobilized (` 440 billion) in 2013-14. (Table 2-3).
Table 2-3: Sector-wise Distribution of Resources Mobilised
Sector 2012-13 2013-14 Apr - Sep'14
Number Amount (` mn) Number Amount (` mn) Number Amount (` mn)
Private 55 176,900 70 116,810 37 43,350
Public 14 147,650 20 439,700 10 39,090
Total 69 324,550 90 556,520 47 82,440
Note:This table includes public issues and rights issuesSource: SEBI
Resource Mobilisation - Industry-wise and Size-wise DistributionThe banking sector contributed the maximum share (53.3 percent) of the total resources mobilized during 2013–14, with 14 issues mobilizing ` 297 billion. However, in the first six months of FY 2015, the finance sector occupied the leading position in the league with ` 44.4 billion, accounting for 53.8 percent of the total resources mobilized in the (Table 2-4).

www.nseindia.com
Primary MarketISMR 24
Table 2-4: Industry-wise Distribution of Resources Mobilised
Industry 2012-13 2013-14 Apr - Sep'14
Number Amount (` mn)
Percentage Share
Number Amount (` mn)
Percentage Share
Number Amount (` mn)
Percentage Share
Banking/FIs 7 24,750 7.6 14 297,000 53.4 4 4,270 5.2
Cement & Construction 1 90 0.0 4 7,310 1.3 1 5,990 7.3
Chemical 1 90 0.0 0 0 0.0 1 80 0.1
Electronics 0 0 0.0 0 0 0.0 1 330 0.4
Engineering 2 740 0.2 5 5,910 1.1 1 5,250 6.4
Entertainment 1 120 0.0 2 6,020 1.1 3 3,060 3.7
Finance 16 165,360 51.0 26 60,580 10.9 13 44,360 53.8
Food Processing 2 190 0.1 0 - 0.0 1 150 0.2
Healthcare 2 2,100 0.6 0 - 0.0 0 0 0.0
Information Technology 1 40 0.0 1 190 0.0 3 1,370 1.7
Paper & Pulp 0 0 0.0 1 280 0.1 0 0 0.0
Power 0 0 0.0 4 117,020 21.0 0 0 0.0
Telecom 1 41,730 12.9 1 50 0.0 0 0 0.0
Textile 4 5,820 1.8 3 140 0.0 1 300 0.0
Others 31 83,520 25.7 29 62,020 11.1 18 17,300 21.0
Total 69 324,550 100.0 90 556,520 100.0 47 82,460 100.0
Source: SEBI
Table 2-5 exhibits the size-wise distribution of public and rights issues in 2013-14. About 99 percent of the resource mobilization was through public issues of issue size above ` 100 crore. In terms of the number of issues, however, there were only 46 issues out of 90 that were above ` 100 crore.
Table 2-5 :- Size wise distribution of Resources Mobilised
Issue Size 2012-13 2013-14 Apr - Sep'14
Number Amount(` mn)
Percentage Share
Number Amount(` mn)
Percentage Share
Number Amount(` mn)
Percentage Share
< ` 5 crore 2 70 0.02 14 410 0.07 10 350 0.42
≥ ` 5 crore & < ` 10 crore 13 790 0.24 17 1,220 0.22 7 540 0.66
≥ ` 10 crore & < ` 50 crore 15 2,970 0.92 10 1,740 0.31 9 1,960 2.38
≥ ` 50 crore & < ` 100 crore 6 4,400 1.36 3 2,210 0.40 1 590 0.72
≥ ` 100 crore 33 316,320 97.46 46 550,930 99.00 20 79,000 95.83
Total 69 324,550 100.00 90 556,510 100.00 47 82,440 100.00
Source: SEBI
www.nseindia.com
Primary Market ISMR25
There were 30 mega issues (` 3,000 million and above) during 2013-14, the largest being the equity FPO issue of Power Grid Corporation of India Ltd (` 69.6 billion), followed by the debt issue of Indian Railways Finance Corporation Ltd (` 40.8 billion). The 30 mega issues mobilized 93.6 percent of the total resources raised.
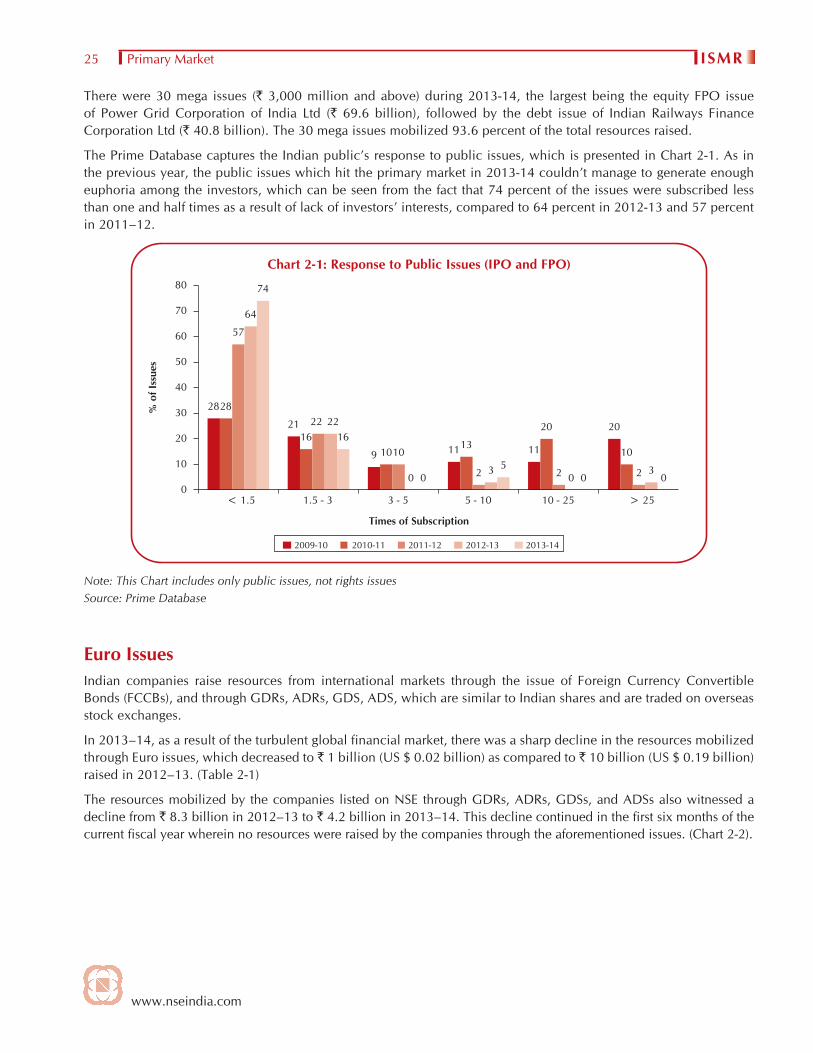
The Prime Database captures the Indian public’s response to public issues, which is presented in Chart 2-1. As in the previous year, the public issues which hit the primary market in 2013-14 couldn’t manage to generate enough euphoria among the investors, which can be seen from the fact that 74 percent of the issues were subscribed less than one and half times as a result of lack of investors’ interests, compared to 64 percent in 2012-13 and 57 percent in 2011–12.
Chart 2-1: Response to Public Issues (IPO and FPO)
Note: This Chart includes only public issues, not rights issuesSource: Prime Database
Euro IssuesIndian companies raise resources from international markets through the issue of Foreign Currency Convertible Bonds (FCCBs), and through GDRs, ADRs, GDS, ADS, which are similar to Indian shares and are traded on overseas stock exchanges.
In 2013–14, as a result of the turbulent global financial market, there was a sharp decline in the resources mobilized through Euro issues, which decreased to ` 1 billion (US $ 0.02 billion) as compared to ` 10 billion (US $ 0.19 billion) raised in 2012–13. (Table 2-1)
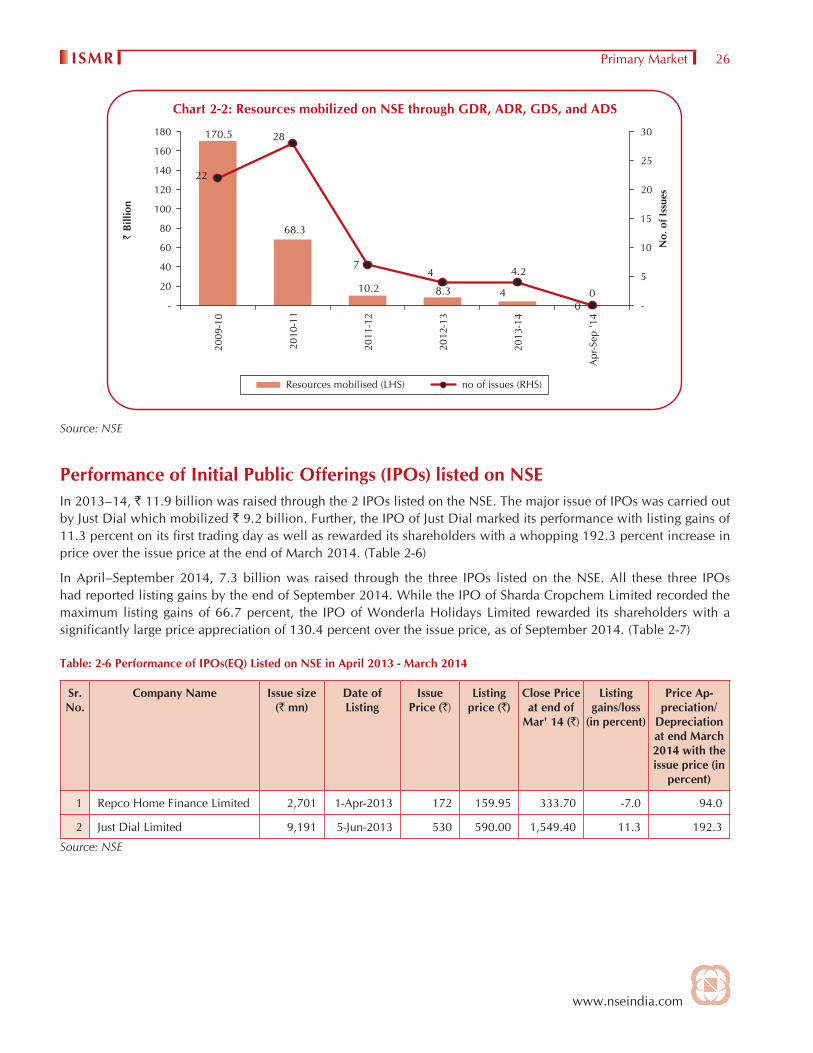
The resources mobilized by the companies listed on NSE through GDRs, ADRs, GDSs, and ADSs also witnessed a decline from ` 8.3 billion in 2012–13 to ` 4.2 billion in 2013–14. This decline continued in the first six months of the current fiscal year wherein no resources were raised by the companies through the aforementioned issues. (Chart 2-2).
www.nseindia.com
Primary MarketISMR 26
Chart 2-2: Resources mobilized on NSE through GDR, ADR, GDS, and ADS
Source: NSE
Performance of Initial Public Offerings (IPOs) listed on NSEIn 2013–14, ` 11.9 billion was raised through the 2 IPOs listed on the NSE. The major issue of IPOs was carried out by Just Dial which mobilized ` 9.2 billion. Further, the IPO of Just Dial marked its performance with listing gains of 11.3 percent on its first trading day as well as rewarded its shareholders with a whopping 192.3 percent increase in price over the issue price at the end of March 2014. (Table 2-6)
In April–September 2014, 7.3 billion was raised through the three IPOs listed on the NSE. All these three IPOs had reported listing gains by the end of September 2014. While the IPO of Sharda Cropchem Limited recorded the maximum listing gains of 66.7 percent, the IPO of Wonderla Holidays Limited rewarded its shareholders with a significantly large price appreciation of 130.4 percent over the issue price, as of September 2014. (Table 2-7)
Table: 2-6 Performance of IPOs(EQ) Listed on NSE in April 2013 - March 2014
Sr. No.
Company Name Issue size (` mn)
Date of Listing
Issue Price (`)
Listing price (`)
Close Price at end of
Mar' 14 (`)
Listing gains/loss
(in percent)
Price Ap-preciation/
Depreciation at end March 2014 with the issue price (in
percent)
1 Repco Home Finance Limited 2,701 1-Apr-2013 172 159.95 333.70 -7.0 94.0
2 Just Dial Limited 9,191 5-Jun-2013 530 590.00 1,549.40 11.3 192.3
Source: NSE

www.nseindia.com
Primary Market ISMR27
Table: 2-7 Performance of IPOs listed on NSE during April 2014 to September 2014
Sr. No.
Company Name Issue size (` mn)
Date of Listing
Issue Price (`)
Listing price (`)
Close Price at end of Sep' 2014
Listing gains (in percent)
Price Appre-ciation/ De-preciation at end Sep' 14 with the issue price (in percent)
1 Wonderla Holidays Limited 1,812 9-May-2014 125 160 288.0 28.0 130.4
2 Sharda Cropchem Limited 3,519 23-Sep-2014 156 260 260.8 66.7 67.2
3 Snowman Logistics Limited 1,974 12-Sep-2014 47 76 88.2 61.7 87.5
Source: NSE
Debt IssuesThe government and the corporate sector collectively raised a total of ` 12,106 billion (US $ 202 billion) from the primary market in 2013–14. Corporates continued their preference to raise capital through private placement as compared to public issues, albeit at a slower pace than the previous year. Resources mobilized through private placement accounted for 22.4 percent of the total capital raised and witnessed a decline of 23 percent over the previous year (Table 2-8).
Table 2-8 Resources Raised from Debt Markets
Issuer (` bn) (US $ bn)
2012-13 2013-14 2012-13 2013-14
Corporate 3,691 3,135 68 52
Public Issues 170 424 3.1 7
Private Placement* 3,521 2,711 65 45
Government 8,658 8,971 159 150
Central 6,885 7,005 127 117
State 1,773 1,967 33 33
Total 12,349 12,106 227 202
* Only debt placements with a tenor and put / call option of 1 year or more.Source: Prime Database (for Private placement) SEBI for Public issues (bonds / NCDs) & RBI Annual Report (for Government debt).
Private Placement of DebtAccording to the Prime Database, a total of 247 issuers (institutional and corporate) raised ` 2,711billion (US $ 46 billion) through 1,475 privately placed issues in 2013–14. The response to most of the issues was good, as 253 out of 1,475 issues—i.e., around 17.2 percent of the total issues—were made by the government sector units, which mobilized 67 percent of the total amount (Table 2-9). During the period April-September 2014, there were 166 issuers who placed 633 issues amounting to ` 1,524 billion (US $ 25 billion). The amount raised through the private placement of debt issues has been on an increasing trend over the past few years barring the year 2013-14 .(Chart

www.nseindia.com
Primary MarketISMR 28
2-3).
Table 2-9 Private Placement - Institutional and Corporate Debt
Year No. of issuers No. of Privately Placed issues
Resource Mobilisation through Private
Placement of Debt(` bn)
Resource Mobilisation through Private
Placement of Debt(US $ bn)
2009-10 193 810 1,897 40
2010-11 186 858 1,990 44
2011-12 170 1,424 2,590 54
2012-13 267 1,833 3,521 65
2013-14 247 1,475 2,711 46
Apr-Sep' 2014 166 633 1,524 25Source: Prime Database
Chart 2-3: Growth of Private Placement of Debt
Source: Prime Database

www.nseindia.com
Primary Market ISMR29
The debt securities were mainly privately placed. Although there were some instances of private placement of equity shares, there was no comprehensive data coverage of these instances. The two sources of information regarding the private placement market in India are the Prime Database and the RBI. The former data set, however, pertains exclusively to debt issues. The RBI data, which is compiled from information gathered from arrangers, covers equity private placements also. The RBI estimates the share of equities in total private placements to be rather insignificant. Some idea, however, can be derived from the equity shares issued by NSE-listed companies on a private placement basis.
A total of 308 NSE listed private placement issues were made during April 2013 to September 2014 (Annexure 2-1)
The issuer wise distribution indicates that during 2013-14, all India financial institutions occupied the top position in issuing debt private placements with a 53.5 percent share, followed by the private sector with 33.1 percent share.
Table 2-10 Issuer wise distribution of private placement of debt
Issuer Issue Amount (` mn )
Issue Amount (US $ mn )
% of Issue Amount
2012-13 2013-14 Apr-Sep' 14 *
2012-13 2013-14 Apr-Sep' 14 *
2012-13 2013-14 Apr-Sep' 14*
All India Financial Institutions/Banks 1,845,855 1,449,263 749,551 33,924 24,273 12,408 52.4 53.5 49.2
State Financial Institutions 53,940 14,821 5,477 988 269 91 1.5 0.5 0.4
Public Sector Undertakings 395,509 312,479 87,620 7,305 5,286 1,445 11.2 11.5 5.7
State Level Undertakings 85,840 36,864 15,016 1,579 617 250 2.4 1.4 1.0
Private Sector 1,140,156 897,824 666,712 20,945 15,182 11,049 32.4 33.1 43.7
Total 3,521,300 2,711,251 1,524,377 64,741 45,626 25,242 100.0 100.0 100.0
* TentativeSource: Prime Database
The sectoral distribution shows that the banking and financial services sector continued to dominate the private placement market, accounting for a combined 71.4 percent in 2013–14, (Table 2-11)
Table 2-11: Sectoral Distribution of Resources Mobilized Private Placement (in percent)
Sector 2011-12 2012-13 2013-14 Apr-Sep' 14
Banking 50.2 39.5 36.3 39.6
Financial Services 27.1 30.1 35.1 31.9
Power 9.2 6.1 7.7 10.2
Housing/ Civil Construction/ Real Estate 1.0 2.8 2.7 3.9
Travel/Transportation 2.7 3.0 0.3 2.3
Others 9.7 18.6 17.8 12.1
Total 100.0 100.0 100.0 100.0
Source: Prime Database
The maturity profile of the issues in the private placement market ranged between 12 months to 600 months in 2013–14. The highest number of placements was for 36 months (1,788 placements) followed by 60 months (229 placements). A total of 58 offers had a put option, while 85 offers had a call option. Rating was, however, required for listing. Of the 1,475 debt private placements deals in 2013–14, 1,471 issues went for credit rating, while 2 were not rated.

www.nseindia.com
Primary MarketISMR 30
Corporate Sector There was a preference for raising resources in the primary market through debt instruments, and the private placement of debt emerged as the major route for raising resources.
In 2013–14, the total resources raised by the corporate sector fell by 14.9 percent to ` 3267.8 billion, compared to the gross mobilization of ` 3845.9 billion in 2012–13. The equity route was used to raise 2.7 percent of the total resources through public equity shares in 2013-14, up from 1.7 percent used in 2012-13. The share of rights issues was 1.4 percent. The resources raised through the debt issues (debt public issues and debt private placements) accounted for 95 percent, which reflects the preference of borrowers for debt capital over equity capital.
Table 2-12: Resources Raised by Corporate Sector
Year Public Equity Issues (` mn)
Rights Issues (` mn)
Debt Public Issues (` mn)
Debt Private
Placements (` mn)
Total Resource
Mobilisation (` mn)
Total Resource
Mobilisation (US $ mn)
Percentage Share in the Total Resource Mobilisation
Public Equity issues
Rights Issue
Debt Public Issues
Debt Private
Placements
2009-10 467,366 83,186 25,000 1,897,299 2,472,851 54,782 18.9 3.4 1.0 76.7
2010-11 486,540 95,030 94,510 1,989,549 2,665,629 59,701 18.3 3.6 3.5 74.6
2011-12 104,820 23,750 356,110 2,589,690 3,074,370 60,097 3.4 0.8 11.6 84.2
2012-13 65,280 89,450 169,820 3,521,300 3,845,850 70,741 1.7 2.3 4.4 91.6
2013-14 86,920 45,760 423,830 2,711,251 3,267,761 54,519 2.7 1.4 13.0 83.0
Apr-Sep'14 10,310 27,950 44,180 1,524,377 1,606,817 26,101 0.6 1.7 2.7 94.9
Notes : Only debt placements with a tenor and put / call option of 1 year or more.Source: Prime Database (for Private placement), SEBI (for Public issues and Right issues)
Going forward, in 2014-15, the primary equity market may improve fueled by strong investment activity and lower volatility in the secondary market. With a view to revive the primary market, SEBI has issued some guidelines related to IPOs and offer-for-sale mechanism, including 25 percent public shareholding norms for public sector undertakings as well as prescribed some rules for Real Estate Investment Trusts (REITs) and Infrastructure Investment Trusts.

www.nseindia.com
Primary Market ISMR31
Contd.
Annexure 2-1-: List of Private Placement issues listed at NSE during the Period April 01, 2013 till September 30, 2014
Sr. No.
Company Name No. of Securities issued
Issue Size (` mn)
Par Value Issue Price (`)
1 Uttam Galva Steels Limited 20,000,000 1600 10.00 80.00
2 Dhanlaxmi Bank Limited 15,023,300 699 10.00 46.50
3 Den Networks Limited 12,466,321 2711 10.00 217.50
4 ING Vysya Bank Limited 14,394,475 8809 10.00 612.00
5 Dhanlaxmi Bank Limited 17,575,000 672 10.00 38.25
6 Hinduja Foundries Limited 26,105,417 809 10.00 31.00
7 State Bank Of India 51,320,436 80316 10.00 1565.00
8 SKS Microfinance Limited 17,670,534 3976 10.00 225.00
9 Indiabulls Housing Finance Limited 20,000 5 2.00 225.00
10 Yes Bank Limited 53,492,272 29420 10.00 550.00
11 KSK Energy Ventures Limited 40,404,040 4000 10.00 99.00
12 Idea Cellular Limited 223,880,597 30000 10.00 134.00
13 Reliance Communications Limited 338,286,197 48084 5.00 142.14
14 Ashok Leyland Limited 185,200,000 6667 1.00 36.00
15 Aban Offshore Limited 10,783,608 7500 2.00 695.50
16 GMR Infrastructure Limited 468,817,097 14768 1.00 31.50
17 Jaiprakash Associates Limited 213,373,416 14994 2.00 70.27
18 City Union Bank Limited 46,635,576 3500 1.00 75.05
19 J.Kumar Infraprojects Limited 4,425,000 1372 10.00 309.98
20 Corporation Bank 4,785,137 2040 10.00 426.32
21 Central Bank of India 308,461,538 24060 10.00 78.00
22 State Bank of India 12,988,697 30040 10.00 2312.78
23 IDBI Bank Limited 54,321,230 5550 10.00 102.17
24 Punjab National Bank 14,294,713 12480 10.00 873.05
25 United Bank of India 13,708,019 1000 10.00 72.95
26 Bank of Baroda 10,132,920 8500 10.00 838.85
27 Ramkrishna Forgings Limited 2,929,400 375 10.00 128.00
28 Flexituff International Limited 1,227,273 270 10.00 220.00
29 Indian Overseas Bank 127,097,102 10000 10.00 78.68
30 Union Bank of India 46,245,174 11140 10.00 240.89
31 FCS Software Solutions Limited 230,000,000 230 1.00 1.00
32 R. S. Software (India) Limited 565,000 29 10.00 51.86
33 Autolite (India) Limited 400,000 19 10.00 47.50
34 Astec LifeSciences Limited 1,115,000 38 10.00 34.00
35 Aditya Birla Nuvo Limited 6,680,000 6085 10.00 910.86
36 Orient Green Power Company Limited 100,000,000 1500 10.00 15.00
37 Jayaswal Neco Industries Limited 67,500,000 2700 10.00 40.00
38 Bank of Maharashtra 71,883,852 4060 10.00 56.48
39 ANG Industries Limited 1,350,000 28 10.00 21.00

www.nseindia.com
Primary MarketISMR 32
Contd.
Contd.
Sr. No.
Company Name No. of Securities issued
Issue Size (` mn)
Par Value Issue Price (`)
40 MSP Steel & Power Limited 20,000,000 1200 10.00 60.00
41 Shrenuj & Company Limited 19,861,321 1351 2.00 68.00
42 Jindal Stainless Limited 13,550,000 1003 2.00 74.00
43 IFB Agro Industries Limited 998,000 182 10.00 182.00
44 The Sirpur Paper Mills Limited 555,100 24 10.00 43.00
45 Suzlon Energy Limited 314,246,974 5817 2.00 18.51
46 Pioneer Embroideries Limited 1,657,981 35 10.00 21.11
47 Pioneer Embroideries Limited 3,125,948 62 10.00 19.77
48 Kotak Mahindra Bank Limited 20,000,000 12960 5.00 648.00
49 SHREE GANESH JEWELLERY HOUSE (I) LIMITED 4,144,000 622 10.00 150.00
50 Uttam Value Steels Limited 150,000,000 2270 10.00 15.13
51 Dhanlaxmi Bank Limited 5,900,000 354 10.00 60.00
52 20 Microns Limited 3,000,000 135 5.00 45.00
53 Murudeshwar Ceramics Limited 1,935,000 33 10.00 17.00
54 Helios And Matheson Information Technology Limited 1,250,000 37 10.00 29.24
55 Godawari Power And Ispat limited 1,000,000 130 10.00 130.00
56 JVL Agro Industries Limited 27,500,000 523 1.00 19.00
57 Emmbi Polyarns Limited 1,200,000 20 10.00 17.00
58 Shriram City Union Finance Limited 2,850,000 1625 10.00 570.00
59 DCW Limited 1,531,152 17 2.00 11.00
60 Rainbow Papers Limited 1,500,000 122 2.00 81.00
61 Deep Industries Limited 1,375,000 105 10.00 76.00
62 Aurionpro Solutions Limited 875,000 158 10.00 180.00
63 Kesar Enterprises Limited 855,000 38 10.00 45.00
64 Capital First Limited 3,086,420 500 10.00 162.00
65 Kwality Dairy (India) Limited 50,000,000 50 1.00 1.00
66 GTL Infrastructure Limited 735,930 7 10.00 10.00
67 GTL Limited 339,088 9 10.00 27.42
68 United Spirits Limited 14,532,775 20927 10.00 1440.00
69 3i Infotech Limited 8,930,813 176 10.00 19.74
70 Next Mediaworks Limited 6,000,000 60 10.00 10.00
71 Adani Power Limited 478,650,000 25421 10.00 53.11
72 Paramount Communications Limited 32,206,500 74 2.00 2.30
73 Fortis Healthcare 18,833,700 1866 10.00 99.09
74 Spentex Industries Limited 1,400,000 14 10.00 10.00
75 Bharti Airtel Limited 199,870,006 67956 5.00 340.00
76 Metkore Alloys & Industries Limited 9,000,000 180 2.00 20.00
77 APL Apollo Tubes Limited 385,000 56 10.00 145.00
78 Gujarat NRE Coke Limited 5,000,000 105 10.00 21.08

www.nseindia.com
Primary Market ISMR33
Contd.
Contd.
Sr. No.
Company Name No. of Securities issued
Issue Size (` mn)
Par Value Issue Price (`)
79 Shasun Pharmaceuticals Limited 1,500,000 113 2.00 75.00
80 Kesar Enterprises Limited 975,000 44 10.00 45.00
81 Wanbury Limited 2,690,000 101 10.00 37.50
82 Aurionpro Solutions Limited 257,771 46 10.00 180.00
83 ING Vysya Bank Limited 15,605,525 9551 10.00 612.00
84 Duncans Industries Limited 34,220,000 342 10.00 10.00
85 Shree Ganesh Jewellery House (I) Limited 5,800,000 870 10.00 150.00
86 3i Infotech Limited 384,498 8 10.00 19.74
87 Moser-Baer (I) Limited 20,000,000 200 10.00 10.00
88 Venus Remedies Limited 800,000 170 10.00 212.20
89 Bharati Shipyard Limited 6,764,576 535 10.00 79.12
90 Sree Rayalaseema Hi-Strength Hypo Limited 243,324 13 10.00 54.62
91 Vardhman Polytex Limited 1,600,000 105 10.00 65.67
92 Gallantt Ispat Limited 2,500,000 400 10.00 160.00
93 Vaswani Industries Limited 1,299,500 13 10.00 10.00
94 Pipavav Defence and Offshore Engineering Company Limited 24,507,881 2010 10.00 82.00
95 KEI Industries Limited 3,500,000 49 2.00 14.00
96 Suzlon Energy Limited 70,525,613 1305 2.00 18.51
97 Pipavav Defence and Offshore Engineering Company Limited 10,500,000 819 10.00 78.00
98 Kaushalya Infrastructure Development Corporation Limited 15,025,000 165 10.00 11.00
99 Southern Petrochemicals Industries Corporation Limited 29,821,350 522 10.00 17.50
100 Murudeshwar Ceramics Limited 2,035,000 35 10.00 17.00
101 Helios And Matheson Information Technology Limited 1,250,000 37 10.00 29.24
102 Indiabulls Housing Finance Limited 17,150,000 3739 2.00 218.00
103 CEAT Limited 1,712,176 146 10.00 85.03
104 Hathway Cable & Datacom Limited 5,275,000 1498 10.00 284.00
105 AI Champdany Industries Limited 2,683,045 55 5.00 20.50
106 Fortis Healthcare Limited 3,737,449 370 10.00 99.09
107 TTK Prestige Limited 300,000 1065 10.00 3550.00
108 Kalindee Rail Nirman (Engineers) Limited 4,110,400 268 10.00 65.13
109 Religare Enterprises Limited 195,936 61 10.00 313.15
110 SHREE GANESH JEWELLERY HOUSE (I) LIMITED 1,280,000 160 10.00 125.00
111 TVS Electronics Limited 350,000 8 10.00 22.75
112 Pricol Limited 4,500,000 81 1.00 18.00
113 Shriram City Union Finance Limited 3,050,000 1739 10.00 570.00
114 Sree Rayalaseema Hi-Strength Hypo Limited 492,506 27 10.00 54.62
115 Venus Remedies Limited 900,000 191 10.00 212.20
116 Nakoda Limited 48,600,000 486 5.00 10.00
117 APL Apollo Tubes Limited 1,115,000 162 10.00 145.00

www.nseindia.com
Primary MarketISMR 34
Contd.
Contd.
Sr. No.
Company Name No. of Securities issued
Issue Size (` mn)
Par Value Issue Price (`)
118 Aurionpro Solutions Limited 400,000 72 10.00 180.00
119 Den Networks Limited 31,709,384 6897 10.00 217.50
120 Ramkrishna Forgings Limited 3,724,500 494 10.00 132.75
121 Credit Analysis And Research Limited 446,310 250 10.00 560.15
122 Dhanlaxmi Bank Limited 2,300,000 115 10.00 50.00
123 Peacock Industries Limited 23,250,000 93 4.00 4.00
124 Hindalco Industries Limited 150,000,000 21653 1.00 144.35
125 Lakshmi Energy and Foods Limited 3,300,000 73 2.00 22.00
126 Ramkrishna Forgings Limited 289,000 38 10.00 130.00
127 Ramkrishna Forgings Limited 18,000 2 10.00 130.00
128 Astec LifeSciences Limited 485,000 16 10.00 34.00
129 Industrial Investment Trust Limited 1,000,000 350 10.00 350.00
130 Jindal Drilling And Industries Limited 3,300,000 630 5.00 191.00
131 Aster Silicates Limited 8,665,511 100 10.00 11.54
132 Nicco Corporation Limited 11,000,000 22 2.00 2.00
133 Swan Energy Limited 15,590,000 2339 1.00 150.00
134 Hotel Leela Venture Limited 32,961,460 650 2.00 19.72
135 Suzlon Energy Limited 70,199,351 1299 2.00 18.51
136 Wanbury Limited 2,590,000 97 10.00 37.50
137 R. S. Software (India) Limited 595,000 31 10.00 51.86
138 Indiabulls Housing Finance Limited 3,000,000 654 2.00 218.00
139 Diamond Power Infra Limited 2,000,000 420 10.00 210.00
140 Celebrity Fashions Limited 7,469,100 75 10.00 10.00
141 Kajaria Ceramics Limited 2,000,000 500 2.00 250.00
142 IOL Chemicals and Pharmaceuticals Limited 2,664,000 208 10.00 78.00
143 Jet Airways (India) Limited 27,263,372 20577 10.00 754.74
144 Hathway Cable & Datacom Limited 3,521,000 1000 10.00 284.00
145 Impex Ferro Tech Limited 14,125,000 283 10.00 20.00
146 Ankit Metal & Power Limited 26,700,000 801 10.00 30.00
147 Bank of India 46,360,686 10000 10.00 215.70
148 Central Bank of India 305,862,361 18000 10.00 58.85
149 Banswara Syntex Limited 600,000 25 10.00 41.50
150 Natco Pharma Limited 1,700,000 1085 10.00 638.40
151 Oriental Bank Of Commerce 8,087,561 1500 10.00 185.47
152 Aditya Birla Nuvo Limited 9,820,000 8945 10.00 910.86
153 Jai Balaji Industries Limited 3,495,000 175 10.00 50.00
154 Asian Granito India Limited 421,250 21 10.00 50.00
155 Rainbow Papers Limited 252,000 20 2.00 81.00
156 Indiabulls Housing Finance Limited 550,000 120 2.00 218.00

www.nseindia.com
Primary Market ISMR35
Contd.
Contd.
Sr. No.
Company Name No. of Securities issued
Issue Size (` mn)
Par Value Issue Price (`)
157 Suzlon Energy Limited 184,713,354 2030 2.00 10.99
158 Corporation Bank 14,627,486 4500 10.00 307.64
159 Jyothy Laboratories Limited 15,000,000 2627 1.00 175.15
160 Punjab & Sind Bank 21,263,023 1000 10.00 47.03
161 Kohinoor Foods Limited 7,048,306 1128 10.00 160.00
162 Canara Bank 18,258,837 5000 10.00 273.84
163 Aurionpro Solutions Limited 100,000 18 10.00 180.00
164 Supreme Infrastructure India Limited 3,350,000 620 10.00 185.00
165 United Bank of India 180,041,152 7000 10.00 38.88
166 Nitco Limited 22,099,206 557 10.00 25.20
167 Punjab National Bank 8,596,530 5000 10.00 581.63
168 State Bank of India 11,218,685 20000 10.00 1782.74
169 Vaswani Industries Limited 1,364,500 14 10.00 10.00
170 Flexituff International Limited 1,902,173 438 10.00 230.00
171 Allahabad Bank 44,583,147 4000 10.00 89.72
172 Indian Overseas Bank 229,753,015 12000 10.00 52.23
173 Union Bank of India 33,512,064 5000 10.00 149.20
174 Vijaya Bank 58,934,464 2500 10.00 42.42
175 Moser-Baer (I) Limited 10,000,000 100 10.00 10.00
176 Dena Bank 118,583,770 7000 10.00 59.03
177 Electrosteel Castings Limited 17,064,617 236 1.00 13.85
178 Bank of Maharashtra 177,619,893 8000 10.00 45.04
179 IDBI Bank Limited 271,166,013 18000 10.00 66.38
180 Andhra Bank 30,034,539 2000 10.00 66.59
181 Syndicate Bank 22,634,676 2000 10.00 88.36
182 Bank of Baroda 8,158,784 5500 10.00 674.12
183 Vivimed Labs Limited 1,490,000 224 10.00 150.00
184 Nakoda Limited 53,000,000 530 5.00 10.00
185 Tree House Education & Accessories Limited 750,000 167 10.00 222.60
186 Zicom Electronic Security Systems Limited 600,000 28 10.00 46.00
187 20 Microns Limited 923,077 30 5.00 32.50
188 Vivimed Labs Limited 2,126,984 670 10.00 315.00
189 Industrial Investment Trust Limited 1,050,000 368 10.00 350.00
190 20 Microns Limited 1,230,769 40 5.00 32.50
191 Hinduja Foundries Limited 17,818,448 608 10.00 34.15
192 Accel Frontline Limited 5,500,000 248 10.00 45.00
193 Vimal Oil & Foods Limited 3,600,000 378 10.00 105.00
194 Indian Bank 35,078,488 4000 10.00 114.03
195 Tree House Education & Accessories 403,900 90 10.00 222.60

www.nseindia.com
Primary MarketISMR 36
Contd.
Contd.
Sr. No.
Company Name No. of Securities issued
Issue Size (` mn)
Par Value Issue Price (`)
196 Alphageo (India) Limited 250,000 15 10.00 60.00
197 Suzlon Energy Limited 71,095,242 1316 2.00 18.51
198 Dynacons Technologies Limited 19,000,000 19 1.00 1.00
199 Kamat Hotels (I) Limited 1,629,629 220 10.00 135.00
200 The Sirpur Paper Mills Limited 550,000 24 10.00 43.00
201 Shilpi Cable Technologies Limited 6,759,000 203 10.00 30.00
202 Indian Overseas Bank 81,500,000 3981 10.00 48.84
203 Siyaram Silk Mills Limited 1,968 1 10.00 259.76
204 Bal Pharma Limited 537,764 11 10.00 21.00
205 Arvind Remedies Limited 19,896,000 497 10.00 25.00
206 Vardhman Polytex Limited 1,975,000 114 10.00 57.52
207 Burnpur Cement Limited 2,135,000 21 10.00 10.00
208 Vijaya Bank 304,645,849 12000 10.00 39.39
209 Supreme Tex Mart Limited 12,533,330 376 5.00 30.00
210 Somany Ceramics Limited 4,347,826 500 2.00 115.00
211 UCO Bank 25,910,091 2000 10.00 77.19
212 Capital First Limited 11,607,145 1785 10.00 153.80
213 FCS Software Solutions Limited 400,000,000 400 1.00 1.00
214 Dena Bank 69,174,068 3660 10.00 52.91
215 Ind-Swift Laboratories Limited 1,692,725 93 10.00 55.00
216 Jindal Stainless Limited 10,750,000 405 2.00 37.65
217 Orbit Exports Limited 400,000 31 10.00 76.57
218 Bharati Shipyard Limited 11,846,602 937 10.00 79.12
219 Sanghvi Forging and Engineering Limited 600,000 23 10.00 37.50
220 Banswara Syntex Limited 170,000 7 10.00 41.50
221 UCO Bank 236,170,488 18230 10.00 77.19
222 Delta Magnets Limited 397,351 13 10.00 32.43
223 Moser-Baer (I) Limited 10,000,000 100 10.00 10.00
224 Celebrity Fashions Limited 5,850,000 59 10.00 10.00
225 Sakthi Sugars Limited 59,405,940 1800 10.00 30.30
226 Shilpi Cable Technologies Limited 5,041,000 151 10.00 30.00
227 Suzlon Energy Limited 69,170,785 1280 2.00 18.51
228 Dhanlaxmi Bank Limited 7,600,000 296 10.00 39.00
229 Everonn Education Limited 1,091,303 43 10.00 39.69
230 IFB Agro Industries Limited 362,000 68 10.00 188.00
231 Uniply Industries Limited 2,950,000 30 10.00 10.00
232 Diamond Power Infra Limited 4,392,000 527 10.00 120.00
233 Aurionpro Solutions Limited 130,000 23 10.00 180.00
234 Siti Cable Network Limited 68,500,000 1370 1.00 20.00

www.nseindia.com
Primary Market ISMR37
Contd.
Contd.
Sr. No.
Company Name No. of Securities issued
Issue Size (` mn)
Par Value Issue Price (`)
235 Filatex India Limited 4,240,000 106 10.00 25.00
236 Jain Irrigation Systems Limited 7,500,000 647 2.00 86.30
237 Indiabulls Securities Limited 14,144,904 184 2.00 13.00
238 Orbit Exports Limited 150,000 12 10.00 76.57
239 Sri Adhikari Brothers Television Network Limited 2,820,000 212 10.00 75.10
240 Ashapura Minechem Limited 4,000,000 147 2.00 36.83
241 Deep Industries Limited 2,950,000 100 10.00 34.00
242 Hindustan Construction Company Limited 39,215,686 640 1.00 16.32
243 Bal Pharma Limited 1,760,984 37 10.00 21.00
244 Sri Adhikari Brothers Television Network Limited 2,539,000 191 10.00 75.10
245 Store One Retail India Limited 4,400,000 134 10.00 30.50
246 Industrial Investment Trust Limited 720,000 252 10.00 350.00
247 Patel Engineering Limited 6,979,131 401 1.00 57.50
248 Jayaswal Neco Industries Limited 68,800,000 1720 10.00 25.00
249 State Bank Of Travancore 9,253,473 3850 10.00 416.06
250 Suzlon Energy Limited 110,809,586 1161 2.00 10.48
251 Shilpa Medicare Limited 1,764,705 750 2.00 425.00
252 Celestial Biolabs Limited 1,500,000 30 10.00 20.00
253 Nicco Corporation Limited 6,000,000 12 2.00 2.00
254 Shree Renuka Sugars Limited 257,491,592 5170 1.00 20.08
255 Shriram City Union Finance Limited 6,579,840 7896 10.00 1200.00
256 Electrosteel Castings Limited 13,138,000 250 1.00 19.03
257 Peacock Industries Limited 13,750,000 55 4.00 4.00
258 Siti Cable Network Limited 93,500,000 1870 1.00 20.00
259 Indiabulls Securities Limited 13,125,095 171 2.00 13.00
260 Ramkrishna Forgings Limited 330,000 43 10.00 130.00
261 Sri Adhikari Brothers Television Network Limited 1,465,000 110 10.00 75.10
262 Bhartiya International Limited 90,000 8 10.00 87.00
263 Sintex Industries Limited 16,400,000 1132 1.00 69.01
264 Arshiya Limited 10,550,000 1530 2.00 145.00
265 Dynamatic Technologies Limited 125,347 100 10.00 797.78
266 Ramkrishna Forgings Limited 660,000 86 10.00 130.00
267 Nahar Industrial Enterprises Limited 4,575,000 301 10.00 65.78
268 Sri Adhikari Brothers Television Network Limited 1,544,000 116 10.00 75.10
269 Bhartiya International Limited 10,000 1 10.00 87.00
270 Religare Enterprises Limited 12,817,331 4048 10.00 315.85
271 Igarashi Motors India Limited 9,232,362 600 10.00 65.00
272 Suzlon Energy Limited 34,840,583 470 2.00 13.49
273 Kesar Enterprises Limited 1,379,000 29 10.00 21.00

www.nseindia.com
Primary MarketISMR 38
Contd.Sr. No.
Company Name No. of Securities issued
Issue Size (` mn)
Par Value Issue Price (`)
274 Bank of Maharashtra 90,723,520 4000 10.00 44.09
275 Central Bank of India 71,075,753 5816 10.00 81.83
276 United Bank of India 84,507,042 3000 10.00 35.5
277 IOL Chemicals and Pharmaceuticals Limited 3,350,000 94 10.00 28
278 Suzlon Energy Limited 71,632,902 1326 2.00 18.51
279 Dynamatic Technologies Limited 217,269 173 10.00 797.78
280 Sri Adhikari Brothers Television Network Limited 557,000 42 10.00 75.1
281 Orbit Exports Limited 450,000 34 10.00 76.57
282 Rainbow Papers Limited 6,984,700 566 2.00 81
283 Jai Balaji Industries Limited 6,505,000 325 10.00 50
284 Bank of Maharashtra 133,363,574 5880 10.00 44.09
285 IOL Chemicals and Pharmaceuticals Limited 7,146,427 200 10.00 28
286 Duncans Industries Limited 5,250,000 53 10.00 10
287 Prestige Estates Projects Limited 25,000,000 6125 10.00 245.00
288 Karur Vysya Bank Limited 13,412,015 6250 10.00 466.00
289 Indiabulls Housing Finance Limited 20,000 5 2.00 225.00
290 Indiabulls Housing Finance Limited 3,940,000 887 2.00 225.00
291 ITD Cementation India Limited 4,000,000 1440 10.00 360.00
292 Gammon Infrastructure Projects Limited 204,174,286 2589 2.00 12.68
293 Info Edge (India) Limited 10,135,135 7500 10.00 740.00
294 IDFC Limited 73,000,000 10001 10.00 137.00
295 Indiabulls Housing Finance Limited 20,000 5 2.00 225.00
296 Indiabulls Housing Finance Limited 40,000 9 2.00 225.00
297 Celebrity Fashions Limited 2,650,000 27 10.00 10
298 Supreme Tex Mart Limited 3,655,272 219 5.00 60
299 Dhanlaxmi Bank Limited 43,907,000 2000 10.00 45.55
300 La Opala RG Limited 502,468 553 2.00 1100
301 Hitech Plast Limited 2,000,000 114 10.00 57
302 Radha Madhav Corporation Limited 22,500,000 281 10.00 12.5
303 Arshiya Limited 45,000,000 657 2.00 14.6
304 ANG Industries Limited 650,000 14 10.00 21
305 Apollo Tyres Limited 5,000,000 431 1.00 86.2
306 Aban Offshore Limited 1,125,000 440 2.00 391
307 Aban Offshore Limited 1,375,000 538 2.00 391
308 Gujarat Sidhee Cement Limited 5,000,000 50 10.00 10
Notes: The private placement data comprises of Preferential and QIP issues only.Source: NSE