
2 Overview 6 Union Pacific Franchise 10 System Map 12 Agricultural
38
2 Overview 6 Union Pacific Franchise 10 System Map 12 Agricultural Products 14 Automotive 16 Chemicals 18 Energy 20 Industrial Products 22 Intermodal 24 Mexico 26 Financial and Operating Statistics
Transcript of 2 Overview 6 Union Pacific Franchise 10 System Map 12 Agricultural

2 Overview
6 Union Pacific Franchise
10 System Map
12 Agricultural Products
14 Automotive
16 Chemicals
18 Energy
20 Industrial Products
22 Intermodal
24 Mexico
26 Financial and Operating Statistics

31 Highlights
32 Overview
34 Selected Operating Statistics
35 Financial Statements

U N I O N P A C I F I C R A I L R O A D
O V E R V I E W
Union Pacific is the largest railroad in North America, covering 23 states
across the western two-thirds of the United States. The merger of Union Pacific,
Southern Pacific and Chicago and North Western created a strategically
advantageous route structure that serves customers in critical and fast-growing
markets. That network, combined with a well-balanced and diverse traffic
mix, makes Union Pacific the premier rail franchise in North America.
A key strength of the franchise is access to the coal fields in the Powder River
Basin (PRB) region of northeastern Wyoming. Growth of PRB coal tonnage hauled
by UP has averaged 8% over the past seven years, due to its low-production cost
and low-sulfur content. UP’s rail lines in the Midwest and Plains states provide
direct routes from major grain-producing areas to domestic markets, Mexico and
to ports of export in the Gulf Coast and Pacific Northwest. Union Pacific also has
broad coverage of the large chemical-producing areas along the Gulf Coast.
To handle growing east-west intermodal and automotive traffic, Union Pacific
has competitive long-haul routes between all major West Coast ports and eastern
gateways. In addition to directly serving all six major gateways to Mexico, the
Railroad has the fastest and most direct route to and from Mexico. The merger
of Union Pacific and Southern Pacificroutes in the South and Southwest pro-duced a single-line rail network serv-ing the rapidly growing population inthis part of the country. Leveraging thestrengths of this broad franchiseallows Union Pacific to improve cus-tomer service, grow market share andachieve improved financial returns.
F INANCIAL REVIEW
Financial performance improved significantly in 1999, as the Railroadrebounded from the effects of the service difficulties of late 1997 and1998. Commodity revenue grew 9%,from customers returning business to the Railroad and from generalgrowth, particularly in coal, inter-modal and automobile shipments.Service improvements drove operat-ing expenses down 7%, reflectingincreased system velocity and areduction in service failures. Netincome from continuing operationsgrew to $754 million in 1999, capping six consecutive quarters
2
Quarterly Operating Ratio
Q198
Q298
Q398
Q498
Q199
Q299
Q399
Q499
Q497
Customer Claims Provision
103.0
98.8
106.1
91.289.4
85.883.0
80.6 80.8
(percent)
Financial Summary1999 1998 1997
UNION PACIF IC CORPORATION (excluding Overnite and Skyway)
*includes long-term operating leases
Operating Revenue (millions of dollars) $10,211 $9,368 $9,981
Operating Income (millions of dollars) $1,784 $348 $1,144
Operating Ratio 82.5% 96.3% 88.5%
Total Carloads (thousands) 8,556 7,998 8,453
Average Employees 52,539 53,121 52,587
Capital Investments* (millions of dollars) $1,942 $2,392 $2,297

Annual Population Growth .0% to .25% .25% to .75% .75% to 1.25% >1.25%
Union PacificFormer SPFormer CNW
3
of improvement. Capital spendingdecreased to approximately $1.9 billion, as merger-related spendingbegan to taper off.
For Union Pacific Corporation, free cash flow before dividends grewto $255 million in 1999, a $1.6billion improvement over 1998. Thelease-adjusted debt-to-capital ratioimproved from 58.7% at the end of1998 to 56.9% at the end of 1999.
problems and acting quickly to fixthem. For example, UP tracks opera-tional performance measures closelyand focuses resources on regionswhere goals are not being met. Inmany cases, performance is as goodas or better than before the UnionPacific/Southern Pacific merger. Butfurther improvement can be made asfailure costs continue to decline,capacity bottlenecks are removed and the remaining merger benefits are realized.
QUALITY TRANSPORTATION
The Railroad’s ability to grow and to
compete with other modes of trans-
portation depends on providing quality
transportation service. In 1999, UP
regained a focused approach to
improving service, reducing failure
costs and raising customer satisfaction.
UP strives continuously to improve
service quality by actively identifying
Power of UP Franchise
The power of the UP rail franchiseresults from a system of strategicroutes, a diverse traffic mix andaccess to key ports, cities and gateways. Strength also lies in UP’sability to directly serve the fastestgrowing regions of the country.
Capital Expenditures*
1997 1998 1999
$1,942
$2,392$2,297
Freight Cars & OtherCapacityLocomotivesMaintenance-of-Way
Consolidated Debt
8.08.5
10.2 10.1
1996 1997 1998 1999
8.08.5
10.2 10.1
55.6%56.5%
58.7%
56.9%
Lease-AdjustedDebt/Capital
Convertible Preferred
Convertible preferred of $1.5 billion considered 50% debt and 50% equity.
(billions of dollars)
UP Corporation
* includes long-term operating leases
Commodity Revenue Growth
Chem
icals
Intermodal
Autom
otive
Agricultural
Energy
Industrial
Total
8.6
3.9
6.2
8.68.9
11.8
13.8(percent) (millions of dollars)

4
U N I O N P A C I F I C R A I L R O A D
Customer Satisfaction Index
OPERATING PERFORMANCE
Customer service and financial per-formance are improving as a result ofmore efficient use of railroad assetsincluding track, locomotives, freightcars, terminals and crews. Key indi-cators, such as train speed, freight carterminal dwell time, recrew rate andfreight car cycle time, gauge assetutilization. Showing particularimprovement is the recrew rate, whichreflects the percentage of crewsrelieved before their train completesits run. This dropped 77% from itsworst level in March of 1998. Freightcar terminal dwell measures the timea car sits in a rail yard before beingswitched into an outbound train. Thisimproved 34% to a best-ever 26.5hours in April 1999.
CUSTOMER SAT ISFACTION
Union Pacific’s mission statement establishes customer satisfaction as atop priority. Monthly customer surveysprovide feedback regarding theRailroad’s service performance. As
Operating Performance
UP achieved dramatic improvement in operations during 1999. This forward momentum has
continued, with further improvement reported for the first quarter of 2000. “Best-ever” results
reflect best monthly average performance since the UP/SP merger in September 1996.
72
44
62
75
1996 1997 1998 1999
Coal Train Cycle Performance
Jan Feb Mar Apr May Jun Jul Aug Sep Oct Nov Dec
90
80
70
100200019991998
(percent)
VelocityMiles Per Hour
Best Ever 19.7
12.7 Best Ever 5.1%
Best Ever 26.5
Recrew RatePercentage
22.4%
Freight Car Terminal DwellHours
40.0
Best Ever 12.0
Freight Car Cycle TimeDays
16.3
19.1
9.4%
12.128.6
Mar '97 Mar '97Mar '00 Mar '00Mar '98Mar '98
Mar '97 Mar '97Mar '00 Mar '00Mar '98Mar '98
26.8
12.1

5
service improved during 1999, thepercent of satisfied customers climbedfrom 58% in January to 77% inDecember. Of critical importance tofuture improvement, the number of dissatisfied customers declined from23% in January to 2% in December.
SERVICE DEL IVERY INDEX
The most direct measure of how wellthe Railroad is meeting customerexpectations is the Service DeliveryIndex (SDI). Depending on the com-modity, the SDI measures how closelya car followed its scheduled trip planor how well a train performedagainst contractual obligations oragreed-upon transit times.
As the Railroad climbed out of itsservice difficulties, the SDI rose from59 in January of 1999 to 73 in Marchof 2000. Performance out of thePowder River Basin was particularlystrong and helped drive coal traincycle performance from 79.8% inJanuary of 1999 to 99.2% in Marchof 2000. Results were driven by
improvements in capacity and by theefforts of a process improvement teamthat used targeted problem-solvingtechniques to reduce service failures.
SERVICE VARIABIL ITY
Quality service for customers meansthat shipments arrive quickly andconsistently on time. Cars that arrive too early or too late can cause logistical problems for customerseven if the average cycle time meetsestablished standards. Eliminatingexcessive variability also benefits theRailroad. When trains run on sched-ule, cars make required connections,terminals become less congested andthe efficiency of crews, locomotivesand track capacity improves. Trainspeeds and car cycle times are currently reaching record levels sincethe UP/SP merger in October 1996.By continuing to focus on reducing performance variability, furtherimprovements in customer service,train performance and asset utilization should be achievable.
COST OF QUALITY
Failure to meet standards of opera-tional performance, customer satisfac-tion or service performance results infinancial costs to the Railroad in theform of higher expenses, poor asset utilization or lost revenue opportunities.At Union Pacific, failure costs are captured by the Cost of Quality system,which consists of over 100 separateaccounts for tracking performance.Measured as a percentage of revenue,the Cost of Quality declined by one-third to 14% in 1999.
Cost of QualityService Variability
FrequencyIncreasedCustomerSatisfaction
ExcessiveVariability
On-TimeService Level
LateEarly 1995 1996 1997 1998 1999 2000Goal
11
141315
1921
13
YTDFeb
Service Delivery Index
1996 1997 1998 1999 2000Q1
67.3
60.6
49.2
65.3
71.6(conceptual representation) (percent of revenue)
1996 through 1998 results are pro formaUP/SP prior to and during computer systemscutovers.
Our Mission
Union Pacific is committed to be a
railroad where:
■ Customers want to do business
■ Employees are proud to work
■ Shareholder value is created

U N I O N P A C I F I C R A I L R O A D
UNION PACIF IC FRANCHISE
The merger between Union Pacificand Southern Pacific created a railfranchise with substantial benefits tothe Railroad and its customers.Improved equipment utilization andconsolidation of work forces andfacilities are key benefits that willcontinue to improve operational performance and financial returns for shareholders. Customers now benefit from new or expanded facilities and train services. Many of these are available following completion of several major mergerimplementation projects during the past two years.
ROSEVILLE YARD
In May 1999, the J.R. Davis Yardopened in Roseville, California, after a two-year, $145 million reconstruc-tion project. Many smaller rail yardsin the area were closed or downsizedas rail traffic was consolidated intoRoseville. This allows the Railroad tobuild longer, dedicated trains that can
move directly to final destination orinterchange with fewer time-consumingintermediate stops. The Railroad isplanning to use this advantage tointroduce new premium manifesttrains that will provide high priorityservice for perishables and othergoods moving east through Chicago.
I -5 MANIFEST SERVICE
The Union Pacific/Southern Pacificmerger created truck-competitive, single-line rail service along the I-5 corridor between the PacificNorthwest and California, Nevadaand Arizona. Lumber and paper traffic from the PNW is the target of another customer offering called “5-7-9” Service. To meet customerneeds, the Railroad will offer servicefrom the PNW to Northern Californiain five days, Southern California inseven days and Las Vegas andPhoenix in nine days. Consistentlymeeting that schedule should winincreased market share from trucks.
Roseville is the premier classification yard
on the West Coast. It was built to consolidate
rail traffic from many smaller yards in the
area and sized to handle years of expected
growth. The savings from reduced labor costs
and improved equipment utilization alone
are estimated to provide a 30% return on
investment.
Eugene
PortlandHinkle
West Colton
Roseville
San Jose
SacramentoMilpitas
SparksStockton
Yards closedor downsizedMajor yards
Eastport
To Arizona, Texas& eastern gateways
To North Platte& eastern gateways
9-Day Service
7-Day Service
5-Day Service Roseville
Yard
St. LouisGateway
ChicagoGateway
“5-7-9” MANIFEST SERVICEPREMIUM MANIFEST SERVICE
ROSEVILLE RATIONALIZATION
6
7
I -5 INTERMODAL SERVICE
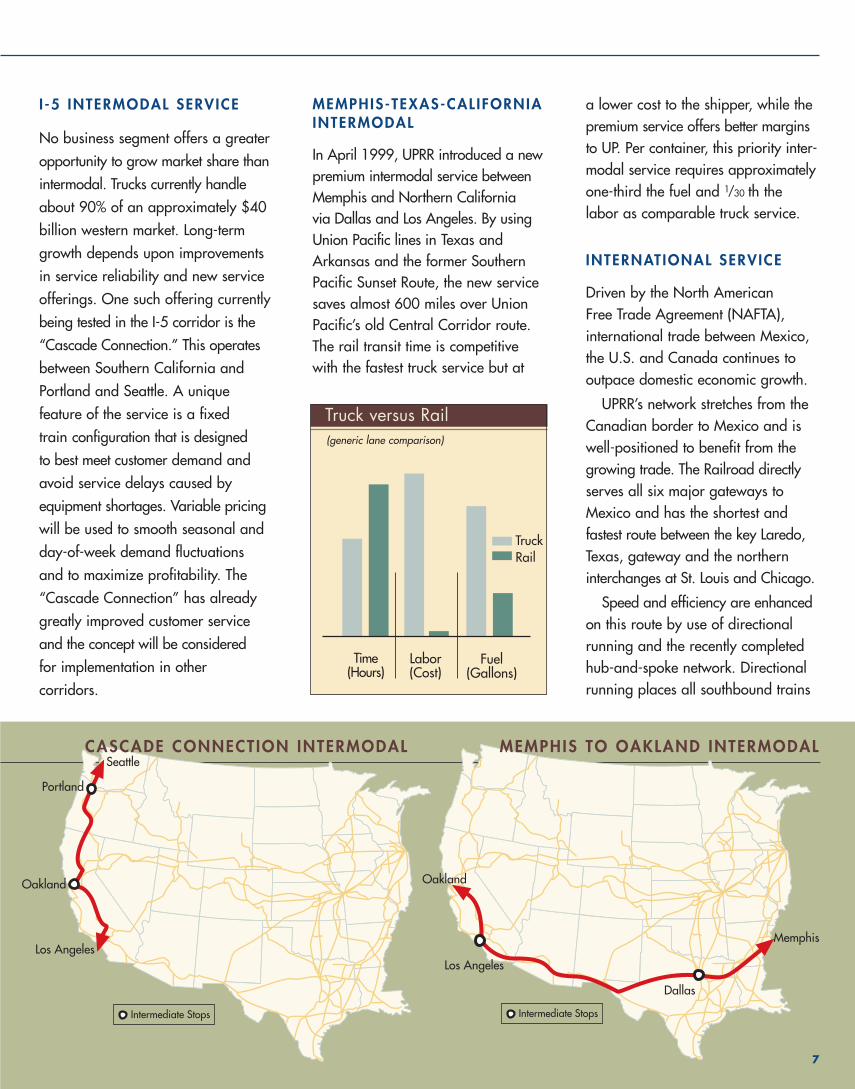
No business segment offers a greateropportunity to grow market share thanintermodal. Trucks currently handleabout 90% of an approximately $40billion western market. Long-termgrowth depends upon improvementsin service reliability and new serviceofferings. One such offering currentlybeing tested in the I-5 corridor is the“Cascade Connection.” This operatesbetween Southern California andPortland and Seattle. A unique feature of the service is a fixed train configuration that is designed to best meet customer demand andavoid service delays caused byequipment shortages. Variable pricingwill be used to smooth seasonal andday-of-week demand fluctuationsand to maximize profitability. The“Cascade Connection” has alreadygreatly improved customer serviceand the concept will be considered for implementation in other corridors.
a lower cost to the shipper, while thepremium service offers better marginsto UP. Per container, this priority inter-modal service requires approximatelyone-third the fuel and 1/30 th the labor as comparable truck service.
INTERNATIONAL SERVICE
Driven by the North American Free Trade Agreement (NAFTA),international trade between Mexico,the U.S. and Canada continues tooutpace domestic economic growth.
UPRR’s network stretches from theCanadian border to Mexico and iswell-positioned to benefit from thegrowing trade. The Railroad directlyserves all six major gateways toMexico and has the shortest andfastest route between the key Laredo,Texas, gateway and the northern interchanges at St. Louis and Chicago.
Speed and efficiency are enhancedon this route by use of directionalrunning and the recently completedhub-and-spoke network. Directionalrunning places all southbound trains
Oakland
Portland
Seattle
Los Angeles
Intermediate Stops
Oakland
Memphis
Dallas
Los Angeles
Intermediate Stops
MEMPHIS TO OAKLAND INTERMODAL
Truck versus Rail
RailTruck
Time(Hours)
Labor(Cost)
Fuel(Gallons)
MEMPHIS-TEXAS-CAL IFORNIAINTERMODAL
In April 1999, UPRR introduced a newpremium intermodal service betweenMemphis and Northern California via Dallas and Los Angeles. By usingUnion Pacific lines in Texas andArkansas and the former SouthernPacific Sunset Route, the new servicesaves almost 600 miles over UnionPacific’s old Central Corridor route.The rail transit time is competitivewith the fastest truck service but at
CASCADE CONNECTION INTERMODAL
(generic lane comparison)

on the former SP route betweenIllinois and Texas and all northboundtrains on the parallel UP route. Thiseliminates thousands of train meetsand passes. The hub-and-spoke net-work greatly increases crew efficiencyin major cities by qualifying crews on multiple line segments.
By taking advantage of these efficiencies, UP and the TFM inMexico have teamed up to offer five-day premium intermodal servicebetween Mexico City and Chicago.The primary target of this service isnorthbound auto parts shipmentsdestined for U.S. assembly plants.
U N I O N P A C I F I C R A I L R O A D
CENTRAL CORRIDOR CAPACITY
The heaviest density of rail freight in the world can be found traversing the Union Pacific’s Central Corridorin Nebraska. In August 1999, amulti-year project to install 108 milesof triple track was completed, remov-ing a key bottleneck. The fluid capacityof this segment grew from approxi-mately 95 trains per day to 160 to180 trains per day, and average trainspeed grew 40% to 34 miles per hour.
Track capacity is also being addedbetween the PRB mines in Wyomingand North Platte, Nebraska, andbetween Gibbon, Nebraska, and
Marysville, Kansas, and over theKansas Pacific line. The benefits of all this new capacity support antici-pated growth in coal traffic and allother traffic relying on these routes.
INFORMATION TECHNOLOGY& THE INTERNET
TECHNOLOGY APPL ICAT IONS
At Union Pacific, technology hasalways been embraced as a valuabletool for increasing productivity, improv-ing customer service and simplifyingbusiness practices. Because of theRailroad’s large asset base and heavyreliance on transaction-based process-es, new technologies can be scaledupward immediately to deliver strongfinancial returns. Examples includetwo new systems recently developedto monitor train events and managethe locomotive fleet. These systemsprovide managers with real-timeinformation regarding train and locomotive location and status, andassists them in making decisions toimprove both utilization and on-timeIntermodal, coal and manifest trains at the outskirts of Bailey Yard west of North Platte, Nebraska.
on UPRR
on KCS
on TexMex
Memphis
HoustonSan Antonio
Laredo
Little Rock
Chicago
St. Louis
Pine Bluff
Jackson
UPRRBNSFBNSF Trackage RightsCN/ICCN/IC Trackage Rights
UPRR Southbound 1,401 milesUPRR Northbound 1,339 milesBNSF 1,670 milesCN/IC 1,655 miles
CENTRAL CORRIDOR CAPACITYROUTES TO MEXICO
PowderRiverBasin
South Morrill
North PlatteGibbon
Omaha Chicago
Kansas CityTopeka
Cheyenne
DenverMarysville
Double Track Under Construction
8

9
performance. Exciting new applicationsare now being developed, highlightedby a next-generation computer-aided dispatching system, CAD III.
THE INTERNET
Use of Internet applications to simplifyand improve business-to-business transactions is one of the fastest grow-ing areas in the technology industrytoday. Union Pacific is a railroadindustry leader in developing innova-tive business-to-business applications.At Union Pacific, the Internet is viewedas a tool both to improve the efficiencyand accuracy of tens of thousands ofdaily business-to-business transactionsand to make these transactions simplerfor customers. Many powerful servicesare already available. Customers canperform price inquiries, order freightcars, submit shipping instructions andtrace car movements to destination.Once customers are finished loading orunloading a car, they can submitinstructions via the Internet to have itpicked up by the Railroad.
Customers have reacted positively,
Internet Document Hits (monthly)
Jan 1998 Jan 2000
2,313,000
399,000
as use of the Railroad’s web site hasincreased by over 480% during thepast two years.
Applications are not limited just tocustomers. Many employee serviceshave also migrated to the web.
For example, crews can check train line-ups from home to help themanticipate work assignments. Andmany new applications and customer-specific sites are being developed.

1 0
Single and Double Track
Triple and Quadruple Track
Major Classification Yards
Major Intermodal Trailer/Container Terminals
Auto Facilities
Auto Assembly Centers
Spokane
Tacoma
HinklePortland
Las Vegas
Reno
RosevilleOakland
San Francisco
Fresno
ColtonLos Angeles
Long Beach
Calexico
Eastport
Boise
Pocatello
Silver Bow
Shawnee Jct.
PowderRiverBasin
Ogden
Salt Lake City
Phoenix
Tucson
Nogales
Santa Rosa
El Paso
Cheyenne
Denver
Pueblo
North Platte GibbonO
Marysville
Tope
Wichita
Oklahoma City
Amarillo
FortWorth
San Antonio
Eagle Pass
Laredo
Brownsville
M
Seattle
Barnes
Kent
Benecia
Clearfield
Fremont
MiraLoma
Rolla
Kirby
Arlingt
Tulsa
Sacramento

1 1
IndustrialProducts
19%
Energy22%
Chemicals16%
Intermodal18%
Agricultral Products14%
Automotive11%
R E V E N U E M I XCommodity Revenue: $9.9 Bil l ion
12 Agricultural Products
14 Automotive
16 Chemicals
18 Energy
20 Industrial Products
22 Intermodal
24 Mexico
O
e
M
to
St. Joseph
Omaha
eka
Dallas
Houston New Orleans
Livonia
Pine Bluff
Little RockMemphis
St. LouisKansas City
Des Moines
Minneapolis
Duluth
Milwaukee
Chicago
Westfield
Port AllenBaton Rouge
ton Mesquite
Reisor
Fairfax
ChicagoHeights
Belvidere
Janesville
St. Paul

1 2
18%
8%8%
33%
11%
11%
6%
5%
A G R I C U L T U R A L P R O D U C T S
Whole GrainCorn & Feed Grains (33%)Wheat & Food Grains (18%)
Grain ProductsSweeteners (11%)Meals & Oils (11%)Livestock & Feed (5%)Food Grain Products (6%)
FoodCanned/Packaged/ Beverages (8%)Fresh & Frozen Products (8%)
1999 Review■ Driven by strong crop production
and a 44% increase in feed grainexports, whole grain carloadsincreased 15% over 1998 levels.
■ Service improvements in 1999resulted in a 25% improvement inunit train transit times compared to 1998.
■ Better service also helped foodproducts volume grow 5%. Growthin beer and frozen products wereparticularly strong. Canned goodsshipments were down 2%, primarilythe result of a poor tomato cropduring 1998.
■ Carloads of grain products increased by 1%, as strong growthin Meals & Oils and Malt was tempered by a decline in sugarbeets due to crop conditions and growing patterns.
Arrow colors correspondto pie chart colors.
Note: Grain Products and Foodmove in the same lanes.
■ Railroad investment in commercialfacilities designed to improve theefficiency of the unit-train networkcontinued, with over $4.2 millioninvested in 1999.
■ Service improvements decreased carcycle times and allowed the Railroadto handle customer transportationrequirements efficiently during thefall grain harvest.
1999 Carloads

U N I O N P A C I F I C R A I L R O A D 1 3
Key Market Factors■ Union Pacific offers a critical link
between producing areas in theMidwest and West and the PacificNorthwest and primary Gulf ports,as well as to Mexico. UP’s domesticmarkets include grain processorsand feeders in the Midwest, Southand Rocky Mountain states.
■ Food products and beverages constitute another major productline, with producers and consumersbeing distributed broadly across the Railroad system.
■ Factors affecting export grainmovements include domestic andforeign crop production, differ-ences between Gulf Coast andPNW shipping rates and grainprices. Domestic business is morestable and driven primarily by the consistency of service performance.
■ Grain moves most efficiently in unit trains that shuttle continuouslybetween producers and export terminals or domestic markets.Smaller shipments, along with foodproducts and beverages, typicallymove in the manifest train network.
2000 Outlook■ Implementation of a premium
manifest train network with the newRoseville yard as the cornerstone isplanned. Union Pacific will targetthe large volume of food productscurrently moving by truck fromCalifornia to major population centers in the East.
■ Low commodity prices and increas-ing competition from foreign grain-producing countries are expectedto keep the export grain market relatively flat in 2000.
■ To provide more competitive graintransportation service, Union Pacificwill continue to work with receiversin Mexico to develop a high-efficiency unit grain train network.
Export Grain by Terminal (percent of total grain traffic)
MexicoGulfPacific Northwest
39 39 35 29 33
1995 1996 1997 1998 1999
8 8
4
5514 17 14
1618
1714
17
810
Total
COMMODITY REVENUE (millions of dollars)
1 9 9 9 1 9 9 8 1 9 9 7
1 2 3 4 1 2 3 4 1 2 3 4
Quarter ly 347 328 367 377 314 291 333 365 401 359 340 338
Cumulat ive 347 675 1,042 1,419 314 605 938 1,303 401 760 1,100 1,438
REVENUE TON-MILES (millions)
1 9 9 9 1 9 9 8 1 9 9 7
1 2 3 4 1 2 3 4 1 2 3 4
Quarter ly 16,914 16,329 17,874 18,298 15,570 14,074 15,541 15,543 20,910 15,244 14,271 18,610
Cumulat ive 16,914 33,243 51,117 69,415 15,570 29,644 45,185 60,728 20,910 36,154 50,425 69,035
CARLOADS (thousands)
1 9 9 9 1 9 9 8 1 9 9 7
1 2 3 4 1 2 3 4 1 2 3 4
Quarter ly 223 214 233 241 201 192 212 235 245 224 222 216
Cumulat ive 223 437 670 911 201 393 605 840 245 469 691 907
AVERAGE REVENUE/CARLOAD (dollars)
1 9 9 9 1 9 9 8 1 9 9 7
1 2 3 4 1 2 3 4 1 2 3 4
Quarter ly 1,552 1,536 1,576 1,565 1,561 1,513 1,574 1,556 1,637 1,601 1,531 1,566
Cumulat ive 1,552 1,544 1,555 1,558 1,561 1,538 1,550 1,552 1,637 1,620 1,592 1,585

1 4
A U T O M O T I V E
UPRR’s automotive facilities, wasused as a platform to developVINVision. VINVision is a commer-cially available Internet-accessibleproduct that provides completetracking capability by VehicleIdentification Number throughoutthe entire distribution network.
■ Union Pacific and DaimlerChryslerreached agreement on a break-through multi-year strategic alliancemaking UP its sole provider of railtransportation services in the Westwith focus on reliability, velocity and technology.
■ The Automotive Delivery andInformation Management System(ADIMS), designed to manage
34%
66%
Memphis
Assembled Autos
Auto Materials
Facilities
Assembly Centers
Arrow colors correspondto pie chart colors.
1999 Review■ Vehicle shipments grew 14%
compared to a 7% increase indomestic vehicle sales. The growthwas driven by gains in market shareand improved service in a year ofrecord-setting vehicle sales.
■ UP Automotive facilities averaged abest-in-class 98% performance rat-ing in 18 Association of AmericanRailroads Quality Audits that wereperformed in 1999, consistentlyscoring higher than the industryaverage.
■ The Railroad continued to increasethe size of its freight car fleet, whichgrew to 17,642 with the additionof 2,342 new bi-level autoracks.Union Pacific has the largest fleetof autoracks in North America.
■ Union Pacific and General Motorsreached agreement on a multi-yearcontract extension, with UP remain-ing GM’s primary transportationprovider in the west.
1999 Carloads

U N I O N P A C I F I C R A I L R O A D 1 5
Key Market Factors■ Union Pacific is the largest automo-
tive carrier west of the MississippiRiver. The Railroad has facilities that serve 80% of western U.S.cities, including 43 vehicle distribu-tion centers. Union Pacific alsodirectly serves six assembly centersand distributes import vehicles from four West Coast ports and two Gulf ports.
■ Mexico is an important automotivemarket for the Railroad as compa-nies continue to locate both vehiclemanufacturing and material facilities throughout the country.Automotive materials flow north and south across the border boundfor assembly centers in Mexico, the U.S. and Canada.
2000 Outlook■ Vehicle sales remained at record-
setting levels in the first quarter of2000. Growth for the remainder of the year will follow the strengthof the economy and consumer confidence.
■ The newly developed VINVision is the first in a new line of logisticsproducts that will enhance cus-tomers’ Fast-to-Market strategies.These products, combined with further advances in technology, will facilitate improvements invelocity and reliability for the entire distribution network.
■ Union Pacific and Thrall CarManufacturing Company entered a strategic alliance to improve anddevelop new freight car technologyto better meet changing customerneeds. A new high-capacity multi-level autorack, the Q2, is the firstproduct of the alliance and will beintroduced later this year.
■ Materials business should providean opportunity for growth as theRailroad develops supply chainmanagement solutions that helpwin market share from trucks.
U.S. Light Vehicle Sales/UP Finished Vehicle Carloads*
348364
385395
408
464
16.9
Annual Growth Rate 5.9% 2.3%
Light Vehicle Sales (millions)UP Carloadings (thousands)
15.615.1 15.214.815.1
* UP, SP & CNW pro forma for years 1994 through 1996.
1995 1996 1997 1998 19991994
COMMODITY REVENUE (millions of dollars)
1 9 9 9 1 9 9 8 1 9 9 7
1 2 3 4 1 2 3 4 1 2 3 4
Quarter ly 253 275 239 281 230 243 203 261 237 250 217 246
Cumulat ive 253 528 767 1,048 230 473 676 937 237 487 704 950
REVENUE TON-MILES (millions)
1 9 9 9 1 9 9 8 1 9 9 7
1 2 3 4 1 2 3 4 1 2 3 4
Quarter ly 3,748 3,965 3,555 4,080 3,295 3,431 2,966 3,806 3,972 4,228 3,366 3,636
Cumulat ive 3,748 7,713 11,268 15,348 3,295 6,726 9,692 13,498 3,972 8,200 11,566 15,202
CARLOADS (thousands)
1 9 9 9 1 9 9 8 1 9 9 7
1 2 3 4 1 2 3 4 1 2 3 4
Quarter ly 170 184 167 186 159 165 140 177 157 166 148 167
Cumulat ive 170 354 521 707 159 324 464 641 157 323 471 638
AVERAGE REVENUE/CARLOAD (dollars)
1 9 9 9 1 9 9 8 1 9 9 7
1 2 3 4 1 2 3 4 1 2 3 4
Quarter ly 1,491 1,492 1,430 1,507 1,448 1,473 1,450 1,471 1,513 1,513 1,463 1,471
Cumulat ive 1,491 1,492 1,472 1,481 1,448 1,461 1,458 1,461 1,513 1,513 1,497 1,490

1 6
C H E M I C A L S
9%
18%31%
26%16%
■ Capital spending in the Gulf Coastregion over the past two years hasincreased efficiency at switchingyards, removed capacity bottle-necks and added plastics storagecapacity.
1999 Review■ Carloads increased 3% during the
year as a result of improved servicelevels and growth in major marketsegments. As Asian markets beganto strengthen, carloads increased 8%in the fourth quarter.
■ Strong demand, customer plantexpansions and improved servicelevels led to an 11% increase inplastics carloads.
■ Liquid and dry chemical shipmentsrose 6%, due to improved serviceand robust demand for basicchemicals.
■ Depressed demand for farm com-modities drove fertilizer carloadsdown 3% for the year, but thefourth quarter finished up 7%, due to favorable weather andapplication conditions.
■ Union Pacific opened a new exportsoda ash facility at Beaumont, Texas,to improve service and increase par-ticipation in Gulf Coast export busi-ness that was formerly interchangedto another railroad at Kansas City.
Liquid and Dry (31%)Plastics (26%)Liquid PetroleumProducts (16%)
Fertilizers and Related Products
Soda Ash
Arrow colors correspondto pie chart colors.
1999 Carloads

U N I O N P A C I F I C R A I L R O A D 1 7
Key Market Factors■ Plastics customers depend on
reliable rail service and railroad-provided storage-in-transit (SIT)yards for intermediate storage of plastic resins.
■ Fertilizer and related products areproduced in the Gulf Coast and thewestern U.S. and Canada and areshipped to major agricultural areas.
■ The liquid and dry market consistsof 22 different segments of variousintermediate chemicals producedby and shipped to a multitude oflarge and small customers.
■ UP directly serves Green River,Wyoming, the primary soda ashproducing region in the UnitedStates. Domestic demand for soda ash is relatively constant.Export markets to Asia, Europe and Mexico, though volatile, provide growth opportunity.
2000 Outlook■ Plastics shipments should remain
strong as the economy drives new plant expansions, and theRailroad continues to gain business moving on trucks to the Northeast and West Coast.
■ Fertilizer business is expected to be flat, due to crop surpluses and weak agricultural markets.
■ To optimize capacity and meetexpected growth in the Gulf Coast chemical region, UP is:■ Improving efficiency at its twomajor Houston switching yards.■ Expanding capacity in key satellite zones around Houston.■ Adding more plastics storage-in-transit facilities.
Soda Ash Growth Opportunity
UP DomesticTons Handled
UP ExportTons Handled
OtherU.S.
Production
Domestic Soda AshProduction
World Soda AshProduction
10 Million Tons 32 Million Tons
COMMODITY REVENUE (millions of dollars)
1 9 9 9 1 9 9 8 1 9 9 7
1 2 3 4 1 2 3 4 1 2 3 4
Quarter ly 401 396 398 400 390 383 384 378 434 454 430 397
Cumulat ive 401 797 1,195 1,595 390 773 1,157 1,535 434 888 1,318 1,715
REVENUE TON-MILES (millions)
1 9 9 9 1 9 9 8 1 9 9 7
1 2 3 4 1 2 3 4 1 2 3 4
Quarter ly 13,153 13,096 13,238 13,761 12,553 12,571 12,576 11,642 14,184 14,429 13,412 12,576
Cumulat ive 13,153 26,249 39,487 53,248 12,553 25,124 37,700 49,342 14,184 28,613 42,025 54,601
CARLOADS (thousands)
1 9 9 9 1 9 9 8 1 9 9 7
1 2 3 4 1 2 3 4 1 2 3 4
Quarter ly 225 233 238 234 223 226 232 218 237 258 250 227
Cumulat ive 225 458 696 930 223 449 681 899 237 495 745 972
AVERAGE REVENUE/CARLOAD (dollars)
1 9 9 9 1 9 9 8 1 9 9 7
1 2 3 4 1 2 3 4 1 2 3 4
Quarter ly 1,781 1,701 1,673 1,708 1,750 1,692 1,658 1,733 1,828 1,760 1,725 1,746
Cumulat ive 1,781 1,741 1,717 1,715 1,750 1,721 1,699 1,708 1,828 1,793 1,770 1,764
The Green River Basin in southern Wyomingholds the world’s largestproducing deposits oftrona, or natural sodaash. Synthetic soda ashproduction supplies mostworld markets outside the U.S. and represents potential growth for UP.

■ Coal train cycle performance showedstrong improvement during the year,improving from less than 80% inJanuary to nearly 97% by December.
1 8
E N E R G Y
72%
20%
2%3%3%
Powder River Basin
Colorado/Utah
Southern Illinois
Southern Wyoming
Other (includes coke)
Arrow colors correspondto pie chart colors.
■ Approximately 66 miles of newtrack was added in Nebraska andKansas during 1999 to remove bottlenecks on the railroad and toprovide capacity for future growth.
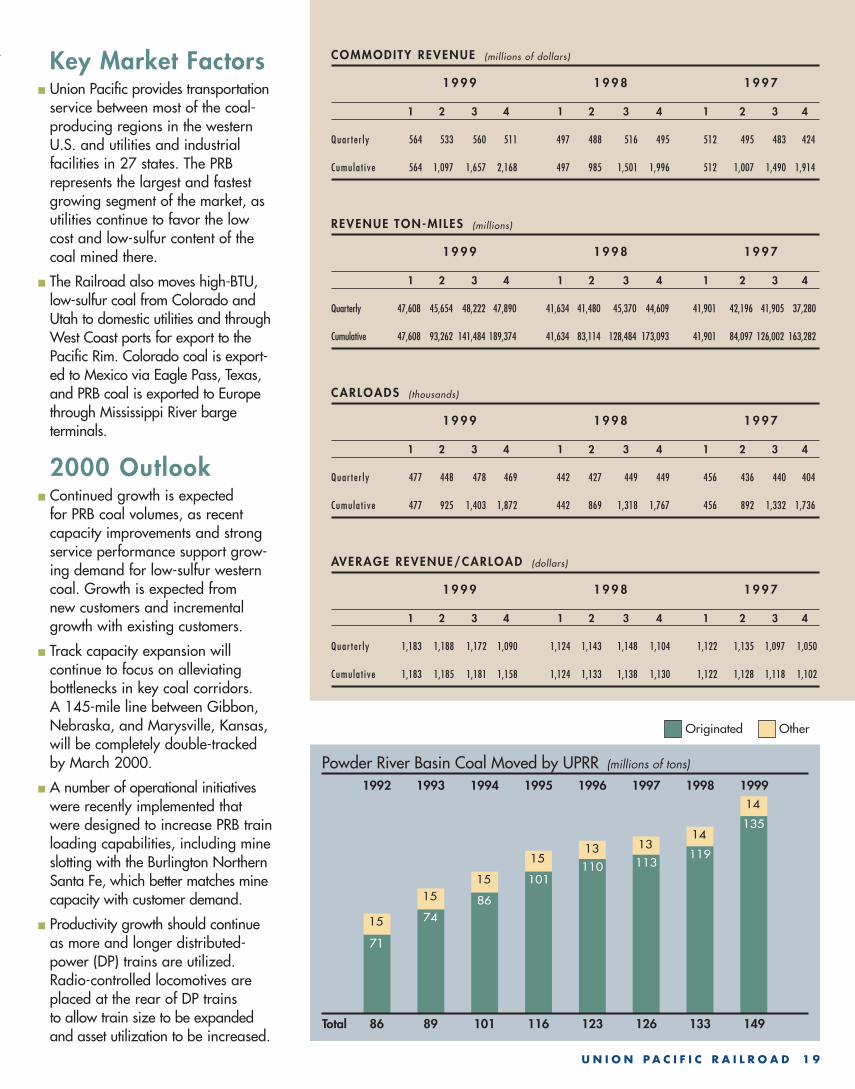
1999 Review■ In 1999, Union Pacific coal
volume grew 9% to 204 milliontons. Growth in Wyoming’s PowderRiver Basin (PRB) coal led the waywith a record 135 million tonsoriginated, a 13% increase over1998.
■ Colorado/Utah coal volumeincreased 2% from 40 million tons in 1998 to 41 million tons in 1999.
■ PRB coal train productivity improved3.3% to 13,660 tons per train in1999 compared to 13,250 tonsper train in 1998. Since 1996, PRB train productivity has grownnearly 10%, reflecting the increaseduse of longer trains and high-capacity aluminum cars.
1999 Carloads
U N I O N P A C I F I C R A I L R O A D 1 9
Key Market Factors■ Union Pacific provides transportation
service between most of the coal-producing regions in the westernU.S. and utilities and industrialfacilities in 27 states. The PRB represents the largest and fastestgrowing segment of the market, asutilities continue to favor the lowcost and low-sulfur content of thecoal mined there.
■ The Railroad also moves high-BTU,low-sulfur coal from Colorado andUtah to domestic utilities and throughWest Coast ports for export to thePacific Rim. Colorado coal is export-ed to Mexico via Eagle Pass, Texas,and PRB coal is exported to Europethrough Mississippi River barge terminals.
2000 Outlook■ Continued growth is expected
for PRB coal volumes, as recentcapacity improvements and strongservice performance support grow-ing demand for low-sulfur westerncoal. Growth is expected from new customers and incrementalgrowth with existing customers.
■ Track capacity expansion will continue to focus on alleviating bottlenecks in key coal corridors. A 145-mile line between Gibbon,Nebraska, and Marysville, Kansas,will be completely double-trackedby March 2000.
■ A number of operational initiativeswere recently implemented thatwere designed to increase PRB trainloading capabilities, including mineslotting with the Burlington NorthernSanta Fe, which better matches minecapacity with customer demand.
■ Productivity growth should continueas more and longer distributed-power (DP) trains are utilized.Radio-controlled locomotives areplaced at the rear of DP trains to allow train size to be expandedand asset utilization to be increased.
Powder River Basin Coal Moved by UPRR (millions of tons)
14
14
15
1515
1513 13
7486
101110 113
119
135
OtherOriginated
71
1992 1993 1994 1995 1996 1997 1998
86 89 101 116 123 126 133 149
1999
Total
COMMODITY REVENUE (millions of dollars)
1 9 9 9 1 9 9 8 1 9 9 7
1 2 3 4 1 2 3 4 1 2 3 4
Quarter ly 564 533 560 511 497 488 516 495 512 495 483 424
Cumulat ive 564 1,097 1,657 2,168 497 985 1,501 1,996 512 1,007 1,490 1,914
REVENUE TON-MILES (millions)
1 9 9 9 1 9 9 8 1 9 9 7
1 2 3 4 1 2 3 4 1 2 3 4
Quarterly 47,608 45,654 48,222 47,890 41,634 41,480 45,370 44,609 41,901 42,196 41,905 37,280
Cumulative 47,608 93,262 141,484 189,374 41,634 83,114 128,484 173,093 41,901 84,097 126,002 163,282
CARLOADS (thousands)
1 9 9 9 1 9 9 8 1 9 9 7
1 2 3 4 1 2 3 4 1 2 3 4
Quarter ly 477 448 478 469 442 427 449 449 456 436 440 404
Cumulat ive 477 925 1,403 1,872 442 869 1,318 1,767 456 892 1,332 1,736
AVERAGE REVENUE/CARLOAD (dollars)
1 9 9 9 1 9 9 8 1 9 9 7
1 2 3 4 1 2 3 4 1 2 3 4
Quarter ly 1,183 1,188 1,172 1,090 1,124 1,143 1,148 1,104 1,122 1,135 1,097 1,050
Cumulat ive 1,183 1,185 1,181 1,158 1,124 1,133 1,138 1,130 1,122 1,128 1,118 1,102

2 0
I N D U S T R I A L P R O D U C T S
■ In May, the newly rebuilt Roseville,California yard opened, providing the cornerstone for improving service along the I-5 corridor from Los Angeles to Seattle.
1999 Review■ Mild weather and a strong
construction market in the highpopulation growth areas of theWest and Southwest combined todrive lumber revenue up over 10% for the year.
■ Stone and cement revenues wereup 17% and 15%, respectively,reflecting improved service as wellas strong construction activity, primarily in Texas and in majormetropolitan areas.
■ Although down 6% for the year due to record imports, steel revenue rose over 22% in the fourth quarter, as improved Asianeconomies slowed imports andimport quotas began to take hold.
■ Newsprint, fibre and paperboardsaw revenue gains of nearly 8%, due to a strong domestic economyand improving worldwide economicconditions that reduced imports.
19%
38% 14%
8%
16%
5%
Minerals
Metals & Ores
Paper/Paper Products
Lumber/Building Materials
Consumer/Government
Waste
Arrow colors correspondto pie chart colors.
1999 Carloads

U N I O N P A C I F I C R A I L R O A D 2 1
Key Market Factors■ Industrial Products covers a broad
range of commodities – from bulkproducts like stone, cement, minerals,waste and scrap to higher-value shipments like lumber, paper and consumer goods. For most commodi-ties, trucks provide a competitivetransportation alternative. Marketshare growth hinges on providingconsistent, reliable service.
■ Bulk commodities like rock oftenmove in unit train service from origin to a transload facility in major metropolitan areas. Demandis driven by construction activity andpeaks during the warmer months.
■ Most other commodities move inmanifest train service and rely onUP’s extensive network of rail termi-nals to move between thousands of shippers and customers acrossNorth America. Demand is drivenprimarily by macro-economic conditions but experiences seasonal peaks.
2000 Outlook■ The newly rebuilt Roseville yard
will help the Railroad implement its new “5-7-9” Strategy to capturetraffic from trucks. The strategy callsfor delivery times of 5 days fromthe PNW to Northern California, 7 days to Southern California and9 days to Phoenix and Tucson.
■ Population growth in the South andSouthwest, a strong economy andlarge highway construction projectshave created a growing constructionmarket for lumber, cement, aggre-gates, roofing products and metals.
■ Steel, ferrous scrap and metallicminerals should all benefit fromdeclining imports of foreign steel.
■ Rising crude oil prices have causedan increase in domestic drillingactivity, which should also drive updemand for tubular steel and non-metallic minerals.
Industrial Products: Western Market Share
Rail 15%
Truck 78%
OtherRail 54%
UP 46%
Water7%
Western Rail Share Transportation Mode
COMMODITY REVENUE (millions of dollars)
1 9 9 9 1 9 9 8 1 9 9 7
1 2 3 4 1 2 3 4 1 2 3 4
Quarter ly 449 474 493 480 433 466 455 431 476 531 508 439
Cumulat ive 449 923 1,416 1,896 433 899 1,354 1,785 476 1,007 1,515 1,954
REVENUE TON-MILES (millions)
1 9 9 9 1 9 9 8 1 9 9 7
1 2 3 4 1 2 3 4 1 2 3 4
Quarter ly 17,950 19,180 19,573 19,794 17,627 18,356 18,417 16,875 19,967 20,794 19,360 17,574
Cumulat ive 17,950 37,130 56,703 76,497 17,627 35,983 54,400 71,275 19,967 40,761 60,121 77,695
CARLOADS (thousands)
1 9 9 9 1 9 9 8 1 9 9 7
1 2 3 4 1 2 3 4 1 2 3 4
Quarter ly 327 353 365 353 314 342 349 315 353 389 367 321
Cumulat ive 327 680 1,045 1,398 314 656 1,005 1,320 353 742 1,109 1,430
AVERAGE REVENUE/CARLOAD (dollars)
1 9 9 9 1 9 9 8 1 9 9 7
1 2 3 4 1 2 3 4 1 2 3 4
Quarter ly 1,373 1,345 1,350 1,360 1,381 1,362 1,303 1,365 1,348 1,366 1,385 1,364
Cumulat ive 1,373 1,359 1,356 1,357 1,381 1,371 1,348 1,352 1,348 1,357 1,366 1,366
A majority of the westernindustrial products marketcurrently moves by truck.This provides significantopportunity to increasemarket share through newservice offerings andimprovements in cycle timeand service variability.

2 2
I N T E R M O D A L1999 Review
■ A strong economy, record importsand better cycle times combined to produce an 8% increase in carloads and a 14% increase in revenue in 1999.
■ Average revenue per car increased5%, as a result of demand-drivenprice increases and higher volumein the Premium business segment.
■ Third-party and Truckload volumegrew 6%, primarily due to serviceimprovements and EMP growth(see table page 23). The size of theEMP fleet grew to approximately19,600 units, resulting in a 47%increase in volume during the year.
■ Less-Than-Truckload and Premiumintermodal volume was up 13%, led by a new premium serviceoffering between Memphis/Dallasand California, which began in April.
■ Service improvements and trackcapacity additions in the LosAngeles basin combined to enableUP to handle an 18% growth inintermodal volume out of theregion.
7%
42% 51%
Domestic
Container and TrailerPremium
International
1999 Carloads

U N I O N P A C I F I C R A I L R O A D 2 3
Key Market Factors■ International: International container
traffic handled by steamship cus-tomers. The strength in foreign –especially Asian – economies, U.S.demand for foreign goods and inter-national trade policies drive demandand affect the balance of eastboundversus westbound traffic.
■ Domestic: Two key domestic marketsegments:■ Domestic Container and Trailer:Includes container traffic handled byIntermodal Marketing Companies(IMC) and truckload carriers, as wellas the domestic container segmentsof Pacer and CSXI. An effort isunderway to convert trailer businessto EMP containers and is expected to raise significantly the efficiencyand profitability of this segment.■ Premium: Primarily less-than-truckload and package carriers with time-sensitive business needs.Premium business growth is drivenby service performance and relia-bility. Significant growth is availablefrom trucks as service performancecontinues to improve.
2000 Outlook■ Continued strong import business is
anticipated to keep the Internationalsegment growing.
■ The Premium service segment offersthe greatest opportunity for growthwith continued service performanceimprovement in existing lanes andintroduction of a second Premiumtrain between Oakland andChicago in March, 2000.
■ IMC and Truckload volumes shouldcontinue to grow, aided by full-yearutilization of 6,500 EMP containerspurchased last year.
■ Construction of a new intermodal terminal in the Chicago area hasbeen authorized. The new facilitywill provide needed capacity forgrowth in all intermodal market segments.
EMP Domestic Container Loads (in thousands)
289
196163
111
53
19991998199719961995
COMMODITY REVENUE (millions of dollars)
1 9 9 9 1 9 9 8 1 9 9 7
1 2 3 4 1 2 3 4 1 2 3 4
Quarter ly 388 426 459 452 362 379 385 390 418 461 473 389
Cumulat ive 388 814 1,273 1,725 362 741 1,126 1,516 418 879 1,352 1,741
REVENUE TON-MILES (millions)
1 9 9 9 1 9 9 8 1 9 9 7
1 2 3 4 1 2 3 4 1 2 3 4
Quarter ly 16,014 17,472 17,886 17,847 15,482 16,276 16,148 16,224 17,880 20,896 20,559 12,703
Cumulat ive 16,014 33,486 51,372 69,219 15,482 31,758 47,906 64,130 17,880 38,776 59,335 72,038
CARLOADS (thousands)
1 9 9 9 1 9 9 8 1 9 9 7
1 2 3 4 1 2 3 4 1 2 3 4
Quarter ly 625 682 720 711 599 643 640 649 679 733 745 613
Cumulat ive 625 1,307 2,027 2,738 599 1,242 1,882 2,531 679 1,412 2,157 2,770
AVERAGE REVENUE/CARLOAD (dollars)
1 9 9 9 1 9 9 8 1 9 9 7
1 2 3 4 1 2 3 4 1 2 3 4
Quarter ly 620 624 638 636 603 590 602 601 615 628 636 635
Cumulat ive 620 622 628 630 603 596 598 599 615 622 627 629
EMP is an equipment management program sponsored by Union Pacific and NorfolkSouthern that provides intermodal containers to shippers using an Internet reservation system. EMP offers customers a truck-equivalent container and the economic benefits ofdouble-stack train service. Full-year utilization of last year’s fleet additions and improve-ments in cycle times are expected to help meet projected growth in demand in 2000.

2 4
M E X I C O
Automotive
Intermodal
Industrial Products
Agricultural Products
Chemicals
Energy
the Automated Manifest System(AMS), which, when completed, willimprove border crossing efficiency.
■ Overall cycle times were reduced dramatically, with UP achieving a 27% (3 day) improvement over1998.
■ Improvements in cycle time and service increased the customer satisfaction index for Mexican customers from 55 to 82 year-over-year.
■ Capital improvements were com-pleted to clear capacity bottlenecksat the Laredo gateway and a newCustoms Inspection Facility was built at Port Laredo.
■ Union Pacific increased its investmentin the Ferromex (FXE) railroad from13% to 26%. The FXE is a 4,000-mile rail network serving four of the six gateways to the United States.
1999 Review■ Rail business with Mexico increased
10% to $708 million in 1999, drivenby significant improvements inservice performance both north andsouth of the border. Top volumegainers include Chemicals, up 27%;Agricultural Products, up 19%; andAutomotive, up 11%.
■ The recently-privatized Mexican railroads made considerable effortsto improve service through infra-structure and equipment upgrades,heightened security and improvedprocesses. One example is imple-mentation of Despacho Anticipado,a northbound clearing process thatis the first step in implementation of
11%4%
22%
3%
16%44%
Kansas City
Fort Worth
Brownsville
Mexico City
Guadalajara
Monterrey
El Paso
Los Angeles
Chicago
Memphis
Minneapolis
Dallas
Little Rock
St. LouisDenverSaltLake CityOakland
Seattle
Omaha
NewOrleans
Calexico
Nogales
EaglePass
Laredo
Houston
Arrow colors correspondto pie chart colors.
1999 Carloads

MéridaGuadalajara
Manzanillo
San LuisPotosí
MexicoCity Puebla
Veracruz
Coatzacoalcos
Tampico
TorreónMonterrey
Chihuahua
LázaroCárdenas
Saltillo
Salina Cruz
Hermosillo
Monclova
Culiacán
Queretaro
Aguascalientes
FXETFMFSRShortlines (2)FXE Trackage Rights on TFMTFM Trackage Rights on FXE
Brownsville
Laredo
Eagle Pass
Calexico
Nogales El Paso
U N I O N P A C I F I C R A I L R O A D 2 5
Key Market Factors■ Union Pacific serves all six major
gateways to Mexico, connecting tothe two largest Mexican railways.Union Pacific has the shortest andfastest route between Mexico and the Chicago connections toCanada and the eastern railroads(see map, page 10).
■ The Railroad transports all six majorcommodity groups into and out ofMexico, led by the Automotivegroup with a 44% share.
Northbound Southbound
335
196
286
229
297
243
317
252
281
248
306
278
1994 1995 1996 1997 1998 1999
531 515 540 569 529 584
UP Mexican Carloads (thousands)
■ The Mexican rail network comprisesfive railroads (see map below) andis now 90% privatized. The privati-zation process has resulted in amore efficient transportation systemwell-positioned to compete for thenorthbound and southbound busi-ness opportunities created by theNorth American Free TradeAgreement (NAFTA). The Mexicanrailroads are and have been makingsubstantial investments in trackstructure, equipment and facilitiesto improve service, equipment
utilization, safety and damage prevention.
■ The Mexico transportation market is estimated to be $4 billion per year in size and consists of abroad range of commodities fromraw materials to finished goods.Trucks are the dominant transporta-tion mode with a 75% share.Water transportation is a thirdcompetitive option.
■ The rail market is well-positioned for growth as the Mexican economyexpands and rail service within the country continues to improve.Continued foreign investment inmanufacturing and further privatiza-tion in the petrochemical and utilityindustries provide opportunities.
■ Additional progress is expected in2000 to facilitate Mexico growth,including implementation of morerun-though trains and electronicdata interchange between U.S. and Mexican carriers.

2 6
F INANCIAL AND OPERATING STAT IST ICS
U N I O N P A C I F I C C O R P O R A T I O N (excluding Overnite Transportation Co. and Skyway)
for the year ended December 31 1 9 9 9 1 9 9 8
1 2 3 4 T O T A L 1 2 3 4 T O T A L
F I N A N C I A L A N D R E V E N U E S T A T I S T I C S
Operating Revenues (millions of dollars) $2,487 $2,500 $2,616 $2,608 $10,211 $2,284 $2,317 $2,360 $2,407 $9,368
Operating Expenses (millions of dollars) (a) $2,135 $2,074 $2,109 $2,109 $8,427 $2,257 $2,459 $2,152 $2,152 $9,020
Operating Ratio (%) 85.8 83.0 80.6 80.8 82.5 98.8 106.1 91.2 89.4 96.3
Salaries and Benefits (millions of dollars) $918 $890 $930 $896 $3,634 $909 $914 $910 $947 $3,680
Salaries and Benefits (% of commodity revenue) 38.2 36.6 37.0 35.8 36.9 40.8 40.6 40.0 40.8 40.6
Commodity Revenue/Employee (thousands of dollars) $45.7 $45.6 $47.7 $48.6 $187.6 $42.2 $41.9 $42.3 $44.5 $170.8
Fuel Expense (millions of dollars) $153 $170 $176 $193 $692 $180 $182 $170 $176 $708
Average Fuel Cost Per Gallon (cents) 50 56 56 60 56 64 63 60 60 62
Commodity Revenue (millions of dollars) $2,402 $2,432 $2,515 $2,502 $9,851 $2,226 $2,250 $2,277 $2,319 $9,072
Average Commodity Revenue Per Car (dollars) $1,173 $1,151 $1,144 $1,140 $1,151 $1,149 $1,128 $1,126 $1,135 $1,134
Average Commodity Revenue/Revenue Ton Mile (cents) 2.08 2.10 2.09 2.06 2.08 2.09 2.12 2.05 2.11 2.10
Passenger Revenue (millions of dollars) $27 $25 $26 $27 $105 $24 $25 $23 $25 $97
O P E R A T I N G S T A T I S T I C S
Revenue Carloads (thousands) 2,048 2,113 2,200 2,195 8,556 1,938 1,995 2,022 2,043 7,998
Revenue Ton-Miles (billions) 115 116 120 122 473 106 106 111 109 432
Gross Ton-Miles (billions) 218 221 229 230 898 199 205 209 213 826
Fuel Consumed (millions of gallons) 303 307 312 322 1,244 283 290 283 294 1,150
Average Employees (thousands) 52.6 53.3 52.7 51.5 52.5 52.7 53.7 53.8 52.1 53.1
Gross Ton-Miles Per Employee (millions) 4.14 4.15 4.35 4.47 17.10 3.78 3.82 3.88 4.09 15.56
S U R F A C E T R A N S P O R T A T I O N B O A R D - B A S I S O P E R A T I N G E X P E N S E (millions of dollars) (b)
Transportation Expense $920 $895 $917 $975 $3,707 $942 $941 $936 $919 $3,738
Engineering Expense 366 350 360 356 1,432 368 352 345 380 1,445
Mechanical Expense 608 587 604 607 2,406 627 613 592 583 2,415
General and Administrative Expense 191 191 178 117 677 266 500 232 225 1,223
a) Includes claims from customers for damages related to shipments delayed by Railroad congestion of
$370 million pre-tax ($230 million after-tax) in 1998.
b) UPRR only.
Refer to the Union Pacific Corporation 1999 Annual Report for additional information.

2 7
F INANCIAL AND OPERATING STAT IST ICS
U N I O N P A C I F I C C O R P O R A T I O N (excluding Overnite Transportation Co. and Skyway) (millions of dollars, unaudited)
for the year ended December 31, 1999 1 2 3 4 T O T A L
O P E R A T I N G R E V E N U E S Transportation $2,487 $2,500 $2,616 $2,608 $10,211
O P E R A T I N G E X P E N S E S Salaries and Benefits 918 890 930 896 3,634
Equipment and Other Rents 313 303 317 308 1,241
Depreciation 259 256 259 263 1,037
Fuel and Utilities 178 191 199 215 783
Materials and Supplies 133 134 136 138 541
Other Costs (a) 334 300 268 289 1,191
Total Operating Expenses 2,135 2,074 2,109 2,109 8,427
Operating Income $352 $426 $507 $499 $1,784
for the year ended December 31, 1998 1 2 3 4 T O T A L
O P E R A T I N G R E V E N U E S Transportation $2,284 $2,317 $2,360 $2,407 $9,368
O P E R A T I N G E X P E N S E S Salaries and Benefits 909 914 910 947 3,680
Equipment and Other Rents 357 344 325 304 1,330
Depreciation 246 250 252 258 1,006
Fuel and Utilities 208 201 191 193 793
Materials and Supplies 133 133 130 117 513
Other Costs (a) 404 617 344 333 1,698
Total Operating Expenses 2,257 2,459 2,152 2,152 9,020
Operating Income (Loss) $27 $(142) $208 $255 $348
a) Includes claims from customers for damages related to shipments delayed by Railroad congestion
of $370 Million pre-tax ($230 million after-tax).
Refer to the Union Pacific Corporation 1999 Annual Report for additional information.

2 8
F INANCIAL AND OPERATING STAT IST ICS
U N I O N P A C I F I C R A I L R O A D C O M P A N Y (millions of dollars, unaudited)
as of December 31 1 9 9 9 1 9 9 8 1 9 9 7
A S S E T S
C U R R E N T A S S E T S Cash and Temporary Investments $83 $35 $50
Accounts Receivable 418 494 552
Inventories 329 337 288
Other Current Assets 126 215 251
Total Current Assets 956 1,081 1,141
I N V E S T M E N T S Investments 752 691 624
P R O P E R T I E S Cost 33,536 32,334 30,694
Accumulated Depreciation (6,490) (5,871) (5,208)
Net Properties 27,046 26,463 25,486
O T H E R Other Assets 126 122 92
Total Assets $28,880 $28,357 $27,343
L I A B I L I T I E S A N D S T O C K H O L D E R S ’ E Q U I T Y
C U R R E N T L I A B I L I T I E S Accounts Payable $496 $493 $660
Accrued Wages and Vacations 377 380 382
Accrued Casualty Costs 344 364 364
Taxes Payable 252 297 263
Debt Due Within One Year – Third Parties 210 178 229
Interest Payable 97 110 104
Other Current Liabilities 669 730 861
Total Current Liabilities 2,445 2,552 2,863
O T H E R L I A B I L I T I E S A N D Intercompany Borrowings – Net 5,357 5,368 3,993S T O C K H O L D E R S ’ E Q U I T Y Debt Due After One Year – Third Parties 2,419 2,606 2,361
Deferred Income Taxes 7,266 6,759 6,698
Accrued Casualty costs 911 928 929
Retiree Benefits Obligation 677 707 695
Other Liabilities 533 811 883
Redeemable Preference Shares 25 27 29
Stockholders’ Equity 9,247 8,599 8,892
Total Liabilities and Stockholders’ Equity $28,880 $28,357 $27,343
Refer to the Union Pacific Corporation 1999 Annual Report for additional information.

2 9
F INANCIAL AND OPERATING STAT IST ICS
U N I O N P A C I F I C R A I L R O A D C O M P A N Y (millions of dollars, unaudited)
for the year ended December 31 1 9 9 9 1 9 9 8 1 9 9 7
C A S H F R O M O P E R A T I O N S Net Income $854 $27 $620
Depreciation 1,034 1,003 972
Deferred Income Taxes 592 7 336
Other – Net (560) (218) (289)
Change in Working Capital 66 (266) 120
Cash From Operations 1,986 553 1,759
I N V E S T I N G A C T I V I T I E S Capital Investments (1,777) (2,044) (2,035)
Proceeds from Asset Sales and Other Activities 211 212 265
Cash Used In Investing Activities (1,566) (1,832) (1,770)
E Q U I T Y A N D F I N A N C I N G Dividends Paid (200) (320) (420)A C T I V I T I E S Debt Repaid (239) (276) (210)
Financings and Other – Net 67 1,860 615
Cash (Used In) Provided by Equity and Financing Activities (372) 1,264 (15)
Net Change in Cash and Temporary Investments $48 $(15) $ (26)
Cash and Temporary Investments at Beginning of Year 35 50 76
Cash and Temporary Investments at End of Year $83 $35 $50
C H A N G E S I N W O R K I N G Accounts Receivable $76 $58 $(105)C A P I T A L Inventories 8 (49) 7
Other Current Assets 89 36 21
Accounts, Wages and Vacation Payable – (169) 205
Debt Due Within One Year 32 (51) 106
Other Current Liabilities (139) (91) (114)
Net Change In Working Capital $66 $(266) $120
Refer to the Union Pacific Corporation 1999 Annual Report for additional information.

3 0
F INANCIAL AND OPERATING STAT IST ICS
U N I O N P A C I F I C R A I L R O A D C O M P A N Y
for the year ended December 31 1 9 9 9 1 9 9 8 1 9 9 7 1 9 9 6 1 9 9 5
C A P I T A L E X P E N D I T U R E S (millions of dollars, includes long-term operating leases)
Track $961 $989 $1,030 $647 $481
Locomotive 468 655 622 506 224
Freight Cars 85 200 129 246 180
Facilities and Other 425 549 504 283 274
T O T A L $1,939 $2,393 $2,285 $1,682 $1,159
E Q U I P M E N T O W N E D O R L E A S E D A T Y E A R - E N D
Locomotives 6,974 7,083 6,966 6,755 4,136
Freight Cars: (a)
■ Covered Hoppers 39,212 40,097 41,149 42,406 37,341
■ Box cars 20,864 23,263 24,718 22,934 20,559
■ Open-Top Hoppers 19,828 20,324 20,674 20,989 15,941
■ Gondolas 18,099 17,828 16,083 15,325 12,218
■ Other 16,726 18,264 17,143 19,675 8,428
Work Equipment 9,927 9,218 10,045 11,631 10,013
Bad Order Ratio (percent) 5.4 4.5 4.4 4.1 4.4
A V E R A G E A G E O F E Q U I P M E N T
Locomotives 15.4 14.4 14.4 13.7 13.1
Freight Cars 19.3 20.1 19.3 19.2 20.9
T R A C K M I L E S A T Y E A R - E N D
Main Line 26,963 27,197 27,421 27,406 16,599
Branch Line 6,378 6,509 7,526 8,431 6,186
Yards, Sidings, and Other Main Line 21,660 21,597 21,588 21,915 14,977
T O T A L 55,001 55,303 56,535 57,752 37,762
Track Miles of Continuous Welded Rail at Year-End 24,771 23,647 23,392 23,172 14,246
Track Miles Under Centralized Traffic-Control at Year-End 16,199 15,944 15,590 15,277 9,932
T R A C K M I L E S O F R A I L R E P L A C E D
■ New 950 858 716 451 492
■ Used 444 341 273 362 475
Track Miles Re-Ballasted 4,579 3,259 3,557 4,503 3,532
Ties Replaced (thousands) 3,293 2,691 3,853 2,919 2,194
(a) Includes owned and leased freight cars with Union Pacific system marks.
Capital Expenditure amounts and Equipment and Track statistics include the effects of the Southern Pacific
and Chicago & North Western acquisitions as of October 1, 1996 and May 1, 1995, respectively.
Refer to the Union Pacific Corporation 1999 Annual Report for additional information.

3 1
Shipments (thousands) 7,708
Tonnage (thousands) 4,198
Revenue (per hundredweight) $12.26
Total Revenue (millions) $1,062
Operating Ratio (%) 98.1
Capital Expenditures (millions) $55
Employees 13,000
Fleet:
Tractors 5,300
Trailers 20,000
Straight Trucks 77
O V E R N I T E
VISION STATEMENT: To be the most successful company in the industry,with the best equipment and facilities.With this success, over time, comesthe best jobs in the industry in termsof job security, wages, benefits and job satisfaction.

O V E R N I T E T R A N S P O R TAT I O N
3 2
Overnite Transportation is one of the
nation’s largest less-than-truckload (LTL)
carriers. With 13,000 employees,
20,000 trailers and 5,300 tractors,
Overnite serves over 45,000 points
in all 50 states, Canada, Mexico and
U.S. territories. More than 90 percent
of the company’s revenues are
derived from its LTL business, with
the remainder derived from truckload
services and value-added services that
support the core LTL business. Through
166 service centers, Overnite can
offer customized intrastate, regional,
national, next day and two-day
major-market transportation services.
O V E R V I E W
During 1999, Overnite continued to make significant progress in
developing and implementing innovative, new transportation services
for its customers. Financial results in the fourth quarter were adversely
affected by disruptions caused by the organizing efforts of the International
Brotherhood of Teamsters. Despite this distraction, Overnite maintained its
focus on delivering value through customer service and finished the year
with a record on-time performance level of 97%.
F INANCIAL REVIEW
Operating revenues grew $28 millionor 3% in 1999 to $1.1 billion. Growthwas attributable to yield-enhancing initiatives and strong volumes in thesecond and third quarters. Operatingexpenses grew 6% or $62 million, primarily as a result of increasedwages and benefits and higher
expenses incurred to maintain cus-tomer service and security during theTeamsters job action ($27 million). Netincome fell 30% to $28.5 million, andthe operating ratio rose to 98.1% from 94.8% in 1998.
Fuel and utility expense was up $3 million or 7%, as a result of high-er prices and higher consumption.

96.4
94.895.8
96.99
rformanceOn-Time Service Performance(percent)
tioned the National Labor RelationsBoard to decertify the Teamsters astheir bargaining agent.
Despite the walkout, all locationscontinue to be served and on-timeservice levels continue to improve.The Company is currently engaged in negotiations with the Teamsters, but has not entered into any bargaining agreements.
DEL IVERING VALUE IN
TRANSPORTATION
Over the past several years, Overnitehas expanded its efforts to improvethe quality of its customer service and to focus on higher-margin busi-ness segments. The outcome of theseefforts is a series of innovative newtransportation products that bettermeet the demands of customers forsimpler, faster and more reliable service. As evidence of Overnite’ssuccess, on-time performancereached a record 98% in the firstquarter of 2000. Some of the new or expanded services include:
Overnite Advantage: Overnite’severyday service reliability, while providing nationwide coverage toover 45,000 points including 100%direct full-state coverage in 27 states,more than 15,000 one- and two-daylanes and three- and four-daytranscontinental sleeper service.
Overnite Advantage Guaranteed:This service product is intended fortime-sensitive shipments. OverniteAdvantage Guaranteed service willguarantee delivery based on Overnite’spublished transit time. It’s on-time or it’s free.
3 3
96.4
94.895.8
96.998.0
1Q1999
2 Q1999
3Q1999
4Q1999
1Q2000
Equipment and other rent expenseincreased 14% or $12 million, due to implementation of work stoppagecontingency plans in the fourth quar-ter and higher ocean freight expenserelated to a large volume of businessgained from a competitor in PuertoRico. Other costs increased $11 millionfrom higher spending on security and travel and lodging. On the positive side, material and suppliesexpense decreased slightly.
LABOR RELAT IONS
A Teamster campaign to organize allOvernite employees culminated in theunion calling for a nationwide walk-out on October 24. The job action,which continued into 2000, wasignored by 94% of Overnite employ-ees. The union is the certified andrecognized bargaining agent forabout 1,800 Overnite drivers andfreight handlers out of a 13,000employee workforce. More than 60%of Teamster-represented employeeshave worked through the walkout.Employees at half of the 22 Teamster-represented service centers have peti-
Revenue
1Q 2Q 3Q 4Q
253
273
277
259257
262
257 258
1999
1998
(millions of dollars)
Overnite Advantage Expedited:This service is for customers needingguaranteed service for their emer-gency, time-critical shipments to anypoint in the world through a singletransportation provider. Overnite provides a team of freight specialiststo handle coordination and instanta-neous tracking for all segments of the move, from origin to destination.It’s on-time or it’s free.
Special Services Division: Overnite’sdedicated truckload service divisionutilizes Overnite’s LTL expertise toexpand into niche segments of thegrowing truckload market.
Assembly & Distribution: A speciallogistical function for shippers whoneed consolidation and distributionservices. Overnite’s Assembly andDistribution service provides thesefunctions for their customers by leveraging the broad distributioncapabilities of the Overnite network.
Cross Borders and Ocean: A singlecarrier contact that provides trans-portation services to Alaska, Hawaii,Guam, Canada, Puerto Rico and theU.S. Virgin Islands, with competitivetransit times and price.

3 4
SELECTED OPERATING STAT IST ICS
O V E R N I T E T R A N S P O R TAT I O N C O M PA N Y
for the year ended December 31 1 9 9 9 1 9 9 8
1 2 3 4 T O T A L 1 2 3 4 T O T A L
F I N A N C I A L A N D R E V E N U E S T A T I S T I C S
Total Operating Revenues (millions of dollars) 253 273 277 259 1,062 257 262 257 258 1,034
Total Operating Expenses (millions of dollars) (a) 243 258 269 272 1,042 244 249 245 242 980
Operating Ratio (excluding goodwill) (%) 95.9 94.5 97.1 105.3 98.1 94.9 95.1 95.3 93.6 94.8
Millions of Pounds HauledLess-Than-Truckload 1,942 2,090 2,080 1,837 7,949 2,004 2,019 2,005 1,938 7,966
Truckload 107 106 117 117 447 116 110 111 116 453
T O T A L 2,049 2,196 2,197 1,954 8,396 2,120 2,129 2,116 2,054 8,419
Average Revenue Per HundredweightLess-Than-Truckload $12.35 $12.42 $12.60 $13.25 $12.64 $12.24 $12.38 $12.18 $12.64 $12.36
Truckload 5.22 5.21 5.67 6.30 5.62 5.50 5.34 5.32 5.42 5.40
T O T A L $ 11.97 $ 12.07 $ 12.23 $ 12.83 $12.26 $ 11.87 $ 12.01 $ 11.82 $ 12.24 $11.98
Shipments (thousands)
Less-Than-Truckload 1,885 2,030 2,025 1,746 7,686 1,952 1,988 1,949 1,879 7,768
Truckload 5 5 6 6 22 5 6 5 5 21
T O T A L 1,890 2,035 2,031 1,752 7,708 1,957 1,994 1,954 1,884 7,789
Average Fuel Price Per Gallon (cents) 44 51 57 65 54 58 52 48 53 53
Total Fuel Consumed (thousands of gallons) 13,932 14,425 14,444 13,017 55,818 13,774 13,227 13,310 13,241 53,552
Average Employee Count 11,518 11,704 11,994 11,562 11,695 11,443 11,589 11,508 11,475 11,504
a) 1998 results exclude goodwill amortization of $15 million and goodwill revaluation of $547 million.
Refer to the Union Pacific Corporation 1999 Annual Report for additional information.

3 5
STATEMENT OF CONSOLIDATED INCOME
O V E R N I T E T R A N S P O R TAT I O N C O M PA N Y (millions of dollars, unaudited)
for the year ended December 31, 1999 1 2 3 4 T O T A L
O P E R A T I N G R E V E N U E S Transportation $253 $273 $277 $259 $1,062
O P E R A T I N G E X P E N S E S Salaries and Benefits 158 167 169 157 651
Equipment and Other Rents 18 22 24 31 95
Depreciation 11 12 12 11 46
Fuel and Utilities 11 11 13 14 49
Materials and Supplies 11 12 13 13 49
Other Costs 34 34 38 46 152
Total Operating Expenses 243 258 269 272 1,042
Operating Income (Loss) $10 $15 $8 $(13) $20
Net Income $9 $11 $8 $1 $29
for the year ended December 31, 1998 1 2 3 4 T O T A L
O P E R A T I N G R E V E N U E S Transportation $257 $262 $257 $258 $1,034
O P E R A T I N G E X P E N S E S Salaries and Benefits 154 159 155 148 616
Equipment and Other Rents 22 21 20 20 83
Depreciation (a) 11 12 11 11 45
Fuel and Utilities 12 11 11 12 46
Materials and Supplies 11 11 12 15 49
Other Costs 34 35 36 36 141
Total Operating Expenses 244 249 245 242 980
Operating Income $13 $13 $12 $16 $54
Net Income $10 $10 $9 $11 $40
(a) 1998 results exclude goodwill amortization of $15 million and goodwill revaluation of $547 million.
Refer to the Union Pacific Corporation 1999 Annual Report for additional information.

3 6
STATEMENT OF CONSOLIDATED F INANCIAL POSIT ION
STATEMENT OF CONSOLIDATED CASH FLOWS
O V E R N I T E T R A N S P O R T A T I O N C O M P A N Y (millions of dollars, unaudited)
as of December 31 1 9 9 9 1 9 9 8 1 9 9 7
A S S E T S Current Assets $393 $358 $335
Net Properties 459 461 453
Other Assets (a) 51 39 600
Total Assets $903 $858 $1,388
L I A B I L I T I E S A N D S T O C K H O L D E R S ’ E Q U I T Y
Current Liabilities $164 $144 $168
Debt Due After One Year – Third Parties – 3 5
Other Liabilities 154 139 105
Stockholders’ Equity 585 572 1,110
Total Liabilities and Stockholders’ Equity $903 $858 $1,388
a) Includes $547 million goodwill revaluation in 1998.
O V E R N I T E T R A N S P O R T A T I O N C O M P A N Y (millions of dollars, unaudited)
for the year ended December 31 1 9 9 9 1 9 9 8 1 9 9 7
Cash From Operations $89 $82 $79
Cash Used in Investing Activities (46) (52) (30)
Cash Used in Financing Activities (46) (27) (49)
Net Change In Cash and Temporary Investments $(3) $3 $ –
Refer to the Union Pacific Corporation 1999 Annual Report for additional information.

Certain statements in this report are forward-
looking within the meaning of the Securities
Act of 1933 and the Securities Exchange Act
of 1934. These forward-looking statements
include, without limitation, statements regarding:
expectations as to operational improvements;
expectations as to market growth, cost savings,
revenue growth and earnings; the time by
which certain objectives will be achieved; and
statements concerning projections, predictions,
expectations, estimates or forecasts as to the
Corporation’s and its subsidiaries’ business,
financial and operational results, and future
economic performance, statements of manage-
ment’s goals and objectives and other similar
expressions concerning matters that are not
historical facts.
Forward-looking statements should not be
read as a guarantee of future performance or
results, and will not necessarily be accurate
indications of the times at, or by which, such
performance or results will be achieved.
Forward-looking information is based on
information available at the time and/or
management’s good faith belief with respect
to future events, and is subject to risks and
uncertainties that could cause actual
performance or results to differ materially
from those expressed in the statements.
Important factors that could cause such
differences include, but are not limited to,
whether the Corporation and its subsidiaries
are fully successful in implementing their
financial and operational initiatives; industry
competition, conditions, performance and
consolidation; legislative and/or regulatory
developments, including possible enactment
of initiatives to re-regulate the rail business;
natural events such as severe weather, floods
and earthquakes; the effects of adverse
general economic conditions, both within
the United States and globally; changes in
fuel prices; changes in labor costs; labor
stoppages; the impact of latent year 2000
systems problems; and the outcome of
claims and litigation, including claims
arising from environmental investigations
or proceedings.
Forward-looking statements speak only
as of the date the statement was made. The
Corporation assumes no obligation to update
forward-looking information to reflect actual
results, changes in assumptions or changes
in other factors affecting forward-looking
information. If the Corporation does update
one or more forward-looking statements,
no inference should be drawn that the
Corporation will make additional updates
with respect thereto or with respect to
other forward-looking statements.
C A U T I O N A R Y I N F O R M A T I O N
CONTACT FOR PORTFOLIO
MANAGERS AND
FINANCIAL ANALYSTS
Union Pacific’s analyst relations are coordinated by the CorporateTreasurer at the executive offices.Requests for interviews, general information, offering memoranda,bond circulars and other publications should be directed to:
Investor Relations(402) 271-4227


