2 Outline - Cleveland State University
24
1 EEC 686/785 Modeling & Performance Evaluation of Computer Systems Lecture 1 Wenbing Zhao Department of Electrical and Computer Engineering Cleveland State University [email protected] http://academic.csuohio.edu/zhao_w/teaching/EEC685-F05/eec685.htm (based on Dr. Raj jain’s lecture notes) 30 August 2005 EEC686/785 2 Wenbing Zhao Outline Syllabus Introduction to performance evaluation
Transcript of 2 Outline - Cleveland State University

1
EEC 686/785Modeling & Performance Evaluation of
Computer Systems
Lecture 1
Wenbing ZhaoDepartment of Electrical and Computer Engineering
Cleveland State [email protected]
http://academic.csuohio.edu/zhao_w/teaching/EEC685-F05/eec685.htm(based on Dr. Raj jain’s lecture notes)
30 August 2005 EEC686/785
2
Wenbing Zhao
Outline
SyllabusIntroduction to performance evaluation

2
30 August 2005 EEC686/785
3
Wenbing Zhao
Why Studying Performance Evaluation?
Performance is a key criterion in the design, procurement, and use of computer systemsThe goal of computer systems professionals is to get the highest performance for a given costTo achieve that goal, computer systems professions need at least a basic knowledge of performance evaluation terminology and techniques
30 August 2005 EEC686/785
4
Wenbing Zhao
Course ObjectiveYou will learn basic techniques that help solve a majority of day-to-day problems, such as:
Specifying performance requirementsEvaluating design alternativesComparing two or more systemsSystem tuning – determining optimal value of a parameterBottleneck identification Workload characterizationCapacity planning – determining number and sizes of componentsForecasting – predicting performance at future loads

3
30 August 2005 EEC686/785
5
Wenbing Zhao
Course Outline
Overview of performance evaluationMeasurement techniques and toolsProbability theory and statisticsExperimental design and analysisSimulationQueueing models
30 August 2005 EEC686/785
6
Wenbing Zhao
Course ProjectsSelect a system, for example:
Database, language compiler, text editor, processor
Do:Performance measurementsAnalyze the collected dataSimulateAnalytically model the subsystem
Prefer: Team of 2Goal: provide an insight (or information) not obvious before the project

4
30 August 2005 EEC686/785
7
Wenbing Zhao
Grading Policy
Grade components & relative weights:Assignments: 20% (individual work)Course project: 20% (team work)Midterm exams: 40% (20% each)Final exam: 20%Exams are all closed-book closed-notes, except that you can bring one page of formulas and definitions (US Letter size or smaller)
30 August 2005 EEC686/785
8
Wenbing Zhao
Grading PolicyDo not cheat!
Do not copy other student’s homework, exams or projectDo not copy someone else’s work found on the Internet
− Including project description and report− You can quote a sentence or two, but put those in quote and
give reference− Cite your references

5
30 August 2005 EEC686/785
9
Wenbing Zhao
Reference Texts
The Art of Computer Systems Performance Analysis: Techniques for Experimental Design, Measurement, Simulation, and Modeling, by Raj Jain, John Wiley & Sons, 1991Computer Systems Evaluation and Prediction , by Paul J. Fortier, and Howard E. Michael, Digital Press, 2003
30 August 2005 EEC686/785
10
Wenbing Zhao
MiscellaneousInstructor:
Dr. Wenbing Zhao− E-mail: [email protected]− Lecture hours:
MW 4:00-5:50pm− Office hours: TTh 4:00-6:00pm and by appointment
Course Web site:http://academic.csuohio.edu/zhao_w/teaching/EEC685-F05/eec685.htm
Lecture nodes and homework will be posted

6
30 August 2005 EEC686/785
11
Wenbing Zhao
Basic Terms
System: any collection of hardware, software, and firmwareMetrics: the criteria used to evaluate performance of the system and componentsWorkloads: the requests made by the users of the system
30 August 2005 EEC686/785
12
Wenbing Zhao
Basic Terms
Parameters: system and workload characteristics that affect the performance of the system
Example system parameters: − Quantum size for CPU allocation− Working set size for memory allocation
Example workload parameters:− Number of users, request arrival patterns, priority, etc.

7
30 August 2005 EEC686/785
13
Wenbing Zhao
Basic Terms
Factors: parameters that are varied in the studyOutliers: values that are too high or too low compared to a majority of values in a set
It may or may not be caused by a real system phenomenon
30 August 2005 EEC686/785
14
Wenbing Zhao
Basic Terms
Measurement:Simulation: the technique of representing the real world by a computer program. A simulation should imitate the internal processes and not merely the results of the thing being simulatedAnalytical modeling: a modeling technique that uses tools based on mathematical models such as queueing theory and stochastic processes

8
30 August 2005 EEC686/785
15
Wenbing Zhao
The Art of Performance Evaluation
Performance evaluation is an art. Like a work of art, successful evaluation cannot be produced mechanically
Every evaluation requires an intimate knowledge of the system being modeled and a careful selection of the methodology, workload, and toolsDefining the real problem and converting it to a form in which established tools and techniques can be used and where time and other constraints can be met is a major part of the analyst’s art.
30 August 2005 EEC686/785
16
Wenbing Zhao
The Art of Performance Evaluation
Given the same data, two analysts may interpret them differentExample: Comparing two systems. The throughputs of two systems A and B in transactions per second is as follows:
2010B1020A
Workload 2Workload 1System

9
30 August 2005 EEC686/785
17
Wenbing Zhao
The Art of Performance Evaluation
Three solutions:The two systems are equally good – compare the average of throughput
2010
Workload 2
1510B1520A
AverageWorkload 1System
30 August 2005 EEC686/785
18
Wenbing Zhao
The Art of Performance Evaluation
System A is better than B – compare the ratio with system B as the base
10.5
Workload 2
11B1.252A
AverageWorkload 1System

10
30 August 2005 EEC686/785
19
Wenbing Zhao
The Art of Performance Evaluation
System B is better than A – compare the ratio with system A as the base
Similar games can be played in: selection of workload, measuring the systems, presenting the results
21
Workload 2
1.250.5B11A
AverageWorkload 1System
30 August 2005 EEC686/785
20
Wenbing Zhao
Professional Organizations
ACM SIGMETRICSACM SIGSIMIEEE Computer Society: technical committee on simulationCMG: The Computer Measurement Group, In.
Practical uses of computer performanceRegional groups in the united states and abroad

11
30 August 2005 EEC686/785
21
Wenbing Zhao
Professional Organizations
IFIP Working Group 7.3IFIP = International Federation for Information ProcessingMultinational federation of technical societiesSeveral technical committees (TCs) and working groups (WGs)WG 7.3 is devoted to computer systems modeling
30 August 2005 EEC686/785
22
Wenbing Zhao
Professional Organizations
SCS: The Society for Computer SimulationPublishes simulation books, journalsSponsors a number of conferences
SIAM: The Society for Industrial and Applied Mathematics
Development of new mathematical techniquesJournals: SIAM journal on computing etc.
ORSA: The Operations Research Society of America

12
30 August 2005 EEC686/785
23
Wenbing Zhao
Conferences
ACM SIGMETRICSPERFORMANCE – IFIP Working Group 7.3 sponsored conferencesACM SIGSIM, IEEE and SCS conferences
30 August 2005 EEC686/785
24
Wenbing Zhao
JournalsPerformance Evaluation: published monthly by Elsevier Science PublishersSimulation: monthly by SCSTransactions of the Society for Computer SimulationSimulation Digest: by ACM SIGSIM and IEEE TC on SimulationSee also computer systems journals
IEEE Transactions on Software EngineeringIEEE Transactions on ComputersACM Transactions on Computer Systems

13
30 August 2005 EEC686/785
25
Wenbing Zhao
Common Mistakes in Performance Evaluation
No goalsNo general purpose model. Each model must be developed with a particular goal in mindTechniques, metrics, workload all depend upon the goalNot trivial
Biased goalsTo show that OUR system is better than THEIRSThe performance analyst’s role is like that of a jury (must be objective)
30 August 2005 EEC686/785
26
Wenbing Zhao
Common Mistakes in Performance Evaluation
Unsystematic approachSelecting system parameters, factors, metrics, and workloads arbitrarily will lead to inaccurate conclusionsShould identify a complete set of goals, system parameters, factors, metrics, and workloads
Analysis without understanding the problemA large share of the analysis effort goes in to defining a problemA problem well stated is half solved

14
30 August 2005 EEC686/785
27
Wenbing Zhao
Common Mistakes in Performance Evaluation
Incorrect performance metricsThe choice of correct performance metrics depends upon the services provided by the system or subsystem being modeled
− Comparing the MIPS of two different CPU architectures (e.g., RISC and CISC) is meaningless since the instructions on the two computers are equal
Unrepresentative workloadThe workload used to compare two system should be representative of the actual usage of the systems in the field
30 August 2005 EEC686/785
28
Wenbing Zhao
Common Mistakes in Performance Evaluation
Wrong evaluation techniqueThere are three evaluation techniques: measurement, simulation, and analytical modelingThere are a number of factors that should be considered in selecting the right technique
Overlook important parametersThe final outcome of the study depends heavily upon the parameters used Overlooking one or more important parameters may render the results useless

15
30 August 2005 EEC686/785
29
Wenbing Zhao
Common Mistakes in Performance Evaluation
Ignore significant factorsIt is important to identify those parameters, which, if varied, will make a significant impact on the performanceFactors that are under the control of the end user and can be easily changed by the end user should be given preference over those that cannot be changedFor unknown parameters, a sensitivity analysis, which shows the effect of changing those parameters from their assumed values,, should be done to quantify the impact of the uncertainty
30 August 2005 EEC686/785
30
Wenbing Zhao
Common Mistakes in Performance Evaluation
Inappropriate experimental designExperimental design relates to the number of measurement or simulation experiments to be conducted and the parameter values used in each experimentIn naïve experimental design, each factor is changed one by one. This simple design may lead to wrong conclusions if the parameters interact with each otherShould use full factorial experimental designs and fractional factorial designs

16
30 August 2005 EEC686/785
31
Wenbing Zhao
Common Mistakes in Performance Evaluation
Inappropriate level of detailThe level of detail used in modeling a system has a significant impact on the problem formulationAvoid formulations that are either too narrow or too broad
No analysisIt is not adequate to collect enormous amounts of data without appropriate analysis and interpretation of the results
Erroneous analysisDon’t make the common mistakes such as taking average of ratios and too short simulation
30 August 2005 EEC686/785
32
Wenbing Zhao
Common Mistakes in Performance Evaluation
No sensitivity analysisThe analysis results may be sensitive to the workload and system parametersWithout a sensitivity analysis, one cannot be sure if the conclusions would change if the analysis was done in a slightly different setting
Ignoring errors in inputOften the parameters of interest cannot be measured. Instead, another variable that can be measured is used to estimate the parameterSuch situations introduce additional uncertainties in the input data. The analyst needs to adjust the level of confidence on the model output obtained from such data

17
30 August 2005 EEC686/785
33
Wenbing Zhao
Common Mistakes in Performance Evaluation
Improper treatment of outliersIt requires careful understanding of the system being modeled to decide if an outlier is caused by a real system phenomenon
Assuming no change in the futureThe future workload and system behavior might change and therefore, the analyst should limit the amount of time into the future that predications are made
Ignoring variabilityIt is common to analyze only the mean performance since determining the variability is difficultHowever, the mean alone may be misleading if the variability is high
30 August 2005 EEC686/785
34
Wenbing Zhao
Common Mistakes in Performance Evaluation
Too complex analysisGiven two analyses leading to the same conclusion, one that is simpler and easier to explain is obviously preferableIt is better to start with simple models of experiments, get some results or insights, and then introduce the complications
Improper presentation of resultsTo convey or selling the analysis results, it requires the prudent use of words, pictures, and graphs to explain the results and analysisThe right metric to measure the performance of an analyst is not the number of analyses performed but the number of analyses that helped the decision makers

18
30 August 2005 EEC686/785
35
Wenbing Zhao
Common Mistakes in Performance Evaluation
Ignoring social aspectsSuccessful presentation of the analysis results requires two types of skills: social and substantiveWriting and speaking are social skills while modeling and data analysis are substantive skills
Omitting assumptions and limitationsOmitting assumptions and limitations may lead the user to apply the analysis to another context where the assumptions will not be valid
30 August 2005 EEC686/785
36
Wenbing Zhao
A Systematic Approach to Performance Evaluation
1. State goals and define the system2. List services and outcomes3. Select metrics4. List parameters5. Select factors to study6. Select evaluation technique 7. Select workload8. Design experiments9. Analyze and interpret data10. Present results
19
30 August 2005 EEC686/785
37
Wenbing Zhao
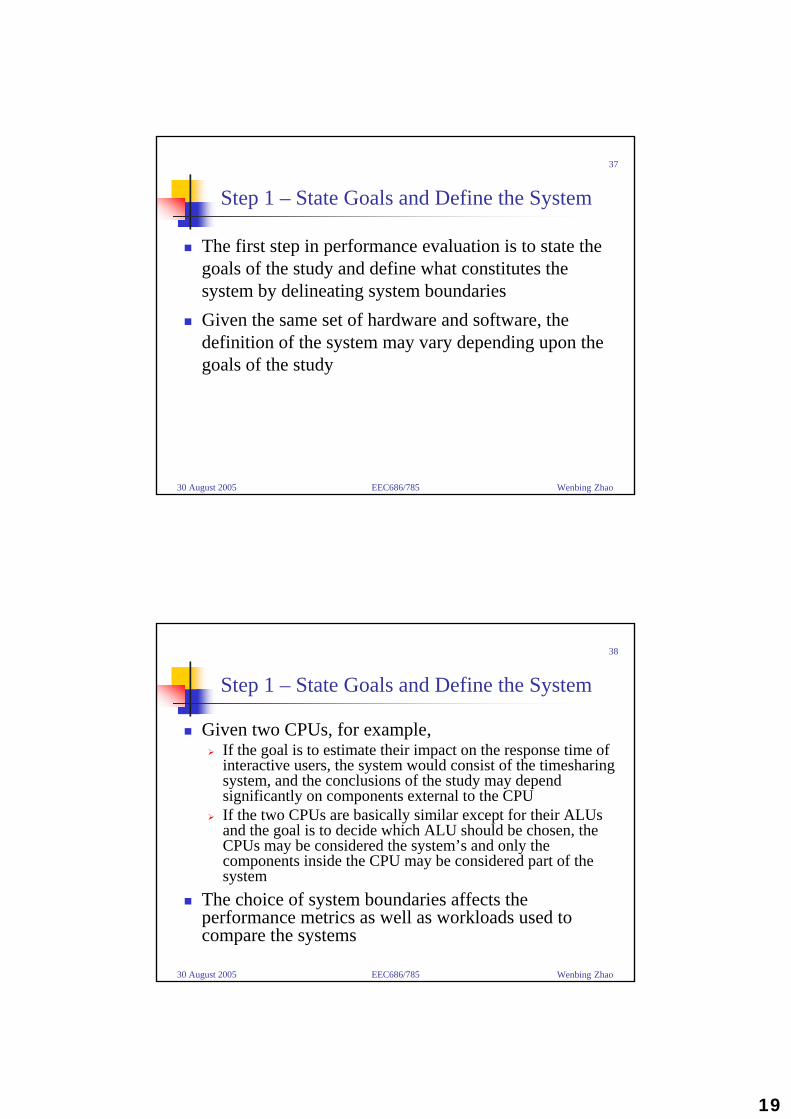
Step 1 – State Goals and Define the System
The first step in performance evaluation is to state the goals of the study and define what constitutes the system by delineating system boundariesGiven the same set of hardware and software, the definition of the system may vary depending upon the goals of the study
30 August 2005 EEC686/785
38
Wenbing Zhao
Step 1 – State Goals and Define the System
Given two CPUs, for example, If the goal is to estimate their impact on the response time of interactive users, the system would consist of the timesharing system, and the conclusions of the study may depend significantly on components external to the CPUIf the two CPUs are basically similar except for their ALUsand the goal is to decide which ALU should be chosen, the CPUs may be considered the system’s and only the components inside the CPU may be considered part of the system
The choice of system boundaries affects the performance metrics as well as workloads used to compare the systems

20
30 August 2005 EEC686/785
39
Wenbing Zhao
Step 2 – List Services and Outcomes
Each system provides a set of services, for example:
A computer network allows its users to send packets to specified destinationsA database system responds to queries
The second step in analyzing a system is to list these services
30 August 2005 EEC686/785
40
Wenbing Zhao
Step 2 – List Services and Outcomes
When a user requests any of these services, there are a number of possible outcomesFor example, a database system may answer a query
CorrectlyIncorrectly (due to inconsistent updates)Or not at all (due to deadlocks or some similar problems)
A list of services and outcomes is useful later in selecting the right metrics and workload

21
30 August 2005 EEC686/785
41
Wenbing Zhao
Step 3 – Select Metrics
Select criteria to compare the performance. These criteria are called metricsIn general, the metrics are related to the speed, accuracy, and availability of services, for example:
The performance of a network is measured by the speed (throughput and delay), accuracy (error rte), and availability of the packets sent
30 August 2005 EEC686/785
42
Wenbing Zhao
Step 4 – List ParametersMake a list of all the parameters that affect performanceThe list can be divided into system parameters and workload parametersSystem parameters include both hardware and software parameters => generally do not vary among various installations of the systemWorkload parameters are characteristics of users’ requests => vary from one installation to the nextThe list of parameters may not be complete during the first passof the analysis. Additional parameters might be discovered aftereach pass

22
30 August 2005 EEC686/785
43
Wenbing Zhao
Step 5 – Select Factors to StudyThe list of parameters can be divided into two parts:
Those that will be varied during the evaluationThose that will not
The parameters to be varied are called factors and their values are called levelsIt is better to start with a short list of factors and a small number of levels for each factor and to extend the list in the next phaseThe parameters that are expected to have a high impact on the performance should be preferably selected as factors
30 August 2005 EEC686/785
44
Wenbing Zhao
Step 6 – Select Evaluation Technique
The three broad techniques for performance evaluation are analytical modeling, simulation and measuring a real systemThe selection of the right technique depends upon the time and resources available to solve the problem and the desired level of accuracy

23
30 August 2005 EEC686/785
45
Wenbing Zhao
Step 7 – Select WorkloadThe workload consists of a list of service requests to the systemDepending upon the evaluation technique chosen, the workload may be expressed in different form:
For analytical modeling => as a probability of various requestsFor simulation => a trace of requests measured on a real systemFor measurement => user scripts to be executed on the systems
It is essential that the workload be representative of the system usage in real life
30 August 2005 EEC686/785
46
Wenbing Zhao
Step 8 – Design Experiments
Decide on a sequence of experiments that offer maximum information with minimal effortIn practice, it is useful to conduct an experiment in two phases
In first phase, the number of factors may be large but the number of levels is small => to determine the relative effect of various factorsIn second phase, the number of factors is reduced and the number of levels is increased

24
30 August 2005 EEC686/785
47
Wenbing Zhao
Step 9 – Analyze and Interpret Data
Interpreting the results of an analysis is a key part of the analyst’s artAnalysis only produces results and not conclusionsOutcomes of measurements and simulations are random quantities. In comparing two alternatives, it is necessary to take into account the variability of the results
30 August 2005 EEC686/785
48
Wenbing Zhao
Step 10 – Present Results
The final step is to communicate the results to other members of the decision-making team.It is useful to present the results in graphic form and without statistical jargonAt this point, the knowledge gained may prompt the analyst to go back and reconsider some of the decisions made in previous steps. The complete project might consists several cycles through the steps