2 nd Annual Workshop Innovations In NAS-Wide Simulation In Support Of NextGen Benefits
44
Innovative Solutions for Aviation 2 nd Annual Workshop Innovations In NAS-Wide Simulation In Support Of NextGen Benefits January 2010 Kenny Martin
-
Upload
porter-wright -
Category
Documents
-
view
29 -
download
0
description
2 nd Annual Workshop Innovations In NAS-Wide Simulation In Support Of NextGen Benefits. January 2010 Kenny Martin. NextGen Requirements. Functional Requirements Of NextGen Cross-Cutting Infrastructure/Enabler Programs ADSB SWIM DataComm NextGen Network Enabled Weather (NNEW) - PowerPoint PPT Presentation
Transcript of 2 nd Annual Workshop Innovations In NAS-Wide Simulation In Support Of NextGen Benefits
Innovative Solutions for Aviation
2nd Annual WorkshopInnovations In NAS-Wide
SimulationIn Support Of NextGen Benefits
January 2010Kenny Martin

Innovations In NAS-Wide SimulationGMU Jan 27/28 2010
© 2010 – ISA Software
Innovative Solutions for Aviation
NextGen Requirements
Functional Requirements Of NextGenCross-Cutting Infrastructure/Enabler Programs
ADSBSWIMDataCommNextGen Network Enabled Weather (NNEW)NAS Voice SwitchRNAV/RNP
Solution SetsTBO Trajectory Based
ManagementCATM Collaborative ATMHD High Density AirportsFLEX Flexible Terminals &
AirportsRWI Reduce Weather ImpactsSSE Safety, Security,
Environmental PerformanceFAC Transform Facilities

Innovations In NAS-Wide SimulationGMU Jan 27/28 2010
© 2010 – ISA Software
Innovative Solutions for Aviation
ISA Software NextGen ActivitiesCross-Cutting Infrastructure/Enabler Programs
ADSBSWIMDataCommNextGen Network Enabled Weather
(NNEW)NAS Voice SwitchRNAV/RNP
Solution SetsTBO Trajectory Based
ManagementCATM Collaborative ATMHD High Density AirportsFLEX Flexible Terminals &
AirportsRWI Reduce Weather
ImpactsSSE Safety, Security,
Environmental PerformanceFAC Transform Facilities
ISA Software Modeling Approach

Innovations In NAS-Wide SimulationGMU Jan 27/28 2010
© 2010 – ISA Software
Innovative Solutions for Aviation
Approach To System-Wide AnalysisSimulation Platform
CHILLSimulation Components
RAMS Plus NAS-Wide Fast-Time ModelMulti-Sector PlannerTrajectory BuilderConflict Detection & Resolution ComponentsMONACO user-preferred flight plan
optimizationComplexity Analysis toolEvaluator Metrics Assessment
Recent Example ApplicationsMSP Coordination AnalysisTBO in High Performance Airspace (HPA)SESAR Collaborative Network Planning
(Gaming)ADSB 3nm Separation AssessmentDataComm Segment 1 BenefitsSupersonic Aircraft Impact Assessment
ISA Software Modeling Approach

Innovations In NAS-Wide SimulationGMU Jan 27/28 2010
© 2010 – ISA Software
Innovative Solutions for Aviation
CHILL Agent-Based Modeling
What is CHILL?Collaborative Human In the Loop Laboratory,
supportingSystem-wide, Networked Agent-based Modelling
Platform Implements SWIM and NNEW FunctionalitiesModel-based and/or HITL (Gaming) Studies
Collaborative ATMTrajectory-Based OperationsMulti-Sector Planner MONACO system-wide DCB optimizationUser-Preferred Problem SolvingEvaluator Metrics Assessment

Innovations In NAS-Wide SimulationGMU Jan 27/28 2010
© 2010 – ISA Software
Innovative Solutions for Aviation
Features of CHILLVersatile collaborative platform for validation of
advanced Air Traffic Management conceptsEvaluate traffic demand and airspace/airport
conditions, to support collaborative decision-making processes
Promoting common situational awareness through SWIM
Rapid sharing of changes to airspace, airport and traffic conditions to all subscribers
Adapt CATM service based on operator preferencesMaximize user opportunities to propose problem
solutions Identify optimal solutions from multiple agents /
participantsProvide up to date and timely picture of the entire
ATM network in support of collaborative traffic management initiatives that maximize airspace capacity and improve operational efficiency
On-Demand NAS-Wide metrics
CHILL Main Features

Innovations In NAS-Wide SimulationGMU Jan 27/28 2010
© 2010 – ISA Software
Innovative Solutions for Aviation
CHILL : Flexible Situation Awareness
Flow Oriented AnalysisProviding instantaneous information on a system-
wide perspectiveWithin any 4-dimensional element (airport,
sector, FEA, FCA, waypoint, SUA, weather volume etc.)
Quantify demand against available service levels in support of collaborative Demand-Capacity management
Simple (GUI-based) or declarative language based flows
Management solutions applied to all/part of any flow

Innovations In NAS-Wide SimulationGMU Jan 27/28 2010
© 2010 – ISA Software
Innovative Solutions for Aviation
CHILL : Traffic Management Planning
Service-Oriented SolutionsMatching service levels to demandAllow all participants including airspace users to
assess potential overload issues togetherSupporting other capacity metrics
Workload, Complexity, Fuel, Emissions…Applying user-preferred management initiativesProviding interactive trial planning featuresAssisting capacity balancing through automated
toolsDiverse set of solutions supported:
Dynamic Airspace AllocationUser-preferred rerouting Optimization of multiple rerouting portfoliosMulti-pass flight dispatching and slot
managementMIT or Time-base MeteringEquitable distribution of penaltiesFine-tuning capabilities for improving efficiency

Innovations In NAS-Wide SimulationGMU Jan 27/28 2010
© 2010 – ISA Software
Innovative Solutions for Aviation
CHILL Mixed Fidelity Modeling
Macroscopic and Microscopic AgentsMatching fidelity of the model(s) to the validation
requirementsExample: RAMS Plus representing a range of
fidelity

Innovations In NAS-Wide SimulationGMU Jan 27/28 2010
© 2010 – ISA Software
Innovative Solutions for Aviation
FAA Multi-Sector Planner (MSP)High Performance Airspace : TBO AssessmentNASA N+3 Supersonic Aircraft Impact AssessmentADSB 3nm SeparationDataComm Benefits AnalysisSESAR Trajectory-based ATM ConceptsSESAR ‘Episode III’ Collaborative Airspace/Network Management Validation
Recent Validation Experiments
Innovations In NAS-Wide SimulationGMU Jan 27/28 2010
© 2010 – ISA Software
Innovative Solutions for Aviation
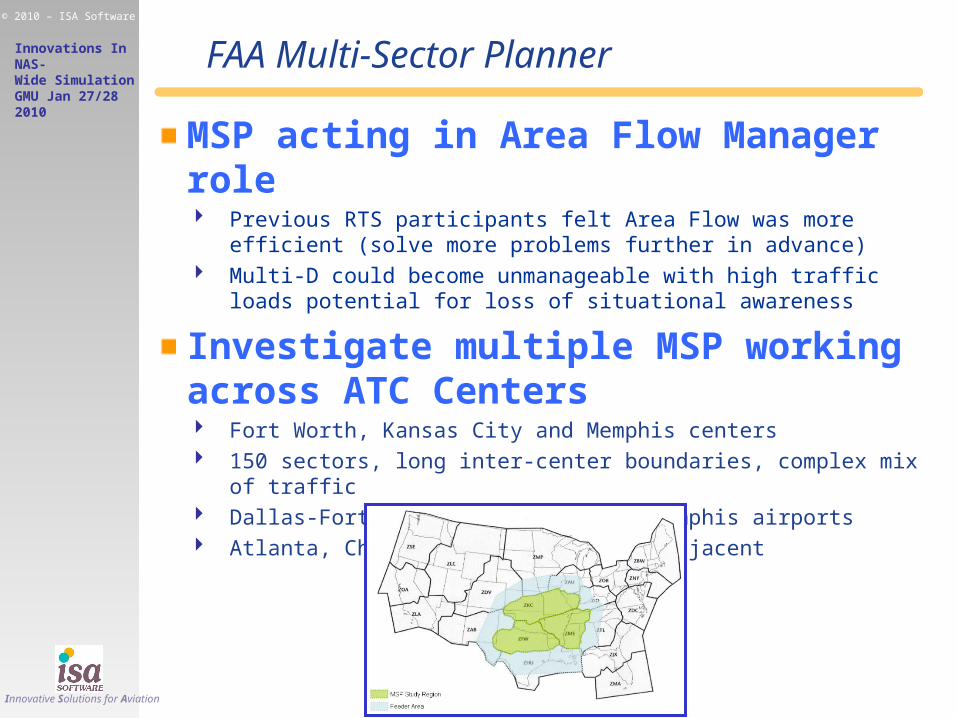
MSP acting in Area Flow Manager role Previous RTS participants felt Area Flow was more efficient
(solve more problems further in advance) Multi-D could become unmanageable with high traffic loads
potential for loss of situational awareness
Investigate multiple MSP working across ATC Centers Fort Worth, Kansas City and Memphis centers 150 sectors, long inter-center boundaries, complex mix of traffic Dallas-Fort Worth, St. Louis and Memphis airports Atlanta, Chicago, Houston, Denver adjacent
FAA Multi-Sector Planner

Innovations In NAS-Wide SimulationGMU Jan 27/28 2010
© 2010 – ISA Software
Innovative Solutions for Aviation
Modeled 50 adjacent MSP’s Sectors grouped based on traffic flows for high and super-high
airspace Major terminal regions excluded as they would have their own
DST’s
FL240-245 FL345+
FAA Multi-Sector Planner

Innovations In NAS-Wide SimulationGMU Jan 27/28 2010
© 2010 – ISA Software
Innovative Solutions for Aviation
Complex Experimental Platform 150 executive ATC controllers modeled using RAMS Plus agents 4 Major airports (DFW, DAL, STL, MEM) also modeled with RAMS Plus CHILL’s MSP Component: 50 MSPs MSP Workload Model Many agents with different levels of fidelity SIM-C (SWIM) Component Underlying Messaging Via SENS for service discovery / message
exchange
FAA Multi-Sector Planner
Innovations In NAS-Wide SimulationGMU Jan 27/28 2010
© 2010 – ISA Software
Innovative Solutions for Aviation
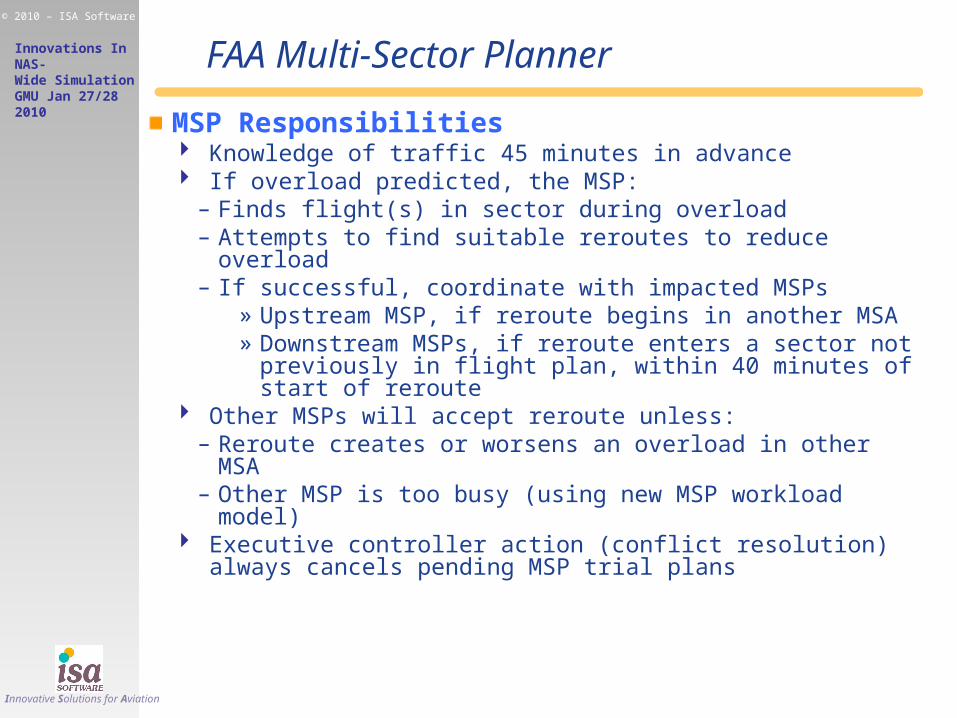
MSP Responsibilities Knowledge of traffic 45 minutes in advance If overload predicted, the MSP:
– Finds flight(s) in sector during overload– Attempts to find suitable reroutes to reduce overload– If successful, coordinate with impacted MSPs
» Upstream MSP, if reroute begins in another MSA» Downstream MSPs, if reroute enters a sector not
previously in flight plan, within 40 minutes of start of reroute
Other MSPs will accept reroute unless:– Reroute creates or worsens an overload in other MSA– Other MSP is too busy (using new MSP workload
model) Executive controller action (conflict resolution) always
cancels pending MSP trial plans
FAA Multi-Sector Planner

Innovations In NAS-Wide SimulationGMU Jan 27/28 2010
© 2010 – ISA Software
Innovative Solutions for Aviation
Key Findings Traffic balance improved with MSP: Stdev of peak % of MAP
reduced by 50%.
FAA Multi-Sector Planner
12
:45
13
:15
13
:45
14
:15
14
:45
15
:15
15
:45
16
:15
16
:45
17
:15
17
:45
18
:15
18
:45
19
:15
19
:45
20
:15
20
:45
21
:15
21
:45
22
:15
22
:45
23
:15
23
:45
0:1
5
5
10
15
20
25
30
ZKC30 TimelinePlus40 MSP/NoMSP Scenarios
NoMSP MSP MAP (=19)
NFlights In Sector
Change as % of MAP
Change as % of MAP
12
:45
13
:15
13
:45
14
:15
14
:45
15
:15
15
:45
16
:15
16
:45
17
:15
17
:45
18
:15
18
:45
19
:15
19
:45
20
:15
20
:45
21
:15
21
:45
22
:15
22
:45
23
:15
23
:45
0:1
5
-8
-6
-4
-2
0
2
4
6
8
-45%
-35%
-25%
-15%
-5%
5%
15%
25%
35%
45%
Change in Peak Number of Flights Per 15 Minute PeriodZKC30, Plus40 NoMSP to MSP Scenarios
Change in Peak Flights Change as % of MAP

Innovations In NAS-Wide SimulationGMU Jan 27/28 2010
© 2010 – ISA Software
Innovative Solutions for Aviation
Key Findings Overloads for entire region significantly reduced by MSP in all
scenarios – More than 10x Reduction with traffic+40% scenario
FAA Multi-Sector Planner
ETMSInitial Baseline Plus20 Plus400
1000
2000
3000
4000
5000
210650
2089
4880
18 92387
1 Minute Periods
ETMSInitial Baseline Plus20 Plus400
50
100
150
200
250
10
39
109
243
1 4
6+ Minute Periods
Tactical Only With MSP
Minutes Above the MAPAll Centers Combined
MSPNo MSP

Innovations In NAS-Wide SimulationGMU Jan 27/28 2010
© 2010 – ISA Software
Innovative Solutions for Aviation
Key Findings Traffic Demand across region is significantly better balanced
– Example: Core 12-hour analysis period with traffic+40% scenario
FAA Multi-Sector Planner
Plus40 NoMSP Plus40 MSP
SECTORS

Innovations In NAS-Wide SimulationGMU Jan 27/28 2010
© 2010 – ISA Software
Innovative Solutions for Aviation
Key Findings Around 50% of flight plan uplinks require coordination with ATC
in another ATC center
FAA Multi-Sector Planner
51%
5%7%
17%
3%
17%
ZFW
1%
63%5%
1%
18%
2%6%
4%0%
ZKC
17%
8%
49%
1%
1%
8%
18%
ZME
ZFW ZKC ZME ZAB ZAU
ZDV ZHU ZID ZMP ZTL
Inter-Center Coordination
Percent of Trial Plans Uplinked by Centerfor each Initiating Center

Innovations In NAS-Wide SimulationGMU Jan 27/28 2010
© 2010 – ISA Software
Innovative Solutions for Aviation
FAA TBO in High Performance Airspace HPA ConOps relies heavily on TBO HPA is defined as FL 340+ Airspace based on generic sectors and flexible
airspace design principles TBO aircraft are RNAV and DataComm equipped 4D Trajectories
– Basis for planning and control– Sent and received independently of ground
navaids.– Include Controlled Time of Arrivals (CTA) at the
entry and the exit of the high altitude airspace Intermediate waypoints CTA’s, if optionally defined,
have less restrictive timing constraints
High Performance Airspace: TBO

Innovations In NAS-Wide SimulationGMU Jan 27/28 2010
© 2010 – ISA Software
Innovative Solutions for Aviation
Study Objectives Understand the expected benefits and risks on
both users and service providers in terms of:– Capacity and throughput– Users operational cost in terms of punctuality, travel
distance and fuel consumption– Sector conflict density and traffic complexity inherent
to freedom to navigate outside structured routes. Implement a set of metrics to quantify:
– Conflict geometry and attitude distribution– Traffic density and controlled flight hours in a given
volume– Variation of demand and average transit time in a
given volume
High Performance Airspace: TBO

Innovations In NAS-Wide SimulationGMU Jan 27/28 2010
© 2010 – ISA Software
Innovative Solutions for Aviation
Modeling Approach Use of Navigation Reference System
(NRS) as the primary blueprint for direct routing in the high altitude airspace
High Performance Airspace: TBO

Innovations In NAS-Wide SimulationGMU Jan 27/28 2010
© 2010 – ISA Software
Innovative Solutions for Aviation
TBO Application Every TBO aircraft follows a direct route in the high altitude
airspace The two nodes of the direct routes are located by their
respective NRS points TBO aircraft may still contain structured routes when passing
through non-high altitude airspace Separation standards remain the same: 5 miles laterally/ 1000
feet vertically
Entry Exit
High Performance Airspace: TBO

Innovations In NAS-Wide SimulationGMU Jan 27/28 2010
© 2010 – ISA Software
Innovative Solutions for Aviation
Validation Status Initial (baseline and variant) scenarios
completed Metrics being reviewed with sponsors Initial report in progress Work will continue through 2010
High Performance Airspace: TBO

Innovations In NAS-Wide SimulationGMU Jan 27/28 2010
© 2010 – ISA Software
Innovative Solutions for Aviation
NASA ‘N+3’ Supersonic
Objectives NASA research contract to investigate
environmentally friendly supersonic airframe and propulsion concepts
Develop technology maturation plans to make the concept a reality
Goals: Achieve a NextGen Integrated Advanced Vehicle
Concept - Operational in the 2030 – 2035 timeframe Assess the impact of the introduction of such
vehicles within the NAS - Benefits, complexity, interaction with other
traffic, possible ATC issues…

Innovations In NAS-Wide SimulationGMU Jan 27/28 2010
© 2010 – ISA Software
Innovative Solutions for Aviation
NASA ‘N+3’ Supersonic
Experimental objective Develop N+3 aircraft performance models Incorporate N+3 operations in the traffic
forecast Evaluate the impact of N+3 aircraft in the
NAS Assuming the re-introduction of supersonic
aircraft in the future NAS, what is the likely impact on:
– Traffic in the initial acceleration phase (around 10000ft) – Traffic in the second acceleration phase (23000ft and
climb to supersonic)– Air traffic complexity due to the N+3 traffic– Controller workload due to special procedures required to
handle supersonic aircraft

Innovations In NAS-Wide SimulationGMU Jan 27/28 2010
© 2010 – ISA Software
Innovative Solutions for Aviation
NASA ‘N+3’ Supersonic
N+3 Aircraft Performance Introduce supersonic aircraft performance
models - based on N+3 aircraft mission profiles supplied by LM-Aero
team - carefully calibrated to be representative of expected
performance
N+3 fast/time model climb-phase mission profiles (compared to A320 in orange)
Comparison of LM-NASA & RAMS Mission Profile Altitude (Climb Phase)
0
10000
20000
30000
40000
50000
60000
70000
0 200 400 600 800 1000 1200 1400 1600 1800Mission Time (s)
Alt
itu
de
(Ft)
"LM/Nasa Mission Profile"
"RAMS Mission Profile"
"RAMS A320 Mission Profile"
Comparison of LM-NASA & RAMS Mission Profile Distance (Climb Phase)
0
50
100
150
200
250
300
0 200 400 600 800 1000 1200 1400 1600 1800Mission Time (s)
Dis
tan
ce (
NM
)
"LM/Nasa Mission Profile"
"RAMS Mission Profile"
"RAMS A320 Mission Profile"
Comparison of LM-NASA & RAMS Mission Profile Speed (Climb Phase)
0
200
400
600
800
1000
0 200 400 600 800 1000 1200 1400 1600 1800Mission Time (s)
Sp
eed
(K
ts)
"LM/Nasa Mission Profile"
"RAMS Mission Profile"
"RAMS A320 Mission Profile"

Innovations In NAS-Wide SimulationGMU Jan 27/28 2010
© 2010 – ISA Software
Innovative Solutions for Aviation
NASA ‘N+3’ Supersonic
N+3 Aircraft Performance Descent Phases Also Represented
N+3 fast/time model descent-phase mission profiles (compared to A320 in orange)
Comparison of LM-NASA & RAMS Mission Profile Distance (Descent Phase)
1900
1950
2000
2050
2100
2150
2200
8000 8200 8400 8600 8800 9000 9200 9400 9600Mission Time (s)
Dis
tan
ce (
NM
)
"LM/Nasa Mission Profile"
"RAMS Mission Profile"
A320 not included (still in enroute phase)
Comparison of LM-NASA & RAMS Mission Profile Speed(Descent Phase)
0
100
200
300
400
500
600
700
800
900
1000
1100
7800 8000 8200 8400 8600 8800 9000 9200 9400 9600Mission Time (s)
Sp
eed
(K
ts)
"LM/Nasa Mission Profile"
"RAMS Mission Profile"
"RAMS A320 Mission Profile"
A320 'adjusted'arrival time
Comparison of LM-NASA & RAMS Mission Profile Altitude (Descent Phase)
0
10000
20000
30000
40000
50000
60000
70000
7800 8000 8200 8400 8600 8800 9000 9200 9400 9600Mission Time (s)
Alt
itu
de (
Ft)
"LM/Nasa Mission Profile"
"RAMS Mission Profile"
"RAMS A320 Mission Profile"
A320 'adjusted'arrival time

Innovations In NAS-Wide SimulationGMU Jan 27/28 2010
© 2010 – ISA Software
Innovative Solutions for Aviation
NASA ‘N+3’ Supersonic
N+3 Potential Operations Operational Range around 6500NM with 200
passengers Potential Applications
» Major International Routes » Economically Viable Domestic Routes
Research from the US OTA ‘Impact of Advanced Aircraft Technology’ report [Princeton, 1980] chapter 3 (variables affecting a supersonic transport market) suggests that
“ An aircraft’s product is passenger (/ cargo) miles”
“ There are 2 ways to improve productivity: 1) larger aircraft (more seats – same flying time) 2) faster aircraft (same seats – shorter flying time)”
Both will improve the metric “PAX miles per hour”

Innovations In NAS-Wide SimulationGMU Jan 27/28 2010
© 2010 – ISA Software
Innovative Solutions for Aviation
NASA ‘N+3’ Supersonic
Traffic based on 2008 ASDI recordings Cloned based on MITRE forecasts (approx
2% growth per year) to achieve 2030 traffic
Airspace from current NAS (2008) 5NM separation standard No additional ATC/ATM concepts included
Metrics to evaluate Traffic interactions (N+3 vs Conventional
conflicts, particularly in acceleration phases) ATC Complexity ATC Controller workload Delays / On-Time arrival (particularly for
N+3 operations)

Innovations In NAS-Wide SimulationGMU Jan 27/28 2010
© 2010 – ISA Software
Innovative Solutions for Aviation
NASA ‘N+3’ Supersonic
Current Status Baseline 2030 (no supersonic) and variant
(conventional + supersonic) scenarios completed
Results being reviewed with contractual partners
Final report due for publication end Feb 2010
Examples of potential International and Domestic Supersonic routes

Innovations In NAS-Wide SimulationGMU Jan 27/28 2010
© 2010 – ISA Software
Innovative Solutions for Aviation
ADSB 3nm Separation
ADSB 3nm Separation Problem Statement: Quantify Benefits of
ADS-B In Terms of Reduction in En-route Separation
Questions To Be Answered In terms of system throughput, do
flights get through the system with less delay?
How Do The Delay Benefits Reduce As With 3nm Flight Level Ceiling is lowered?
Key Assumptions Enroute Separations Drive The
Alternative Cases ADSB Is Modeled As An Enabler However: No Future Anticipated
NextGen ConOps Behavior Is Introduced

Innovations In NAS-Wide SimulationGMU Jan 27/28 2010
© 2010 – ISA Software
Innovative Solutions for Aviation
ADSB 3nm Separation
ADSB NAS-Wide Scenario Traffic Demand
2012: 60,699 Flights 2017: 67,180 Flights
Full NAS Sectorization 4D Flight Profiles 4D Conflict Probe Wake Separations Conflict Resolutions
Closely Spaced Parallel Routes
Airport Capacity Model

Innovations In NAS-Wide SimulationGMU Jan 27/28 2010
© 2010 – ISA Software
Innovative Solutions for Aviation
ADSB 3nm Separation
Airport Capacity Modelling Focus On OEP Airports For Metric Generation Used ATO-F FACT2 Arr/Dep Rates (arr/dep
ops/hr) Rates => Input To Airport’s Time-Based
Metering Feature Benefits
Ensures Aircraft Enter Enroute At Realistic Rate
Eliminates Need For Detailed Airport/Runway Operations In An Enroute View

Innovations In NAS-Wide SimulationGMU Jan 27/28 2010
© 2010 – ISA Software
Innovative Solutions for Aviation
ADSB 3nm Separation
ADSB Results ADSB Metrics
Enroute & Arrival Delay Sector Loadings
ADSB Findings Reduced Separations Allow Flights To Get
Through the Enroute Faster. Some of the gain/benefit is lost in transition
from Enroute to Airport. Overall System Benefits Remains With
Reduced Separations

Innovations In NAS-Wide SimulationGMU Jan 27/28 2010
© 2010 – ISA Software
Innovative Solutions for Aviation
DataComm – Segment 1 Benefits
Datacomm Segment 1 Benefits Focus On Controller Communications
Voice Vs DCL Revised Departure Clearance
Scope: IAH Airport Ground Movements Gate, Runway , SID/STAR Operations
Question To Answer: Do DCL-Equipped Aircraft Take Off Any Faster Than Non-Equipped Aircraft in a revised departure clearance situation?

Innovations In NAS-Wide SimulationGMU Jan 27/28 2010
© 2010 – ISA Software
Innovative Solutions for Aviation
DataComm – Segment 1 Benefits
Datacomm Segment 1 Benefits Revised Departure Clearance Situation
High TMI Day When Departure Gates Are Closed
Example: Northern Flows (departure gates) from IAH into DFW are closed.
Revised departure clearances necessary for all flights using the closed gates who have received their PDC (pre-departure clearance)
Today’s situation requires controller to go sequentially down a list of flights and transact the revised clearance departure by voice.
This results in a significant taxi-out delay.

Innovations In NAS-Wide SimulationGMU Jan 27/28 2010
© 2010 – ISA Software
Innovative Solutions for Aviation
DataComm – Segment 1 Benefits
Datacomm Segment 1 Benefits Locations Of Flights When Revised
Departure Clearances Are Needed

Innovations In NAS-Wide SimulationGMU Jan 27/28 2010
© 2010 – ISA Software
Innovative Solutions for Aviation
DataComm – Segment 1 Benefits
Datacomm Segment 1 Process Scenarios
Equipage at 0%, 30%, 60% and 100% Baseline against “good” day, and then
instigate convective weather impacts. Simulate IAH, and metroplex
IAD/BWI/DCA Design Extrapolation Process For NAS-
Wide Benefits in support of FID. Current Status
Airport Simulation Results In Progress Extrapolation Process Being Designed

Innovations In NAS-Wide SimulationGMU Jan 27/28 2010
© 2010 – ISA Software
Innovative Solutions for Aviation
SESAR Trajectory-based ATM
Objectives Based on 2012 traffic in the European Airspace
investigate the feasibility, impact and potential benefit of 4D Trajectory-based operations:
– Using pre-flight Target Time of Arrival (TTA) for Capacity Demand Planning (Reference Business Trajectory RBT-Constraints)
– Using revised TTA’s following take-off– Allocating dynamic Controlled Time of Arrival (CTA)
for key points during flight (e.g. entry to arrival management systems)
– Using aircraft performance variation to try to respect TTA’s of all kinds.

Innovations In NAS-Wide SimulationGMU Jan 27/28 2010
© 2010 – ISA Software
Innovative Solutions for Aviation
SESAR Trajectory-based ATM
Modeling Features RBT (pre take-off) constraint modelling TTA model including heuristic and deterministic a/c
performance management to respect target time ‘windows’
FMS model to incorporate different TTA capabilities Dynamic CTA modeling including time-base meters
for entry to TMA system models Unexpected weather / other noise modeling to
perturb TTA plans Impact of Non-homogeneous traffic mix (e.g. FMS-
based CTA capable, Manual CTA with ATC assistance, non-compliant)
TTA compliance cancelled during ATC separation intervention
TTA recovery mode (if possible) following resolution

Innovations In NAS-Wide SimulationGMU Jan 27/28 2010
© 2010 – ISA Software
Innovative Solutions for Aviation
SESAR Trajectory-based ATM
Typical Metrics Considered Conformance to initial target time constraints Conformance to TTA following take-off Impact of departure (taxi/take-off queue) delay Dynamic CTA conformance Failures to achieve dynamic CTA (+ reasons) Impact of ATC Intervention Ability to recover TTA following interventions Compliance rates
– With speed management– Without speed management– Average speed changes
Impact of ‘unexpected weather’ + recovery rates Impact on fuel use ATC workload due to target time management

Innovations In NAS-Wide SimulationGMU Jan 27/28 2010
© 2010 – ISA Software
Innovative Solutions for Aviation
SESAR Trajectory-based ATM
Status Initial report delivered to client Awaiting formal feedback Recommendations include
– Additional experiments to include improved TFM / AMAN models
– Improved fuel assessment models– Enhancement of modeling features

Innovations In NAS-Wide SimulationGMU Jan 27/28 2010
© 2010 – ISA Software
Innovative Solutions for Aviation
SESAR Episode II Gaming Exercises
Gaming Exercises For SESAR/EP3 Validation of Concepts Analysis of SESAR Airspace Management Concepts
using Interactive Gaming Scenarios Evaluation of different gaming strategies Supported 6-8 operational (HITL) positions 1 Game master, 1 Network Manager, 1 Regional
Manager, 1 Military, 2 AOC positions Final report currently in review by European
Commission

Innovations In NAS-Wide SimulationGMU Jan 27/28 2010
© 2010 – ISA Software
Innovative Solutions for Aviation
Future Activities
What’s Planned For 2010? Additional MSP Simulations
– Expand 2008 MSP Analysis to NAS-Wide– Consider Data Com between Flight deck and MSP
Assessment of UAV impacts in The NAS Continue TBO Validation Data Com Segment 1 & Segment 2 Benefits Support to SESAR system-wide TBM concept
validation
Benefits To NextGen Modeling Efforts Continued Development & Enhancement Of CHILL-
compatible tools Integration of 3rd Party Tools Within CHILL Cross-Program (USA/Europe) Sharing Of
Applications– Scenarios, metrics, behaviour, etc.