2+ Ion Using Electrodialysis from Sugar Solution
13
Research Article Selection of the Best Process Stream to Remove Ca 2+ Ion Using Electrodialysis from Sugar Solution Jogi Ganesh Dattatreya Tadimeti, 1 Shilpi Jain, 1 Sujay Chattopadhyay, 1 and Prashant Kumar Bhattacharya 2 1 Polymer and Process Engineering Department, IIT Roorkee, Saharanpur Campus, Saharanpur 247 001, India 2 Chemical Engineering Department, Indian Institute of Technology, Kanpur 208 016, India Correspondence should be addressed to Sujay Chattopadhyay; [email protected] Received 30 July 2014; Revised 3 November 2014; Accepted 14 November 2014; Published 14 December 2014 Academic Editor: Sergio Ferro Copyright © 2014 Jogi Ganesh Dattatreya Tadimeti et al. is is an open access article distributed under the Creative Commons Attribution License, which permits unrestricted use, distribution, and reproduction in any medium, provided the original work is properly cited. Electrodialytic removal of calcium chloride (CaCl 2 , 25–50 mol⋅m −3 ) from 5% sugar solution was executed in batch recirculation mode. Calcium ion removal rate was monitored with (i) applied potential, (ii) feed flow rate, (iii) solution viscosity and conductivity, and (iv) catholyte streams (NaOH or sodium salt of ethylene diamine tetraacetic acid-acetic acid, Na 2 EDTA-AA). Unsteady state model for ion concentration change was written for the ED cell used. Linearized Nernst-Planck equation instead of Ohm’s law was applied to closely obtain the current density and concentration change theoretically. e model developed could closely predict the experimental observation. Mass transfer coefficients and specific energy densities were estimated for each combination of catholyte stream used. NaOH showed better performance for a short duration over Na 2 EDTA-acetic acid combination. 1. Introduction In cane based sugar industry the sugar concentration in the extracted juice aſter lime (CaO + H 2 O) treatment and color removal (clarification step) usually reaches around 5% (mass basis). is stream subsequently enters into series of evaporators to get concentrated. Presence of excess calcium in the postfloculation and precipitation stage of clarified sugar juice creates series of nuisance [1] to the subsequent stages (evaporators, etc.) in sugar industries affecting product quality as follows. (1) Scale formation in the evaporators. (2) Improper crystallization. (3) Molasses percentage may increase due to inversion of sugar in alkaline medium. (4) Storage is hampered because of hygroscopic nature of these metals ions. (5) Excess calcium is not hygienic as well. erefore, removal of it at appropriate stage would drastically reduce operation and maintenance (evaporator scaling) cost and improve product quality. Electrodialysis (ED) was chosen to remove CaCl 2 from its sugar solution. ED was applied earlier in sugar industry to recover tartrate and malate from grape sugar [2] and in demineralisation of beet sugar syrup, juice, and molasses [3, 4]. e technological difficulties arise due to fouling of ion exchange membranes mainly due to deposition of organic/inorganic molecules (sugars, proteins, Ca 2+ , Mg 2+ , etc.). With increase in solution viscosity fouling becomes even severe and affects the current efficiency and ion removal rate. e concentration polarization occurs around membrane surface leading to increase in ion resistance, and this is minimized with the help of suitable spacer design, temperature, pH, and flow rates applied [5–11]. A batch recirculation ED process having a single diluate channel was performed to remove the CaCl 2 from sugar solu- tion. As reported elsewhere [5] during ED process concentra- tion polarization arises around the membrane which limits Hindawi Publishing Corporation International Journal of Electrochemistry Volume 2014, Article ID 304296, 12 pages http://dx.doi.org/10.1155/2014/304296
Transcript of 2+ Ion Using Electrodialysis from Sugar Solution

Research ArticleSelection of the Best Process Stream to Remove Ca2+ Ion UsingElectrodialysis from Sugar Solution
Jogi Ganesh Dattatreya Tadimeti1 Shilpi Jain1
Sujay Chattopadhyay1 and Prashant Kumar Bhattacharya2
1Polymer and Process Engineering Department IIT Roorkee Saharanpur Campus Saharanpur 247 001 India2Chemical Engineering Department Indian Institute of Technology Kanpur 208 016 India
Correspondence should be addressed to Sujay Chattopadhyay sujay1999gmailcom
Received 30 July 2014 Revised 3 November 2014 Accepted 14 November 2014 Published 14 December 2014
Academic Editor Sergio Ferro
Copyright copy 2014 Jogi Ganesh Dattatreya Tadimeti et al This is an open access article distributed under the Creative CommonsAttribution License which permits unrestricted use distribution and reproduction in any medium provided the original work isproperly cited
Electrodialytic removal of calcium chloride (CaCl2 25ndash50molsdotmminus3) from 5 sugar solution was executed in batch recirculation
mode Calcium ion removal rate wasmonitoredwith (i) applied potential (ii) feed flow rate (iii) solution viscosity and conductivityand (iv) catholyte streams (NaOH or sodium salt of ethylene diamine tetraacetic acid-acetic acid Na
2EDTA-AA) Unsteady state
model for ion concentration change was written for the ED cell used Linearized Nernst-Planck equation instead of Ohmrsquos law wasapplied to closely obtain the current density and concentration change theoreticallyThemodel developed could closely predict theexperimental observation Mass transfer coefficients and specific energy densities were estimated for each combination of catholytestream used NaOH showed better performance for a short duration over Na
2EDTA-acetic acid combination
1 Introduction
In cane based sugar industry the sugar concentration inthe extracted juice after lime (CaO + H
2O) treatment and
color removal (clarification step) usually reaches around 5(mass basis) This stream subsequently enters into series ofevaporators to get concentrated Presence of excess calciumin the postfloculation and precipitation stage of clarifiedsugar juice creates series of nuisance [1] to the subsequentstages (evaporators etc) in sugar industries affecting productquality as follows
(1) Scale formation in the evaporators(2) Improper crystallization(3) Molasses percentage may increase due to inversion of
sugar in alkaline medium(4) Storage is hampered because of hygroscopic nature of
these metals ions(5) Excess calcium is not hygienic as well
Therefore removal of it at appropriate stage would drasticallyreduce operation and maintenance (evaporator scaling) costand improve product quality Electrodialysis (ED)was chosento remove CaCl
2from its sugar solution ED was applied
earlier in sugar industry to recover tartrate and malate fromgrape sugar [2] and in demineralisation of beet sugar syrupjuice and molasses [3 4] The technological difficulties arisedue to fouling of ion exchange membranes mainly due todeposition of organicinorganic molecules (sugars proteinsCa2+ Mg2+ etc) With increase in solution viscosity foulingbecomes even severe and affects the current efficiency and ionremoval rate The concentration polarization occurs aroundmembrane surface leading to increase in ion resistance andthis is minimized with the help of suitable spacer designtemperature pH and flow rates applied [5ndash11]
A batch recirculation ED process having a single diluatechannel was performed to remove the CaCl
2from sugar solu-
tion As reported elsewhere [5] during ED process concentra-tion polarization arises around the membrane which limits
Hindawi Publishing CorporationInternational Journal of ElectrochemistryVolume 2014 Article ID 304296 12 pageshttpdxdoiorg1011552014304296
2 International Journal of Electrochemistry
the net salt transport This issue was taken up and sorted outusing different combination of anolyte and catholyte streamsDifferent electrolyte streams (NaOH acetic acid-Na
2EDTA
mixture) were selected as catholyte keeping anolyte as HClsolution
In a batch mode electrodialysis with continuous recircu-lation of feed stream properties like electrolyte concentrationof diluate (feed tank) concentration profiles around thatmembrane and all physical properties of the solution changewith timeThe effect of all these parameters is reflected in ionremoval rate and current density of the ED cell Therefore anunsteady state model that can closely predict the ion removalrate and overall current density will be quite relevant in appli-cation point of view Nernst-Planck equation (purely basedon first principles) and irreversible thermodynamics wereused to estimate current density and ion concentration [12]
2 Materials and Methods
21 Equipment
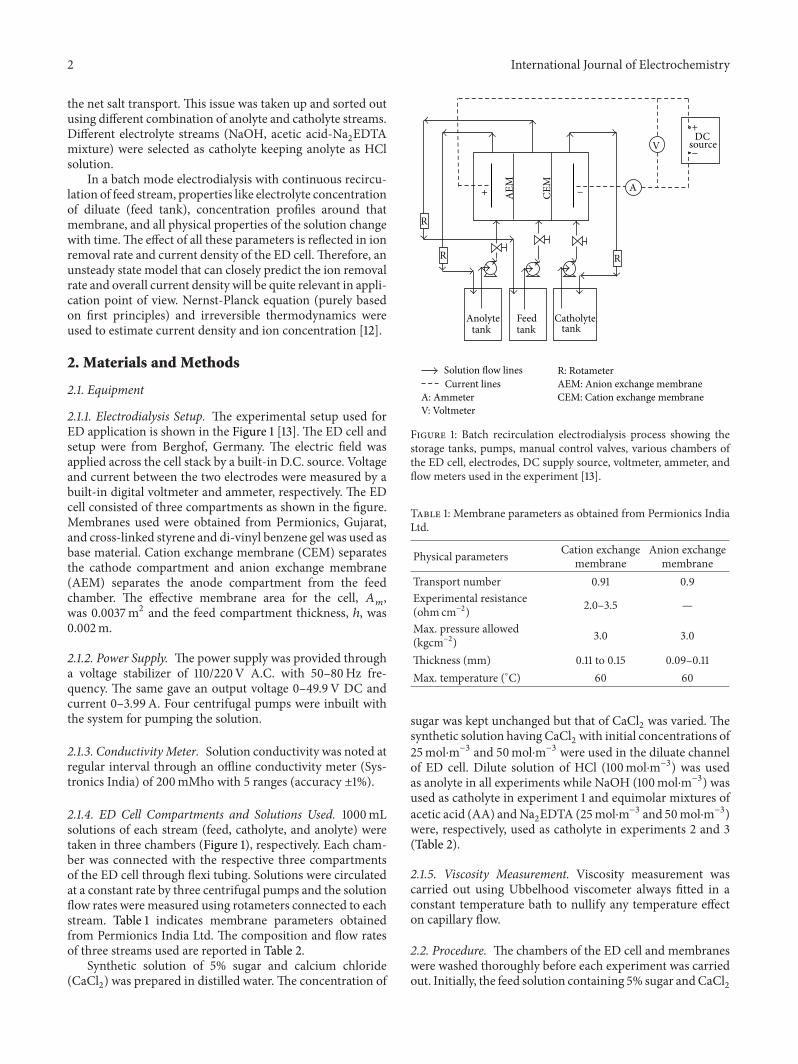
211 Electrodialysis Setup The experimental setup used forED application is shown in the Figure 1 [13] The ED cell andsetup were from Berghof Germany The electric field wasapplied across the cell stack by a built-in DC source Voltageand current between the two electrodes were measured by abuilt-in digital voltmeter and ammeter respectively The EDcell consisted of three compartments as shown in the figureMembranes used were obtained from Permionics Gujaratand cross-linked styrene and di-vinyl benzene gel was used asbase material Cation exchange membrane (CEM) separatesthe cathode compartment and anion exchange membrane(AEM) separates the anode compartment from the feedchamber The effective membrane area for the cell 119860
119898
was 00037m2 and the feed compartment thickness ℎ was0002m
212 Power Supply The power supply was provided througha voltage stabilizer of 110220V AC with 50ndash80Hz fre-quency The same gave an output voltage 0ndash499V DC andcurrent 0ndash399A Four centrifugal pumps were inbuilt withthe system for pumping the solution
213 Conductivity Meter Solution conductivity was noted atregular interval through an offline conductivity meter (Sys-tronics India) of 200mMho with 5 ranges (accuracy plusmn1)
214 ED Cell Compartments and Solutions Used 1000mLsolutions of each stream (feed catholyte and anolyte) weretaken in three chambers (Figure 1) respectively Each cham-ber was connected with the respective three compartmentsof the ED cell through flexi tubing Solutions were circulatedat a constant rate by three centrifugal pumps and the solutionflow rates were measured using rotameters connected to eachstream Table 1 indicates membrane parameters obtainedfrom Permionics India Ltd The composition and flow ratesof three streams used are reported in Table 2
Synthetic solution of 5 sugar and calcium chloride(CaCl
2) was prepared in distilled water The concentration of
FeedAnolytetank
Catholytetank
V
A
CEM
AEM
DC source
R
R R
Solution flow linesCurrent lines
A AmmeterV Voltmeter
R RotameterAEM Anion exchange membraneCEM Cation exchange membrane
tank
+ minus
minus
+
Figure 1 Batch recirculation electrodialysis process showing thestorage tanks pumps manual control valves various chambers ofthe ED cell electrodes DC supply source voltmeter ammeter andflow meters used in the experiment [13]
Table 1 Membrane parameters as obtained from Permionics IndiaLtd
Physical parameters Cation exchangemembrane
Anion exchangemembrane
Transport number 091 09Experimental resistance(ohm cmminus2) 20ndash35 mdash
Max pressure allowed(kgcmminus2) 30 30
Thickness (mm) 011 to 015 009ndash011Max temperature (∘C) 60 60
sugar was kept unchanged but that of CaCl2was varied The
synthetic solution having CaCl2with initial concentrations of
25molsdotmminus3 and 50molsdotmminus3 were used in the diluate channelof ED cell Dilute solution of HCl (100molsdotmminus3) was usedas anolyte in all experiments while NaOH (100molsdotmminus3) wasused as catholyte in experiment 1 and equimolar mixtures ofacetic acid (AA) andNa
2EDTA (25molsdotmminus3 and 50molsdotmminus3)
were respectively used as catholyte in experiments 2 and 3(Table 2)
215 Viscosity Measurement Viscosity measurement wascarried out using Ubbelhood viscometer always fitted in aconstant temperature bath to nullify any temperature effecton capillary flow
22 Procedure The chambers of the ED cell and membraneswere washed thoroughly before each experiment was carriedout Initially the feed solution containing 5 sugar andCaCl
2
International Journal of Electrochemistry 3
Table 2 Different process variables chosen during ED experimentation [13]
Exptnumber Feed solution
Feed flowrate
(mLsdotminminus1)Anolyte solution
Anolyte flowrate
(mLsdotminminus1)Catholyte solution
Catholyteflow rate
(mLsdotminminus1)
Voltageapplied (V)
Time(min)
125molsdotmminus3 CaCl2
in 5 sugarsolution
130 100molsdotmminus3HClsolution 830 100molsdotmminus3NaOH
solution 830 4 685
225molsdotmminus3 CaCl2
in 5 sugarsolution
130 100molsdotmminus3HClsolution 830
25molsdotmminus3Na2EDTA+ 25molsdotmminus3 AA
solution830 4 240
350molsdotmminus3 CaCl2
in 5 sugarsolution
130 100molsdotmminus3HClsolution 830
50molsdotmminus3Na2EDTA+ 50molsdotmminus3 AA
solution830 4 240
was used and was circulated at a constant rate (130mLmin)through the feed compartment The feed solution anolyteand catholyte were continuously recycled through the ED celland that caused a continuous change in salt concentrationof feed solution The concentration was measured at regularintervals For a fixed applied voltage (119881) variation of current(ldquo119868rdquo through the membrane stack) and concentration of salt(Ca2+ ions) was estimated from conductivity measurementand using standard calibration chart (mass concentrationversus conductance) and was recorded with time (119905)
ED cell was dismantled membranes were taken outchecked visually to find any deposition over the surfaces aftereach experimentMembraneswere thenwashedwith distilledwater and oven dried at 100∘C for 24 hours and weighed tofind any gain or loss in mass of membrane
3 Modeling of Ion Transport
Current density and limiting current density (LCD) of anED cell is a function of a series of parameters for exam-ple physical (cell geometry flow dynamics spacer spacingsolution density and viscosity) and chemical (ion concen-tration transport number and diffusivity) for a given setof membrane pairs Precise estimate of these parametersand application of Nernst-Planck equation (assuming zeroion concentration on the membrane surface) would give atheoretical estimate of LCD which can also be determinedexperimentally from plot of 119868 versus 119881 characteristics of theelectrolyte in the ED cell [7 9]
31 Determination of Bulk Concentration of Diluate Compart-ment Concentration of ions was obtained through unsteadymass balance over diluate catholyte and anolyte compart-ments The following assumptions were made [18]
(i) The ED cell and the feed tank are approximated to bea perfectly mixed flow reactor
(ii) Back diffusion of ions was ignored(iii) Electroneutrality condition is always maintained
Themass balance equation of diluate compartment in the EDcell can be expressed as
119881dilC119889119862
dil
119889119905
= 119876
dil(119862
dil119879
minus 119862
dil) minus
120578119894119860
119898
119911119865
(1)
where 119881dilC is the volume of the diluate compartment (m3)and 119905 is time (s)119862dil
119879and119862dil represent diluate concentrations
leaving feed tank and leaving cell compartment (molsdotmminus3)119876
dil is the diluate volumetric flow rate (m3s) 120578 is the currentefficiency 119894 is the current density (Asdotmminus2) and 119860
119898is the
effective membrane area (m2)120578 can be obtained from the following equation [18 19]
120578 = 119905
+CEM + 119905
minusAEM minus 1 (2)
where 119905
+CEM is the transport number of cation in cationexchange membranes and 119905
minusAEM is the transport number ofanion in anion exchange membrane
Similarly unsteady state mass balance around feed tankcan be written as
119889 (119881
119879119862
dil119879)
119889119905
= 119876
dil(119862
dilminus 119862
dil119879)
(3)
where 119881
119879is the volume of feed tank (m3) During electro-
dialysis water transport occurs across the membranes dueto electroosmosis and osmosis [19] Volume change (due towater transport) was ignored as there was no net volumechange noted experimentally
32 Determination of the Current Density
321 Overall Flux Equation A pictorial representation ofdifferent concentration profiles possibly developed aroundthe membrane is described in Figure 2 The flux of ions pass-ing through the membrane can be expressed by generalizedNernst Planck equation as [7]
119873
119895= minus119863
119895
120597119862
119895
120597119909
minus
119911
119895119862
119895119865119863
119895
119877119879
120597120595
120597119909
(4)
where 119909 is the distance measured from boundary layer incontact with the bulk solution in diluate channel towardsthe membrane 119863
119895is the diffusivity of ion (m2sdotsminus1) 119862
119895is
the concentration of ion 119895 (molsdotmminus3) 119877 is the universal gasconstant (8314 Jsdotmolminus1sdotkminus1) 119879 is the temperature (K) 119911
119895is
the charge of diffusing species 119895 and 120597120595120597119909 is the potentialgradient (Vsdotmminus1) and 119865 is the Faraday constant (Csdotgeqvminus1)
4 International Journal of Electrochemistry
Diffusion boundary layer
Concentrate Diluate
Cation exchange membrane
++
minus
Cconcjm
Cconcjb
Cdiljm
Cdiljb
120575 120575
Figure 2 Depiction of ion transport and hypothetical linear con-centration boundary layer formed across either side of the mem-brane in ED cell
The total molar flux of ion ldquo119895rdquo through the ion exchangemembrane 119873
119895119898 can be related to the current density 119894 as
[7]
119873
119895119898=
119905
119895119898119894
119911
119895119865
(5)
where 119905119895119898
is the transport number of ion 119895 in the membrane119894 is current per unit area of membrane or current density(Asdotmminus2) and 119911
119895is the charge of the ion
At steady state119873119895and119873
119895119898are equal that is
119905
119895119898119894
119911
119895119865
= minus119863
119895
120597119862
119895
120597119909
minus
119911
119895119862
119895119865119863
119895
119877119879
120597120595
120597119909
(6)
Assuming that a linear profile of the concentration distribu-tion exists along the boundary layer the linearized Nernst-Planck equation could be used instead of (6) Expression forthe linearized Nernst-Planck equation when applied in thediluate chamber is [7]
119905
119895119898119894
119911
119895119865
=
119863
119895(119862
dil119895119887
minus 119862
dil119895119898
)
120575
minus
119911
119895119863
119895119865120585119862
dil119895119898
119877119879
(7)
where 120575 is the boundary layer thickness (m)119862dil119895119887
and119862dil119895119898
areconcentrations of ions in bulk and at the membrane surfacerespectively of the diluate compartment and 120585 is the potentialgradient (Vsdotmminus1) and is expressed as
120585 =
120595
120575
(8)
In (7) the first part that is119863119895(119862
dil119895119887
minus119862
dil119895119898
)120575 denotes flux duetomolecular diffusion flux of ion arising out of concentrationvariation between solution bulk and boundary layer overmembrane surface The second part that is 119911
119895119863
119895119865120585119862
dil119895119898
119877119879shows flux due to externally applied potential over themembrane
322 Boundary LayerThickness 120575 Estimation 120575 is estimatedusing film theory (equation (9)) and salt mass-transfercoefficient [7 20] Salt mass-transfer coefficient is usuallydetermined based on salt diffusivity and suitable mass-transfer correlation which in-turn is dependent on flowprofile andphysical properties of the fluids cell geometry andsurface morphology of membranes used in ED cell [7 9 2122]
120575 =
119863
119895
119896
(9)
where 119863119895and 119896 are diffusivity and mass transfer coefficient
of diffusing species in solution Each of these parameters wasseparately estimated using standard correlations The masstransfer coefficient was obtained from Sherwood number[7 20 21] as
Sh =
119896 sdot 119897
119863
119895
(10)
where 119897 is the characteristic length (m) Sherwood numberSh is expressed as a function of Reynolds number Re andSchmidt number Sc [7 20] The empirical expression ofSherwood number is based on cell geometry and spacerconfiguration chosen for the present cell as indicated in thefollowing [17 20 23]
Sh = 119886 sdot Re119887 sdot Sc119888 (11)
where Sc (Schmidt number 120583120588119863119895) is estimated from phys-
ical properties (viscosity and density) of the medium whileReynolds number (120588V119897120583) indicates flow characteristics ofthe medium and channel spacing as ldquo119897rdquo and 119886 119887 119888 are theempirical constants which are determined by fitting the data(ShScc versus Re) for experiments where flow rate is variedIn this work the values of 119886 119887 and 119888 are taken from literature[17] and are given in Table 3
Ionic diffusivity is entirely dependent on the size ofhydrodynamic diameter of ions Assuming infinite dilutionthis ionic diffusivity is estimated using the Nernst-Haskelequation (12) [14] as
119863
∘=
119877119879 [(1119911
+) + (1119911
minus)]
119865
2[(1120582
+) + (1120582
minus)]
(12)
where 119911+and 119911
minusdenote charges of cation and anion respec-
tively while 120582+and 120582
minusdenote limiting ionic conductance in
the solvent Other parameters bearing meaning and units areas reported in the nomenclature
International Journal of Electrochemistry 5
Table 3 Values of different physical parameters used in the model
Parameter Value ReferenceTemperature 119879 298K This workTransport number of the cation in CEM 119905
+CEM 091 Table 1Transport number of the anion in AEM 119905
minusAEM 09 Table 1Transport number of cation in the solution 119905Ca2+ 119904 04387 This work [7]Transport number of anion in the solution 119905Clminus 119904 05613 This work [7]Diffusivity of CaCl2 in 5 sugar solution at 25∘C119863CaCl2 1198 times 10minus9m2
sdotsminus1 This work [14 15]Diffusivity of Ca2+ ions at infinite dilution and at 25∘C119863∘Ca2+ 792 times 10minus10m2
sdotsminus1 This work [14]Diffusivity of Ca2+ ions in 5 sugar solutions at 25∘C119863Ca2+ 711 times 10minus10m2
sdotsminus1 This work [14 15]Diffusivity of Clminus ions in 5 sugar solutions at 25∘C119863Clminus 182 times 10minus10m2
sdotsminus1 This work [14 15]Distance between adjacent membranes 119897 2 times 10minus3m This workArea of the membrane 119860
11989837 times 10minus3m2 This work
Charge on the calcium ion 119911Ca2+ +2 This workViscosity of 5 sugar solution 120583 992 times 10minus4 Pasdots [16]Velocity of the feed stream V 31 times 10minus2msdotsminus1 This workApplied voltage 119864tot 4 V This workCurrent density initial value 119894(0) 122Asdotmminus2 This workCurrent efficiency 120578 081 This work
Sh number empirical equation constant 119886 046 for catholyte NaOH [17]025 plusmn 003 for catholyte AA-Na2EDTA This work
Sh number empirical equation constant 119887 063 for any anolyte and catholyte [17]Sh number empirical equation constant 119888 033 for any anolyte and catholyte [17]
Diffusivity is a strong function of viscosity which wascorrected using equation proposed by Yuan-Hui andGregory[15]
119863
119863
∘=
120583
∘
120583
(13)
323 Estimation of Membrane Surface Concentration Themembrane surface concentration of ions is dependent oncurrent density under an applied voltage As long as the EDoperation is executed below limiting current (surface con-centration becomes zero) the surface concentration on eitherside can be estimated from bulk concentration measurement(diluateconcentrate) current density and limiting currentdensity using (14) and (15) [19 24]
119862
conc119895119898
= 119862
conc119895119887
(1 +
119894
119894
119895lim) (14)
119862
dil119895119898
= 119862
dil119895119887
(1 minus
119894
119894
119895lim) (15)
where 119862
conc119895119898
and 119862
conc119895119887
are the concentrations of ion 119895on the membrane surface and in bulk of the concentratecompartment respectively in the ED cell 119862dil
119895119898and 119862
dil119895119887
arethe concentrations of ion 119895 on the membrane surface and inthe bulk of the diluate side respectively in the ED cell
324 Estimation of Current Density and Limiting CurrentDensity (119894 and 119894
119895119897119894119898) LCD(of a single electrolyte) is estimated
using the following equation [5 9]
119894
119895lim =
119862
dil119895119887119863
119895119911
119895119865
120575 (119905
119895119898minus 119905
119895119887)
(16)
where 119905
119895119898and 119905
119895119887are transport numbers of ion 119895 in
membrane and electrolyte solution respectivelyConsidering ion flux in the diluate side of the IEM (15)
is used to calculate concentration of ion 119895 at the membranesurface of diluate side 119862dil
119895119898
The current density can be expressed by (17) after substi-tution of (15) and (16) in (6)
119894 = (119862
dil119895119887119863
119895119911
119895120585
119865
119877119879
)
times (
119905
119895119898minus 119905
119895119887
119911
119895119865
+
120585120575 (119905
119895119898minus 119905
119895119887)
119877119879
minus
119905
119895119898119911
119895
119865
)
minus1
(17)
where 120585 the potential gradient can be estimated from Nernstequation given as follows [18 19]
120585 = minus (2119905
119895119898minus 1)
119877119879
120575119865
ln(
120574
dil119887119862
dil119895119887
120574
dil119898119862
dil119895119898
) (18)
where 120574
dil119898
and 120574
dil119887
are the mean ionic activity coefficientscorresponding to the ions at the wall of IEM and in the bulk
6 International Journal of Electrochemistry
of solution respectively within the diluate channel and theycan be estimated using Debye-Huckel limiting law [25]
4 Numerical Estimation of Parameters
The sequence of steps followed to obtain theoretical estimateof concentration variation is described using flow chart(Figure 3) The differential equations (1) and (3) were inte-grated using Euler method with 1 s time step Few crucialparameters and their evaluationmethod are presented below
41 Determination of Transport Number of Ion in SolutionBulk transport number 119905
119895119887is the fraction of total current
carried by the ion type which is a function of diffusioncoefficient and ionic mobility of hydrated species Ions insolution get hydrated with solvent molecules and differencein hydration ability causes variation in size diffusivity andmobility of such species Thus ions do not transport currentequally in solution The transport number was estimatedusing following equation [7]
119905
119895119887=
1003816
1003816
1003816
1003816
1003816
119911
119895
1003816
1003816
1003816
1003816
1003816
119863
119895
sum
119899
119895=1
1003816
1003816
1003816
1003816
1003816
119911
119895
1003816
1003816
1003816
1003816
1003816
119863
119895
(19)
For a binary-ion salt solution 119899 = 2 119895 = 1 for cation and119895 = 2 for anion respectively
42 Determination of Current from Resistance MeasurementInitial current density estimation is essential to obtain saltconcentration at membrane surface and start numericalintegration which may be evaluated either experimentally orfrom applied potential and solution resistance using Ohmrsquoslaw The potential applied may be expressed as
119864tot minus 119864el = 119877tot sdot 119869 (20)
where 119864el is the potential drop near the electrodes 119877tot isthe overall resistance (ohm) of the ED cell and 119869 is thecurrent (119860) The overall resistance is the sum of resistancesof individual chambers
119877tot = 119877anolyte + 119877diluate + 119877catholyte (21)
where resistance of anolyte catholyte and diluate channel aredetermined either directly from conductivity measurementor from extended Kohlrausch-equation [19 25] The conduc-tivity and the resistance are related as
Resistance = 1
Λ
119871
119860
119898
(22)
where Λ is the conductivity of solution (mhosdotmminus1) 119871 is thegap between membranes or the compartment thickness (m)and 119860
119898is the effective membrane area (m2)
43 Determination of Specific Energy Consumption The spe-cific energy consumption 119864sp (kWhsdotkgminus1) was obtainedusing the following equation
119864sp =
int
1199052
1199051
120576119860
119898119894 (119905) 119889119905
119872CaCl2
Δ119899CaCl2(119905)
(23)
Input data Estimate
Estimate
EstimateNo
Comparison with experimental data
and error calculation
Yes
PlotsEnd
t1 = t1 + Δt
t1 = t + Δt
t = t0
120585(t) and i(t)
t1 = tend
CdilT (0) Cdil(0)
CconcT (0) Cconc(0)
i(0) EtotQdilVdil t0
Δt tend
CdilT (t1) Cdil(t1)
CconcT (t1) Cconc(t1)
ilim(t) Cconcjm (t)
Cdiljm(t)
ilim versus t i versus tCT
dil versus t
Figure 3 MATLAB program algorithm showing calculation stepsfollowed to estimate process parameters
where 120576 is the applied potential in V 119860119898is the area of the
membrane in m2 119894(119905) is the current density as a functionof time in Asdotmminus2 119872CaCl
2
is the molecular mass of CaCl2
(=11102 gmol) and Δ119899CaCl2
(119905) is the number of moles ofCaCl2removed from the feed solution at various time
intervals
5 Results and Discussions
51 Role of Sugar and CaCl2Concentration on Solution
Viscosity and Influence of Temperature Sugar solution vis-cosity increases nonlinearly (Figure 4) with increase in sugarconcentration (5 to 20wt) Viscosity values range between072 and 15mPasdots with increase in sugar concentrationThese values were very much comparable with the literaturereported data [16] Solution viscosity does not show anyappreciable change with CaCl
2concentration (0ndash50molm3)
(Figure 5) Influence of temperature on CaCl2solution vis-
cosity was recorded at 20 25 32 37 and 42∘C and viscositydecreases between 122 and 07mPasdots Nearly sim43 loweringin solution viscosity with temperature rise between 20 and42∘C is noted in Figure 5
52 Role of Sugar and CaCl2Concentration on Electrical
Conductivity of Electrolyte Figure 6 shows plot of CaCl2con-
centration on the electrical conductivity whichwas estimatedin presence and absence of sugar Electrical conductivityincreases almost linearly with rise in CaCl
2concentration
(5 to 50molsdotmminus3) The CaCl2 being a strong electrolyte
dissociates completely in solution thus increasing numberof ions per unit volume available for ionic conductance Onthe contrary sugar addition dampens the conductivity valueThis is possibly because sugar is a water soluble nonelec-trolyte which does not change the number of ionic speciesresponsible for current carriage thus presence of inert sugarmolecules basically increases crowding in solution
53 Effect of Applied Potential on Ion-Removal Rate Theapplied potential is a crucial parameter to define removal
International Journal of Electrochemistry 7
0 2 4 6 8 10
10
11
12 y = 00209x + 0989756
R2 = 098
Visc
osity
at20
∘ C(m
Pamiddots)
Sugar (wtwt) in 20molmiddotmminus3 CaCl2 solution ()
Figure 4 Effect of wt of sugar on solution viscosity at 20∘C
0 10 20 30 40 5006
08
10
12
14
16
Concentration of CaCl2 in 3)
Visc
osity
(mPamiddots)
20∘C25∘C32∘C
37∘C42∘C
5 wt sugar solution (molm
Figure 5 Effect of concentration of CaCl2in 5wt sugar solution
on solution viscosity at different temperatures
rate and efficiency With increased potential ion removalrate increases causing rapid lowering of batch time [26] In abatch operation with gradual lowering of ion concentrationthe current density keeps dropping Once the concentrationreaches below limiting value the solution resistance becomesvery high and heating starts At this increased temperatureelectrolysis of water starts and a major portion of appliedpotential gets consumed without much gain in ion removalThus overall energy consumption increases affecting processefficiency [5 22]
Three different voltages (4V 8V and 12V) were appliedkeeping other process parameters unchanged Figure 7 showseffect of applied potential on Ca2+ ion removal rate Withhigher potential the ion removal rate increases This isquite obvious because with increased electrical driving force
0 10 20 30 40 500
2
4
6
8
10
12
5 sugar solutionPure aq solution
Conc of CaCl2 (molmiddotmminus3)
Elec
tric
al co
nduc
tivity
at25
∘ C(m
S)
Figure 6 Effect of molar concentration of CaCl2in water with and
without sugar on electrical conductivity of solution
0 30 60 90 120 150 180 210 240
10
20
30
40
50
Time (min)
Con
cent
ratio
n of
CaC
l 2(m
olmiddotm
minus3)
4V8V12V
Figure 7 Effect of applied potential on the feed concen-tration Process conditions are feed 130mLmin with CaCl
2
(50molsdotmminus3) in 5wt sugar solution anolyte 830mLminwithHCl(100molsdotmminus3) catholyte 830mLmin with Na
2EDTA (50molsdotmminus3)
+ AA (50molsdotmminus3) applied voltage 4V 8V and 12V
(potential) more current passes through the solution as longas resistance remains unchanged It is interesting to note thatat lower potential the ion removal rate remains linear fora long duration (gt240min) indicating Ohmrsquos law might beapplicable This is not observed with higher potentials Withminus8V the nonlinearity appears at time sim180min while thesame happens at time sim120min for minus12 V Possibly unwantedelectrode reactions (water splitting) initiate at early stageswith increased potential This certainly influences the ionremoval rate showing variation in slope of the concentration
8 International Journal of Electrochemistry
drop curve This indicates that at higher voltage rapid deple-tion of ions and a nonlinear rise in resistance occurs Rapidnonlinear rise in solution resistance was also observed earlierby different scientists [8 9]
54 Effect of Flow Rate on Ion Removal Rate Change inion removal rate with variation in feed flow rate withoutdisturbing catholyte and anolyte streams conditions (flowrate components concentration etc) was analyzed andreported in Figure 8 Feed flow rates were varied as 80 130and 180mLmin and change in ion removal rate was notedafter nearly 60min of ED operation A slow rise in removalrate with increased flow rate was observed Increased flowrate possibly increased turbulence which reduced thicknessof stationary boundary film over membrane surface Thislowered the overall ion transfer resistance and increased ionremoval rate
55 Model Prediction of Experimental ldquoirdquo and Ca2+ IonConcentration The batch mode of electrodialysis with con-tinuous recirculation under an applied potential becomes anunsteady state processThe electrolyte concentrations of dilu-ate (feed tank) and concentrate streams solution resistance(conductivity) concentration profile around membrane andbulk physical properties of the solution become time depen-dent The cumulative effects of all these parameters arereflected in diluate (feed tank) concentration and overallcurrent density of the ED cell Therefore the mathematicalmodel emphasizes two crucial parameters (i) electrolyte(CaCl
2) concentration of the diluate stream (feed tank) and
(ii) overall current density of the cell Unsteady state massbalance around the diluate channeltank is written in termsof important process variables for example vessel volumeflow rate concentration current density current efficiencyand membrane area Nernst Planck equation and irreversiblethermodynamics are used to estimate the ionic flux throughthe boundary layer over the membraneThe model proposedclosely predicts experimental data between the chosen rangeof process condition of Ca2+ ion (Figures 9 and 10) andcurrent density with time (Figure 9) in the ED cell
Molar concentration of the recirculating feed solutionwasobtained by solving coupled differential equations Equations(1) and (3) and physical process parameters values are listed inTable 3 Solution steps (using MATLAB code) are discussedin Figure 3 The concentration estimates so obtained wereused to estimate current density 119894 (17)The theoretical modelcould closely predict the experimental data (Experiments 1 2and 3) of concentration variation (Figures 9 and 10) Experi-ments 2 and 3 performed with two different concentrationsof CaCl
2(25 and 50molsdotmminus3) in feed solution behaved in
the same manner (Figure 10) This supports the fact that themethod adopted in concentration estimation was correct andreproducible
Initially solute concentration (25molsdotmminus3) of the feedsolution drops steadily in experiment 1 the rate of whichslows down after nearly 200min (Figure 9)The experimentalcurrent density also follows same trend (Figure 9) A steadydrop in current density from 120Asdotmminus2 to 40Asdotmminus2 during
0 50 100 150 200 250
10
20
30
40
50
Time (min)
Feed flow rate
Con
cent
ratio
n of
CaC
l 2(m
olmiddotm
minus3)
80mLmin130mLmin180mLmin
Figure 8 Effect of feed flow rate on CaCl2removal from sugar
solution Process conditions of feed 80mLmin 130mLmin and180mLmin with CaCl
2(50molsdotmminus3) in 5 sugar solution anolyte
830mLmin with HCl (100molsdotmminus3) catholyte 830mLmin withNa2EDTA (50molsdotmminus3) + AA (50molsdotmminus3) applied voltage 8 V
0 100 200 300 400 500 600 7000
20
40
60
80
100
120
140
160
180
200
Time (min)
Cdil tankexpt molmiddotmminus3 in experiment 1
iexpt Amiddotmminus2 in experiment 1ilim Amiddotmminus2 in experiment 1Model prediction
Figure 9 Plot of limiting current density 119894lim (Asdotmminus2) experimentalcurrent density 119894 (Asdotmminus2) and molar concentration of diluate tank119862
dil119879expt (molsdotmminus3) (shown as discrete data points) versus time for a
given set of operating condition experiment 1 (feed flow rate =130mLsdotminminus1 anolyte = 100molsdotmminus3 HCl catholyte = 100molsdotmminus3NaOH applied voltage = 4V) [13] Theoretically predicted valuesof current and concentration variation with time are shown bycontinuous line
first 200min was recorded possibly due to rapid lowering inionic concentration in the diluate under applied potential of4V
International Journal of Electrochemistry 9
0 50 100 150 200 25010
15
20
25
30
35
40
45
50
55
60
Time (min)
Cdil tankexpt molmiddotmminus3 in experiment 2
Cdil tankexpt molmiddotmminus3 in experiment 3
Model prediction
Con
cent
ratio
n of
CaC
l 2(m
olmiddotm
minus3)
Figure 10 Close resemblance of theory (continuous line) withexperimental molar concentration of CaCl
2of the diluate tank
(molsdotmminus3) (discrete data points) versus time (min) for specifiedED operating conditions (i) experiment 2 (feed flow rate =130mLsdotminminus1 anolyte = 100molsdotmminus3 HCl catholyte = 25molsdotmminus3Na2EDTA + 25molsdotmminus3 AA applied voltage = 4V) (ii) Experiment
3 (feed flow rate = 130mLsdotminminus1 anolyte = 100molsdotmminus3 HClcatholyte = 50molsdotmminus3 Na
2EDTA + 50molsdotmminus3 AA applied voltage
= 4V) [13]
56 Role of Catholyte Composition and a Probable Mechanismfor Smooth Operation of ED CaCl
2is a strong electrolyte
and preferentially exists in ionized (Ca2+ and 2Clminus1) state inthe aqueous solution containing sugar (5)Water moleculesform a hydration sphere around each dissociated ion and sta-bilize it On application of external potential these hydratedspecies start crossing polar membranes charged with counterions and cause concentration polarization buildup across thepolar membrane
The approach adopted here is to minimize the concen-tration polarization Ca2+ ion crosses the cation exchangemembrane This was accomplished by either (i) precipitatingout the ions or by (ii) complexing out before a back diffusionsets in Two different catholyte streams were chosen with adefinite purpose for example (i) 01 N NaOH (which formsan insoluble precipitate of Ca2+ ion (23)) and (ii) a mixtureof acetic acid and di-sodium salt of EDTA (Na
2EDTA a
well-known complexing agent for bivalent cation (Ca2+)after it crosses the CEM (24)) Hydrated Ca2+ ions crosscation exchange membrane (CEM) and reaches catholytecompartment where it may precipitate or dissolve based onthe electrolyte (s) and pH of the catholyte stream Ca2+ ionsreact with theNaOHof catholyte stream and formsCa(OH)
2
As the solubility product of Ca(OH)2in water is very low
(sim10minus6) it experiences high probability of precipitation overmembrane surface facing higher pH Once this precipitatecomes in contact with electrolyte containing Na
2EDTA it
reacts and forms a stable complex CaNa2EDTA which
washes out the precipitate formed and cleans the membranesurfaceThe schemeof overall reaction is presented as follows
Ca2+ + 2 (OHminus) 997888rarr Ca (OH)
2
CO2
997888rarr CaCO3+H2O (24)
Ca2+ +Na2EDTA 997888rarr CaNa
2EDTA + 2H+ (25)
Bivalent cation are well known for their low solubility at highpH and often precipitate out as metal hydroxides [27] Thisprecipitation problem was also observed with calcium ionreported here when NaOH was used in catholyte streamFigure 11 shows NaOH (100molsdotmminus3) as catholyte streamsalthough increases ion removal rate initially but vigorousfouling prevented the process from running for long dura-tion With NaOH as catholyte Ca(OH)
2precipitation was
extensive which turned the membrane color from brownishyellow to white and probably blocked the swollen membranepores on the rare side Although this approach completelyarrested the reverse transport of Ca2+ ions but continuousoperation was limited due to membrane fouling increasedresistance and drop in current density Frequent acid washhelped in improving the membrane performance but contin-uous operation was not feasible
Formation of white solid powder was noted over themembrane (CEM) surface facing catholyte stream (NaOHhigher pH) in experiment 1 and experiment 3 The whitepowder over membrane was investigated further to havebetter understanding of the problem which arose after EDoperation for specified duration Quantitative estimations ofthe fouledmembrane weremade by gravimetric methodTheCEM membrane after ED experimentation was taken outwashed and weighed after drying and equilibration Theused membrane (equilibrated 24 hours at 100∘C) was foundto increase in mass over its initial mass (equilibrated) beforeED Gain of mass in used membrane is reported in Table 4
The white deposit on the membrane surface could beremoved by immersing the membrane in a dilute HCl (10in water) solution Immediately after immersion bubblingfrom the fouled surface of the membrane was observed Forcomplete dissolution of the white deposit the membrane wasleft immersed in the solution for sim30 minutes until bubblingstopped Subsequently the membrane was removed washedrepeatedly with deionized water and dried in oven (100∘Cfor 24 hours) and weighed A blank test was simultaneouslyperformed using a fresh membrane to record the differencebetween used and fresh membrane For an applied potentialthe dry mass of the used membrane was found to be depen-dent on its duration of application electrolyte concentrationand electrolyte stream pH
Multiple samples of the used membrane were tested andformation of bubbles was confirmed Once the bubblingstopped after immersing the membrane in dilute HCl solu-tion the piece was taken out washed dried and equilibratedbefore weighing Mass of the membrane did not deviatemuch from its initial value This indicated possibility of CO
2
evolution from the reaction of HCl with CaCO3 The most
probable sequence of the overall reaction occurring over the
10 International Journal of Electrochemistry
Table 4 Specific energy consumption mass transfer coefficient average running cost estimated and gravimetric analysis
ExptSpecific energy
consumption for CaCl2removal 119864sp (kWhsdotkgminus1)
Average running cost(INRg of CaCl2 removed)
Mass transfer coefficient119896 (msdotsminus1) times 105
weight gained by CEMdue to fouling
1 24023 47 1928 222 24027 34 1174 33 24027 19 1173 17
0 50 100 150 200 2500
10
20
30
40
50
60
70
80
90
100
Rem
oval
()
Time (min)
Anolyte = 100molmiddotmminus3 HClCatholyte = 25 molmiddotmminus3 Na2EDTA
+ 25molmiddotmminus3 AA
Anolyte = 100molmiddotmminus3 HClCatholyte = 100molmiddotmminus3 NaOH
Figure 11 Comparison of Ca2+ ions (feed solution 25molsdotmminus3)removal rate between two different techniques adopted Case 1anolyte = 100molsdotmminus3 HCl catholyte = 100molsdotmminus3NaOH Case2 anolyte = 100molsdotmminus3 HCl catholyte = 25molsdotmminus3 Na
2EDTA +
25molsdotmminus3 AA [13]
membrane surface and its subsequent cleaning with diluteHCl may be explained by the following scheme
CO2(air) + 2OHminus 997888rarr CO
3
2minus+H2O (26)
Ca(OH)
2+ CO2997888rarr CaCO
3(s) +H
2O (27)
CaCO3(s) +HCl 997888rarr CaCl
2+ CO2(g) +H
2O (28)
At higher pH solubility of CO2(air) increases in NaOH
solution (catholyte stream) which results in formation ofHCO3
minus1CO3
2minusThese ions subsequently react withNaOH toform Na
2CO3providing the source for CaCO
3precipitation
from Ca(OH)2 Conversion of Ca(OH)
2to CO
3
minus2 is (27)is thermodynamically favorable and moves forward Nearly1000 times higher value of solubility product of Ca(OH)
2
[55 times 10
minus6] over CaCO3[339 times 10
minus9] [28] drives the processfaster
Formation of CaCO3not only increasedmembrane resis-
tance to ion transport but alsomade the EDoperation discon-tinuous The process was made uninterrupted by changing
the electrolyte composition of the catholyte stream Herewe report application of Na
2EDTA-acetic acid solution as
catholyte stream the chelating agent continuously complexeswith the precipitated CaCO
3and formed corresponding
salt CaNa2EDTA The pH of catholyte stream was adjusted
between 35ndash50 (Table 2) and the anolyte was maintainedas HCl (100molsdotmminus3) This combination showed negligiblefouling even after long (240min) operation time (Table 4)
The mass transfer coefficients estimated from Sherwoodnumber correlation (11) showed higher values while NaOH(100molsdotmminus3) was used as catholyte stream compared toNa2EDTA-acetic acid (AA) combination (Table 4) Reduced
mass transfer coefficient with Na2EDTA-acetic acid stream
may be attributed to higher solution resistance arising possi-bly due to weak dissociation of acetic acid of Na
2EDTA + AA
combination than that of NaOH The dissociation constantcan get further affected due to Na
2EDTA (a bulky diffusing
species) Thus reduction in mass transfer coefficient loweredCa2+ ion removal rate
As of now we have understood that chemical compo-sition and concentration of anolytecatholyte streams playcrucial role in controlling overall resistance and ion removalrate The specific energy consumption 119864sp estimated from(23) (Table 4) shows lower value with NaOH compared to thestreams containing Na
2EDTA + AA
The average running cost to remove unit mass of CaCl2is
reported in Table 4 The cost is dependent on concentrationof the electrolyte stream and time of ED operation Cost isinversely proportional to initial concentration of the streamand directly proportional to operation time Energy dueto pumping is the major contribution to the overall costsestimate in a batch ED operation for a given time
6 Conclusions
Calcium ion (CaCl2 25molsdotmminus3) removal rate depends on
feed flow rates electrolyte (anolytecatholyte) componentsconcentrations applied potential and so forth NaOH ascatholyte showed higher removal rate and increased masstransfer coefficient over mixed electrolyte (AA-Na
2EDTA)
Specific energy consumption (119864sp kWhsdotkgminus1) estimates forthree typical set of experiments (Table 4) also support theabove observation of easy ion removal rate Based on thisit may be concluded that although NaOH shows betterperformance for the duration chosen in this report but anuninterrupted mode ED operation would be feasible withmixed electrolyte only but of course energy consumption willbe partly increasing The unsteady state model used could
International Journal of Electrochemistry 11
0 5 10 15 20 25
1018
1020
1022
1024
1026
Conc of CaCl2 in 5 wt sugar solution (molmiddotmminus3)
Den
sity
(kgmiddot
mminus3)
y = 0323x + 10175
R2 = 0984
Figure 12 Calibration chart used to estimate solution density(kgsdotmminus3) from molar concentration of CaCl
2(molsdotmminus3) in 5wt
sugar solution
effectively predict the current density and concentrationchange with an accuracy of 95
Appendix
Density values of 5 sugar solution with varying concen-tration of CaCl
2were estimated from the fitted equation
(Density (kgsdotmminus3) = 0323 times Concentration (molsdotmminus3) +10175 1198772 = 98) obtained from the experimental data ofdensity versus concentration of CaCl
2in 5 sugar solution
(Figure 12)
Nomenclature
List of Symbols
119886 Sh number empirical equation constant119860
119898 Area of the membrane m2
119887 Sh number empirical equation constant119888 Sh number empirical equation constant119862 Concentration molsdotmminus3119863 Diffusivity of the salt or ion in the solution
at temperature 119879119863
∘ Diffusivity of the salt or ion at infinitedilution at temperature 119879
119863
119895 Diffusivity of ion ldquo119895rdquo
119864el Electrode potential V119864tot Total electric potential applied V119864sp Specific energy consumption kWhsdotkgminus1
119865 Faraday constant Csdotgm-eqminus1119894 Current density Asdotmminus2119894
119895lim Limiting current density of ion ldquo119895rdquo119868 Ionic strength119869 Current 119860119896 Mass transfer coefficient ms119871 Characteristic length m
119898
119895 Molality of ion ldquo119895rdquo
119876 Volumetric flow rate m3sdotsminus1119877 Gas constant Jsdotkgminus1sdotKminus1119877anolyte Resistance of anolyte chamber119877catholyte Resistance of catholyte chamber119877diluate Resistance of diluate chamber119877tot Total Resistance of the electrodialysis cellRe Reynolds numberSc Schmidt numberSh Sherwood number119905 Time s119879 Temperature 119870119905
+CEM Transport number of cation in cationexchange membrane
119905
minusAEM Transport number of anion in anionexchange membrane
119905
119895119898 Transport number of ion ldquo119895rdquo in the
membrane119905
119895119887 Transport number of ion ldquo119895rdquo in the bulk
solutionV Velocity ms119881 Volume m3119911 Ion charge
Subscripts
AEM Anion exchange membrane119887 Bulk solutionCEM Cation exchange membraneC Compartment119895 Ion ldquo119895rdquo119879 Feed tankplusmn Cation or anion
Superscripts
Conc Concentratedil Diluatelim Limiting
Greek Symbols
120578 Current efficiency120576 Applied voltage V120583 Viscosity of the solution at the same
temperature 119879 Pasdots120583
∘ Viscosity of the pure water at atemperature 119879 Pasdots
Λ Conductivity 119878120582
+ 120582
minus Limiting (zero concentration) ionicconductance(Asdotcmminus2)sdot(Vsdotcmminus1)(g-eqvsdotcmminus3)
120588 Density kgsdotmminus3120575 Diffusion boundary layer thickness m120585 Potential gradient Vsdotmminus1120595 Potential drop in the diffusion boundary
layer V120574
plusmn Mean ionic activity coefficient
12 International Journal of Electrochemistry
Conflict of Interests
The authors declare that there is no conflict of interestsregarding to the publication of this paper
Acknowledgment
Financial support to execute the experimental work is grate-fully acknowledged to IIT Roorkee (no IITRSRIC244FIG-Sch-A)
References
[1] R B L Mathur Handbook of Cane Sugar Technology Oxfordand IBH Publishing New Delhi India 1978
[2] F Smagghe JMourgues J L Escudier T Conte JMolinier andC Malmary ldquoRecovery of calcium tartrate and calcium malatein effluents from grape sugar production by electrodialysisrdquoBioresource Technology vol 39 no 2 pp 185ndash189 1992
[3] A Elmidaoui L Chay M Tahaikt et al ldquoDemineralisation ofbeet sugar syrup juice and molasses using an electrodialysispilot plant to reduce melassigenic ionsrdquo Desalination vol 165p 435 2004
[4] G Tragardh and V Gekas ldquoMembrane technology in the sugarindustryrdquo Desalination vol 69 no 1 pp 9ndash17 1988
[5] H Strathmann Ion-Exchange Membrane Separation ProcessesElsevier 2004
[6] J J Krol M Wessling and H Strathmann ldquoConcentra-tion polarization with monopolar ion exchange membranescurrent-voltage curves and water dissociationrdquo Journal of Mem-brane Science vol 162 no 1-2 pp 145ndash154 1999
[7] V Geraldes and M D Afonso ldquoLimiting current density in theelectrodialysis of multi-ionic solutionsrdquo Journal of MembraneScience vol 360 no 1-2 pp 499ndash508 2010
[8] H Strathmann J J Krol H-J Rapp and G EigenbergerldquoLimiting current density and water dissociation in bipolarmembranesrdquo Journal of Membrane Science vol 125 no 1 pp123ndash142 1997
[9] H-J Lee H Strathmann and S-H Moon ldquoDetermination ofthe limiting current density in electrodialysis desalination as anempirical function of linear velocityrdquo Desalination vol 190 no1ndash3 pp 43ndash50 2006
[10] Y Tanaka ldquoLimiting current density of an ion-exchange mem-brane and of an electrodialyzerrdquo Journal of Membrane Sciencevol 266 no 1-2 pp 6ndash17 2005
[11] A Elmidaoui F Lutin L Chay M Taky M Tahaikt and M RA Hafidi ldquoRemoval of melassigenic ions for beet sugar syrupsby electrodialysis using a new anion-exchange membranerdquoDesalination vol 148 no 1ndash3 pp 143ndash148 2002
[12] Y Tanaka ldquoIrreversible thermodynamics and overall masstransport in ion-exchangemembrane electrodialysisrdquo Journal ofMembrane Science vol 281 no 1-2 pp 517ndash531 2006
[13] S Chattopadhyay Removal of Calcium Ion from Sugar Solutionthrough Electrodialysis Department of Chemical EngineeringIndian Institute of Technology Kanpur Kanpur India 1994
[14] B E Poling J M Prausnitz and J P OrsquoConnellThe Propertiesof Gases and Liquids McGraw-Hill New York NY USA 5thedition 2000
[15] L Yuan-Hui and S Gregory ldquoDiffusion of ions in sea water andin deep-sea sedimentsrdquo Geochimica et Cosmochimica Acta vol38 no 5 pp 703ndash714 1974
[16] httpwwwsugartechcozaviscosityindexphp[17] M S Isaacson andA A Sonin ldquoSherwood number and friction
factor correlations for electrodialysis systems with applicationto process optimizationrdquo Industrial amp Engineering ChemistryProcess Design and Development vol 15 no 2 pp 313ndash321 1976
[18] J M Ortiz J A Sotoca E Exposito et al ldquoBrackish waterdesalination by electrodialysis batch recirculation operationmodelingrdquo Journal of Membrane Science vol 252 no 1-2 pp65ndash75 2005
[19] F S Rohman M R Othman and N Aziz ldquoModeling ofbatch electrodialysis for hydrochloric acid recoveryrdquo ChemicalEngineering Journal vol 162 no 2 pp 466ndash479 2010
[20] R E Treybal Mass-Transfer Operations McGraw-Hill NewYork NY USA 3rd edition 1980
[21] R B Bird W E Stewart and E N Lightfoot TransportPhenomenon John Wiley amp Sons 2nd edition 2002
[22] J Balster M H Yildirim D F Stamatialis et al ldquoMorphologyandmicrotopology of cation-exchange polymers and the originof the overlimiting currentrdquo The Journal of Physical ChemistryB vol 111 no 9 pp 2152ndash2165 2007
[23] O V Grigorchuk V I Vasilrsquoeva and V A Shaposhnik ldquoLocalcharacteristics of mass transfer under electrodialysis deminer-alizationrdquo Desalination vol 184 no 1ndash3 pp 431ndash438 2005
[24] V M Barragan and C Ruız-Bauza ldquoCurrent-voltage curves forion-exchange membranes a method for determining the limit-ing current densityrdquo Journal of Colloid and Interface Science vol205 no 2 pp 365ndash373 1998
[25] J Koryta J Dvorak and L KavanPrinciples of ElectrochemistryJohn Wiley amp Sons New York NY USA 2nd edition 1993
[26] N Kabay M Demircioglu E Ersoz and I KurucaovalildquoRemoval of calcium and magnesium hardness of electrodial-ysisrdquo Desalination vol 149 no 1ndash3 pp 343ndash349 2002
[27] M Araya-Farias and L Bazinet ldquoElectrodialysis of calciumand carbonate high-concentration solutions and impact onmembrane foulingrdquoDesalination vol 200 no 1ndash3 p 624 2006
[28] httpwww4ncsuedusimfranzenpublic htmlCH201dataSol-ubility Product Constantspdf
Submit your manuscripts athttpwwwhindawicom
Hindawi Publishing Corporationhttpwwwhindawicom Volume 2014
Inorganic ChemistryInternational Journal of
Hindawi Publishing Corporation httpwwwhindawicom Volume 2014
International Journal ofPhotoenergy
Hindawi Publishing Corporationhttpwwwhindawicom Volume 2014
Carbohydrate Chemistry
International Journal of
Hindawi Publishing Corporationhttpwwwhindawicom Volume 2014
Journal of
Chemistry
Hindawi Publishing Corporationhttpwwwhindawicom Volume 2014
Advances in
Physical Chemistry
Hindawi Publishing Corporationhttpwwwhindawicom
Analytical Methods in Chemistry
Journal of
Volume 2014
Bioinorganic Chemistry and ApplicationsHindawi Publishing Corporationhttpwwwhindawicom Volume 2014
SpectroscopyInternational Journal of
Hindawi Publishing Corporationhttpwwwhindawicom Volume 2014
The Scientific World JournalHindawi Publishing Corporation httpwwwhindawicom Volume 2014
Medicinal ChemistryInternational Journal of
Hindawi Publishing Corporationhttpwwwhindawicom Volume 2014
Chromatography Research International
Hindawi Publishing Corporationhttpwwwhindawicom Volume 2014
Applied ChemistryJournal of
Hindawi Publishing Corporationhttpwwwhindawicom Volume 2014
Hindawi Publishing Corporationhttpwwwhindawicom Volume 2014
Theoretical ChemistryJournal of
Hindawi Publishing Corporationhttpwwwhindawicom Volume 2014
Journal of
Spectroscopy
Analytical ChemistryInternational Journal of
Hindawi Publishing Corporationhttpwwwhindawicom Volume 2014
Journal of
Hindawi Publishing Corporationhttpwwwhindawicom Volume 2014
Quantum Chemistry
Hindawi Publishing Corporationhttpwwwhindawicom Volume 2014
Organic Chemistry International
ElectrochemistryInternational Journal of
Hindawi Publishing Corporation httpwwwhindawicom Volume 2014
Hindawi Publishing Corporationhttpwwwhindawicom Volume 2014
CatalystsJournal of
2 International Journal of Electrochemistry
the net salt transport This issue was taken up and sorted outusing different combination of anolyte and catholyte streamsDifferent electrolyte streams (NaOH acetic acid-Na
2EDTA
mixture) were selected as catholyte keeping anolyte as HClsolution
In a batch mode electrodialysis with continuous recircu-lation of feed stream properties like electrolyte concentrationof diluate (feed tank) concentration profiles around thatmembrane and all physical properties of the solution changewith timeThe effect of all these parameters is reflected in ionremoval rate and current density of the ED cell Therefore anunsteady state model that can closely predict the ion removalrate and overall current density will be quite relevant in appli-cation point of view Nernst-Planck equation (purely basedon first principles) and irreversible thermodynamics wereused to estimate current density and ion concentration [12]
2 Materials and Methods
21 Equipment
211 Electrodialysis Setup The experimental setup used forED application is shown in the Figure 1 [13] The ED cell andsetup were from Berghof Germany The electric field wasapplied across the cell stack by a built-in DC source Voltageand current between the two electrodes were measured by abuilt-in digital voltmeter and ammeter respectively The EDcell consisted of three compartments as shown in the figureMembranes used were obtained from Permionics Gujaratand cross-linked styrene and di-vinyl benzene gel was used asbase material Cation exchange membrane (CEM) separatesthe cathode compartment and anion exchange membrane(AEM) separates the anode compartment from the feedchamber The effective membrane area for the cell 119860
119898
was 00037m2 and the feed compartment thickness ℎ was0002m
212 Power Supply The power supply was provided througha voltage stabilizer of 110220V AC with 50ndash80Hz fre-quency The same gave an output voltage 0ndash499V DC andcurrent 0ndash399A Four centrifugal pumps were inbuilt withthe system for pumping the solution
213 Conductivity Meter Solution conductivity was noted atregular interval through an offline conductivity meter (Sys-tronics India) of 200mMho with 5 ranges (accuracy plusmn1)
214 ED Cell Compartments and Solutions Used 1000mLsolutions of each stream (feed catholyte and anolyte) weretaken in three chambers (Figure 1) respectively Each cham-ber was connected with the respective three compartmentsof the ED cell through flexi tubing Solutions were circulatedat a constant rate by three centrifugal pumps and the solutionflow rates were measured using rotameters connected to eachstream Table 1 indicates membrane parameters obtainedfrom Permionics India Ltd The composition and flow ratesof three streams used are reported in Table 2
Synthetic solution of 5 sugar and calcium chloride(CaCl
2) was prepared in distilled water The concentration of
FeedAnolytetank
Catholytetank
V
A
CEM
AEM
DC source
R
R R
Solution flow linesCurrent lines
A AmmeterV Voltmeter
R RotameterAEM Anion exchange membraneCEM Cation exchange membrane
tank
+ minus
minus
+
Figure 1 Batch recirculation electrodialysis process showing thestorage tanks pumps manual control valves various chambers ofthe ED cell electrodes DC supply source voltmeter ammeter andflow meters used in the experiment [13]
Table 1 Membrane parameters as obtained from Permionics IndiaLtd
Physical parameters Cation exchangemembrane
Anion exchangemembrane
Transport number 091 09Experimental resistance(ohm cmminus2) 20ndash35 mdash
Max pressure allowed(kgcmminus2) 30 30
Thickness (mm) 011 to 015 009ndash011Max temperature (∘C) 60 60
sugar was kept unchanged but that of CaCl2was varied The
synthetic solution having CaCl2with initial concentrations of
25molsdotmminus3 and 50molsdotmminus3 were used in the diluate channelof ED cell Dilute solution of HCl (100molsdotmminus3) was usedas anolyte in all experiments while NaOH (100molsdotmminus3) wasused as catholyte in experiment 1 and equimolar mixtures ofacetic acid (AA) andNa
2EDTA (25molsdotmminus3 and 50molsdotmminus3)
were respectively used as catholyte in experiments 2 and 3(Table 2)
215 Viscosity Measurement Viscosity measurement wascarried out using Ubbelhood viscometer always fitted in aconstant temperature bath to nullify any temperature effecton capillary flow
22 Procedure The chambers of the ED cell and membraneswere washed thoroughly before each experiment was carriedout Initially the feed solution containing 5 sugar andCaCl
2
International Journal of Electrochemistry 3
Table 2 Different process variables chosen during ED experimentation [13]
Exptnumber Feed solution
Feed flowrate
(mLsdotminminus1)Anolyte solution
Anolyte flowrate
(mLsdotminminus1)Catholyte solution
Catholyteflow rate
(mLsdotminminus1)
Voltageapplied (V)
Time(min)
125molsdotmminus3 CaCl2
in 5 sugarsolution
130 100molsdotmminus3HClsolution 830 100molsdotmminus3NaOH
solution 830 4 685
225molsdotmminus3 CaCl2
in 5 sugarsolution
130 100molsdotmminus3HClsolution 830
25molsdotmminus3Na2EDTA+ 25molsdotmminus3 AA
solution830 4 240
350molsdotmminus3 CaCl2
in 5 sugarsolution
130 100molsdotmminus3HClsolution 830
50molsdotmminus3Na2EDTA+ 50molsdotmminus3 AA
solution830 4 240
was used and was circulated at a constant rate (130mLmin)through the feed compartment The feed solution anolyteand catholyte were continuously recycled through the ED celland that caused a continuous change in salt concentrationof feed solution The concentration was measured at regularintervals For a fixed applied voltage (119881) variation of current(ldquo119868rdquo through the membrane stack) and concentration of salt(Ca2+ ions) was estimated from conductivity measurementand using standard calibration chart (mass concentrationversus conductance) and was recorded with time (119905)
ED cell was dismantled membranes were taken outchecked visually to find any deposition over the surfaces aftereach experimentMembraneswere thenwashedwith distilledwater and oven dried at 100∘C for 24 hours and weighed tofind any gain or loss in mass of membrane
3 Modeling of Ion Transport
Current density and limiting current density (LCD) of anED cell is a function of a series of parameters for exam-ple physical (cell geometry flow dynamics spacer spacingsolution density and viscosity) and chemical (ion concen-tration transport number and diffusivity) for a given setof membrane pairs Precise estimate of these parametersand application of Nernst-Planck equation (assuming zeroion concentration on the membrane surface) would give atheoretical estimate of LCD which can also be determinedexperimentally from plot of 119868 versus 119881 characteristics of theelectrolyte in the ED cell [7 9]
31 Determination of Bulk Concentration of Diluate Compart-ment Concentration of ions was obtained through unsteadymass balance over diluate catholyte and anolyte compart-ments The following assumptions were made [18]
(i) The ED cell and the feed tank are approximated to bea perfectly mixed flow reactor
(ii) Back diffusion of ions was ignored(iii) Electroneutrality condition is always maintained
Themass balance equation of diluate compartment in the EDcell can be expressed as
119881dilC119889119862
dil
119889119905
= 119876
dil(119862
dil119879
minus 119862
dil) minus
120578119894119860
119898
119911119865
(1)
where 119881dilC is the volume of the diluate compartment (m3)and 119905 is time (s)119862dil
119879and119862dil represent diluate concentrations
leaving feed tank and leaving cell compartment (molsdotmminus3)119876
dil is the diluate volumetric flow rate (m3s) 120578 is the currentefficiency 119894 is the current density (Asdotmminus2) and 119860
119898is the
effective membrane area (m2)120578 can be obtained from the following equation [18 19]
120578 = 119905
+CEM + 119905
minusAEM minus 1 (2)
where 119905
+CEM is the transport number of cation in cationexchange membranes and 119905
minusAEM is the transport number ofanion in anion exchange membrane
Similarly unsteady state mass balance around feed tankcan be written as
119889 (119881
119879119862
dil119879)
119889119905
= 119876
dil(119862
dilminus 119862
dil119879)
(3)
where 119881
119879is the volume of feed tank (m3) During electro-
dialysis water transport occurs across the membranes dueto electroosmosis and osmosis [19] Volume change (due towater transport) was ignored as there was no net volumechange noted experimentally
32 Determination of the Current Density
321 Overall Flux Equation A pictorial representation ofdifferent concentration profiles possibly developed aroundthe membrane is described in Figure 2 The flux of ions pass-ing through the membrane can be expressed by generalizedNernst Planck equation as [7]
119873
119895= minus119863
119895
120597119862
119895
120597119909
minus
119911
119895119862
119895119865119863
119895
119877119879
120597120595
120597119909
(4)
where 119909 is the distance measured from boundary layer incontact with the bulk solution in diluate channel towardsthe membrane 119863
119895is the diffusivity of ion (m2sdotsminus1) 119862
119895is
the concentration of ion 119895 (molsdotmminus3) 119877 is the universal gasconstant (8314 Jsdotmolminus1sdotkminus1) 119879 is the temperature (K) 119911
119895is
the charge of diffusing species 119895 and 120597120595120597119909 is the potentialgradient (Vsdotmminus1) and 119865 is the Faraday constant (Csdotgeqvminus1)
4 International Journal of Electrochemistry
Diffusion boundary layer
Concentrate Diluate
Cation exchange membrane
++
minus
Cconcjm
Cconcjb
Cdiljm
Cdiljb
120575 120575
Figure 2 Depiction of ion transport and hypothetical linear con-centration boundary layer formed across either side of the mem-brane in ED cell
The total molar flux of ion ldquo119895rdquo through the ion exchangemembrane 119873
119895119898 can be related to the current density 119894 as
[7]
119873
119895119898=
119905
119895119898119894
119911
119895119865
(5)
where 119905119895119898
is the transport number of ion 119895 in the membrane119894 is current per unit area of membrane or current density(Asdotmminus2) and 119911
119895is the charge of the ion
At steady state119873119895and119873
119895119898are equal that is
119905
119895119898119894
119911
119895119865
= minus119863
119895
120597119862
119895
120597119909
minus
119911
119895119862
119895119865119863
119895
119877119879
120597120595
120597119909
(6)
Assuming that a linear profile of the concentration distribu-tion exists along the boundary layer the linearized Nernst-Planck equation could be used instead of (6) Expression forthe linearized Nernst-Planck equation when applied in thediluate chamber is [7]
119905
119895119898119894
119911
119895119865
=
119863
119895(119862
dil119895119887
minus 119862
dil119895119898
)
120575
minus
119911
119895119863
119895119865120585119862
dil119895119898
119877119879
(7)
where 120575 is the boundary layer thickness (m)119862dil119895119887
and119862dil119895119898
areconcentrations of ions in bulk and at the membrane surfacerespectively of the diluate compartment and 120585 is the potentialgradient (Vsdotmminus1) and is expressed as
120585 =
120595
120575
(8)
In (7) the first part that is119863119895(119862
dil119895119887
minus119862
dil119895119898
)120575 denotes flux duetomolecular diffusion flux of ion arising out of concentrationvariation between solution bulk and boundary layer overmembrane surface The second part that is 119911
119895119863
119895119865120585119862
dil119895119898
119877119879shows flux due to externally applied potential over themembrane
322 Boundary LayerThickness 120575 Estimation 120575 is estimatedusing film theory (equation (9)) and salt mass-transfercoefficient [7 20] Salt mass-transfer coefficient is usuallydetermined based on salt diffusivity and suitable mass-transfer correlation which in-turn is dependent on flowprofile andphysical properties of the fluids cell geometry andsurface morphology of membranes used in ED cell [7 9 2122]
120575 =
119863
119895
119896
(9)
where 119863119895and 119896 are diffusivity and mass transfer coefficient
of diffusing species in solution Each of these parameters wasseparately estimated using standard correlations The masstransfer coefficient was obtained from Sherwood number[7 20 21] as
Sh =
119896 sdot 119897
119863
119895
(10)
where 119897 is the characteristic length (m) Sherwood numberSh is expressed as a function of Reynolds number Re andSchmidt number Sc [7 20] The empirical expression ofSherwood number is based on cell geometry and spacerconfiguration chosen for the present cell as indicated in thefollowing [17 20 23]
Sh = 119886 sdot Re119887 sdot Sc119888 (11)
where Sc (Schmidt number 120583120588119863119895) is estimated from phys-
ical properties (viscosity and density) of the medium whileReynolds number (120588V119897120583) indicates flow characteristics ofthe medium and channel spacing as ldquo119897rdquo and 119886 119887 119888 are theempirical constants which are determined by fitting the data(ShScc versus Re) for experiments where flow rate is variedIn this work the values of 119886 119887 and 119888 are taken from literature[17] and are given in Table 3
Ionic diffusivity is entirely dependent on the size ofhydrodynamic diameter of ions Assuming infinite dilutionthis ionic diffusivity is estimated using the Nernst-Haskelequation (12) [14] as
119863
∘=
119877119879 [(1119911
+) + (1119911
minus)]
119865
2[(1120582
+) + (1120582
minus)]
(12)
where 119911+and 119911
minusdenote charges of cation and anion respec-
tively while 120582+and 120582
minusdenote limiting ionic conductance in
the solvent Other parameters bearing meaning and units areas reported in the nomenclature
International Journal of Electrochemistry 5
Table 3 Values of different physical parameters used in the model
Parameter Value ReferenceTemperature 119879 298K This workTransport number of the cation in CEM 119905
+CEM 091 Table 1Transport number of the anion in AEM 119905
minusAEM 09 Table 1Transport number of cation in the solution 119905Ca2+ 119904 04387 This work [7]Transport number of anion in the solution 119905Clminus 119904 05613 This work [7]Diffusivity of CaCl2 in 5 sugar solution at 25∘C119863CaCl2 1198 times 10minus9m2
sdotsminus1 This work [14 15]Diffusivity of Ca2+ ions at infinite dilution and at 25∘C119863∘Ca2+ 792 times 10minus10m2
sdotsminus1 This work [14]Diffusivity of Ca2+ ions in 5 sugar solutions at 25∘C119863Ca2+ 711 times 10minus10m2
sdotsminus1 This work [14 15]Diffusivity of Clminus ions in 5 sugar solutions at 25∘C119863Clminus 182 times 10minus10m2
sdotsminus1 This work [14 15]Distance between adjacent membranes 119897 2 times 10minus3m This workArea of the membrane 119860
11989837 times 10minus3m2 This work
Charge on the calcium ion 119911Ca2+ +2 This workViscosity of 5 sugar solution 120583 992 times 10minus4 Pasdots [16]Velocity of the feed stream V 31 times 10minus2msdotsminus1 This workApplied voltage 119864tot 4 V This workCurrent density initial value 119894(0) 122Asdotmminus2 This workCurrent efficiency 120578 081 This work
Sh number empirical equation constant 119886 046 for catholyte NaOH [17]025 plusmn 003 for catholyte AA-Na2EDTA This work
Sh number empirical equation constant 119887 063 for any anolyte and catholyte [17]Sh number empirical equation constant 119888 033 for any anolyte and catholyte [17]
Diffusivity is a strong function of viscosity which wascorrected using equation proposed by Yuan-Hui andGregory[15]
119863
119863
∘=
120583
∘
120583
(13)
323 Estimation of Membrane Surface Concentration Themembrane surface concentration of ions is dependent oncurrent density under an applied voltage As long as the EDoperation is executed below limiting current (surface con-centration becomes zero) the surface concentration on eitherside can be estimated from bulk concentration measurement(diluateconcentrate) current density and limiting currentdensity using (14) and (15) [19 24]
119862
conc119895119898
= 119862
conc119895119887
(1 +
119894
119894
119895lim) (14)
119862
dil119895119898
= 119862
dil119895119887
(1 minus
119894
119894
119895lim) (15)
where 119862
conc119895119898
and 119862
conc119895119887
are the concentrations of ion 119895on the membrane surface and in bulk of the concentratecompartment respectively in the ED cell 119862dil
119895119898and 119862
dil119895119887
arethe concentrations of ion 119895 on the membrane surface and inthe bulk of the diluate side respectively in the ED cell
324 Estimation of Current Density and Limiting CurrentDensity (119894 and 119894
119895119897119894119898) LCD(of a single electrolyte) is estimated
using the following equation [5 9]
119894
119895lim =
119862
dil119895119887119863
119895119911
119895119865
120575 (119905
119895119898minus 119905
119895119887)
(16)
where 119905
119895119898and 119905
119895119887are transport numbers of ion 119895 in
membrane and electrolyte solution respectivelyConsidering ion flux in the diluate side of the IEM (15)
is used to calculate concentration of ion 119895 at the membranesurface of diluate side 119862dil
119895119898
The current density can be expressed by (17) after substi-tution of (15) and (16) in (6)
119894 = (119862
dil119895119887119863
119895119911
119895120585
119865
119877119879
)
times (
119905
119895119898minus 119905
119895119887
119911
119895119865
+
120585120575 (119905
119895119898minus 119905
119895119887)
119877119879
minus
119905
119895119898119911
119895
119865
)
minus1
(17)
where 120585 the potential gradient can be estimated from Nernstequation given as follows [18 19]
120585 = minus (2119905
119895119898minus 1)
119877119879
120575119865
ln(
120574
dil119887119862
dil119895119887
120574
dil119898119862
dil119895119898
) (18)
where 120574
dil119898
and 120574
dil119887
are the mean ionic activity coefficientscorresponding to the ions at the wall of IEM and in the bulk
6 International Journal of Electrochemistry
of solution respectively within the diluate channel and theycan be estimated using Debye-Huckel limiting law [25]
4 Numerical Estimation of Parameters
The sequence of steps followed to obtain theoretical estimateof concentration variation is described using flow chart(Figure 3) The differential equations (1) and (3) were inte-grated using Euler method with 1 s time step Few crucialparameters and their evaluationmethod are presented below
41 Determination of Transport Number of Ion in SolutionBulk transport number 119905
119895119887is the fraction of total current
carried by the ion type which is a function of diffusioncoefficient and ionic mobility of hydrated species Ions insolution get hydrated with solvent molecules and differencein hydration ability causes variation in size diffusivity andmobility of such species Thus ions do not transport currentequally in solution The transport number was estimatedusing following equation [7]
119905
119895119887=
1003816
1003816
1003816
1003816
1003816
119911
119895
1003816
1003816
1003816
1003816
1003816
119863
119895
sum
119899
119895=1
1003816
1003816
1003816
1003816
1003816
119911
119895
1003816
1003816
1003816
1003816
1003816
119863
119895
(19)
For a binary-ion salt solution 119899 = 2 119895 = 1 for cation and119895 = 2 for anion respectively
42 Determination of Current from Resistance MeasurementInitial current density estimation is essential to obtain saltconcentration at membrane surface and start numericalintegration which may be evaluated either experimentally orfrom applied potential and solution resistance using Ohmrsquoslaw The potential applied may be expressed as
119864tot minus 119864el = 119877tot sdot 119869 (20)
where 119864el is the potential drop near the electrodes 119877tot isthe overall resistance (ohm) of the ED cell and 119869 is thecurrent (119860) The overall resistance is the sum of resistancesof individual chambers
119877tot = 119877anolyte + 119877diluate + 119877catholyte (21)
where resistance of anolyte catholyte and diluate channel aredetermined either directly from conductivity measurementor from extended Kohlrausch-equation [19 25] The conduc-tivity and the resistance are related as
Resistance = 1
Λ
119871
119860
119898
(22)
where Λ is the conductivity of solution (mhosdotmminus1) 119871 is thegap between membranes or the compartment thickness (m)and 119860
119898is the effective membrane area (m2)
43 Determination of Specific Energy Consumption The spe-cific energy consumption 119864sp (kWhsdotkgminus1) was obtainedusing the following equation
119864sp =
int
1199052
1199051
120576119860
119898119894 (119905) 119889119905
119872CaCl2
Δ119899CaCl2(119905)
(23)
Input data Estimate
Estimate
EstimateNo
Comparison with experimental data
and error calculation
Yes
PlotsEnd
t1 = t1 + Δt
t1 = t + Δt
t = t0
120585(t) and i(t)
t1 = tend
CdilT (0) Cdil(0)
CconcT (0) Cconc(0)
i(0) EtotQdilVdil t0
Δt tend
CdilT (t1) Cdil(t1)
CconcT (t1) Cconc(t1)
ilim(t) Cconcjm (t)
Cdiljm(t)
ilim versus t i versus tCT
dil versus t
Figure 3 MATLAB program algorithm showing calculation stepsfollowed to estimate process parameters
where 120576 is the applied potential in V 119860119898is the area of the
membrane in m2 119894(119905) is the current density as a functionof time in Asdotmminus2 119872CaCl
2
is the molecular mass of CaCl2
(=11102 gmol) and Δ119899CaCl2
(119905) is the number of moles ofCaCl2removed from the feed solution at various time
intervals
5 Results and Discussions
51 Role of Sugar and CaCl2Concentration on Solution
Viscosity and Influence of Temperature Sugar solution vis-cosity increases nonlinearly (Figure 4) with increase in sugarconcentration (5 to 20wt) Viscosity values range between072 and 15mPasdots with increase in sugar concentrationThese values were very much comparable with the literaturereported data [16] Solution viscosity does not show anyappreciable change with CaCl
2concentration (0ndash50molm3)
(Figure 5) Influence of temperature on CaCl2solution vis-
cosity was recorded at 20 25 32 37 and 42∘C and viscositydecreases between 122 and 07mPasdots Nearly sim43 loweringin solution viscosity with temperature rise between 20 and42∘C is noted in Figure 5
52 Role of Sugar and CaCl2Concentration on Electrical
Conductivity of Electrolyte Figure 6 shows plot of CaCl2con-
centration on the electrical conductivity whichwas estimatedin presence and absence of sugar Electrical conductivityincreases almost linearly with rise in CaCl
2concentration
(5 to 50molsdotmminus3) The CaCl2 being a strong electrolyte
dissociates completely in solution thus increasing numberof ions per unit volume available for ionic conductance Onthe contrary sugar addition dampens the conductivity valueThis is possibly because sugar is a water soluble nonelec-trolyte which does not change the number of ionic speciesresponsible for current carriage thus presence of inert sugarmolecules basically increases crowding in solution
53 Effect of Applied Potential on Ion-Removal Rate Theapplied potential is a crucial parameter to define removal
International Journal of Electrochemistry 7
0 2 4 6 8 10
10
11
12 y = 00209x + 0989756
R2 = 098
Visc
osity
at20
∘ C(m
Pamiddots)
Sugar (wtwt) in 20molmiddotmminus3 CaCl2 solution ()
Figure 4 Effect of wt of sugar on solution viscosity at 20∘C
0 10 20 30 40 5006
08
10
12
14
16
Concentration of CaCl2 in 3)
Visc
osity
(mPamiddots)
20∘C25∘C32∘C
37∘C42∘C
5 wt sugar solution (molm
Figure 5 Effect of concentration of CaCl2in 5wt sugar solution
on solution viscosity at different temperatures
rate and efficiency With increased potential ion removalrate increases causing rapid lowering of batch time [26] In abatch operation with gradual lowering of ion concentrationthe current density keeps dropping Once the concentrationreaches below limiting value the solution resistance becomesvery high and heating starts At this increased temperatureelectrolysis of water starts and a major portion of appliedpotential gets consumed without much gain in ion removalThus overall energy consumption increases affecting processefficiency [5 22]
Three different voltages (4V 8V and 12V) were appliedkeeping other process parameters unchanged Figure 7 showseffect of applied potential on Ca2+ ion removal rate Withhigher potential the ion removal rate increases This isquite obvious because with increased electrical driving force
0 10 20 30 40 500
2
4
6
8
10
12
5 sugar solutionPure aq solution
Conc of CaCl2 (molmiddotmminus3)
Elec
tric
al co
nduc
tivity
at25
∘ C(m
S)
Figure 6 Effect of molar concentration of CaCl2in water with and
without sugar on electrical conductivity of solution
0 30 60 90 120 150 180 210 240
10
20
30
40
50
Time (min)
Con
cent
ratio
n of
CaC
l 2(m
olmiddotm
minus3)
4V8V12V
Figure 7 Effect of applied potential on the feed concen-tration Process conditions are feed 130mLmin with CaCl
2
(50molsdotmminus3) in 5wt sugar solution anolyte 830mLminwithHCl(100molsdotmminus3) catholyte 830mLmin with Na
2EDTA (50molsdotmminus3)
+ AA (50molsdotmminus3) applied voltage 4V 8V and 12V
(potential) more current passes through the solution as longas resistance remains unchanged It is interesting to note thatat lower potential the ion removal rate remains linear fora long duration (gt240min) indicating Ohmrsquos law might beapplicable This is not observed with higher potentials Withminus8V the nonlinearity appears at time sim180min while thesame happens at time sim120min for minus12 V Possibly unwantedelectrode reactions (water splitting) initiate at early stageswith increased potential This certainly influences the ionremoval rate showing variation in slope of the concentration
8 International Journal of Electrochemistry
drop curve This indicates that at higher voltage rapid deple-tion of ions and a nonlinear rise in resistance occurs Rapidnonlinear rise in solution resistance was also observed earlierby different scientists [8 9]
54 Effect of Flow Rate on Ion Removal Rate Change inion removal rate with variation in feed flow rate withoutdisturbing catholyte and anolyte streams conditions (flowrate components concentration etc) was analyzed andreported in Figure 8 Feed flow rates were varied as 80 130and 180mLmin and change in ion removal rate was notedafter nearly 60min of ED operation A slow rise in removalrate with increased flow rate was observed Increased flowrate possibly increased turbulence which reduced thicknessof stationary boundary film over membrane surface Thislowered the overall ion transfer resistance and increased ionremoval rate
55 Model Prediction of Experimental ldquoirdquo and Ca2+ IonConcentration The batch mode of electrodialysis with con-tinuous recirculation under an applied potential becomes anunsteady state processThe electrolyte concentrations of dilu-ate (feed tank) and concentrate streams solution resistance(conductivity) concentration profile around membrane andbulk physical properties of the solution become time depen-dent The cumulative effects of all these parameters arereflected in diluate (feed tank) concentration and overallcurrent density of the ED cell Therefore the mathematicalmodel emphasizes two crucial parameters (i) electrolyte(CaCl
2) concentration of the diluate stream (feed tank) and
(ii) overall current density of the cell Unsteady state massbalance around the diluate channeltank is written in termsof important process variables for example vessel volumeflow rate concentration current density current efficiencyand membrane area Nernst Planck equation and irreversiblethermodynamics are used to estimate the ionic flux throughthe boundary layer over the membraneThe model proposedclosely predicts experimental data between the chosen rangeof process condition of Ca2+ ion (Figures 9 and 10) andcurrent density with time (Figure 9) in the ED cell
Molar concentration of the recirculating feed solutionwasobtained by solving coupled differential equations Equations(1) and (3) and physical process parameters values are listed inTable 3 Solution steps (using MATLAB code) are discussedin Figure 3 The concentration estimates so obtained wereused to estimate current density 119894 (17)The theoretical modelcould closely predict the experimental data (Experiments 1 2and 3) of concentration variation (Figures 9 and 10) Experi-ments 2 and 3 performed with two different concentrationsof CaCl
2(25 and 50molsdotmminus3) in feed solution behaved in
the same manner (Figure 10) This supports the fact that themethod adopted in concentration estimation was correct andreproducible
Initially solute concentration (25molsdotmminus3) of the feedsolution drops steadily in experiment 1 the rate of whichslows down after nearly 200min (Figure 9)The experimentalcurrent density also follows same trend (Figure 9) A steadydrop in current density from 120Asdotmminus2 to 40Asdotmminus2 during
0 50 100 150 200 250
10
20
30
40
50
Time (min)
Feed flow rate
Con
cent
ratio
n of
CaC
l 2(m
olmiddotm
minus3)
80mLmin130mLmin180mLmin
Figure 8 Effect of feed flow rate on CaCl2removal from sugar
solution Process conditions of feed 80mLmin 130mLmin and180mLmin with CaCl
2(50molsdotmminus3) in 5 sugar solution anolyte
830mLmin with HCl (100molsdotmminus3) catholyte 830mLmin withNa2EDTA (50molsdotmminus3) + AA (50molsdotmminus3) applied voltage 8 V
0 100 200 300 400 500 600 7000
20
40
60
80
100
120
140
160
180
200
Time (min)
Cdil tankexpt molmiddotmminus3 in experiment 1
iexpt Amiddotmminus2 in experiment 1ilim Amiddotmminus2 in experiment 1Model prediction
Figure 9 Plot of limiting current density 119894lim (Asdotmminus2) experimentalcurrent density 119894 (Asdotmminus2) and molar concentration of diluate tank119862
dil119879expt (molsdotmminus3) (shown as discrete data points) versus time for a
given set of operating condition experiment 1 (feed flow rate =130mLsdotminminus1 anolyte = 100molsdotmminus3 HCl catholyte = 100molsdotmminus3NaOH applied voltage = 4V) [13] Theoretically predicted valuesof current and concentration variation with time are shown bycontinuous line
first 200min was recorded possibly due to rapid lowering inionic concentration in the diluate under applied potential of4V
International Journal of Electrochemistry 9
0 50 100 150 200 25010
15
20
25
30
35
40
45
50
55
60
Time (min)
Cdil tankexpt molmiddotmminus3 in experiment 2
Cdil tankexpt molmiddotmminus3 in experiment 3
Model prediction
Con
cent
ratio
n of
CaC
l 2(m
olmiddotm
minus3)
Figure 10 Close resemblance of theory (continuous line) withexperimental molar concentration of CaCl
2of the diluate tank
(molsdotmminus3) (discrete data points) versus time (min) for specifiedED operating conditions (i) experiment 2 (feed flow rate =130mLsdotminminus1 anolyte = 100molsdotmminus3 HCl catholyte = 25molsdotmminus3Na2EDTA + 25molsdotmminus3 AA applied voltage = 4V) (ii) Experiment
3 (feed flow rate = 130mLsdotminminus1 anolyte = 100molsdotmminus3 HClcatholyte = 50molsdotmminus3 Na
2EDTA + 50molsdotmminus3 AA applied voltage
= 4V) [13]
56 Role of Catholyte Composition and a Probable Mechanismfor Smooth Operation of ED CaCl
2is a strong electrolyte
and preferentially exists in ionized (Ca2+ and 2Clminus1) state inthe aqueous solution containing sugar (5)Water moleculesform a hydration sphere around each dissociated ion and sta-bilize it On application of external potential these hydratedspecies start crossing polar membranes charged with counterions and cause concentration polarization buildup across thepolar membrane
The approach adopted here is to minimize the concen-tration polarization Ca2+ ion crosses the cation exchangemembrane This was accomplished by either (i) precipitatingout the ions or by (ii) complexing out before a back diffusionsets in Two different catholyte streams were chosen with adefinite purpose for example (i) 01 N NaOH (which formsan insoluble precipitate of Ca2+ ion (23)) and (ii) a mixtureof acetic acid and di-sodium salt of EDTA (Na
2EDTA a
well-known complexing agent for bivalent cation (Ca2+)after it crosses the CEM (24)) Hydrated Ca2+ ions crosscation exchange membrane (CEM) and reaches catholytecompartment where it may precipitate or dissolve based onthe electrolyte (s) and pH of the catholyte stream Ca2+ ionsreact with theNaOHof catholyte stream and formsCa(OH)
2
As the solubility product of Ca(OH)2in water is very low
(sim10minus6) it experiences high probability of precipitation overmembrane surface facing higher pH Once this precipitatecomes in contact with electrolyte containing Na
2EDTA it
reacts and forms a stable complex CaNa2EDTA which
washes out the precipitate formed and cleans the membranesurfaceThe schemeof overall reaction is presented as follows
Ca2+ + 2 (OHminus) 997888rarr Ca (OH)
2
CO2
997888rarr CaCO3+H2O (24)
Ca2+ +Na2EDTA 997888rarr CaNa
2EDTA + 2H+ (25)
Bivalent cation are well known for their low solubility at highpH and often precipitate out as metal hydroxides [27] Thisprecipitation problem was also observed with calcium ionreported here when NaOH was used in catholyte streamFigure 11 shows NaOH (100molsdotmminus3) as catholyte streamsalthough increases ion removal rate initially but vigorousfouling prevented the process from running for long dura-tion With NaOH as catholyte Ca(OH)
2precipitation was
extensive which turned the membrane color from brownishyellow to white and probably blocked the swollen membranepores on the rare side Although this approach completelyarrested the reverse transport of Ca2+ ions but continuousoperation was limited due to membrane fouling increasedresistance and drop in current density Frequent acid washhelped in improving the membrane performance but contin-uous operation was not feasible
Formation of white solid powder was noted over themembrane (CEM) surface facing catholyte stream (NaOHhigher pH) in experiment 1 and experiment 3 The whitepowder over membrane was investigated further to havebetter understanding of the problem which arose after EDoperation for specified duration Quantitative estimations ofthe fouledmembrane weremade by gravimetric methodTheCEM membrane after ED experimentation was taken outwashed and weighed after drying and equilibration Theused membrane (equilibrated 24 hours at 100∘C) was foundto increase in mass over its initial mass (equilibrated) beforeED Gain of mass in used membrane is reported in Table 4
The white deposit on the membrane surface could beremoved by immersing the membrane in a dilute HCl (10in water) solution Immediately after immersion bubblingfrom the fouled surface of the membrane was observed Forcomplete dissolution of the white deposit the membrane wasleft immersed in the solution for sim30 minutes until bubblingstopped Subsequently the membrane was removed washedrepeatedly with deionized water and dried in oven (100∘Cfor 24 hours) and weighed A blank test was simultaneouslyperformed using a fresh membrane to record the differencebetween used and fresh membrane For an applied potentialthe dry mass of the used membrane was found to be depen-dent on its duration of application electrolyte concentrationand electrolyte stream pH
Multiple samples of the used membrane were tested andformation of bubbles was confirmed Once the bubblingstopped after immersing the membrane in dilute HCl solu-tion the piece was taken out washed dried and equilibratedbefore weighing Mass of the membrane did not deviatemuch from its initial value This indicated possibility of CO
2
evolution from the reaction of HCl with CaCO3 The most
probable sequence of the overall reaction occurring over the
10 International Journal of Electrochemistry
Table 4 Specific energy consumption mass transfer coefficient average running cost estimated and gravimetric analysis
ExptSpecific energy
consumption for CaCl2removal 119864sp (kWhsdotkgminus1)
Average running cost(INRg of CaCl2 removed)
Mass transfer coefficient119896 (msdotsminus1) times 105
weight gained by CEMdue to fouling
1 24023 47 1928 222 24027 34 1174 33 24027 19 1173 17
0 50 100 150 200 2500
10
20
30
40
50
60
70
80
90
100
Rem
oval
()
Time (min)
Anolyte = 100molmiddotmminus3 HClCatholyte = 25 molmiddotmminus3 Na2EDTA
+ 25molmiddotmminus3 AA
Anolyte = 100molmiddotmminus3 HClCatholyte = 100molmiddotmminus3 NaOH
Figure 11 Comparison of Ca2+ ions (feed solution 25molsdotmminus3)removal rate between two different techniques adopted Case 1anolyte = 100molsdotmminus3 HCl catholyte = 100molsdotmminus3NaOH Case2 anolyte = 100molsdotmminus3 HCl catholyte = 25molsdotmminus3 Na
2EDTA +
25molsdotmminus3 AA [13]
membrane surface and its subsequent cleaning with diluteHCl may be explained by the following scheme
CO2(air) + 2OHminus 997888rarr CO
3
2minus+H2O (26)
Ca(OH)
2+ CO2997888rarr CaCO
3(s) +H
2O (27)
CaCO3(s) +HCl 997888rarr CaCl
2+ CO2(g) +H
2O (28)
At higher pH solubility of CO2(air) increases in NaOH
solution (catholyte stream) which results in formation ofHCO3
minus1CO3
2minusThese ions subsequently react withNaOH toform Na
2CO3providing the source for CaCO
3precipitation
from Ca(OH)2 Conversion of Ca(OH)
2to CO
3
minus2 is (27)is thermodynamically favorable and moves forward Nearly1000 times higher value of solubility product of Ca(OH)
2
[55 times 10
minus6] over CaCO3[339 times 10
minus9] [28] drives the processfaster
Formation of CaCO3not only increasedmembrane resis-
tance to ion transport but alsomade the EDoperation discon-tinuous The process was made uninterrupted by changing
the electrolyte composition of the catholyte stream Herewe report application of Na
2EDTA-acetic acid solution as
catholyte stream the chelating agent continuously complexeswith the precipitated CaCO
3and formed corresponding
salt CaNa2EDTA The pH of catholyte stream was adjusted
between 35ndash50 (Table 2) and the anolyte was maintainedas HCl (100molsdotmminus3) This combination showed negligiblefouling even after long (240min) operation time (Table 4)
The mass transfer coefficients estimated from Sherwoodnumber correlation (11) showed higher values while NaOH(100molsdotmminus3) was used as catholyte stream compared toNa2EDTA-acetic acid (AA) combination (Table 4) Reduced
mass transfer coefficient with Na2EDTA-acetic acid stream
may be attributed to higher solution resistance arising possi-bly due to weak dissociation of acetic acid of Na
2EDTA + AA
combination than that of NaOH The dissociation constantcan get further affected due to Na
2EDTA (a bulky diffusing
species) Thus reduction in mass transfer coefficient loweredCa2+ ion removal rate
As of now we have understood that chemical compo-sition and concentration of anolytecatholyte streams playcrucial role in controlling overall resistance and ion removalrate The specific energy consumption 119864sp estimated from(23) (Table 4) shows lower value with NaOH compared to thestreams containing Na
2EDTA + AA
The average running cost to remove unit mass of CaCl2is
reported in Table 4 The cost is dependent on concentrationof the electrolyte stream and time of ED operation Cost isinversely proportional to initial concentration of the streamand directly proportional to operation time Energy dueto pumping is the major contribution to the overall costsestimate in a batch ED operation for a given time
6 Conclusions
Calcium ion (CaCl2 25molsdotmminus3) removal rate depends on
feed flow rates electrolyte (anolytecatholyte) componentsconcentrations applied potential and so forth NaOH ascatholyte showed higher removal rate and increased masstransfer coefficient over mixed electrolyte (AA-Na
2EDTA)
Specific energy consumption (119864sp kWhsdotkgminus1) estimates forthree typical set of experiments (Table 4) also support theabove observation of easy ion removal rate Based on thisit may be concluded that although NaOH shows betterperformance for the duration chosen in this report but anuninterrupted mode ED operation would be feasible withmixed electrolyte only but of course energy consumption willbe partly increasing The unsteady state model used could
International Journal of Electrochemistry 11
0 5 10 15 20 25
1018
1020
1022
1024
1026
Conc of CaCl2 in 5 wt sugar solution (molmiddotmminus3)
Den
sity
(kgmiddot
mminus3)
y = 0323x + 10175
R2 = 0984
Figure 12 Calibration chart used to estimate solution density(kgsdotmminus3) from molar concentration of CaCl
2(molsdotmminus3) in 5wt
sugar solution
effectively predict the current density and concentrationchange with an accuracy of 95
Appendix
Density values of 5 sugar solution with varying concen-tration of CaCl
2were estimated from the fitted equation
(Density (kgsdotmminus3) = 0323 times Concentration (molsdotmminus3) +10175 1198772 = 98) obtained from the experimental data ofdensity versus concentration of CaCl
2in 5 sugar solution
(Figure 12)
Nomenclature
List of Symbols
119886 Sh number empirical equation constant119860
119898 Area of the membrane m2
119887 Sh number empirical equation constant119888 Sh number empirical equation constant119862 Concentration molsdotmminus3119863 Diffusivity of the salt or ion in the solution
at temperature 119879119863
∘ Diffusivity of the salt or ion at infinitedilution at temperature 119879
119863
119895 Diffusivity of ion ldquo119895rdquo
119864el Electrode potential V119864tot Total electric potential applied V119864sp Specific energy consumption kWhsdotkgminus1
119865 Faraday constant Csdotgm-eqminus1119894 Current density Asdotmminus2119894
119895lim Limiting current density of ion ldquo119895rdquo119868 Ionic strength119869 Current 119860119896 Mass transfer coefficient ms119871 Characteristic length m
119898
119895 Molality of ion ldquo119895rdquo
119876 Volumetric flow rate m3sdotsminus1119877 Gas constant Jsdotkgminus1sdotKminus1119877anolyte Resistance of anolyte chamber119877catholyte Resistance of catholyte chamber119877diluate Resistance of diluate chamber119877tot Total Resistance of the electrodialysis cellRe Reynolds numberSc Schmidt numberSh Sherwood number119905 Time s119879 Temperature 119870119905
+CEM Transport number of cation in cationexchange membrane
119905
minusAEM Transport number of anion in anionexchange membrane
119905
119895119898 Transport number of ion ldquo119895rdquo in the
membrane119905
119895119887 Transport number of ion ldquo119895rdquo in the bulk
solutionV Velocity ms119881 Volume m3119911 Ion charge
Subscripts
AEM Anion exchange membrane119887 Bulk solutionCEM Cation exchange membraneC Compartment119895 Ion ldquo119895rdquo119879 Feed tankplusmn Cation or anion
Superscripts
Conc Concentratedil Diluatelim Limiting
Greek Symbols
120578 Current efficiency120576 Applied voltage V120583 Viscosity of the solution at the same
temperature 119879 Pasdots120583
∘ Viscosity of the pure water at atemperature 119879 Pasdots
Λ Conductivity 119878120582
+ 120582
minus Limiting (zero concentration) ionicconductance(Asdotcmminus2)sdot(Vsdotcmminus1)(g-eqvsdotcmminus3)
120588 Density kgsdotmminus3120575 Diffusion boundary layer thickness m120585 Potential gradient Vsdotmminus1120595 Potential drop in the diffusion boundary
layer V120574
plusmn Mean ionic activity coefficient
12 International Journal of Electrochemistry
Conflict of Interests
The authors declare that there is no conflict of interestsregarding to the publication of this paper
Acknowledgment
Financial support to execute the experimental work is grate-fully acknowledged to IIT Roorkee (no IITRSRIC244FIG-Sch-A)
References
[1] R B L Mathur Handbook of Cane Sugar Technology Oxfordand IBH Publishing New Delhi India 1978
[2] F Smagghe JMourgues J L Escudier T Conte JMolinier andC Malmary ldquoRecovery of calcium tartrate and calcium malatein effluents from grape sugar production by electrodialysisrdquoBioresource Technology vol 39 no 2 pp 185ndash189 1992
[3] A Elmidaoui L Chay M Tahaikt et al ldquoDemineralisation ofbeet sugar syrup juice and molasses using an electrodialysispilot plant to reduce melassigenic ionsrdquo Desalination vol 165p 435 2004
[4] G Tragardh and V Gekas ldquoMembrane technology in the sugarindustryrdquo Desalination vol 69 no 1 pp 9ndash17 1988
[5] H Strathmann Ion-Exchange Membrane Separation ProcessesElsevier 2004
[6] J J Krol M Wessling and H Strathmann ldquoConcentra-tion polarization with monopolar ion exchange membranescurrent-voltage curves and water dissociationrdquo Journal of Mem-brane Science vol 162 no 1-2 pp 145ndash154 1999
[7] V Geraldes and M D Afonso ldquoLimiting current density in theelectrodialysis of multi-ionic solutionsrdquo Journal of MembraneScience vol 360 no 1-2 pp 499ndash508 2010
[8] H Strathmann J J Krol H-J Rapp and G EigenbergerldquoLimiting current density and water dissociation in bipolarmembranesrdquo Journal of Membrane Science vol 125 no 1 pp123ndash142 1997
[9] H-J Lee H Strathmann and S-H Moon ldquoDetermination ofthe limiting current density in electrodialysis desalination as anempirical function of linear velocityrdquo Desalination vol 190 no1ndash3 pp 43ndash50 2006
[10] Y Tanaka ldquoLimiting current density of an ion-exchange mem-brane and of an electrodialyzerrdquo Journal of Membrane Sciencevol 266 no 1-2 pp 6ndash17 2005
[11] A Elmidaoui F Lutin L Chay M Taky M Tahaikt and M RA Hafidi ldquoRemoval of melassigenic ions for beet sugar syrupsby electrodialysis using a new anion-exchange membranerdquoDesalination vol 148 no 1ndash3 pp 143ndash148 2002
[12] Y Tanaka ldquoIrreversible thermodynamics and overall masstransport in ion-exchangemembrane electrodialysisrdquo Journal ofMembrane Science vol 281 no 1-2 pp 517ndash531 2006
[13] S Chattopadhyay Removal of Calcium Ion from Sugar Solutionthrough Electrodialysis Department of Chemical EngineeringIndian Institute of Technology Kanpur Kanpur India 1994
[14] B E Poling J M Prausnitz and J P OrsquoConnellThe Propertiesof Gases and Liquids McGraw-Hill New York NY USA 5thedition 2000
[15] L Yuan-Hui and S Gregory ldquoDiffusion of ions in sea water andin deep-sea sedimentsrdquo Geochimica et Cosmochimica Acta vol38 no 5 pp 703ndash714 1974
[16] httpwwwsugartechcozaviscosityindexphp[17] M S Isaacson andA A Sonin ldquoSherwood number and friction
factor correlations for electrodialysis systems with applicationto process optimizationrdquo Industrial amp Engineering ChemistryProcess Design and Development vol 15 no 2 pp 313ndash321 1976
[18] J M Ortiz J A Sotoca E Exposito et al ldquoBrackish waterdesalination by electrodialysis batch recirculation operationmodelingrdquo Journal of Membrane Science vol 252 no 1-2 pp65ndash75 2005
[19] F S Rohman M R Othman and N Aziz ldquoModeling ofbatch electrodialysis for hydrochloric acid recoveryrdquo ChemicalEngineering Journal vol 162 no 2 pp 466ndash479 2010
[20] R E Treybal Mass-Transfer Operations McGraw-Hill NewYork NY USA 3rd edition 1980
[21] R B Bird W E Stewart and E N Lightfoot TransportPhenomenon John Wiley amp Sons 2nd edition 2002
[22] J Balster M H Yildirim D F Stamatialis et al ldquoMorphologyandmicrotopology of cation-exchange polymers and the originof the overlimiting currentrdquo The Journal of Physical ChemistryB vol 111 no 9 pp 2152ndash2165 2007
[23] O V Grigorchuk V I Vasilrsquoeva and V A Shaposhnik ldquoLocalcharacteristics of mass transfer under electrodialysis deminer-alizationrdquo Desalination vol 184 no 1ndash3 pp 431ndash438 2005
[24] V M Barragan and C Ruız-Bauza ldquoCurrent-voltage curves forion-exchange membranes a method for determining the limit-ing current densityrdquo Journal of Colloid and Interface Science vol205 no 2 pp 365ndash373 1998
[25] J Koryta J Dvorak and L KavanPrinciples of ElectrochemistryJohn Wiley amp Sons New York NY USA 2nd edition 1993
[26] N Kabay M Demircioglu E Ersoz and I KurucaovalildquoRemoval of calcium and magnesium hardness of electrodial-ysisrdquo Desalination vol 149 no 1ndash3 pp 343ndash349 2002
[27] M Araya-Farias and L Bazinet ldquoElectrodialysis of calciumand carbonate high-concentration solutions and impact onmembrane foulingrdquoDesalination vol 200 no 1ndash3 p 624 2006
[28] httpwww4ncsuedusimfranzenpublic htmlCH201dataSol-ubility Product Constantspdf
Submit your manuscripts athttpwwwhindawicom
Hindawi Publishing Corporationhttpwwwhindawicom Volume 2014
Inorganic ChemistryInternational Journal of
Hindawi Publishing Corporation httpwwwhindawicom Volume 2014
International Journal ofPhotoenergy
Hindawi Publishing Corporationhttpwwwhindawicom Volume 2014
Carbohydrate Chemistry
International Journal of
Hindawi Publishing Corporationhttpwwwhindawicom Volume 2014
Journal of
Chemistry
Hindawi Publishing Corporationhttpwwwhindawicom Volume 2014
Advances in
Physical Chemistry
Hindawi Publishing Corporationhttpwwwhindawicom
Analytical Methods in Chemistry
Journal of
Volume 2014
Bioinorganic Chemistry and ApplicationsHindawi Publishing Corporationhttpwwwhindawicom Volume 2014
SpectroscopyInternational Journal of
Hindawi Publishing Corporationhttpwwwhindawicom Volume 2014
The Scientific World JournalHindawi Publishing Corporation httpwwwhindawicom Volume 2014
Medicinal ChemistryInternational Journal of
Hindawi Publishing Corporationhttpwwwhindawicom Volume 2014
Chromatography Research International
Hindawi Publishing Corporationhttpwwwhindawicom Volume 2014
Applied ChemistryJournal of
Hindawi Publishing Corporationhttpwwwhindawicom Volume 2014
Hindawi Publishing Corporationhttpwwwhindawicom Volume 2014
Theoretical ChemistryJournal of
Hindawi Publishing Corporationhttpwwwhindawicom Volume 2014
Journal of
Spectroscopy
Analytical ChemistryInternational Journal of
Hindawi Publishing Corporationhttpwwwhindawicom Volume 2014
Journal of
Hindawi Publishing Corporationhttpwwwhindawicom Volume 2014
Quantum Chemistry
Hindawi Publishing Corporationhttpwwwhindawicom Volume 2014
Organic Chemistry International
ElectrochemistryInternational Journal of
Hindawi Publishing Corporation httpwwwhindawicom Volume 2014
Hindawi Publishing Corporationhttpwwwhindawicom Volume 2014
CatalystsJournal of
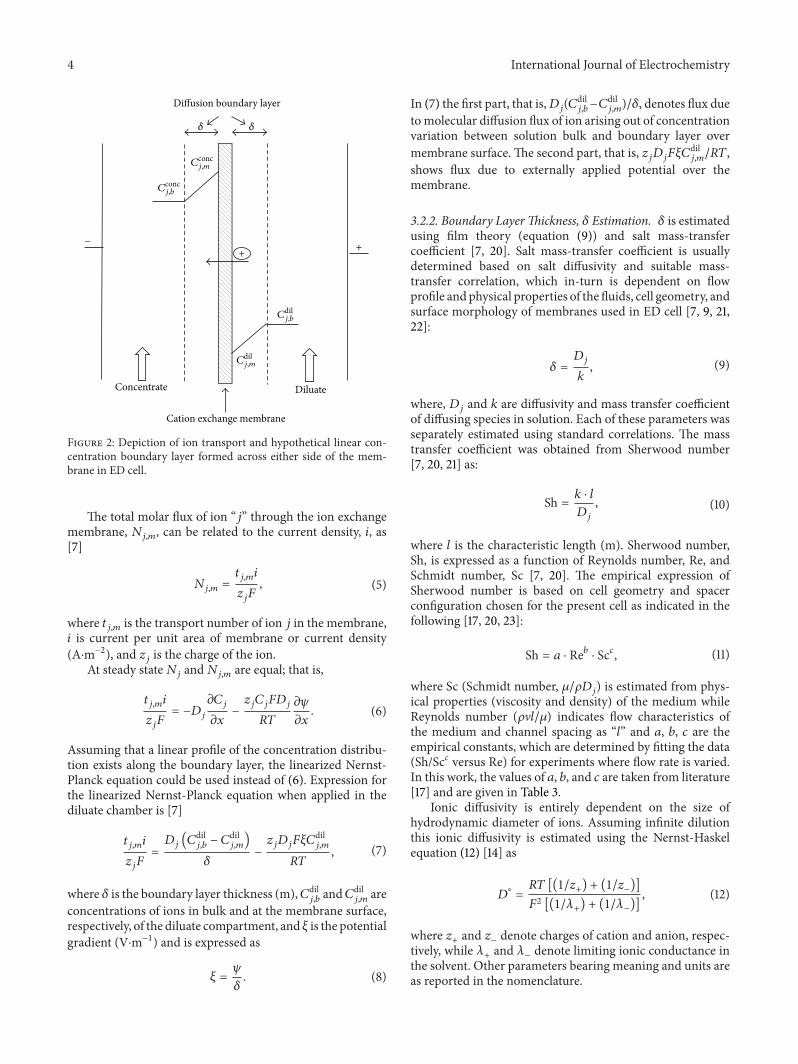