CCCContrasting patterns ofontrasting patterns ofontrasting ...

2 International patterns of work
David G. Blanchflower and Andrew J. Oswald*
Work matters. Psychologists see it as `crucial to self-esteem, well-being andboth physical and mental health ' (Wan, 1985). Economists and industrialrelations specialists define modern industrial societies according to the waythey organise work; sociologists view work as one of the most importantaspects of modern life. People may or may not enjoy their jobs, but inmarket societies they cannot do without them - either psychologically orpractically.
This chapter, based on ISSP (International Social Survey Programme)data collected between 1985 and 1987, reports findings about working lifeand employment in eight industrialised countries. Some of the findingsreveal things that were previously unknown, and so are particularlyinteresting; others simply confirm what has long been suspected. Theirparticular strength is that they are based on eight nearly identical surveys.Usually with survey data on employment, definitions are necessarily basedon those prevailing in each country. For example, unemployment may haveto be defined with reference to job search activities, to benefit eligibility,and so on. Thus the comparisons that can be made between countries arealways bedevilled by whether like is really being compared with like. TheISSP surveys have perforce to leave many of these definitional issues torespondents themselves - for instance by asking them if they areunemployed. But while there may be cultural differences in the answers, weare still much closer than is usual to having truly equivalent data from allthe countries.
*David Blanchflower and Andrew Oswald are Professors in the Department of Economics,Dartmouth College, New Hampshire, USA; Research Associates at the National Bureau ofEconomic Research, USA; and members of the Centre for Labour Economics, LondonSchool of Economics.

16 BRITISH SOCIAL ATTITUDES
The dataset therefore offers an unusual opportunity to social scientistswho are interested in work. Some of the simple, descriptive `facts' we lookat will also be of much wider interest. Among the questions we tackle inthis chapter are:
• How can internationally comparable survey data best be used to shedlight on the nature and characteristics of work?
• Can internationally consistent unemployment rates be calculated? Andif so, what do they show?
• How do union membership, self-employment and employment varyacross countries?
• What forces seem to shape earnings levels? And are the mechanismsthe same - qualitatively or quantitatively - across nations?
• In which countries are trade unions the strongest?
In investigating this last point, we cover new and exciting ground. Usingmultiple regression analysis (a form of analysis which can look at severalvariables at once) we study the effects of trade union membership onoverall wage rates in the different countries, and come to some surprisingconclusions.
The value of national comparisons
There are many reasons why comparing countries on issues such as theseis of interest. The most important, of course, is that work-related issuesshed light on the overall efficiency of an economy and on the materialwell-being of a society. Unemployment, for example, worries bothpoliticians and citizens because it represents an obvious waste of resourcesand is typically spread unevenly across a nation. If countries have ratherdifferent levels of unemployment - and they do - this offers theinvestigator the chance to isolate what it is that shapes unemploymentrates. What secret do the Swiss, with their very low unemployment rates,possess and could Britain, with its much higher numbers of unemployed,learn from them?
Moreover, the structural characteristics of economies - in terms ofemployment and unemployment, pay and so on - are inherently worthstudying. A government wishing to introduce new forms of income tax, orto subsidise a particular sector of industry, or to change the legislativeframework of industrial relations, should know (or want to know)something about economic life in other countries, if only to measure itseconomic performance against that of its main trading competitors.International comparisons, such as those from the ISSP data, allow us tosee just where different countries stand on a host of variables. And, in turn,background and behavioural data such as these can serve to illuminateattitudes towards work and leisure - topics specifically addressed by theISSP nations in their 1989 surveys and to be reported on in a later volume.
INTERNATI(
Figures on tinteresting becFor example,they personallactions of anan essential,Indeed, this isdesire to crealself-employmfself-employed
We also disthe factors wlof general eccand where innumber of amould the didistribution o
Finally, weindividual eneconomic rezoften asserteunions, and 1it is not alwdefinition ofwe can use -
These arecourse, pureexplanationsbackground I
structure. Brcontext of theconomies d
It wouldresponsefeatures ii
Newell andsimilarly. Instems in palevels of uunionisation
An especicountry's ovathe featuresmarket ecoithink, one o

INTERNATIONAL PATTERNS OF WORK 17
Figures on the extent of self-employment and unionisation are especiallyinteresting because they may relate to how well economies are performing.For example, almost all citizens of Western countries work in a job whichthey personally did not create - but rather in a post made for them by theactions of an entrepreneur somewhere. `Job makers' are rare; but they arean essential, if often little considered, component of a capitalist society.Indeed, this is a point often made by the present British government in itsdesire to create a more entrepreneurial economy. Comparative statistics onself-employment offer an insight into the number and characteristics of theself-employed in the various countries we have examined.
We also discuss the price of labour - that is, wages and salaries - andthe factors which determine it. The wage rate is, simultaneously, a measureof general economic well-being, a factor shaping how hard and how longand where individual employees work, and an important influence on thenumber of available jobs in society. Wage levels affect everyone. Theymould the distribution of individual income and so, in the long run, thedistribution of national wealth.
Finally, we look at trade unions, the main organisations by whichindividual employees band together. They matter for political as well aseconomic reasons and they often arouse strong emotions. Although it isoften asserted that this or that country has unusually powerful tradeunions, and this or that country has especially quiescent or impotent ones,it is not always clear what such statements mean. We examine just onedefinition of trade union strength - indeed, one of the few objective criteriawe can use - the power of unions to influence wage rates.
These are the main issues that we cover. Much of the chapter is, ofcourse, purely descriptive. To widen the scope and look for detailedexplanations of the findings would mean filling in the historicalbackground to the labour markets in each country, and looking at its socialstructure. Bruno and Sachs (1985), for example, have argued - in thecontext of the oil shock of the mid-1970s - that the behaviour of differenteconomies depends upon the form of their labour markets.
It would seem only natural that a theory for a country's (or several countries')response can only be formulated if one takes its specific institutional or structuralfeatures into consideration. (p.274)
Newell and Symons (1987) and Calmfors and Driffill (1988) arguesimilarly. In particular, the latter claim that poor economic performancestems in part from a labour market with neither very high nor very lowlevels of unionisation - that is, countries with medium levels ofunionisation perform worse than countries at either of the two extremes.
An especially interesting point to an economist is that - despite eachcountry's own particular history and own distinctive institutions - many ofthe features we describe seem to show overarching similarities between themarket economies of all eight nations. This structural similarity is, wethink, one of the most striking aspects of our analysis.

INTERNAT
per cent oftechnologicainterpret thehierarchical
In BritainAt the otherwork is, hov■half of emp(45 per centcent). EmpiGermany wthese differesimilarity btthroughout 1
Next weeconomic a`retirementfor one? Acontinue to
All aged undeMen aged uncWomen agedMarried worm
under 65Women aged 1
Men aged 65-i
Notes. Again thepercentage bases
As we see,want oneHungary a:Switzerlanccountries. Ilook at worare active`league ' , th.are foundapproachir
Anotherthe over-6_
*The workftunemployed.Switzerlandsample didaged 70 and
18 BRITISH SOCIAL ATTITUDES
Jobs and joblessness
The countries examined in this chapter are Australia', Austria, WestGermany, Britain, Hungary, Italy, Switzerland,' and the USA. The surveydata for most countries were collected in each of three years, from 1985 to1987. Amalgamating datasets in this way means that we have relativelylarge numbers of respondents for our analyses. For some countries, forinstance Switzerland and Hungary, we have data for only one or two yearsand the numbers are accordingly reduced. Details about the sample ineach country are provided in Appendix I.
Workforce profiles
As a background, and using data mainly from 1985 and 1986, we showbelow for each country eight measures of the composition of the workforce.Already we can see some striking differences.
Workforce characteristics
West Switzer-
% of employeeswho are:
Working part-time
Austria
2%
Germany
3%
Britain
13%
Hungary
n/a
Italy
7%
USA
6%
land
2%Men — — 2% n/a 4% 3% —Women 4% 7% 26% n/a 14% 8% 5%
Women 39% 35% 45% 49% 32% 47% 31%In manual occupations 41% 29% 45% 52% 52% 29% n/aIn manufacturing
industry 19% 33% 27% 29% n/a 21% n/aIn public service
occupations n/a 31% 34% n/a 20% 30% 28%Supervisors n/a n/a 38% 21% 16% 31% 43%
Notes. The percentage bases are employees only; Hungarian data are for 1986 only and Swiss data for 1987 only.n/a = not available.
For instance, we can see that in Austria only two per cent of the employedlabour force as a whole work part-time, whereas in Britain part-timeworking is disproportionately common, with more than one in eightemployees working under 20 hours a week. Looking along the third row ofthe table, we see that this is because so many British women work part-time. Indeed, they are nearly twice as likely as women in any other of thenations we examined to work part-time. We know too from other sources(for example, Dex and Shaw, 1986) that women part-timers in Britain workshorter hours on average than do their American and mainland Europeancounterparts. This is partly because national insurance thresholds makepart-time working economically efficient from the employer's point of view,but in any case the British profile in this respect is very distinct.
In all of the nations, women account for between one third and one halfof all employees. Much wider differences are apparent in other respects.Only 13 per cent of Americans claim to supervise others, compared with 43

INTERNATIONAL PATTERNS OF WORK 19
per cent of the Swiss. Given the comparatively similar cultural andtechnological characteristics of these two nations, it is hard to know how tointerpret this evidence. Either working arrangements are much lesshierarchical in the USA, or Americans simply perceive them as such.
In Britain as many as one third of employees work in the public sector.At the other end of the spectrum, the figure for Italy is one in five. Manualwork is, however, especially important in Italy and Hungary (with just overhalf of employees in manual occupations), only a little less so in Britain(45 per cent) and least prevalent in West Germany and the USA (29 percent). Employees in manufacturing industry are most common in WestGermany where they make up a third of the workforce. But despite allthese differences, perhaps the main feature of the table above is the broadsimilarity between these seven countries. This will be a recurrent themethroughout the chapter.
Next we examine workforce participation rates, sometime known aseconomic activity rates. In particular, what proportion of adults under`retirement age' is active in the labour market, either with a job or lookingfor one? And how many of those over `retirement age ' (65 and over)continue to work?*
Switzer-
Workforce participation rates
West
All aged under 65
Austria Germany Britain76%
Hungary71%
Italy60%
USA76%
land79%66% 62%
Men aged under 65 82% 82% 94% 81% 82% 90% 92%Women aged under 65 51% 43% 61% 63% 38% 64% 59%Married women, aged
under 65 46% 37% 58% 63% 33% 59% 39%Women aged 65+ 1 % 2% 1 % — 4% 8% *Men aged 65+ 1% 4% 8% 2% 8% 18% *
Notes. Again the data are from 1985 and 1986, except for Hungary (1986 only) and Switzerland (1987 only). Thepercentage bases are all those employed or seeking work, in the relevant age range. * = less than 0.5%.
As we see, the proportion of men aged under 65 who either have a job orwant one ranges from about eight in ten (in Austria, West Germany,Hungary and Switzerland) to around nine in ten (in Britain, the USA andSwitzerland). So we find high male participation rates in all sevencountries. But we see rather greater differences between countries when welook at women's economic activity rates. Only 38 per cent of Italian womenare active in the labour market; in Austria, which is in the middle of the`league', the figure is 51 per cent; but the highest female participation ratesare found in Switzerland, Britain, Hungary and the USA, whereapproaching two thirds of women have taken up or are seeking paid work.
Another striking cross-national difference is the varying proportion ofthe over-65s who continue to be active in the labour market. Whereas very
*The workforce is defined as the employed (employees and self-employed) and theunemployed. `Adults' comprise those aged 16 and over in Austria, 17 and over inSwitzerland and 18 and over in the other five countries under examination. The Italiansample did not include those aged 75 and over; the Austrian sample did not include thoseaged 70 and over.

20 BRITISH SOCIAL ATTITUDES
few older women (except perhaps in the USA) participate in the labourmarket, in Britain and Italy about one in twelve older men remaineconomically active; and in the United States, a remarkable 18 per cent ofmen--nearly one in five - stay in the workforce after they have reachedthe age of 65.
Unemployment
We turn now to unemployment - an issue of great social, political andeconomic importance, especially in Europe where historically high rates ofunemployment have been reached over the past ten years. Although it isknown that different countries have suffered to different degrees, it has notbeen easy to make precise measurements. This is because each nationtends to have its own way of calculating its unemployment rates. Forinstance, they may be defined according to prevailing criteria of eligibilityfor social benefits, or according to particular job search activities in a givenperiod of time. So the ISSP data are of some interest, for they allow us tocompare unemployment rates using a common definition. In each of thecountries, respondents were asked whether they considered themselvesunemployed.* Of course, there may be cultural differences whichpredispose respondents in different countries to answer differently; we alsoknow that respondent self-reporting of unemployment generally produceshigher unemployment rates than those which result from applying officialdefinitions. But our method, whatever its flaws, has the merit of providingcomparable measures of joblessness for each nation. Three main pointsstand out, as the table below shows (again the data are mainly from the1985 and 1986 surveys):
Unemployment rates
AustriaWest
Germany Britain Italy USASwitzer-
landMen 3.9% 4.5% 12.7% 4.7% 3.9% 0.4%Women 6.5% 6.3% 11.9% 6.9% 3.7% 2.0%
Aged under 25 6.7% 7.1% 21.7% 17.8% 5.9% 4.3%Aged 25-44 4.4% 6.0% 9.9% 4.6% 3.2% 0.3%Aged 45+ 4.3% 3.3% 10.7% 1.4% 4.5% 0.4%
All 4.9% 5.1% 12.4% 5.4% 3.8% 0.9%
Notes. The percentage bases are all those who defined themselves as in paid work' or `unemployed'. Swiss data arefrom 1987.
First, looking at male unemployment rates in the mid-1980s, the figure forBritain at nearly 13 per cent was more than twice as high as that for anyother nation. At the opposite end of the spectrum is Switzerland where less
*This question was not asked in Hungary because of difficulties over the definition of`unemployed'.
than one per cenBritain's unemplo}(though it is nowmale unemploymeinternatio
nal stanGermany, Italy ancent.
Second, the fenBritain, higher th;social consequentand would like aliving in househtNonetheless, our cpaid work amon;industrialised nati,likely as men to si
Third, unemplomid-1980s, in botlunder 25 said thesocial and econcoverall rate of un(under 25) said thwith their older cc
Trade union memb
The ISSP datasetmembers of tradegovernment-spon gysensitive. So thesshows, the propora great deal from
Around a thirdof Britons and Athan one in fiveunions. The high,in Hungary wherthe relationshipEastern Europealdifferent meaningthe latter, unions
It is also unsuiusually much les:workers are moracross all the
*Except for Italy, wh

e
INTERNATIONAL PATTERNS OF WORK 21
than one per cent of men aged under 65 reported being unemployed.Britain ' s unemployment rate has risen dramatically over the past decade(though it is now declining); these data make explicit the fact that Britishmale unemployment has been not only high historically, but also high byinternational standards. For instance, on our figures, Austria, WestGermany, Italy and the USA all showed a similar rate of around four percent.
Second, the female unemployment rate was, except in the USA andBritain, higher than the male unemployment rate. This may be of lesssocial consequence: many of the women who said they are unemployedand would like a job have husbands in paid work, so they may not beliving in households where there was no earned income coming in.Nonetheless, our data have uncovered a measure of frustrated demand forpaid work among women living in several of the Western Europeanindustrialised nations. Even in Britain and the USA, women were about aslikely as men to say they are unemployed.
Third, unemployment was consistently higher among the young. In themid-1980s, in both Britain and Italy, about one in five young people agedunder 25 said that they were unemployed. This is likely to have serioussocial and economic repercussions. Even in Switzerland, with its lowoverall rate of unemployment, we see that four per cent of young adults(under 25) said that they were unemployed, a ratio of over 10:1 comparedwith their older counterparts.
Trade union membership
The ISSP datasets also yield information about whether respondents aremembers of trade unions.* Such data are seldom collected on large-scale,government-sponsored surveys, since they are often seen as politicallysensitive. So these results are of great interest. And, as the table belowshows, the proportion of the labour force belonging to a trade union differsa great deal from country to country.
Around a third of Swiss and West German employees, and around a halfof Britons and Austrians, are members. But in the USA we find that lessthan one in five of all employees - even male employees - belong to tradeunions. The highest level of unionisation is found, unsurprisingly perhaps,in Hungary where seven out of ten employees are union members. Giventhe relationship between the Communist Party and the trade unions inEastern European nations, it is likely that union membership has a verydifferent meaning in Hungary from that in Western market economies; inthe latter, unions are of course essentially voluntary associations.
It is also unsurprising that (except in Hungary) women are less likely -usually much less likely - to be unionised than are men, and that manualworkers are more highly unionised than non-manual workers. Typically,across all the Western industrialised nations, we can see that union
*Except for Italy, where this question was not asked.

22BRITISH SOCIAL ATTITUDES INTERNATIOl`
Notes. The percentage bases are employees only. The data are from 1985 and 1986 except for Hungary (1986 only) an
Switzerland (1987 only). = 1985 data only. n/a = not available.
In addition - and contrary to commonly-held beliefs - employees in service 'toccupations are only a little less likely to be unionised than those inmanufacturing. Probably this can be explained, in part at least, by the highunionisation levels in the public sector, where nearly all the jobs areservice ones.
% Trade union members
Austria
WestGermany Britain Hungary USA
Switzer-land
52% 32% 47% 71% 17% 36%
58% 39% 51% 62% 21% 42%
40% 20% 41% 81% 12% 24%
39% 23% 35% 71% 8% 28%
54% 32% 47% 70% 17% 36%
60% 37% 53% 73% 20% 41%
017% °36%52% 33% 49% n/a
12% 6% 27% n/a 10%
61% 44% 53% 61% 28% n/a
45% 27% 42% 82% 12% n/a
Notes. The percentage bases are employees only: Hungarian data are for 1986 only and Swiss data for
n/a = not available.
members are male, blue-collar workers in full-time jobs. Only in Britain, itseems, have the trade unions managed to make much of an inroad - albeitstill a modest one - into the part-time labour market. But in common withAustria, with its strong corporatist institutions favouring union
membership, the British trade union movement seems to have beenrelatively successful in recruiting women.
It is also worth noting that, in Britain, the unionisation rate in the publicsector (at 75 per cent, exceptionally high) is more than double that in theprivate sector.
% Trade union members
AustriaWest
Germany Britain Hungary USA
Switzer-land
17% 036%All 52% 32% 47% 71%
In manufacturingindustries 57% 35% 48% 79% 21% n/a
In serviceoccupations 50% 31% 46% 68% 15% n/a
62%Public sector n/a 47%t 75% n/a 20%
0
Private sector n/a 30%t 32% n/a 15%15% 26%
What do people ~
We can also usHow far are thethe various nacalculated by deof individuals '
distribution. Soaverage earningUsing the datadifferences:
Table 2.1 providFor three cou
coefficients - thcase of Hungiinteresting, sincneighbours, Wethe other courPhelps-Brown (
the most rerrpay structurethe Soviet-tyldispersion ofnot all, of thunder sociali:
Italy appears a;seven nations,middle of the n
Trade union stre
People may mtThey may beunions and polshow. But a meby measuring t
*The coefficient omean X 100.
All
MenWomen
Aged under 25Aged 25-44Aged 45+
Working full-timeWorking part-time
In manualoccupations
In non-manualoccupations
1987 only
DES
itzer-tnd6%
.2%
!8%16%41%
INTERNATIONAL PATTERNS OF WORK 23
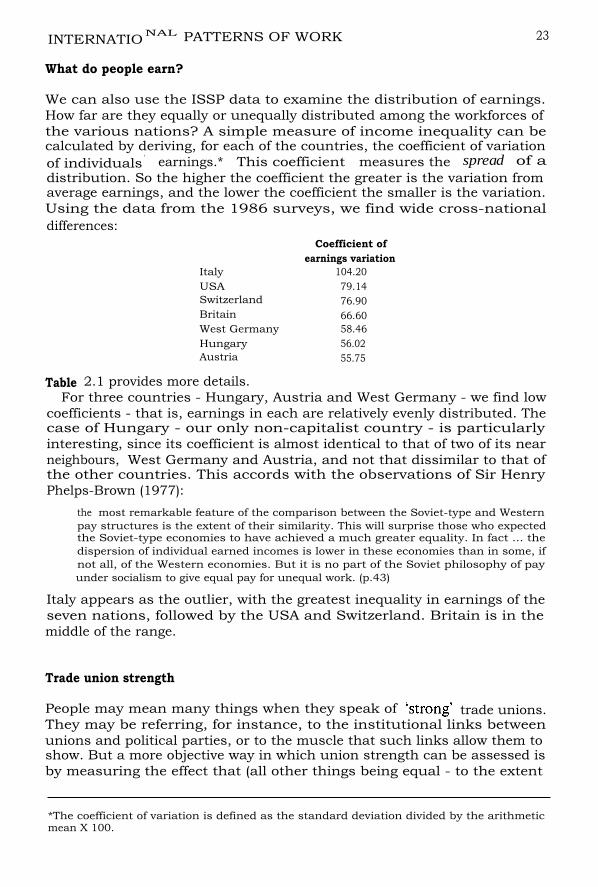
What do people earn?
We can also use the ISSP data to examine the distribution of earnings.How far are they equally or unequally distributed among the workforces ofthe various nations? A simple measure of income inequality can becalculated by deriving, for each of the countries, the coefficient of variationof individuals ' earnings.* This coefficient measures the spread of adistribution. So the higher the coefficient the greater is the variation fromaverage earnings, and the lower the coefficient the smaller is the variation.Using the data from the 1986 surveys, we find wide cross-nationaldifferences:
Coefficient ofearnings variation
Italy 104.20USA 79.14Switzerland 76.90Britain 66.60West Germany 58.46Hungary 56.02Austria 55.75
n/a
n/a
1987 only.
:ain, italbeit
n withunionbeen
publicin the
witzer-land36%
n/a
n/a62%26%
{6 only) and
servicelose inhe high)bs are
Table 2.1 provides more details.For three countries - Hungary, Austria and West Germany - we find low
coefficients - that is, earnings in each are relatively evenly distributed. Thecase of Hungary - our only non-capitalist country - is particularlyinteresting, since its coefficient is almost identical to that of two of its nearneighbours, West Germany and Austria, and not that dissimilar to that ofthe other countries. This accords with the observations of Sir HenryPhelps-Brown (1977):
the most remarkable feature of the comparison between the Soviet-type and Westernpay structures is the extent of their similarity. This will surprise those who expectedthe Soviet-type economies to have achieved a much greater equality. In fact ... thedispersion of individual earned incomes is lower in these economies than in some, ifnot all, of the Western economies. But it is no part of the Soviet philosophy of payunder socialism to give equal pay for unequal work. (p.43)
Italy appears as the outlier, with the greatest inequality in earnings of theseven nations, followed by the USA and Switzerland. Britain is in themiddle of the range.
Trade union strength
People may mean many things when they speak of `strong' trade unions.They may be referring, for instance, to the institutional links betweenunions and political parties, or to the muscle that such links allow them toshow. But a more objective way in which union strength can be assessed isby measuring the effect that (all other things being equal - to the extent
*The coefficient of variation is defined as the standard deviation divided by the arithmeticmean X 100.

24 BRITISH SOCIAL ATTITUDES
they can be controlled for) unions have on the wage levels of theirmembers, in relation to those of non-unionised workers. After all, improvedpay bargaining power is one of the important attractions that trade unionshold for the individual employee.
The analysis
Economists have a standard method for examining the effect of unionmembership on wage rates.' They use multiple regression analysis toidentify the main factors which determine wages, and use unionmembership as one of the possible explanations of variations in wagelevels. Other variables are also included, to control for the many otherthings that typically influence a person 's earned income: these include age,years of schooling, sex, marital status, and the characteristics of the workdone. The statistical correlations are used to look at whether unionmembers are better paid than non-union members, once other influencesare held constant.
The standard literature, surveyed in Lewis (1986), Blanchflower (1984),Freeman and Medoff (1984) and Hirsch and Addison (1986), typicallyestimates the so-called union/non-union wage differential at around 10 to15 per cent. In other words, by these calculations unionisation increaseswages by a little more than one tenth. So the prediction would be that anon-union worker would raise his or her pay by that amount at a unionworkplace. To date, almost all the statistical studies have looked at theUSA, Canada and Britain. One exception is Mulvey (1986): usingAustralian cross-sectional data, he found that the effect of unionmembership is to raise pay by an average of nine per cent.
So ISSP data provide an opportunity, for the first time as far as weknow, to make international comparisons of union strength across a widerrange of nations. Our analysis assumes that employees' earnings depend onsix main factors: age, years of education, sex, marital status, full- or part-time working, as well as membership or non-membership of a union .4 Theresults, which pool the 1985, 1986 and 1987 samples, are given in Table 2.2.This table shows not only the size of the effect of each factor but also thestatistical significance of the relationship (a measure of its reliability). Animportant point to note is the extent to which our formula succeeds inexplaining variations in earnings levels across the different countries - thatis, its predictive strength. For example, we find that it explains about 60 percent of the variance of employees ' pay in Britain, but only about 38 percent of the variance in the USA. So, using this formula, we can predictmuch more accurately the level of pay of a British respondent than we canfor an American respondent.
Factors affecting earnings
Table 2.2 provides a lot of information. For instance, as would be expected,in every country wages rise with age: on average, older workers are paid
INTERNATIONAL F
more than younger ofeach extra year olderbecome smaller andbetween a 20-year-oldifference between a
We can also look alfind more marked crcis noticeably more vaformal education thameans that the Briti!investment in educati,extra year of schoolindue to education areWest Germany - wlschool past the minirUSA are the countrieinvestment in educeeconomies have theview of the economy ;
In which countriesterms of pay? Accordthe USA and Germaihalf as much again abe least marked in Aa measure of discrimare segregated in difiwoman seems to be apower. Moreover, thifact that people whoaverage than thosepronounced in the U;
Unionisation and wage
When we turn to theTable 2.2 shows, theacross nations, fromUSA. This indicates iunion member can a■extra to an employee '
The `league table' is a
*This is the meaning ovariable.
7
i
r
d,id
INTERNATIONAL PATTERNS OF WORK 25
more than younger ones. But it is not a straightforward linear relationship:each extra year older a person becomes means that his or her pay increasesbecome smaller and smaller.* All else being equal, the difference in paybetween a 20-year-old and a 30-year-old will thus be more than thedifference between a 30-year-old and a 40-year-old and so on.
We can also look at the effect of education on people's incomes. Here wefind more marked cross-national differences. In the USA and Britain, thereis noticeably more variation in wage rates according to a person 's years informal education than in the other six countries. To an economist, thismeans that the British and American labour markets reward a person 'sinvestment in education more highly than do those of other countries; eachextra year of schooling brings relatively higher pay. Yet income differentialsdue to education are smallest in just those countries - Switzerland andWest Germany - where proportionally more young people stay on atschool past the minimum school-leaving age. So, although Britain and theUSA are the countries where individuals get the highest return from theirinvestment in education, this does not necessarily mean that theseeconomies have the most productive education system from the point ofview of the economy as a whole.
In which countries are women most strongly `discriminated ' against interms of pay? According to our analysis, the answer is Britain, followed bythe USA and Germany. Indeed, in the USA and Britain men earn roughlyhalf as much again as their female counterparts. Discrimination appears tobe least marked in Austria. Of course, pay differentials may not be simplya measure of discrimination: they may reflect the extent to which womenare segregated in different sorts of occupations from men. Nonetheless, awoman seems to be at a significant disadvantage when it comes to earningpower. Moreover, this is true even if one takes into account the obviousfact that people who work part-time (predominantly women) earn less onaverage than those who work full-time. This earnings gap is mostpronounced in the USA and Britain.
Unionisation and wages
When we turn to the effect of trade union membership on wage levels, asTable 2.2 shows, the coefficient for union membership varies markedlyacross nations, from a low of 0.04 for Switzerland to a high of 0.23 for theUSA. This indicates that, after controlling for all the other factors, being aunion member can add on average from four per cent to nearly 25 per centextra to an employee 's earnings according to the country he or she lives in.'The ` league table' is as follows:
*This is the meaning of the negative and significant coefficients for the age-squaredvariable.

26 BRITISH SOCIAL ATTITUDES
Estimates of% extra earnings
attributable tounion membership
USA 26%Australia 13%Britain 8%Hungary 8%West Germany 7%Austria 6%Switzerland 4%*
Note. *This figure is not statistically significant.
The estimates for Britain, Australia and the USA are broadly comparableto those reported elsewhere (see, for example, Mulvey (1986) for Australia,Freeman and Medoff (1984) for the USA and Blanchflower and Oswald(forthcoming) for Britain). We can therefore have some confidence in theother figures which are, as far as we are aware, the first published estimatesof union impact on wages in West Germany, Switzerland, Austria andHungary. On these figures, British trade unions have much the sameimpact on wages as do their counterparts in mainland Western Europe.Proponents of the thesis that unions in Britain have more muscle thanmost cannot use these figures to substantiate their claim.
Self-employment
Most workers in industrialised countries are not self-employed. They workin jobs made for them by someone else, though they may not have thoughtabout it in such terms. But some, more entrepreneurial, individuals createjobs for themselves. In the table below, we show the proportions of those inself-employment across seven of the ISSP nations.
% self-employed*Italy 29%Switzerland 23%USA 16%Austria 15%West Germany 12%Britain 10%Hungary 4%
Note. *Based on all those in work in each country.
A detailed breakdown of self-employment rates in each country by sex, age,sector and so on will be found in Table 2.3. As might be expected,Hungary, the only communist country, has the smallest proportion of self-employed. Italy is at the other extreme: approaching a third of Italianswork for themselves. Britain, despite the rise in the numbers of self-employed in the past decade, is near the bottom of the European `league ' .
*Unfortunately, theproportion of the pc
INTERNATIONJ
Hours of work
Do people in dhours a week? Iislightly in all thewith an averagehours. Women toand Italy. Prediclonger hours tit;average just ovepeople typicallywith their emplo,
Conclusions
The eight ISSP 1
from one anothecomparatively poWorld nations. "obvious characteracross the variourates are almostmarkedly low, atBritain has anSwitzerland have
One example cshows that peopalmost identicalHungarian, orindividual's age,belongs to a unapproximate earlback to the worclearly understocthat employees iiuniversal forces.
Notes
1. We have somethe results of tlis robust with r
2. Data on Switzethan for otherISSP, but a tetthe 1987 modul

ES
ablealia,valdthe
Catesandame-ope.than
work)ughtreateuse in
K, age,Iected,,f self-aliansf self-
1.
2.
INTERNATIONAL PATTERNS OF WORK 27
Hours of work
Do people in different countries work noticeably different numbers ofhours a week? In fact, the average working week appears to differ onlyslightly in all the countries studied.* Switzerland comes top of the leaguewith an average of nearly 46 hours; Italy is at the bottom at around 38hours. Women tend to work fewer hours than men, especially in Britainand Italy. Predictably, perhaps, the self-employed generally work muchlonger hours than employees (except in the USA, where both groupsaverage just over 40 hours a week). In Western Europe, self-employedpeople typically put in an extra seven to twelve hours per week comparedwith their employed counterparts. Table 2.4 gives full details.
Conclusions
The eight ISSP nations under study are in many respects quite differentfrom one another. They range from capitalist to communist, from rich tocomparatively poor, from ex-colonial Old World powers to confident NewWorld nations. Yet their heterogeneity is not, in this chapter, their mostobvious characteristic. Patterns of working life turn out to be fairly similaracross the various countries. Hours of work and labour force participationrates are almost the same in the eight nations; only the USA has amarkedly low, and Hungary a markedly high, level of unionisation; onlyBritain has an exceptional unemployment rate; all but Italy andSwitzerland have fairly low levels of self-employment.
One example of cross-national similarities is revealed in Table 2.2, whichshows that people's earnings across different countries are explained byalmost identical factors. If one wishes to guess the earnings of a particularHungarian, or of a particular American, one needs to know thatindividual's age, years of schooling, and gender, and whether he or shebelongs to a union. 6 Then a broadly common algebraic formula allowsapproximate earnings to be estimated. Why this formula - one which datesback to the work of Jacob Mincer (1958) - performs so well is still notclearly understood. Whatever the exact interpretation, however, it seemsthat employees in our different countries have their rates of pay shaped byuniversal forces.
Notes
We have some concerns about the Australian sample, and so we have presented onlythe results of the multiple regression analysis for that country, as this type of analysisis robust with regard to assumptions of randomness.Data on Switzerland are available only for 1987 and so sampling errors will be largerthan for other countries. Switzerland is not one of the countries participating in theISSP, but a team at the Soziologisches Institut der Universitat Zurich has replicatedthe 1987 module and kindly provided us with the data.
*Unfortunately, these data are not available for Hungary where we know that a largeproportion of the population has second jobs.

28 BRITISH SOCIAL ATTITUDES INTERNATIONAL
The idea of using econometric methods to estimate . the effects of trade unionmembership stretches back at least to Lewis (1963). An authoritative informalexplanation of methods and results can be found in Freeman and Medoff (1984).
The definitions of the variables used in the multiple regression analyses are as follows:
natural logarithm of net monthly income after deduction ofincome tax and national insurance.
natural logarithm of net income per month.
natural logarithm of gross income over preceding 12 months.
natural logarithm of gross annual earnings over preceding12 months.
natural logarithm of gross annual earnings before deductionof income tax and national insurance.
natural logarithm of monthly earnings.
natural logarithm of monthly earnings.
Independent variables
(i) Age (Age e): age of respondent.
(ii) Education: years of schooling.
(iii) Male: (1, 0) dummy variable if male.
(iv) Union: (1, 0) dummy variable if union member.
(v) Married: (1, 0) dummy variable if married or living as married.
(vi) Part-time: (1, 0) dummy variable if employed for up to 20 hours perweek.
(vii) 1986 dummy: (1, 0) dummy for 1986.
(viii) 1987 dummy: (1, 0) dummy for 1987.5. Because the earnings variable is measured in natural logarithms, these estimates are
obtained by taking the (natural) anti-logarithm of the coefficient, deducting one andmultiplying by 100 per cent. That is, if M is the coefficient, calculate
100(e M - 1)For further details of this procedure, see Blanchflower (1984).
6. Some economists (particularly Richard Freeman) have pointed out to us that theequations' coefficients, and therefore the size of the relationships, are not identicalacross nations, and of course that is true. We merely wish to claim that the samepressures seem to be at work across the countries, and that some of these can becaptured by an equation. Many economists take this for granted, but other socialscientists may not.
References
BLANCHFLOWER, D., `Union Relative Wage Effects: A Cross-SectionAnalysis Using Establishment Data ', British Journal of Industrial Relations,vol. 22 (1984), pp311-332.BLANCHFLOWER, D. and OSWALD, A., `The Wage Curve', ScandinavianJournal of Economics (forthcoming).BRUNO, M. and SACHS, J., Economics of Worldwide Stagflation, BasilBlackwell, Oxford (1985).
3.
4.
Dependent variables
(i) West Germany:
(ii) Austria:
(iii) Australia:
(iv) USA:
(v) Britain:
(vi) Hungary:
(vii) Switzerland:
CALMFORS, L. arand MacroeconomicDEX, S. and SHA`Opportunities PoliciesFREEMAN, R. amNew York (1984).HIRSCH, B. andApproaches and Evict,LEWIS, H.G., UnionChicago Press, ChicLEWIS, H.G., UnioiPress, Chicago (198(MINCER, J., `InvDistribution ', JournwMULVEY, C., `Wage(ed.), Wage FixationNEWELL, A andfor Labour EconomPHELPS-BROWN,Oxford (1977).WARR, P., Psychology

INTERNATIONAL PATTERNS OF WORK 29
CALMFORS, L. and DRIFFILL, J., `Bargaining Structure, Corporatismand Macroeconomic Performance', Economic Policy, vol. 6 (1988), pp13-62.DEX, S. and SHAW, L., British and American Women at Work: Do EqualOpportunities Policies Matter? Macmillan, London (1986).FREEMAN, R. and MEDOFF, J., What Do Unions Want?, Basic Books,New York (1984).HIRSCH, B. and ADDISON, J., The Economic Analysis of Unions: NewApproaches and Evidence, Allen and Unwin, Boston (1986).LEWIS, H.G., Unionism and Relative Wages in the United States, University ofChicago Press, Chicago (1963).LEWIS, H.G., Union Relative Wage Effects: A Survey, University of ChicagoPress, Chicago (1986).MINCER, J., `Investment in Human Capital and Personal IncomeDistribution ', Journal of Political Economy, vol. 66 (1958), pp281-302.MULVEY, C., `Wage Levels: Do Unions Make a Difference?', in Nilard, J.(ed.), Wage Fixation in Australia, Allen and Unwin, Sydney (1986).NEWELL, A. and SYMONS, J., Mid-1980s Unemployment, mimeo, Centrefor Labour Economics, London School of Economics, London (1987).PHELPS-BROWN, H., The Inequality of Pay, Oxford University Press,Oxford (1977).WARR, P., Psychology at Work, Penguin Books, Harmondsworth (1985).