2 Hamburg, Melbourne and Cape Town An Exploratory Study
33
2 A Comparison of the Motor Ability of 8 and 9 Year Old Primary School Children in 1 Hamburg, Melbourne and Cape Town – An Exploratory Study 2 3 Jürgen Kretschmer 1 , John Saunders 2 , Liz Bressan 3 , Jan Erhorn 4 and Daniel Wirszing 1 4 1 University of Hamburg, 2 Australian Catholic University, 3 Stellenbosch University and 5 4 University of Flensburg 6 7 8 9 10 Author Note 11 Jürgen Kretschmer, Department of Education, University of Hamburg, Germany 12 John Saunders, School of Exercise Science, Australian Catholic University, Brisbane, 13 Australia 14 Liz Bressan, Centre for Human Performance Sciences, Stellenbosch University, South Africa 15 Jan Erhorn, Department of Sport Science, University of Flensburg, Germany 16 Daniel Wirszing, Department of Education, University of Hamburg, Germany 17 18 19 Correspondence concerning this proposal should be addressed to: 20 John Saunders, School of Exercise Science, Australian Catholic University 21 1100 Nudgee Road, Banyo, QLD 4014 Australia 22 E-mail: [email protected] Ph: +617 3623 7639 23 24 25 26
Transcript of 2 Hamburg, Melbourne and Cape Town An Exploratory Study
2
A Comparison of the Motor Ability of 8 and 9 Year Old Primary School Children in 1
Hamburg, Melbourne and Cape Town – An Exploratory Study 2
3
Jürgen Kretschmer1, John Saunders2, Liz Bressan3, Jan Erhorn4 and Daniel Wirszing1 4
1University of Hamburg, 2Australian Catholic University, 3Stellenbosch University and 5
4University of Flensburg 6
7
8
9
10
Author Note 11
Jürgen Kretschmer, Department of Education, University of Hamburg, Germany 12
John Saunders, School of Exercise Science, Australian Catholic University, Brisbane, 13
Australia 14
Liz Bressan, Centre for Human Performance Sciences, Stellenbosch University, South Africa 15
Jan Erhorn, Department of Sport Science, University of Flensburg, Germany 16
Daniel Wirszing, Department of Education, University of Hamburg, Germany 17
18
19
Correspondence concerning this proposal should be addressed to: 20
John Saunders, School of Exercise Science, Australian Catholic University 21
1100 Nudgee Road, Banyo, QLD 4014 Australia 22
E-mail: [email protected] Ph: +617 3623 7639 23 24
25
26
3
Abstract 1
An increasing worldwide concern about a decline in the quality of the motor ability of 2
children was the motivation for this exploratory comparative study. It involves a comparison 3
of the motor ability of children aged 8 and 9 years from Hamburg (n=754), Melbourne 4
(n=144) and Cape Town (n=81). The samples were also analysed according to ethno-cultural 5
background. 6
The children’s motor ability was tested by five items from the AST 6 – 11 (Bös, Opper, Woll, 7
Liebisch, Breithecker, & Kremer, 2001). Results were analysed in terms of city, sex and 8
‘ethno-culture’ by means of a two- way Analysis of Variance. (ANOVA) 9
Differences in motor ability were evident between the children of the three cities. The 10
children from Hamburg demonstrated the highest levels of performance overall and those of 11
Melbourne the lowest. Both sex and ethno-cultural background were significant mediating 12
variables in all contexts. Boys scored more highly than girls at all locations. For the children 13
of a European background in both Hamburg and Melbourne a higher performance was 14
identified when compared with their same city peers of Asian origins. The best performing 15
cultural group overall were the Xhosa children of Cape Town. The limitations of the study are 16
identified and some suggestions for future comparative studies of motor ability are made. 17
18
Keywords 19
Motor ability, comparative studies, culture 20
21
22
23
4
A Comparison of the Motor Ability of 8 and 9 Year Old Primary School Children in 1
Hamburg, Melbourne and Cape Town – An Exploratory Study 2
Concern about the levels of motor ability and motor fitness of children and 3
adolescents is emerging worldwide. However there have to date been few published 4
reports of this phenomenon from outside the high-income OECD nations. Rather studies 5
in the USA (Kuntzleman & Reiff, 1992), Canada (Craig, Beaulieu, & Cameron, 1994) and 6
Australia (Booth, Macaskill, McLellan, Phongsavan, Okely, & Patterson, 1997; 7
Tomkinson, 2004) have been among the first to have reported such a decline in motor 8
achievement. In Germany some authors have made similar claims (Bös, 2003). Questions 9
as to what extent this is a worldwide issue and, what may be the main factors related to 10
it, can only be answered by comparative studies. However, comparative studies at the 11
international level which investigate both motor ability and the environmental factors 12
which relate to it have been limited (Baur, 1993). This is, at least in part, because the 13
administration of comparative studies is complex, difficult, and consequently expensive. 14
As a starting point for exploring some of the conceptual and methodological issues to be 15
addressed in such studies, this study compared the motor ability of children from three 16
modern world cities on three different continents. It is based on some of the protocols 17
developed for the Hamburg study - Motorische Leistungsfähigkeit von Grundschulkindern 18
in Hamburg (MOLE, Kretschmer & Wirszing, 2008) which were then applied to two 19
smaller convenience samples of children from Melbourne in Australia and Cape Town in 20
South Africa. The purpose was to look for similarities and differences in the motor 21
ability of the children who were the participants in these three examples of 22
contemporary city life. At the same time, acknowledging the growing ethnic and cultural 23
diversity of major world cities and accepting this as being a possible source of increasing 24
5
variance in movement culture within populations, we also sought to explore the 1
potential significance of ethno-cultural group membership upon motor related activity 2
and performance even within the same geographical regions. 3
Research Background and Design 4
This study investigated the motor ability of selected primary school children from the 5
greater metropolitan areas of Hamburg, Melbourne and Cape Town. The common ground 6
between the three locations is that they are all world cities within countries in which a decline 7
in the motor ability of children has been reported (Bös, 2003; Tomkinson 2004; Armstrong, 8
2009). The three cities are fairly similar in their population sizes (from 2 million to 4.16 9
million), are the second largest cities in their relative countries, important and prospering 10
seaport and commercial centres suggesting their suitability for comparison. Differences in 11
population densities between the three need to be acknowledged as a potentially relevant 12
source of difference being 2, 382 per square kilometre in Hamburg, 1,665 in Cape Town and 13
only 462 in metropolitan Melbourne. This however appears to reflect characteristics of city 14
growth in their respective global regions of Europe, Africa and Australia. At the same time as 15
exemplifying modern international cities, all three boast populations that are characteristically 16
diverse in terms of a variety of socio-cultural variables such as ethnicity and religious 17
orientation. The explanations behind these diversities are varied and reflect the national and 18
regional histories of each city. For our exploration, the common ground was that in each city 19
clearly identifiable and numerically significant subgroups could be found who preserved a 20
culture that had unique characteristics and differentiated them from others in their shared 21
geographical environment. We therefore wished to pose the question as to whether these 22
differentiated experiences might impact on the ways that children experienced physical 23
activity and hence their motor performance. In the case of Hamburg, 15% of the population 24
6
were classified as aliens, the largest group of which were of Turkish origin (The Times, 1
2012). In Melbourne over a third (36%) of the population was born overseas exceeding the 2
national average of 23.1 % (Australian Bureau of Statistics, 2011). Melbourne has the second 3
largest Asian population in Australia, as a result of immigration patterns over recent years. 4
Increasing numbers in recent years have come from India and Sri Lanka but traditionally the 5
intake has been from East and South East Asia. South African census figures report its 6
population categories as being Black African, Coloured, White, Asian and others. Figures for 7
the 2011 census for Cape Town report the majority as being either Coloured (42%) or Black 8
African (39%). Whites and Asian comprised 16% and 1% respectively (City of Cape Town, 9
2012). It should be noted however that the Cape Town figures are not reflective of South 10
Africa’s national distribution which reports 79.2% as Black and only 8.9% as Coloured 11
(Statistics South Africa, 2012). 12
A number of German studies have indicated that the level of motor performance is 13
culturally marked. Stemper, Meier, Bachmann, Diehlmann & Kemper (2006) investigated the 14
motor ability of 3,982 children of grade 2 with 80.1% of German origin and 19.9% 15
comprising migrants of 62 nationalities. A comparison of the means of the motor abilities 16
revealed that children with a migrant background achieved a significantly worse motor 17
performance than their native German classmates (p≤ 0.01). The motor ability and the 18
proportion of those with membership of a sports club were significantly higher in the case of 19
the migrant boys (35.1%) than in that of the girls (19.65) with a migrant background (Stemper 20
et al., 2006). Similar findings have been reported by Greier & Riechelmann (2012) for 21
kindergarten children (n=1063) from age 4 to 5, Kretschmer & Wirszing (2008) for primary 22
school children (n=2118) from age 6 to 10 and Bös, Worth, Opper, Oberger, Romahn, 23
Wagner, Jekauc, Mess, & Woll (2009). The latter was a nationwide representative study of 24

7
the motor ability and the physical and sports activities of children and adolescents (n=4529) 1
conducted on behalf of the German Ministry of the Interior. Differences in participation in 2
physical activities were commonly observed in these studies as providing a possible 3
explanatory link for the observed differences in performance. Similar findings linking culture 4
and participation in physical activity have been reported in an Australian context. Booth, 5
Okely, Denney-Wilson, Hardy, Yang, & Dobbins (2006) reported that boys (and to some 6
extent girls) from Asian backgrounds and girls from Middle Eastern backgrounds were less 7
active, and that boys from an Asian background were more sedentary than other boys. They 8
also reported that motor proficiency was markedly lower among students from Middle 9
Eastern backgrounds, particularly girls, and that children with Middle Eastern backgrounds 10
were more likely to be in an unhealthy weight range. 11
Although South Africa presents a different case in terms of migration, it is also a country 12
embracing different ethnic groups where integration has been inhibited over time as an 13
inheritance of apartheid. Today Whites and Coloureds experience a higher socioeconomic 14
status, a better education and greater facility with English or Afrikaans language. In contrast 15
the majority of the Blacks is on a lower socioeconomic level, less well educated, and speaks 16
only one of the African native languages fluently. In terms of physical activity and motor 17
ability differences, have likewise been reported between these groups. In a study of 10,295 18
children aged 6-13, Armstrong (2009) reported that while White children spent an average of 19
130 minutes per week playing sport, Black children spent 29 minutes. White children 20
generally had the highest scores on the tests of physical fitness, with Black children scoring 21
the lowest. The performance of Coloured children tended to fall between that of the other two 22
ethnic groups (Armstrong, 2009, 141). Differences in height and mass were also observed 23
8
between the different ethnic groups, with the White children being the tallest and heaviest and 1
the Black children the shortest and lightest across both genders (Armstrong, 2009, 151). 2
For this current exploration of whether such differences would be likely to persevere 3
between children raised in the same or similar cities, each of the samples from each of the 4
cities were classified with regard to their major cultural origins. The criterion used for this 5
classification was the language the children reported speaking at home in their family. 6
Language is the most widely assessed cultural practice associated with ethnic identity 7
(Phinney, 1990, 505) and it has been used successfully in several studies (Greier & 8
Riechelmann, 2012). 9
The initial study (Kretschmer & Wirszing, 2008) originated in Hamburg before being 10
extended into the South African and Australian contexts. When the authors decided to 11
progress to the present comparative study it was decided to collect basic anthropometric data 12
(height and weight). These were collected for the Cape Town and Melbourne samples, but 13
were not a part of the original German study and therefore not available for the Hamburg 14
sample. 15
Participants 16
A total of 976 students aged 8 and 9 years provided the data for this study. To the 754 17
eligible students from the Hamburg study were added a total of 141 Melbourne and 81 Cape 18
Town students. Prior to the collection of data, ethical approval for the conduct of the research 19
at each location was obtained in accordance with the procedures of the local university 20
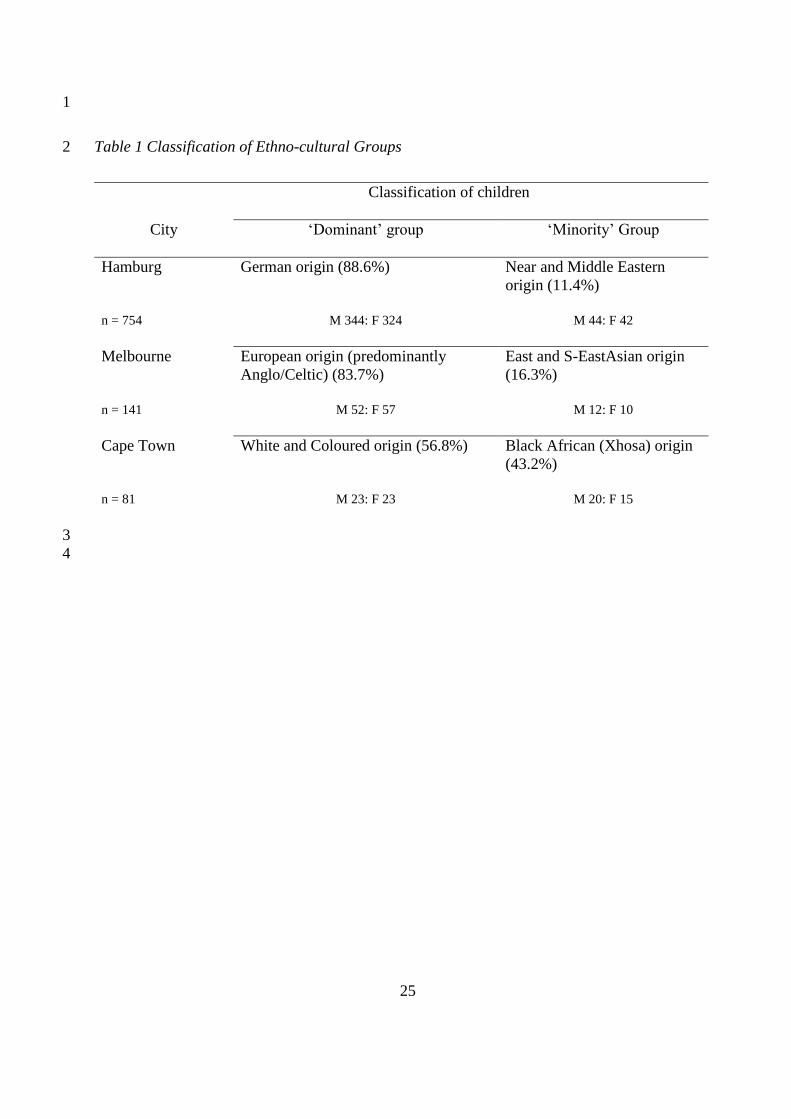
involved. The classification of the sample into ethno-cultural groups in each of the three 21
cities, together with numbers and percentages in each category, is summarised in table 1. It 22
should be noted that the application of the ‘language of the home’ criterion, placed in the 23
same category what in South Africa are considered two distinct racial groups – ‘white’ and 24

9
‘coloured’. On the basis that the consistent application of the criterion of the study still 1
identified a consistent cultural difference between the two Cape Town groups, this was 2
considered appropriate for an exploratory study of this nature. 3
Instruments 4
The motor ability of the children was tested by selected items from the Allgemeiner 5
Sportmotorischer Test für Kinder (AST 6 – 11) (Bös et al., 2001). The AST 6-11 had been 6
originally developed in 1984 by Bös and Wohlmann and published in 1987. It had good face 7
validity being underpinned by a theoretically appropriate model of motor ability based on 8
measurement of the components of speed, power, cardiovascular endurance, agility, hand-eye 9
and whole body co-ordination. The items were easy to administer and required only simple 10
equipment, an important consideration in international studies of this nature. Inter-rater 11
reliabilities have been reported of between 0.74 – 0.94 for each test item and 0.93 for the 12
entire battery. The following five items have been included (see limitations). 13
20 m-run. 14
The test item 20 metre run provides a measure of speed. Children had two attempts; the 15
best one was used. Time was recorded to the nearest tenth of a second. 16
Target throw 17
The test item target throw provides a measure of hand-eye co-ordination for accuracy. 18
The children have to throw a tennis ball as close as possible to the centre of the target which 19
is three metres away and consists of 3 concentric cardboard discs (10, 30 and 60 cm squares). 20
0, 1, 2 or 3 points are given. The sum of ten throws is recorded. 21
Ball-legs-wall throw 22
10
The test item ball-legs-wall throw checks the co-ordination of the entire body under 1
precision pressure. The child starts the exercise by standing with their back at 3 metres 2
distance from the wall. The ball is then thrown through the legs onto the wall and an attempt 3
made to catch the rebounding ball before it hits the ground after completing half a turn of the 4
body, - all with as little locomotion as possible. Depending on how well the three components 5
(throw - turn around - catch) of the item are performed, 0 - 5 points are given. The sum of ten 6
attempts is then recorded. 7
Medicine ball push 8
The test item medicine ball push measures the strength and power of the arm and shoulder 9
muscles. A one kilogram medicine ball is pushed with both hands as far as possible from a 10
standing position. The better result out of two trials is recorded to the nearest 10 cm. 11
Six minute run 12
The test item six minute run provides a measure of aerobic cardiovascular endurance. The 13
children run along the side lines of a volleyball court for six minutes. The distance achieved 14
in that time is recorded in metres. 15
Method 16
In all settings children were tested in a single session on a whole class basis. Trained 17
student assistants were placed at a single station and the children were rotated between 18
stations at the direction of the senior author. In all cases the six minute run was administered 19
after completion of the other items. A verified English translation of the original German 20
manual outlining the protocols used in the Hamburg study was used in Cape Town and 21
Melbourne. Student assistants were all prepared and trained by the lead author before data 22
11
collection. Training involved the setting up the test environment, the introduction of the 1
students to the execution of each task and measurement of the test performance. 2
3
Limitations 4
The sampling procedures used prevent any true generalizability from this study; 5
nonetheless it is believed that the convenience samples from Cape Town and Melbourne are 6
largely characteristic of the children in those cities. Brettschneider & Brandl-Bredenbeck, 7
(1997) observed it is simply impossible to ensure equivalent environmental circumstances 8
when collecting field based data in studies like this, especially when, as in the testing for the 9
Cape Town and Melbourne children, they were collected outdoors. As reported above, efforts 10
were taken to minimise inter-rater variability. However from the environmental perspective, 11
for the Hamburg sample all tests were administered indoors, whereas those in Cape Town and 12
Melbourne were administered outdoors in their normal physical education environment. 13
While the children of the Hamburg sample predominantly wore sports clothes and shoes, the 14
children in the Melbourne sample completed the test tasks in their school uniforms, the Xhosa 15
children in their street clothes and sometimes barefoot. With regard to the assessment 16
instruments, despite attempts to standardise equipment used, one item - the boomerang run- 17
used to measure agility, had to be excluded from the analysis due to an inability to assemble 18
apparatus in Cape Town and Melbourne comparable to that used in Hamburg. 19
Data Analysis 20
The mean scores for performance on each item for the sample from each city are 21
presented for boys and girls. The effects of city and sex on performance were analysed by 22
using a two-way analysis of variance (ANOVA) and presented for each item. To examine the 23

12
relationships between weight, height, BMI, and performance on the individual items (for the 1
Cape Town and Melbourne samples only) the performance results were correlated with the 2
available anthropometric data. Finally composite motor profiles were calculated by 3
summating performance on all five individual items. In order to add items with different 4
metrics all performances were first compared with the standardized sample of Bös et al. 5
(2001) according to age and sex. The raw scores were then converted into Z-values before 6
summation. These composite profiles were then presented in terms of city and sex before 7
being broken down further into ethno cultural group membership. 8
Results 9
Anthropometric data 10
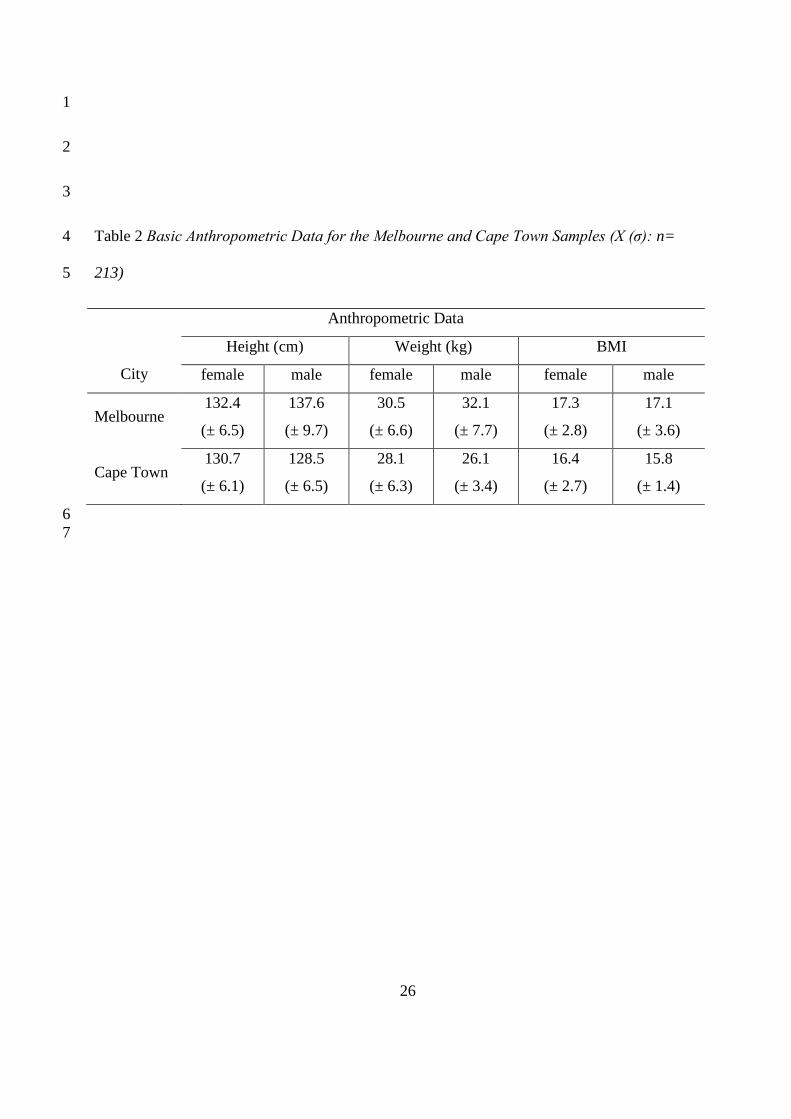
A comparison of the basic anthropometric data (table 2), which had been recorded for the 11
Australian and South African children only, shows that in Melbourne the boys were taller and 12
heavier than the girls. However in Cape Town the girls though smaller than those in the 13
Melbourne group were both taller and heavier than their male peers and with a higher BMI. In 14
the case of the boys the differences in height and weight between the Australian and the South 15
African children were highly significant (p = .000), for the girls however it was in height (p= 16
.049) only that the Australian students exceeded their South African counterparts. 17
Comparison of motor ability 18
The analysis revealed a number of differences in the comparative performance of the 19
Hamburg, Melbourne and Cape Town children in all test items. These are reported in terms of 20
the components best represented in each item 21
22
23

13
Speed (20 metre run) 1
Table 3 shows that the performance of the children from Hamburg ranked slightly higher 2
than that of their peers from Cape Town. The Melbournian children ranked the lowest. 3
ANOVA showed a highly significant difference between the three samples (F5/964= 10.928; 4
p= .000). A significant main effect was observed for both city (F2/967=6.736, p= .001) and sex 5
(F1/968= 24.735, p= .000) meaning that the achievement of the children differed significantly 6
between the boys and the girls as well as between the children of Hamburg, Melbourne and 7
Cape Town. There was no significant interaction between city and sex (F5/967= .646; p= 8
.525). In the case of the Melbourne and Cape Town samples a significant correlation was 9
noted between performance on this test and both the weight (r= .225; p= .001) and the BMI 10
(r= .266; p= .000). Namely the bigger heavier children ran slower than their lighter 11
classmates. 12
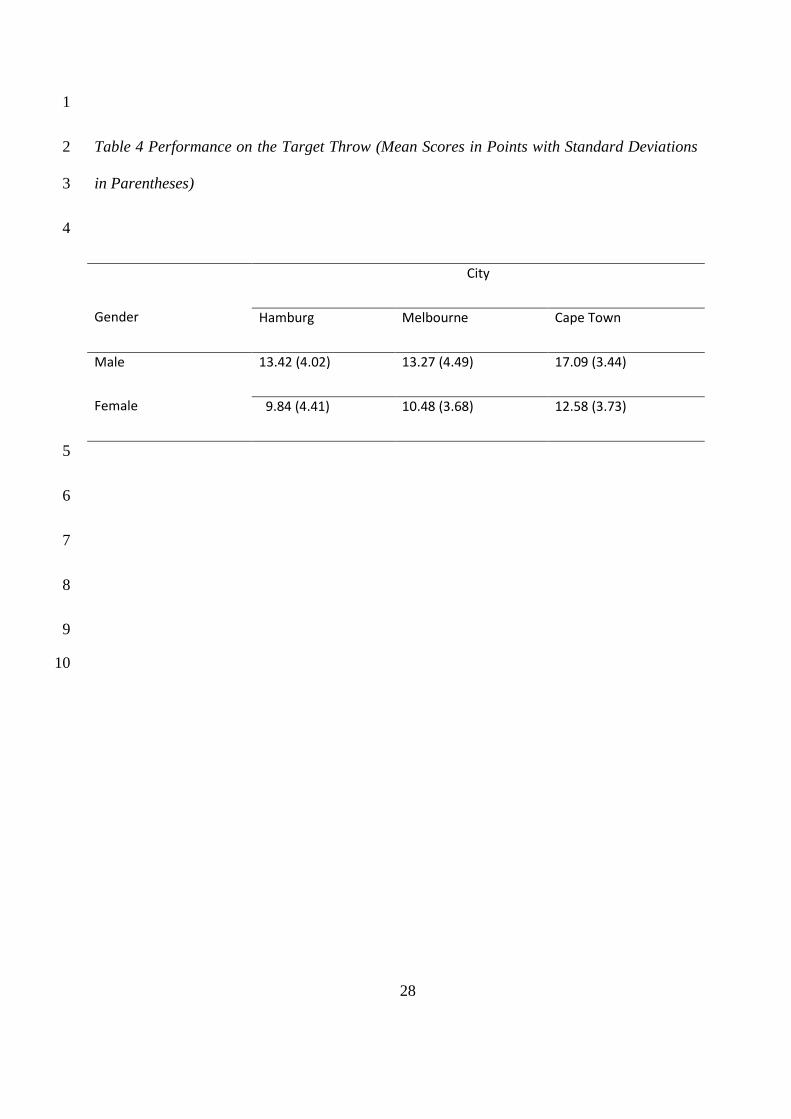
Hand-eye coordination (Target throw) 13
A highly significant difference between the groups was found on this item (F2/946= 14
19.389; p= .000). The performance of the children of Cape Town with a mean score of 14.91 15
points was significantly better than the performance of the children of Melbourne with a mean 16
score of 11.84 (p= .000), closely followed by the children of Hamburg with 11.7 points (p= 17
.000). The difference between the performance of the students of Melbourne and Hamburg 18
was not significant. The boys from Cape Town achieved the best result, the girls from 19
Hamburg the poorest. The results show clear differences both by city (F2/949= 21.737; p= 20
.000) and sex (F1/950= 80.371; p= .000) with the greater difference being by sex, with no 21
significant interaction (F2/949= .1.100, p= .333) being observed. No correlation was found 22
between height, weight and BMI measures and the target throw item. 23
14
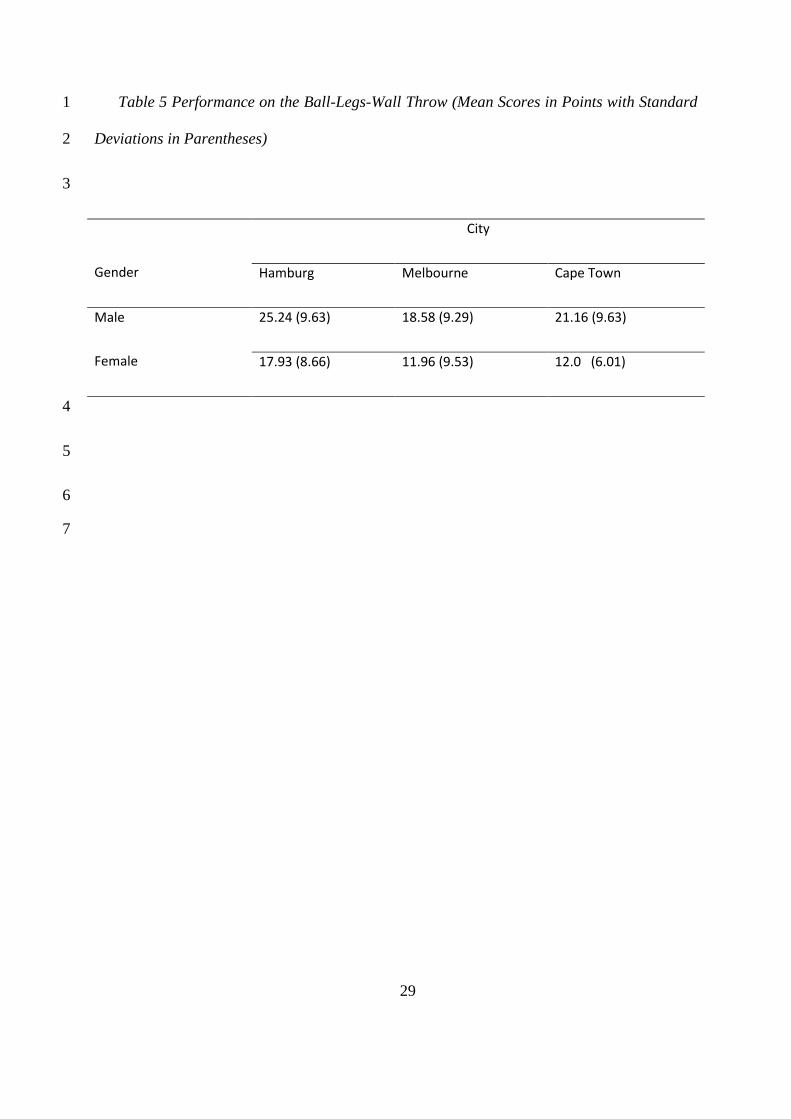
Whole body co-ordination (Ball-legs-wall throw) 1
The children of Hamburg reported significantly higher scores than the children of 2
Melbourne and Cape Town (F2/970= 30.887, p= .000). Once again both city and sex showed a 3
significant main effect (F2/969= 35.164, p= .000; F1/970= 77.186, p= .000) with no significant 4
interaction between them (F2/969= .519, p= .595). The Hamburg girls performed significantly 5
better than the girls from Melbourne (p= .000) and Cape Town (p= .000). Hamburg’s boys 6
also achieved better results than their peers from Melbourne (p= .016) and Cape Town (p= 7
.001). No significant correlation was observed between performance on this item and the 8
BMI, weight or height measures. 9
Power (Medicine ball push) 10
Once more there was a significant effect for city (F2/969= 35.773, p= .000) with the 11
children of Hamburg gaining the highest scores compared to the children of Melbourne (p= 12
.000) and Cape Town (p= .000). The differences between the Melbourne and the Cape Town 13
students, however, were not significant. The German girls actually performed better than the 14
boys of the other two cities on this item and the gap between the girls and the boys in 15
Melbourne and Cape Town was noticeably smaller. Consequently for this test, although sex 16
still provides a significant main effect on performance (F1/970= 23.603, p= .000); there is a 17
significant interaction between the two (F2/969= 5.335, p= .005) which means that the nature 18
of the impact of sex differs between the three samples. A significant correlation was found to 19
exist between performance of the medicine ball push and participants’ BMI (r= .174; p= 20
.011), weight (r= .413; p= .000) and height (r= .524; p= .000). 21
22
23
15
Cardiovascular endurance (Six minute run) 1
The results achieved by the samples differed significantly (F2/954= 16.837; p= .000). The 2
Cape Town children performed best and they were significantly better than both the 3
Melbourne (p= .000) and Hamburg children (p= .009). Sex features as a more highly 4
significant variable in determining performance (F1/955= 28.652; p= .000) with an interaction 5
between city and sex (F2/954= 8.188; p= .000). It can be seen that across the three samples the 6
performances of the girls didn’t differ much. The Melbourne girls ran about 36 metres less 7
than the top performing girls’ group from Cape Town which was not significant (F2/468= .948; 8
p= .388). However this was quite different in the case of the boys. The Melbourne sample 9
only completed a mean distance of about 860 metres in the available time which was about 10
185 metres less than the distance run by their Cape Town counterparts (F2/484= 22.108; p= 11
.000).. 12
Not unexpectedly for this endurance test, a negative correlation was found in the case of 13
the Melbourne and Cape Town children between performance and both BMI (r= -.284; p= 14
.000) and weight (r= -.272; p= .000). 15
Composite motor profiles 16
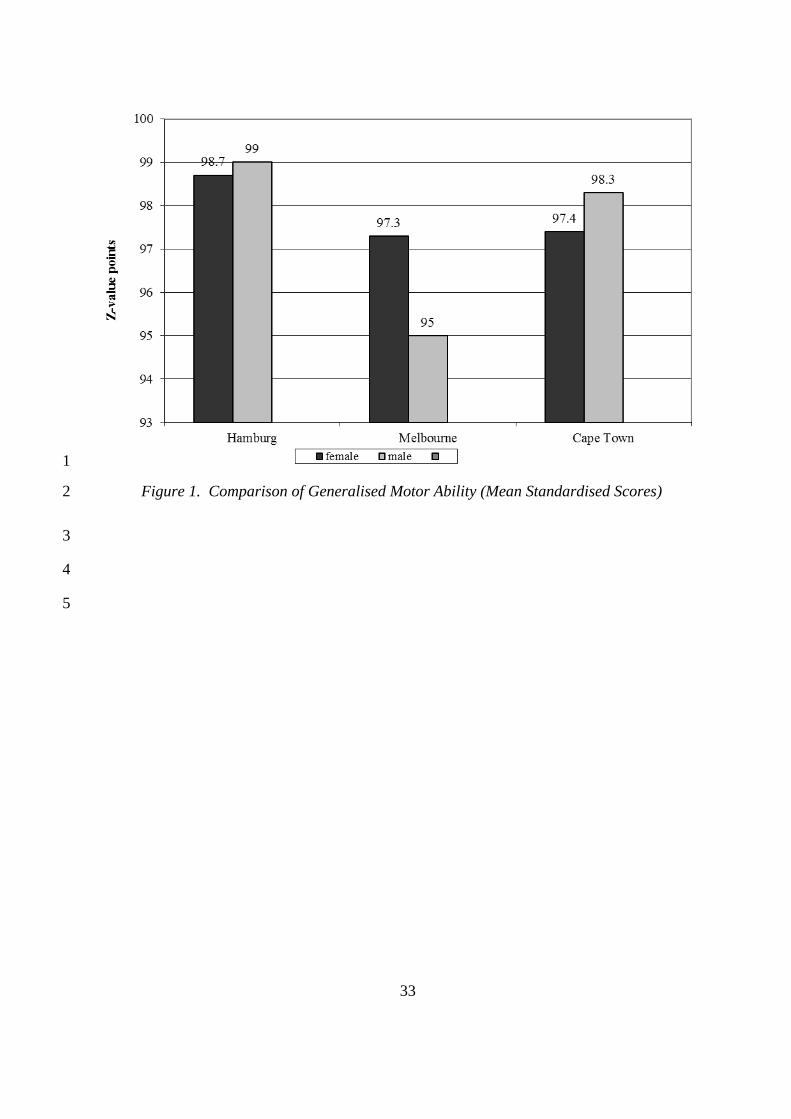
Figure 1 provides a comparison of the overall performances of the children in this study 17
by means of a composite motor ability score, obtained by summating the results for the five 18
individual measures obtained in this study. The results reported here represent a standardised 19
score with 100 points representing the average score recorded by the original German sample 20
of Bös et al. (2001). Scores have been separately standardised according to gender. The scores 21
between the samples in this study differ significantly (F2/967= 10.648; p= .000). The students 22
16
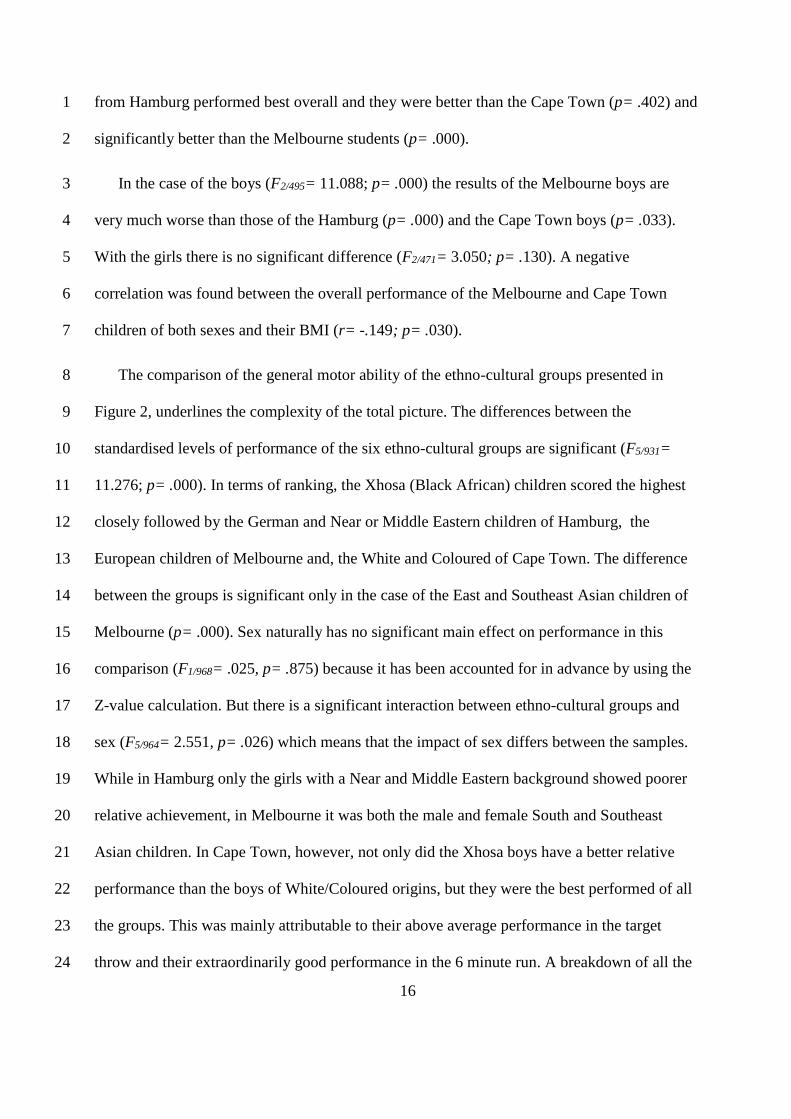
from Hamburg performed best overall and they were better than the Cape Town (p= .402) and 1
significantly better than the Melbourne students (p= .000). 2
In the case of the boys (F2/495= 11.088; p= .000) the results of the Melbourne boys are 3
very much worse than those of the Hamburg (p= .000) and the Cape Town boys (p= .033). 4
With the girls there is no significant difference (F2/471= 3.050; p= .130). A negative 5
correlation was found between the overall performance of the Melbourne and Cape Town 6
children of both sexes and their BMI (r= -.149; p= .030). 7
The comparison of the general motor ability of the ethno-cultural groups presented in 8
Figure 2, underlines the complexity of the total picture. The differences between the 9
standardised levels of performance of the six ethno-cultural groups are significant (F5/931= 10
11.276; p= .000). In terms of ranking, the Xhosa (Black African) children scored the highest 11
closely followed by the German and Near or Middle Eastern children of Hamburg, the 12
European children of Melbourne and, the White and Coloured of Cape Town. The difference 13
between the groups is significant only in the case of the East and Southeast Asian children of 14
Melbourne (p= .000). Sex naturally has no significant main effect on performance in this 15
comparison (F1/968= .025, p= .875) because it has been accounted for in advance by using the 16
Z-value calculation. But there is a significant interaction between ethno-cultural groups and 17
sex (F5/964= 2.551, p= .026) which means that the impact of sex differs between the samples. 18
While in Hamburg only the girls with a Near and Middle Eastern background showed poorer 19
relative achievement, in Melbourne it was both the male and female South and Southeast 20
Asian children. In Cape Town, however, not only did the Xhosa boys have a better relative 21
performance than the boys of White/Coloured origins, but they were the best performed of all 22
the groups. This was mainly attributable to their above average performance in the target 23
throw and their extraordinarily good performance in the 6 minute run. A breakdown of all the 24
17
relative group performances for each of the items is shown in table 8. This provides for an 1
item by item comparison by using the standardised scores for each task as a basis to 2
categorise the performance of each group by quintiles. Performance of the group is thus rated 3
on each item as being far below average (0-20 percentile), below average (˃20-40 percentile), 4
average (˃40-60) above average (˃60-80) or far above average (˃80-100) in comparison with 5
the 2001 German reference group. 6
The most consistent performance was shown by the German children of Hamburg, who 7
achieved the average four times (20 metre run, target throw, medicine ball push, 6 minute run) 8
and missed it once. The performance in the target throw was average or above for all ethno-9
cultural groups, which indicates improved levels of hand-eye co-ordination in comparison 10
with the German reference population. However all groups performed below the reference 11
population in the ball-legs-wall task which also reflects co-ordination, but at the level of 12
whole body management. This difference may reflect increased exposure to perceptually 13
dominated tasks perhaps through computer style games but less experience of managing 14
whole body responses in association with such external stimuli. The significance of this 15
difference needs attention in future studies. 16
Discussion 17
Our findings, using an adaptation of the AST 6-11, offer support for the hypothesis that 18
there will be some clear differences between the performances of children growing up in the 19
differing contexts provided by major international cities in the first decade of the twenty-first 20
century. In the three contexts of this study, the Hamburg students achieved the highest level 21
of motor performance, followed closely by the students of Cape Town. The performance of 22
the children of Melbourne was significantly lower (F2/966= 10.648; P= .000) than that of the 23
children in both the other cities. However there is a degree of complexity within this broad 24

18
general picture which needs to be further unravelled. For example there were differences with 1
regard to performance on individual test items within the three samples. In three of the five 2
test items (20m run, ball-legs-wall throw, and medicine ball push) the Hamburg children 3
achieved the best results consistent with their overall superior motor ability. However in two 4
test items (target throw, 6 minute run) the Cape Town children were the best performing. The 5
Melbourne children were poorer throughout, yet scored a little better in the throwing 6
measures – both throwing for accuracy and throwing for power - when compared with the 7
other items. Whether this reflects differences in the general movement culture or the impact of 8
specific curriculum interventions such as the Fundamental Motor Skills program, which is a 9
part of the PE curriculum in Melbourne, would be an interesting line of further enquiry. For 10
example, studies in the neighbouring state of New South Wales reported that proficiency in 11
fundamental movement skills increased markedly between 1997 and 2004 (Booth et al., 12
2006), possibly in association with their education system initiatives in that area. 13
The nature of the observed differences in the performance between the sexes confounds 14
the issue even more. This study reveals clearly that sex was a consistent variable in 15
distinguishing differences in performance and far more significant than city of residence 16
alone. The persistent strength of this variable at this age surprised us and it was almost 17
entirely independent of location, with only two test items showing any interaction between 18
city and sex – the 6 minute run and the medicine ball push. The latter was largely because of 19
the poor performance of the boys from Cape Town and Melbourne, who both performed more 20
poorly than the girls of Hamburg in this test of upper body power. 21
Not unexpectedly a significant correlation was found between the anthropometric data 22
collected for the Cape Town and Melbourne samples and the motor abilities of speed, power 23
and endurance. Their higher BMI, weight and height may contribute to an explanation of the 24
19
relatively poorer performance of the Melbourne children in the running items - both 20 metre 1
and 6 minutes - and their better performance in the medicine ball push. 2
The findings of this study also suggest that ethno-cultural group membership does add 3
further complexity to attempts to interpret results such as these. In these findings, the children 4
with a German and European background in Hamburg and Melbourne performed better than 5
their peers with Middle Eastern and East Asian backgrounds. In the case of Cape Town the 6
African (Xhosa) children demonstrated a higher level of performance than their White and 7
Coloured peers which is contrary to the findings of Armstrong, (2009) in her South Africa 8
wide study of children from 6-13. Indeed the Xhosa boys were the best performing group in 9
this study and the only one to perform above the reference point set by the 2001 German 10
sample (Bös et al., 2001). This latter point of course suggests that these data provide, albeit 11
tentative, support for the hypothesis that there is a general decline occurring in children’s 12
motor ability within our globalised communities worldwide. 13
This study is an initial attempt to generate data which are comparable, using standardised 14
tests and measurement protocols as a means to a longer term goal of pursuing well controlled 15
comparative studies that can both identify and increase understanding of changes in children’s 16
motor ability and performance in association with changes in contemporary lifestyle. It comes 17
from a belief that despite all the difficulties involved, it is through comparative studies that we 18
can best improve our knowledge by identifying differences and suggesting some reasons for 19
them. The results of this exploratory study show that we can continue to expect to see some 20
differences in the characteristic motor abilities of children located in different cities around 21
the world. Whether within a globalising world, we should expect increasing convergence in 22
response to increasingly convergent lifestyles, is not yet clear. Further the results of this 23
descriptive and exploratory study show that despite recent changes in gender definitions, sex 24
20
still appears to be an important variable in understanding differences in motor ability, as girls’ 1
motor performance remains persistently lower than that of boys. More cautiously our findings 2
also suggest that the influence of family culture will have an impact on motor ability that can 3
match or even exceed that of the larger societal culture. We believe there is a need for more 4
extensive research to deepen our understanding of the range of cultural impacts on motor 5
ability. Increasing amounts of literature have been emerging on the differences in children’s 6
movement behaviour and experience based on culture and ethnicity. For example de Knop, 7
Theebooma, Wittocka, & de Martelaer (1996) explored the experience of Muslim girls in 8
sport within Western Europe, while Brodersen, Steptoe, Boniface, & Wardle (2006) have 9
charted trends in physical activity and sedentary behaviour amongst Black Asian and White 10
British youth. 11
Recognising the extent and nature of differences in children’s motor development and 12
abilities and progressing on to provide explanations, can ultimately only come from well 13
controlled and resourced comparative studies conducted over time. Such studies will need to 14
be well resourced in order to address some of the issues recognised in this exploratory study 15
and to generate data that are really comparable. However we believe that children’s motor 16
development must remain a major concern of all communities. The fact that variables of 17
gender, location, and ethno-cultural family background are all associated with some 18
differences in performance measures, adds weight to the need for further systematic enquiry 19
around these variables and whether and how they might have some explanatory significance. 20
Unravelling more of the complexity of how our dynamic and developing 21st century 21
environment impacts upon children’s motor development is necessary if we are to enhance 22
our understanding of children’s motor development and the situations in which it might be 23
21
optimised. This is a worthy goal in the light of the potential health and educational 1
advantages that accrue to those children who learn to move effectively and confidently. 2
References 3
Armstrong, M.E.G. (2009). Youth Fitness Testing in South African Primary School Children: 4
National Normative Data, Fitness and Fatness, and Effects of Socioeconomic Status. 5
Unpublished PhD Thesis, University of Cape Town: Department of Human Biology. 6
Australian Bureau of Statistics (2012) 2011 Census Data accessed on www.abs.gov.au 7
Australian Sports Commission (2011). Helping Kids and Communities Get Active. Final 8
Report of the Evaluation of the Australian Sports Commission’s Active After-School 9
Communities Program 2005-07. 10
Baur, J. (1993). Motorische Entwicklung in kulturellen Kontexten. Köln: Sport und Buch 11
Strauss. 12
Bös, K. (2003). Motorische Leistungsfähigkeit von Kindern und Jugendlichen. In W. 13
Schmidt, I. Hartmann-Tews & W.-D. Brettschneider (Ed.), Erster Deutscher Kinder- 14
und Jugendsportbericht (pp. 85-107). Schorndorf: Hofmann. 15
Bös, K., Opper, E. Woll, A., Liebisch, R., Breithecker, D. & Kremer, B. (2001). Das 16
Karlsruher Testsystem für Kinder (KATS-K). Haltung und Bewegung, 21 (4), 4-66. 17
Bös, K., Worth, A., Opper, E., Oberger, J., Romahn, N., Wagner, M., Jekauc, D., Mess, F., 18
Woll, A. (2009). Motorik-Modul: Eine Studie zur motorischen Leistungsfähigkeit und 19
körperlich-sportlichen Aktivität von Kindern und Jugendlichen in Deutschland. 20
Baden-Baden: Nomos Verlag 21
22
Booth, M., Macaskill, P., McLellan, L., Phongsavan, P., Okely, A.D. & Patterson, J. (1997). 1
NSW Schools Fitness and Physical Activity Survey 1997. Sydney: NSW Department of 2
Education and Training. 3
Booth, M., Okely, A.D., Denney-Wilson, E., Hardy, L., Yang, B., Dobbins, T. (2006). NSW 4
Schools Physical Activity and Nutrition Survey (SPANS) 2004:Summary Report. 5
Sydney: NSW Department of Health. 6
Brodersen, N.H., Steptoe, A., Boniface, D.R., Wardle, J. (2007) Trends in physical activity 7
and sedentary behaviour in adolescence: ethnic and socioeconomic differences. Br J 8
Sports Med 41; 140-144 9
Brettschneider, W.-D. & Brandl-Bredenbeck, H.D. (1997). Sportkultur und jugendliches 10
Selbstkonzept. Eine interkulturell vergleichende Studie über Deutschland und die 11
USA. Weinheim: Juventa. 12
Bryan, N.S., Tremblay, M.S., Perez, C.E., Ardern, C.I. & Katzmarzyk, P.T. (2006). Physical 13
Activity and Ethnicity. Evidence from the Canadian Community Health Survey. 14
Canadian Journal of Public Health, 97, 271-276. 15
City of Cape Town (2012) Official website. City statistics and population census accessed on 16
http://www.capetown.gov.za/en/stats/CityReports/Pages/PopulationProfiles.aspx 17
Craig, C, Beaulieu, A. & Cameron, C. (1994) Data Analysis of Fitness and Performance 18
Capacity. Ottawa: Canadian Fitness and Lifestyle Research Institute. 19
Greier, K. & Riechelmann, H. (2012). Einfluss des Migrationsstatus auf die motorische 20
Leistungsfähigkeit im Kindergartenalter. Bewegungstherapie und Gesundheitssport, 21
28, 248-253 22
23
Knop, P. de, Theeboom, M., Wittock, H. & de Martelaer, K. (1996) Implications of Islam on 1
Muslim Girls' Sport Participation in Western Europe. Literature Review and Policy 2
Recommendations for Sport Promotion. Sport, Education and Society, 1:2, 147-164 3
Kretschmer, J. (2001): Changes in Childhood and Children’s Motor Development. 4
International Journal of Physical Education, 3, 114-126. 5
Kretschmer, J. & Wirszing, W. (2008). Mole – Motorische Leistungsfähigkeit von 6
Grundschulkindern in Hamburg. Hamburg: moeve. 7
Kretschmer, J., Erhorn, J. & Wirszing, D. (2010). iMole – eine kulturvergleichende Studie zur 8
motorischen Leistungsfähigkeit von Grundschulkindern aus Deutschland, Südafrika 9
und Australien. In P. Frey & S. Körner (Ed.), Ungewissheit. Sportpädagogische 10
Felder im Wandel (pp. 249-256). Hamburg: Feldhaus. 11
Kuntzleman, C.T. & Reiff, G.G. (1992). The Decline in American Children’s Fitness Levels. 12
Research Quarterly for Exercise and Sport, 63, 107-111. 13
Phinney, J.S. (1990). Ethnic Identity in Adolescents and Adults: Review of Research. 14
Psychological Bulletin Vol. 108 (3),499-514 15
Statistics South Africa (2012) Census 2011: Census in Brief accessed on 16
http://www.statssa.gov.za/census2011/Products/Census_2011_Census_in_brief.pdf 17
Stemper, T., Meier, M., Bachmann, C., Diehlmann, K., Kemper, B. (2006). Motorische 18
Leistungsfähigkeit und Bewegungsaktivität von Kindern mit Migrationshintergrund 19
accessed on http://www.check-duesseldorf.de/uploads/media/poster-meier.pdf 20
The Times (2013) Business city guide. bcg.the times.co.uk 21
24
Tomkinson, G. R. (2004). Secular Trends in Fitness Performance of Australian Children and 1
Adolescents. Thesis PhD. School of Health Sciences, Division of Health Sciences, 2
University of South Australia. 3
4
25
1
Table 1 Classification of Ethno-cultural Groups 2
3
4
Classification of children
City ‘Dominant’ group ‘Minority’ Group
Hamburg
n = 754
German origin (88.6%)
M 344: F 324
Near and Middle Eastern
origin (11.4%)
M 44: F 42
Melbourne
n = 141
European origin (predominantly
Anglo/Celtic) (83.7%)
M 52: F 57
East and S-EastAsian origin
(16.3%)
M 12: F 10
Cape Town
n = 81
White and Coloured origin (56.8%)
M 23: F 23
Black African (Xhosa) origin
(43.2%)
M 20: F 15
26
1
2
3
Table 2 Basic Anthropometric Data for the Melbourne and Cape Town Samples (Χ (σ): n= 4
213) 5
Anthropometric Data
City
Height (cm) Weight (kg) BMI
female male female male female male
Melbourne 132.4
(± 6.5)
137.6
(± 9.7)
30.5
(± 6.6)
32.1
(± 7.7)
17.3
(± 2.8)
17.1
(± 3.6)
Cape Town 130.7
(± 6.1)
128.5
(± 6.5)
28.1
(± 6.3)
26.1
(± 3.4)
16.4
(± 2.7)
15.8
(± 1.4)
6
7

27
Table 3 Performance on the 20 m Run (Mean Scores in Seconds with Standard Deviations 1
in Parentheses) 2
3
Gender
City
Hamburg Melbourne Cape Town
Male
Female
4.33 (.25) 4.46 (.41) 4.34 (.41)
4.57 (.39) 4.65 (.39) 4.49 (.41)
4
28
1
Table 4 Performance on the Target Throw (Mean Scores in Points with Standard Deviations 2
in Parentheses) 3
4
Gender
City
Hamburg Melbourne Cape Town
Male
Female
13.42 (4.02) 13.27 (4.49) 17.09 (3.44)
9.84 (4.41) 10.48 (3.68) 12.58 (3.73)
5
6
7
8
9
10
29
Table 5 Performance on the Ball-Legs-Wall Throw (Mean Scores in Points with Standard 1
Deviations in Parentheses) 2
3
Gender
City
Hamburg Melbourne Cape Town
Male
Female
25.24 (9.63) 18.58 (9.29) 21.16 (9.63)
17.93 (8.66) 11.96 (9.53) 12.0 (6.01)
4
5
6
7

30
1
Table 6 Performance on the Medicine Ball Push (Mean Scores in Metres with Standard 2
Deviations in Parentheses) 3
4
Gender
City
Hamburg Melbourne Cape Town
Male
Female
4.17 (.82) 3.52 (.71) 3.37 (.60)
3.55 (.76) 3.15 (.72) 3.38 (.51)
5
6
7

31
Table 7 Performance on the 6 minute run (Mean Scores in Metres with Standard 1
Deviations in Parentheses) 2
3
Gender
City
Hamburg Melbourne Cape Town
Male
Female
968.5 (137.5) 859.5 (157.4) 1044.5 (199.7)
884.7 (118.8) 866.4 (148.3) 902.1 (201.6)
4
5
6

32
1
Table 8 2
3
Categorisation of individual test item performances against German Reference Group (Bös et 4
al., 2001) 5
6
1 = far below average (percentile range 0 to 20) 7
2 = below average (percentile range 21 to 40) 8
3 = average (percentile range 41 to 60) 9
4 = above average (percentile range 61 to 80), 10
5 = far above average (percentile range 81 to 100) 11
12
City and Ethno-cultural Groups
Hamburg Melbourne Cape Town
Test Item German
Near/
Middle
Eastern
European
East
S/east
Asian
White and
Coloured
Black
African
/Xhosa
20 metre run 3 3 2 2 3 2
Target throw 3 3 3 3 4 4
Ball-legs-wall throw 2 2 2 1 2 1
Medicine ball push 3 2 2 1 2 1
6 minute run 3 3 2 2 2 5
33
1
Figure 1. Comparison of Generalised Motor Ability (Mean Standardised Scores) 2
3
4
5

34
1
Figure 2. Comparison of General Motor Ability Scores by Ethno-cultural Groups (Mean 2
Standardized Scores) 3
4
99,2
94,7
97,9
93,5
96,4
99 99,1 98,4
96
90,9
95,9
101,2
84
86
88
90
92
94
96
98
100
102
European Near/ Middle Eastern European South/ Southeast Asian White / Coloured Black/Xhosa Hamburg Melbourne Cape Town
Z-value points
female male