*2 flllfffflllfff - dtic.mil STATEMENT ... Clearing and Grubbing 2 Stripping Topsoil 2 Obtaining,...
118
A&-AO2 192 HYDROLOGIC ENGINEERING CENTER DAVIS CA FS1/ COSTS OF PLACING FILL IN A FLOD PLAIN. CU) *2 flllfffflllfff m~hhE~MEEEEEE EELhShEEIhEEEE , M~hEEE~h
Transcript of *2 flllfffflllfff - dtic.mil STATEMENT ... Clearing and Grubbing 2 Stripping Topsoil 2 Obtaining,...

A&-AO2 192 HYDROLOGIC ENGINEERING CENTER DAVIS CA FS1/COSTS OF PLACING FILL IN A FLOD PLAIN. CU)*2 flllfffflllfffm~hhE~MEEEEEEEELhShEEIhEEEE, M~hEEE~h

,/A3
COSTS OF PLACING* FILL IN A FLOOD PLAIN
MAY 1975DTICELECT_'1
JUL 29 1981
THE HYDROLOGICii /ENGINEERING CENTER
*research-training
CRPS OF ENGINEERSaplctoU. S. ARMY
D I 1P I
___ -7 2 7 0 05

UNCLASSIFIEDSECURITY CLASSIFICATION OF THIS PAGE (When Date Entered)
REPORT DOCUMENTATION PAGE READ INSTRUCTIONSBEFORE COMPLETING FORM
I. REPORT NUMBER 2. GOVT ACCESSION NO. 3. RECIPIENT'S CATALOG NUMBER
4 TITLE (and Subtitle) 5. TYPE OF REPORT & PERIOD COVERED
S OSTS nF.PLACIr FILL I)I A FLOOD PLAIN,
6. PERFORMING ORG. REPORT NUMBER
7. AUTHOR(8) 8. CONTRACT OR GRANT NUMBER(s)
9. PERFORMING ORGANIZATION NAME AND ADDRESS 10. PROGRAM ELEMENT, PROJECT, TASKAREA & WORK UNIT NUMBERSU. S. A rmyv Corns of EneineersThe 1',/droloqic Engineerinn 'Center
Second Street, Davis, CA ,)5lI. CONTROLLING OFFICE NAME AND ADDRESS Il V,, 7 W5ef rY
, { lay .(75/ril,.,.NU " ,mP AGES
14. MONITORING AGENCY NAME & ADDRESS(If different from Controlling Office) IS. SECURITY CLASS. (of this report)
• Unclassi fipdiSa. DECLASSIFICATION/DOWNGRADING
". .SCHEDULE
16. DISTRIBUTION STATEMENT (of tls Report)
Distribution of this publication is unlimited.
17. DISTRIBUTION STATEMENT (of the abstract entered In Block 20, If different from Report)
IS. SUPPLEMENTARY NOTES
19. KEY WORDS (Continue on reverse aide if necessary and identify by block number)
Water resources, Flood plain management, Nonstructural measures, Costs.
20. ABSTRACT (Continue an reveres side if necessery end Identify by block number)
Major factors to be considered when estimating the construction costof placing fill in a flood plain are: preparation of the site; obtaining,placing and compacting the desired depth of fill; providing compensatorystorage; variations in labor and equipment costs in different cities. Dataare presented to facilitate estimating these factors.
JAN 73 143 EDITION OF INOV 65 IS OBSOLETE 17/ O O TS A neSECURITY CLASSIFICATION OF THIS PAGE (mien Dete Enter-ed)
Oka., ~ .

COSTS OF PLACING FILL
IN A FLOOD PLAIN
MAY 1975
UK 5AccesionForhe Hydrologic Engineering CenterAccession ForCorps of Engineers, U.S. ArmyL 1
NTIS GRA&I 609 Second StreetDTIC TAB Davis, California 95616unlanniounced rJustificatio-.
By- _ 3/81-Distribution/
Availability CodesAvail and/or
Dit Special

CONTEN TS
INTRODUCTION 1
SUMMARY OF STUDY RESULTS 1
Major Considerations in Estimating Construction Costs 2Clearing and Grubbing 2
Stripping Topsoil 2
Obtaining, Placing, and Compacting Fill 3
Providing Compensatory Storage 3
Labor and Equipment Cost Variation 4Example Computation 5
Engineering. Enviromental and Legal Aspects of Filling 6
STUDY CONCLUSIONS 8APPENDIX
"Guidelines for Filling Floodplains," Bauer Engineering, Chicago,Illinois, April 1975
"Prevailing Unit Costs for Placing Residential Fill in the WesternUnited States,* Gennis, Gray & Justice, Engineers, Sacramento,California. March 1975*Cost of Earthwork Fills in Floodplains of the Central and SouthernUnited States," VTN Inc., Louisiana, Metairie, Louisiana, April 1975

COSTS OF PLACIIIG FILL IN A FLOOD PLAIN
INTRODUCTION
The purpose of this study is to develop information on the costs
associated with placing fill in a flood plain for residential development.
This information is intended to be used only for making approximate or orderof magnitude estimates of cost during preliminary planning and plan review
and not as a substitute for detailed cost estimating. The study was
sponsored by the Institute for Water Resources.
To develop the necessary information The Hydrologic Engineering Center
contracted with three engineering firms in different regions of the country
and asked them to develop cost information for their respective region. The
firms performing this work were,
Bauer Engineering
Chicago, IllinoisGennis, Gray and JusticeSacramento, California
VTN EngineersMetairie, Louisiana
Results from these studies are summarized below and the studies themselves
are included in the Appendix of this report. Each firm contributed a
unique perspective to the question, "what does it cost to fill in the
flood plain?" and taken together they present the information necessary
for approximating construction costs. In addition, important information
is presented on engineering, environmental and legal implications of
filling in of flood plain land.
SUMMARY OF STUDY RESULTS
The major factors to be considered when estimating the construction
cost of placing fill in a flood plain are: preparation of the site, that
is, clearing and grubbing of existing vegetation and stripping of topsoil;

obtaining, placing and compacting the desired depth of fill at the site;
providing compensatory storage for the natural flood plain storage lost
by filling; and variations in labor and equipment costs in different
cities around the country. All of these costs are important, should be
included where applicable, and can be approximated from data presented in
this report.
In addition to construction costs there are other important considera-
tions - the change in conveyance capacity of the channel, the change in
flood plain storage, the change in the existing flood plain environment,
and the legal implications of altering flood plain land.
Major Considerations in Estimating Construction Cost
Clearing and Grubbing - Where vegetation exists at the flood plain
site, it should be removed before fill is placed. The type of vegetation
to be removed, the type of soil available to support removal equipment,
and the method of disposal are the major cost factors.
Stripping Topsoil - Where topsoil at the site is unsuitable as a
foundation for fill, then it should be stripped and replaced with suitable
material. Major cost factors are the deptn of topsoil to be stripped and
the length of haul. If the material is respread and graded then thiscost must be included.
Data for the cost of clearing and grubbing and for stripping of
topsoil were developed by Bauer Engineering and are shown in Table 1.
While these data are for general conditions and are based upon experience
in Illinois they do provide an indication of the relative magnitude of
this cost item and should be an adequate indicator. Where site conditions
differ significantly from those for which these data were developed then the
values should be adjusted accordingly.
2

PRVAIL/MG UNIT COSTS FOR IPLACING RESIDENTIAL F/I.L IN ro am wro sram rae UP am oCnow
MHE WESTERN UNITED STATES 0Ir Ce lviME.vs NAM LIME d ft"i
wir cosr$SI ON51 a. (M. ft. &AvME AwAwj wor v ewlr allff Afecowvslaucnioa cosT INsDEX OF forf I MAD UoT COST.ev/S. AfferAGIA(-AuGUsT ism4
ONE-WAYr It TOTALL OCATI/ON HAUL DISTANCE I- U//rT COT UANT/TI
I~e 5~f Mfthiwisw ifW OF FILLMAMERAL
I AS Ci WI. '1
LCLaioff
. MW
See##/* 0. t
A 8 C
sIOl r~lcsc*Wf oif
vol WVI itL ,M "L
Iv Aa, #*fife 060 - .
FIGURE I a..Saw
Fe.. 0

PRrvAIlIA' UNI coSrs FOR PLACING RESIDENTIAL PIL1L r0-Q WiESNAW'fD1.LDFU LCh:EVI
IMT~E EASTERN AND SOJJTEASrER UNrTD STACS IOVSOVA m
movr cvsfl s, A co raLwmaee wws AEcoe I AA wp mv
LO CAION ow m AUL DISA CE '' IUN T C S orA FAILL
AM B a,.
VON,,
t j 'omm 9.00 dto
#ANA" I Awano
iaEE ve I.dw O
am taV4bm 4m
I LasI~~~2 0'r E m-I
W. Ve. 4
Schedule A - Phitewlos ,'l 1,0000 4J
SCAMdul a P1 fIsAE, p, Cb/ege. So/jimm a,2
SCe4edv/e C - $60 Af60ie. favest.,.m NAfvMA agoooo >
*df ~ emeowc
*fftW.Nd a.
FIGURE lb~

Table 1: Cost of Clearing, Grubbin. and Stripping of Topsoil Prior toFilling of Flood Plains in Dollars Per Acre
Clearing and Grubbing Stripping of Topsoil
norm no vegetation thick vegetation
$ 6,800 $ 5,800 $ 7,000 norm(1.5 ft. to be stripped)
$ 4,900 $ 3,900 $ 5,100 1.0 ft. to be stripped
$ 8,700 S 7,700 $ 8,900 2.0 ft. to be stripped
$14,550 $13,550 $14,750 3.5 ft. to be stripped
From - Bauer Engineering, "Guidelines for Filling Floodplains," April 1975.
Obtaining, Placing and Compacting Fill - Major factors which influencethe cost of these items are: the cost of the fill, that is, whether there
is a royalty charge; the haul distance from borrow to placement site; the
quantity being hauled; the compaction requirements (assumed in this studyto be 90% which is common for residential fill); and labor and equipment
costs which vary with geographic location.
All three firms developed information for estimating the cost ofobtaining, placing and compacting fill. There was general agreement inthese data when labor and equipment cost variation, between different
cities, was taken into consideration. Each firm presented their data in
a somewhat different form, so to present a uniform technique covering all
three regions the data were placed on a nomograph developed by Gennis,
Gray & Justice Engineers (Figures la,lb). In some regions additional datawas collected to provide a broader range of coverage and these are
tabulated in an Appendix to the Gennis, Gray & Justice report.
Providing Compensatory Storage - In flood plains governed by statelaws or local ordinances that require that flood plain storage eliminatedI by fill be compensated for, the cost of providing this compensatory storage
should be included as a cost of placing fill. Table 2 summarizes the costexperience of Bauer Engineering in Illinois for providing compensatory
3
1l
_ ____

storage. These costs include land and construction costs for detention/
retention reservoirs as a means of providing this storage and serve as
an indicator of the magnitude of this cost item. For storage to be truly
compensatory it must have the same hydrologic and hydraulic effect as
natural storage.
Table 2: Cost of Compensatory StorageDollars Per Acre of Flood Plain Filled
Cost of Land Average Depth of Fill (ft.)*
0 2 4 6 8
$ 2,000/acre 0 6,700 13,000 19,300 25,600
$ 5,000/acre 0 7,300 13,600 19,900 26,200
$10,000/acre 0 8,300 14,600 20,900 27,200
From - Bauer Engineering, "Guidelines for Filling Floodplains," April 1975.*These average depths were modified by 2 feet to eliminate the 2-foot height
above the 100-year design flood elevation assumed in the Bauer Engineering
report and which did not enter the computations.
The data in this table were developed in the following manner. It was
assumed the cost of compensatory storage includes $3,150 per acre-feet of
fill for nonexcavation costs - site preparation, structures, pumps - and
20% of the flood plain land cost. Thus, the table value for flood plain
land costing $2,000/acre and being filled 4 feet is 4 x 3,150 + .2 x 2000
or $13,000 per acre of flood plain filled. The nonexcavation cost
($3,150) and land cost (20%) were developed from projects described in
Table 4 of the Bauer Engineering report.
*Labor and Equipment Cost Variation - A given fill project will cost
more in one location of the country and less in another, partly because
of the difference In labor and equipment costs. This is illustrated inFigure 1. Various cost indices have been developed over the years to help
estimators account for this variation. One popular index is that of
Engineering News-Record, referred to as the ENR Construction Index.
4
...... . . ... .....

ER Indices are available on a monthly basis for twenty major cities of
the country. Approximate costs obtained from Fiqure 1 can be applied to
other locations and prices can be updated to current price levels using
the ER Construction Index. Other indices are available - some more
representative of earthwork costs - and these may be used in a similar
manner. The ENR Construction Index was selected because of its general
use and because it was felt it would be sufficiently accurate for the
purposes discussed here.
Example Computation
As an example of the computational procedure for estimating costs
of placing fill in a flood plain, assume the following hypothetical con-
ditions,
10 acres of flood plain area in the vicinity of Sacramento,
California
3-foot average fill depth below the 100-year flood elevation
• 48,400 cubic yards of fill required
- 90w compaction required (normal requirements for residential
fill)
* little vegetation in the area
'1.0 feet of topsoil to be stripped
• 3-mile one-way haul distance to placement site (no royalty charge)
* $5,000/acre approximate land value
- minimal natural wildlife or habitat
* compensatory storage is required
Cost of Clearing and Grubbing and Stripping Topsoil from Table I
Cost = $3,900/acre
Cost of Obtaining, Placing and Compacting Fill from Figure I at
Sacramento, 3-mile haul distance and 48,400 cubic yards
Cost a $l.80/cu.yd.
Cost of Compensatory Storage from Table 2 interpolating between
2 feet and 4 feet,
Cost - $10,450/acre
5

Labor and Equipment Cost Variation
The ENR Index does not cover Sacramento, so no adjustment in
cost of clearing and grubbing and stripping of topsoil will
be made. Also, because Sacramento is one of the locations
in Figure 1, no adjustment need be made for cost of obtaining,
placing and compacting fill.
Costs in March 1975 Dollars
Figure I is based upon average 19Y4 dollars - an ENR Construction
Index of 2072. The average index for March 1975 was 2128.
Total Cost of Placing Fill
Clearing and Grubbing and
Stripping Topsoil $3,900/acre x 10 acres $ 39,000
Obtaining, Placing and
Compacting Fill $1.80/cu.yd. x 48,400 cu.yd. = $ 87,120Compensatory Storage $10,450/acre x 10 acres a $104,500
Total Cost $230,620
or $ 23,000/acre
Cost in March 1975 Dollars 21-7 23,000 $ 23,600
Engineering, Environmental, and Legal Aspects of Filling
Filling in of flood plain land has a potential impact on the conveyance
capability of the stream, the availability of natural flood plain storage,ground water recharge rates and the natural ecosystem (Bauer Engineering,
page 13). While fill would generally be placed outside the main floodway
the conveyance capability of the flood plain during flood flows is none
the less reduced. The result is an increase in water surface elevation.
Flood plain occupants in residence before fill placement could experience
higher flood levels than previously occurred as a result of the fill.
Natural flood plain storage has an attenuating effect on flood flows
similar to that of storage reservoirs. The loss of flood plain storage
6

by filling can result in higher flood flows in downstream reaches, especially
if fill placement is extensive. The replacement of natural storage by
compensatory storage may be difficult because not only is the total volume
of significance, but so is the time and manner in which it comes into
operation.
Another potential impact Is on the availability of ground water.
Flood plains often serve as prime recharge areas for shallow aquifers andthe recharge rate influences the amount of water available for pumping.
Altering the ground surface above these aquifers may cause changes in the
recharge rate with a corresponding long term reduction in available ground
water.
The natural ecosystem, that is, the ecosystem existing in the floodplain prior to placing fill, will be modified by placing fill. The extent
of this modification and its relative importance with respect to environ-
mental features is site dependent. Various attempts have been made to
estimate an economic value of the ecosystem and from this the economic
loss or gain due to its modification. Whether or not an economic value
is estimated, the changes - quantitative and qualitative - should be
recognized.
An examination of several flood plain ordinances and court decisionsby Bauer Engineering presents information on the current legal activity
concerned with regulating filling in of flood plain land. This activity
includes establishment of permit procedures, prohibiting alteration of
floodway capacity, requiring compensatory storage, assessing the suita-
bility of flood plain land for different uses, and preventing unreasonable
changes in the natural lateral and vertical drainage flow. This legal
activity raises the question of the propriety of filling and whether
filling, without consideration of all effects, is contrary to sound
management practice.
7
S. .- -

STUDY CONCLUSIONS
Information is presented in this report for the cost of placing fill
in a flood plain. This information should be useful to planners and others
for determining approximate construction costs of placing fill. While the
data presented are derived from specific bids or engineer's estimates they
are presented here for general use and as such some of the site specificity
upon which they were originally based is lost. The data presented for
approximating the cost of obtaining, placing and compacting fill is
relatively complete. The data for clearing and grubbing, stripping topsoil,and compensatory storage is based upon experience in Illinois. It would be
desirable to obtain similar data in other regions of the country, however,
these data serve as a useful reference point.
In addition to construction costs there are other engineering,
environmental, and legal aspects of filling which should be addressed.Filling can reduce the conveyance capability, raising water surface eleva-
tions; reduce available flood plain storage, raising water surface elevations
downstream; reduce ground water recharge rates; modify the existing ecosystem;
conflict with laws and ordinances intended to manage flood plain land use.
A detailed discussion of these effects is beyond the scope of this particular
study, but should not be beyond the scope of any planning study proposing
flood plain fill.
+ 8

GUIDELINES- I FOR FILLING FLOODPLAINS
A Bauer Engineering Report
April 1975

TABLE OF CONTENTS
Page
I. INTRODUCTION 1
II. FACTORS INFLUENCING COSTS 2Clearing and Grubbing 3Stripping Topsoil 4Obtaining Fill 5Placing and Compacting 6Providing Compensatory Storage 6
III. COST EXPERIENCE 8Clearing and Grubbing 8Stripping Topsoil 8Obtaining Fill 9Placing and Compacting Fill 9Providing Compensatory Storage 9Cost Tables 9
IV. OTHER ENVIRONMENTAL IMPACTS 13Impact on Groundwater 13The Value of Natural Plood Plain Storage 14Impacts on Flood Plain Ecosystems 16
V. LEGAL ASPECTS OF THE FILLING IN OF FLOODPLAIN LAND 18
VI. REFERENCES 26
APPENDIX A-1

I]ALER ENr,_IERG, INC.20 NORTH WACKER DRIVE -CHICAGO. ILLINOIS 6006 -TELEPHONE (312) 366-7900
April I',, 197)
Mr. William S. Eichert, DirectorHydrologic Engineering CenterSacramento DistrictCorps of EngineersBrinley Building609 Second StreetSuite MDavis, California 95616
Dear Mr. Eichert:
We are pleased to submit this final report on guidelines forthe placement of fill in a flood plain to protect against a 100-yearflood.
Thank you for the opportunity to perform this service. Wewill welcome any questions the report may raise.
Sincerely,
S/
- Clint '. Keifer/President
CJK/pr
Enc.
CONSULTING ENGINEERS-LAND AND WATER RESOURCES

I. INTRODUCTION
The objective of this report is to present a set of guidelines for
use by Project Reviewers at the OCE level in evaluating the cost of plac-
ing fill in a floodplain in order to elevate the entire plain above the
level that would be reached by a 100-year flood. The assumption is that
the filled area would be used as a site for new realty development.
The construction costs of preparing the site and placing the fillare quantified in these guidelines. However, a number of impacts of
floodplain filling and their implications also must be addressed. These
include the loss of floodplain storage, the reduction of groundwater re-
charge, and the damage done to ecosystems -- items difficult to quantify
in terms of the values traditionally assigned in cost evaluations. Further-
more, legal implications arising from the growing practice of state and
local government regulation of land use in flood-prone areas must be taken
into account. Therefore, this report includes a resume of some experience
relating to the legal aspects of floodplain filling.
1

I. FACTORS INFLUENCING COSTS
The formulation of specific cost guidelines must begin with certain
assumptions regarding the nature of the fill and the procedures used inplacing the fill in the floodplain.
There are two principal methods of filling in a floodplain. The
entire plain can be raised above the level of the 100-year flood, or the
sites of structures called for by the development plan can be raised above
the 100-year flood level while the intervening plain is not raised. The
assumption made in this report is that the floodplain would be raised uni-
formally. Hence, the stated cost is the maximum cost of filling in a
floodplain.
The filling in of a floodplain can be either unplanned or planned.
Many small areas are filled in an unplanned manner. In such cases, the
owner of the property solicits fill and accepts almost anything that is
available. The result is a heterogenous mixture of building rubble, spoil
from construction projects, and ashes in the fill. One possible conse-
quence is differential settling of the fill due to poor compaction. This
filling method may seem inexpensive, but substantial costs may be incurred
in rectifying problems that arise after the development has been placed
on the fill. Also, leachate from such fills can cause water pollution.
The writers of this report believe that unplanned fills will become
rarer as state and local regulatory agencies enforce regulations to pre-
vent unwise use of floodplains. So the report will not present cost guide-
lines for unplanned fills. The guidelines presented here apply only to
the planned filling of floodplains, and are a composit of cost estimates
for clearing and grubbing the site, stripping topsoil, obtaining fill, and
-2-

placing and compacting the fill in the floodplain. Each of these cost
elements is discussed briefly below.
Clearing and Grubbing
Clearing and grubbing to remove existing vegetation should be
carried out before the flood plain site is filled.
The type of existing vegetation greatly influences these costs.
For example, if the vegetation consists only of grass, the clearing and
grubbing would not be necessary because the stripping of the topsoil
would remove it. If the vegetation consists of a great number of large
trees and brush, clearing and grubbing would be a major operation. For
this report, existing vegetation will be assumed to consist of scrub brush
with some medium-sized trees.
Another major factor in the cost of clearing and grubbing is whether
the ground in the area will support heavy machinery. If not, more ex-
pensive methods will have to be utilized. In such unstable soil areas,
not only will clearing and grubbing be more expensive but all associated
development activities will also be Increased in cost. For the purposes
of this study, it is assumed that only floodplain containing favorable soil
and geologic conditions will be filled.
-3-

The method of disposal of the cleared vegetation is a significant
cost item. Burning of this material was the usual technique in the
past. However, present air pollution laws all but eliminate this as an
option. Alternate methods include chipping and spreading on site, burial
on site, and off-site disposal. Chipping and on-site spreading will be
the assumed method of determining costs in this report.
Stripping Topsoil
Topsoil and other soils found in flood plains may not be suitable
for foundations. Soils that are normally high in organic content should
be stripped off the surface. The amount of these types of soils existing
in a flood plain is the result of a number of factors including, climate,
topography, and underlying geology. If the depth of this type of soil
is not known for a particular flood plain, rough estimates based on ex-
perience in Illinois can be made on the basis of topographic data. For
steep gradients of the flood plain, the depth of topsoil required to be re-
moved would be about 1 foot. For intermediate and gentle slopes 2.0
feet and 3.5 feet respectively would have to be removed. These figures
should be used with care because a number of additional factors could
alter them significantly.
The topsoil is usually stripped from the fill site and stockpiled
to be used for landscaping and seeding purposes. Variables in the cost
of this operation include depth of topsoil and length of haul to the stock-
pile. It is assumed all topsoil is replaced on finished grade. The
costs presented for this item include stripping, stockpiling, respreading,
and grading of the topsoil during landscaping of the final project based
on an assumed 1.5 feet of topsoil to be stripped.
-4-

Obtaining Fill
The cost of fill material delivered to the site is a major expense
that is influenced by a number of variables. Where the fill is obtained,
how it is excavated, and the method of hauling all influence the costs.
Because many flood plain regulations prohibit the aggravation of upstream
and downstream flood problems, the filling in of a flood plain must pre-
serve the natural storage and the carrying capacity of the stream. This
is frequently done by cutting and filling in the flood plain. Such an
approach makes good quality, homogeneous fill material readily available
at the site to be filled. Other sources of good quality fill would be
from large excavation projects -- foundations for major structures -- or
from borrow pits. In some environments the borrow pit will become a
lake which has secondary development benefits.
With respect to hauling, two cost estimates are made. The first
estimate assumes the hauling of the fill material on public roads. In
this situation the fill must be placed in trucks and hauled to the project
site. This would normally require a shovel-type machine at the excavat-
ing site. Many factors must be considered in determining the type and
size of machinery to be used at a particular job. This study will assume
bulldozers and front-end loaders for excavation machinery.
The second estimate assumes only on-site hauling. Hence,
excavation will be in the vicinity of the fill area. In such situations,
scrapers will be used for fill excavation and on-site hauling. For pur-
poses of this report, when the distance of haul is greater than 4,500
feet it is assumed that hauling must be over public road. When the
haul distance is less than 4,500 feet, on-site hauling is assumed.
I-5
4 5-li

Placing and Compacting
The method of placement and compaction is assumed to consist
of spreading the dumped material by dozer in 9" lifts and compaction of
each lift by sheeps-foot roller. Compaction is assumed to be at least
to 90% density for this study.
Providing Compensatory Storage
One factor that has a significant effect on the cost of filling a
flood plain is a requirement to provide compensatory storage. In many
areas, compensatory storage is required to replace the volume of flood-
water storage that will be eliminated by the flood plain fill.
This storage can be provided in retention or detention reservoirs.
But the compensatory storage must have the same effect on the flood
event that the replaced natural storage had. Compensatory storage that
fills during the first period of the flood event will have little effect on
the crest stages. Thus such storage must be designed to handle this
problem by pumping or through specially designed inlet and outlet struc-
tures. Such facilities increase the operating and maintenance costs of
the compensatory storage.
The cost of land is a major element in determining the cost of
providing compensatory storage. For purposes of this report, the cost
per acre in small urban areas is estimated to be $2,000, in moderate
urban areas $5,000, and in metropolitan areas $10,000. If land costs
are known for a particular area, these should be used.
It will be assumed that a retention or detention reservoir will be
used for compensatory storage and also that such a facility will occupy
-6-
- - . . .. . . t,; -, •

20 percent of the land area to be tilled and developed. Thus t .SO
acre development will require 10 acre:: for compensatory storaqe.
The construction cost of compensatory storage will consist of
excavation, site preparation, and necessary structural considerations.
It is assumed that the cost of excavation is included with the costs
of obtaining fill.
-7-
1 .III l I I I I I I l

III. COST IEXPERIENCI
The costs presented in this section are based on an ENR index
of 2200 and were developed from recent estimated costs and actual bids
on construction projects that are analogous to the filling of flood plains.
Bid tabulations for these projects are presented in the Appendix.
This section presents unit costs for each of the factors discussed
in Section II. Also presented are the assumptions upon which these costs
are based and how much the costs will vary based on different assump-
tions. The tables in this section summarize the information to expedite
the estimating of costs under various conditions.
Clearing and Grubbing
Norm unit cost - $1,001/acre
Norm conditions clearing, grubbing and chipping of vegetationconsisting of medium sized trees and some brush.
Modifying conditions - no trees or brush, reduce by 100 percent- large trees or heavy brush, increase by
20 percent
Stripping Topsoil
Norm unit cost - $5,800/acre
Norm conditions - 1.5 feet depth must be stripped, costs includestripping, stockpiling, replacing and grading to landscapefinished project.
Modifying conditions - if 2.0 feet must be stripped increase by33 percent
- if 3.5 feet must be stripped increase by135 percent
-8-

Obtdining Fill
Road Haul Necessary
Norm unit costs - $2.90/cubic yard
Norm conditions - 5 mile haul distance, bulk factor of 1.4,clay-type material.
Modifying conditions - haul distance for each mile less than5 miles subtract $0.25/cubic yard.
On-Site Haul
Norm unit cost - $1.20/cubic yard
: INorm conditions - clay-type material, 1500 feet haul distance
Modifying conditions - longer haul, increase by $0.18 for eachadditional 1,000 feet haul distance up to 4,500 feet haul.
Placing and Compacting Fill
Norm unit cost - $0.80/cubic yard
Norm conditions - clay-type material, 90% modified proctor density
Providing Compensatory Storage
Norm unit cost - $3,150/acre-foot
Norm conditions - excavation charged to the filling price- includes construction costs of structures.
Cost Tables
To calculate the cost of filling in a flood plain, one must first esti-
mate the cost of clearing, grubbing and stripping of topsoil. Table 1 pre-
sents the costs per acre for these elements for a variety of conditions.
-9-

Table 1: Cost of Clearing, Grubbing and Stripping of Topsoil Priorto Filling of Flood Plains in Dollars Per Acre
Clearing and Grubbing Stripping of Topsoil
norm no vegetation thick vegetation
$ 6,800 $ 5,800 $ 7,000 norm(1.5 ft. to be stripped)
$ 4,900 $ 3,900 $ 5,100 1.0 ft. to be stripped
$ 8,700 $ 7,700 $ 8,900 2.0 ft. to be stripped$14,550 $13,550 $14,750 3.5 ft. to be stripped
Table 2 tabulates the cost of obtaining fill, placing it in the
flood plain, and compacting it for depths ranging from 2 feet to 10 feet.
In Table 3, the cost of compensatory storage in dollars per acre of
flood plain is presented for depths of fill ranging from 2 feet to 10 feet.
To establish the cost of planned filling of a flood plain, one
simply extracts from the three tables the costs associated with a given
situation. Tn i'lustrate, assume that a flood plainsite has thick brush
and contains 2.0 feet of topsoil that must be stripped; the fill must be
moved on roads 4 miles and will have an average depth of 6 feet; and
the site is located in a metropolitan area. The costs of filling in one
acre of flood plain in this example will be:
from Table 1 $ 8,909
Table 2 33,4nl
Tab le 146' 9
$56,900/'acre
-1---

Table 2: Unit Cost for Obtaining rill, Placinq it in Flood Plainsand Compactinq it In Dollamrs Per Acre
Type of Operation Average Depth of Fill (Ft.)2 4 6 8 10
On Site Haul
Norm (1500' haul) 6,450 12,900 19,350 25,800 32,300
2500' haul 7,000 14,100 21,100 28,100 35,200
3500' haul 7,600 15,200 22,800 30,500 38,100
4500' haul 8,200 16,400 24,600 32,800 41,000
Road Haul
Norm (5 mile haul) 11,900 23,900 35,800 47,750 59,700
4 mile haul 11,100 22,300 33,400 44,500 55,700
3 mile haul 10,300 20,650 31,000 41,300 51,600
2 mile haul 9,500 19,000 28,600 38,100 47,600
1 mile haul 8,700 17,400 26,100 34,800 43,600
Thus, the planned filling of a flood plain with the preceeding
characteristics so as to raise development sites above the 100-year
flood will cost $56,900 per acre. Similar estimates can be gotten
from the tables for a range of conditions. Within the context of these
tables the lowest cost of filling a flood plain would be $17,050 per acre
and the highest cost would be $101,650 per acre.
-11-

Table 3: Cost of Compensatory StorageDollars Per Acre of Flood Plain Filled
Cost of Land Average Depth of Fill (ft.)
2 4 8 10
$ 2,000/acre 0 b,700 13,000 19,300 25,600
$ 5,000/acre 0 7,300 13,600 19,900 26,200
$10,000/acre n 8,300 !4,o00 20,900 27,200
NOTE: It is assumed fill will be placed to a height of 2 feet abovethe 100-year design flood elevation.
-12-
-t-

IV. OTHER ENVIRONMENTAL IMPACTS
The filling in of flood plains has a potential impact on the avail-
ability of groundwater, the availability of natural flood plain storage,
and on the diversity of natural ecosystems. Such impacts cannot always
be stated in terms of specific economic effects. Nevertheless, it is
> possible to identify potential impacts and to suggest what the economic
impacts might be. Each of these Impacts are discussed briefly in the
section and preliminary economic values have been assigned to them.
Impact on Groundwater
The filling of flood plains can diminish the availability of ground-
water. In many cases, this impact is ignored. Northeastern Illinois
can be used to illustrate the potential damage fill in flood plains could
cause to a groundwater supply. Many of the flood plains in northeastern
Illinois are underlain by surficlal sand and gravel aquifers. These surfi-
cial sand and gravel deposits serve as prime recharge areas for what is
termed the shallow aquifers. Such flood plains are prime recharge areas
for several reasons. First, the relatively high permeability, of the sand
and gravel deposits allows water to infiltrate to shallow aquifers. Second,
a source of water for recharge, the perennial stream in the flood plain, is
available. The shallow aquifers are defined as the sand and gravel and
dolomite aquifers combined. The shallow aquifers are the major source
of groundwater for northeastern Illinois. In Du Page County, the flood-
plains of the East and West Branches of the Du Page River and Salt Creek
are the prime natural recharge areas. In 1972, 39.7 mgd or 70 percent
of the total pumpage of 56.6 mgd was derived from the shallow aquifers.
Potential yield of the shallow aquifers is 42.0 mgd, 30 mgd from the
glacial drift and 39.0 mgd from the dolomite. The filling of a flood plain
-13-
OWN

to gain development sites will decrease the recharge capability of
the flood plain.
Natural recharge rates in flood plains underlain by sand and gravel
have considerably higher recharge rates than the surrounding uplands
where the uplands are underlain by more impermeable types of glacial
drift. Such a geologic setting is frequently the case in Northeastern
Illinois. For example, in Du Page County the recharge rate for the
glacial aquifer underlying the flood plains of the East Branch and West
Branch of the Du Page River ranges as high as 1,000,000 gpd/mi 2 com-
pared to an average of 140,000 gpd/mi 2 on the uplands.
The reduction of natural recharge and potential artificial recharge
sites by filling of flood plains will have an impact on groundwater avail-
ability. Given the present pumpage rates in major metropolitan areas,
the preservation of flood plains as recharge areas for the shallow aquifers
is of great importance.
The Value of Natural Flood Plain Storage
Fill in a flood plain reduces the ability of the flood plain to store
floodwaters. This issue has been addressed under the heading of com-
pensatory storage. In heavily urbanized areas, conflicts between human
occupance and floodwater storage exists on flood plains. In such in-
stances alternative storage space for the floodwater must be provided.
These costs are presented in Table 4.
-14-

Table 4: Construction Costs for Floodwater Storage Projects
Storage Construction Cost PerProject Acre-Ft. Cost Acre-Foot
Hillsides
Storm Retention 75 $ 693,798 $ 9,250
Kingery West 2- / 90 $ 453,115 $ 5,034
SCS Estimates
Com. Edison Site 380 $1,614,000 $ 4,250
RR Yard Site 440 $1,983,000 $ 4,506
Addison Creek Estimates 4
Lake Street Site 130 $2,320,000 $17,850
RR Avenue Site 54 $ 775,000 $14,350
Cemetery Site 81 $1,085,000 $13,400
i/ - Metropolitan Sanitary District of Chicago Project-Bid Fall 1974.
- Du Page County Forest Preserve ?roject-Bid Summer 1974.
3/ - Soil Conservation Service Report-Engineers Estimate Fall 1974.
- Bauer Engineering, Inc. Report for Illinois Department of Trans-portation-Engineer' s Estimate.
.- 15-

Impacts on Floodplain Ecosystems
The filling of a floodplain often may replace the natural flood-
plain ecosystems. Estimates of value arc at best dependent upon the
prevailing value system of the society, which is in part subjective.
Even in the physical structures we value in our historical context (e.g.
-- a picturesque courthouse in the town square), meaningful estimates
are difficult; in the world of nature, they rarely have been attempted.
Conservationists and ecologists often assume that any natural area
of exceptional value in their eyes should also seem priceless to all others
involved in land use decisions. As a first approach at standardizing
methods of estimating economic value for different natural ecosystems,
Howard Odum has suggested that the common energy component, the cal-
orie, be used as a basis for comparison. Any given ecosystem can be
viewed as a model constructed of certain components (i.e. -- producers,
consumers, decomposers) through which energy flows and is converted in
form. At each step in the process some energy is lost as heat, some
energy is stored, and some is used to decrease the entropy of the system.
Odum arbitrarily set a value of $1.00 per 10,)00 kilo-calories. This value,
it should be noted, is high -- more than double that of electric power in
1974 ($0.465) and more than sixteen times that of natural gas ($0.06).
Odum then measured this expensive energy by equating 4.5 kilo-calories
to one gram of dry weight in terrestrial plants. By estimating 10 million
grams of biomass produced per acre of cat-tail marsh, a value of $4,500
per acre was put on the ecosystem. The replacement cost for a 100-year
period at 7.5 percent interest would be $455,000 per acre with an annual
loss of $34,125 per acre.
The value thus assigned to the energy produced by vegetation is
impressive. Although many might judge it excessive, it does constitute
-16-

a first approximation of an answer to a problem that will have to be dealt
with in the modern world. For centuries the most common method of valu-
ing ecosystems was simple application of current market values of the
land in terms of dollars. For example, government agencies, such as
a park district, sets a value on an ecosystem when the district purchases
a site of natural beauty to preserve it. This value almost always repre-
sents the cost of the land alone; the cost of replacing the ecosystems
is not considered. But valuation methods that were acceptable half a
century ago, or even twenty years ago, are no longer adequate to satisfy
the current popular concern over the environment's impress on our lives.
As public decision-makers grapple with such intangibles as beauty and
peace of mind, it surely will be seen that no one standard dollar-equivalent
(be it Odum's or another's) will fairly serve all ecosystems. Even simi-
lar ecosystems, differently located, will be found to have different values.
And the scientific literature already shows there are cases where artificial
intervention actually encourages a healthier ecosystem than the one that
originally existed in nature. Considering the mvltitude of difficulties
blocking the way to reasonable valuation of ecosystems, it is encour-
aging to know that at least a crude basis for a mathematical model has
been laid. If this report stimulates efforts toward refinement of the
model, the report writers will be content.
-17-
......

V. LEGAL ASPECTS OF THE FILLING IN OF FLOOD PLAIN LAND
The filling in of flood plain land is a generally accepted
method of protecting structural land uses from the damages associated
with flood water. It serves to raise buildings and other structures
above the elevation that the flood waters could reasonably be expected
to reach. One of the major consequences of filling is a reduction of
the capacity of the flood plain to store flood water. This then often
leads to increased flood stages elsewhere along the stream.
Because filling is most commonly associated with flood plain
and wetland areas, almost by definition, it is an activity that is often
subject to regulation by flood plain management ordinances. When it
is regulated, it has generally been done by the clauses of ordinances
which prohibit any activity which could possibly have adverse effects
on the storage capacity of the flood plain. This is all well and good
as far as preservation of the storage capacity function of the flood
plain is concerned. There are, however, other major functions and
values of the flood plain and wetland ecosystems which also need to
be protected. The function of groundwater recharge is of major impor-
tance, particularly in parts of the country that depend on groundwater
for their municipal and private water supplies. The value of the natural flora
ci.:! f-1r'a of these ecosystems is also significant, and as other portions
of this report indicate, is beginning to be able to be quantified. This
is, of course, of great significance for cost-benefit analysis. It is
important, however, that these values are considered in the evaluation of
proposed land use changes, whether quantitatively or otherwise.
An examination of several flood plain ordinances and court deci-
slons will illustrate the various approaches to flood plain management,
and different ways of regulating fill.
-18-
A

The Division of Water Resources of the Illinois Department of
Transportation has recently enacted regulations based on Its authority
to "define flood plains and to establish a permit procedure for regula-
ting construction within the such defined flood plains". Rule 2.3
states that no construction or changes in the flood plain are lawful
without a permit from the Department. Permits are ordinarily granted
for construction which does not have significant flood damage potential
and which will not significantly increase present or future flood damages.
No activity will be permitted which will cause significant increases in
flood stage or velocity. This ordinance does not specifically refer to
the activity of filling, but the above requirements for a permit make it
implicit that where filling may cause increases in flood stages or velo-
city, it will not be permitted. Compensatory storage, which provides
alternative flood water storage where filling is occurring, will presuma-
bly be permitted when it can be shown that it will adequately compensate
for the area being filled. The ordinance is clearly concerned with the
function of flood water storage and flood flows, but it neglects the other
values of flood plains and wetlands.
The model ordinance prepared by the Illinois Department of Local
Government Affairs takes a similar approach. It generally prohibits any
use which could adversely affect the capacity of drainage channels of
floodways. Any use which would require fill would have to satisfy the
conditions for a special use permit, which states that no use, including
fill, will be allowed which, alone or in combination with existing or
future uses, unduly affects the capacity of a floodway or increases flood
heights. Specifically regarding fill, Rule 4.32 (1) states that any fill
must be shown to have a beneficial purpose, and the amount should be
no more than necessary to achieve that purpose. There is no specific
requirement for compensatory storage. No reference is made to the value
of the flood plain and wetland ecosystem being preserved in their natural
states.
-19-

The Suggested Flood Damage Prevention Ordinance prepared by
the Northeastern Illinois Planning Commission (NIPC) for local govern-
ments permits occupation only of the floodway fringe under certain speci-
fied conditions. The principal restriction is that any volume of space
which is occupied by a structure or fill must be compensated for and
balanced by at least an equal volume of excavation taken from below
flood base elevation. Thus, this ordinance specifically requires com-
pensatory storage when the natural capacity of the flood plain is being
infringed on. Several of the local governments in the region have
apparently adopted the principle of compensatory storage into their own
ordinances, for example, Downer's Grove, Lombard and McHenry County.
While this approach sets more stringent requirements for filling, the
concern is still limited to controlling the quantity and velocity of flood
water flow.
The flood plain regulation policies of Michigan, Minnesota and
Wisconsin take approaches similar to the Illinois ordinances. Emphasis
is placed on the capacity to store flood water without a view to the
broader implications of flood plain management. The State of Michigan's
Subdivision Control Act of 1967 (P.A. 288), in Section 194, prohibits
construction in the flood plain district without approval of the Water
Resource Commission. Alteration may be permitted if the land's drainage
capacity will not be adversely affected. P.A. 167 authorizes the Water
Resource Commission to regulate alterations of natural and/or present
water courses of all rivers and streams to assure that the channels and
floodways are kept free of interferences or obstructions which would
cause any undue restriction of the capacity of the floodway. It can be
inferred from the wording of the provision that filling which would reduce
the capacity of the floodway to store and discharge flood water would
not be allowed without some action which would compensate for the de-
creased capacity.
-20-

The Sample Flood Plain Zoning Ordinance for Local Units of
Government, prepared by the Minnesota Department of Natural Re-
sources, states that ercroevchments on the flood plain shall not cause
an increase in the flood stage in any qiven reach of greater than 0.5
foot. ill will be allowed in the floodway under a conditional use
permit. Criteria are that the fill must have a proven beneficial purpose,
and that the amount is no more than necessary to achieve that purpose.
No mention is made of compensatory storage.
The Model Ordinance associated with Wisconsin's Flood Plain
Management Program prohibits any fill, obstruction, etc.. that acting
alone or in combination with existing or future similar works could
adversely effect the efficiency of the capacity of the floodway. While
not specifically requiring compensatory storage, this provision seems to
imply that if it would provide acceptable storage capacity, it might
permit the placing of fill in the floodway. As with the other ordinances
with this type of regulation, the final decision on the legality of filling
would rest with the local officials who administer the ordinances, and,
perhaps, the judicial system which may be called upon to interpret them.
A different approach toward flood plain management is being taken
in DuPage County, Illinois. The ordinance now in effect there is based
upon a broader concept of the importance of flood plains and wetlands.
Rather than seeing the problems of flooding from a purely engineering
viewpoint, it looks at flooding from the perspective of land use and the
natural suitability of the environment for different uses. The following
criteria and purposes of the ordinance express the philosophy behind it:
a. To consider flooding and drainage problems as space
allocation or land use problems and to the degree
practicable allocate the natural storage space --
flood plains and wetlands -- for this purpose.
-21-
Li

b. To use flood plains and wetlands for land usepurposes which are compatible with their physical
conditions thereby preventing the creation of new
flood and drainage problems.
c. To avoid the increase of upstream and downstream
flood risks by preventing increased runoff and a re-
distribution of flood waters.
d. To preserve and possibly enhance the quantity of
groundwater supplies by maintaining open and undis-
turbed prime natural groundwater recharge areas.
e. To preserve and possibly enhance the quality of
ground and surface water resources by helping to
control excess infiltration into sanitary sewer systems
and by preventing the location of septic systems and
mixed fills in unfavorable physical environments.
f. To preserve distinctive flood plain and wetland flora
and fauna.
g. To consider flood plain and wetland areas in density
consideration in zoning and subdivision determinations.
h. To lessen or avoid the hazards to persons and damage
to property resulting from the accumulation or runoff
of storm or flood waters, as essential for the health,
safety and general welfare of the people of DuPage
County, in accordance with Chapter 34, Section 3151
of the Illinois Revised Statutes.
-22-
... ..

In addition to being oriented to prevent hazards to life or property by
appropriating the necessary storage area on the flood plain, the ordinance
is concerned with protecting the recharge capacity of flood plains and
wetlands, and also their distinctive flora and fauna. The philosophy is
to utilize such lands in the manner most in conformity with their natural
capabilities.
This approach to flood plain management has been given validity
by recent court decisions. On March 29, 1974 the Supreme Court of
Illinois ruled in Templeton vs. Huss et.al. ruled that no property owner
has the right to modify his property to the extent that such modification
would increase the flow of surface waters onto another's property beyond
a point which could be considered reasonable. The opinion stated:
"It is obvious, however, that the natural drainage pattern
may be substantially altered by surface and subsurface
changes which interfere with the natural seepage of water
into the soil of the dominant estate.., the principle that
would prevent unreasonable changes in the natural lateral
drainage flow should also apply, in our opinion, to a
change which would unreasonably interfere with drainage
through natural seepage.
"The question which must be confronted is whether the
increased flow of surface waters from the land of the
defendants to that of the plaintiff, regardless of whether
it was caused by diversion from another watershed, the
installation of septic tanks, the grading and paving of
streets, or the construction of houses, basements and
appurtenances, was beyond a range consistent with the
policy of reasonableness of use which led initially to the
-23-

good-husbandry exception. The judgment of the appellate
court is reversed and the case remanded to the circuit
court of Mason County for proceedings consistent with
the views here expressed."
The question of what is considered reasonable is something that must
be determined individually on a case-by-case basis. Every situation
is unique. The court's opinion does, however, articulate a general
doctrine: Namely, that the degree of disturbance or improvement of a
parcel of land must not be so great that the environmental consequences
would be excessive. Such a doctrine shows more respect for the integrity
of the natural landscape than has generally been shown in the past.
The Supreme Court of Wisconsin has given specific recognition
to the value of flood plain land and wetlands, and declared it in the
public interest to protect such land from encroachment. In Tust vs.
Marinette County (56 Wis. 2d 7), decided October 31, 1972, the
Court observed:
An owner of land has no absolute and unlimited right to
change the essential natural character of his land so as
to use it for a purpose for which it was unsuited in its
natural state and which injures the rights of others.
~and
In the instant case we have a restriction on the use of
a citizen's property, not to secure a benefit for the
public, but to prevent a harm from the change in the
natural character of the citizen's property.
-24-

The Wisconsin Supreme Court decision also refers to an opinion of
the Supreme judicial Court of Massachusetts:
"A recent case sustaining the validity of a zoning ordinance
establishing a floodplain district is Turnpike Realty Co. v. Town
of Dedham (Mass. 1972), 284 N.E. 2d 891. The court held the
validity of the ordinance was supported by valid considerations of
public welfare, the conservation of 'natural conditions, wildlife and
open spaces.' The ordinance provided that lands which were subject
to seasonal or periodic flooding could not be used for residences or
other purposes in such a manner as to endanger the health, safety
or occupancy thereof and prohibited the erection of structures or
buildings which required land to be filled. This case is analogous
to the Instant facts. The ordinance had a public purpose to preserve
the natural conditions of the area. No change was allowed which
would injure the purposes sought to be preserved and through the
special-permit technique, particular land within the zoning district
could be excepted from the restrictions."
The Wisconsin opinion, and the Massachusetts opinion referred
to above, give legal protection to wetlands and flood plain land. They
make their preservation a valid public objective. Such legal reasoning
makes it imperative that the environmental costs of filling flood plain
and wetland areas be carefully considered in decisions regarding land
use activities in these areas.
-25-

VI. REFERENCES
egionloI Waitvr Supply Report, technlcdlI report No. 8, NIP( , 1974.
2. Groundwater Recharge and Runoff in Illinois, Walton, Illinois
Water Survey, 1965.
3. Groundwater Resources of Du Page County, Illinois, Zeizel, et.al.,1962, Illinois Water Survey, 1962.
4. The Future of Groundwater Resources in Du Page County, Ground-water, 1974.
5. Artificial Groundwater Recharge Investigations in NE Illinois,McDonald Sasman, Groundwater, 1967.
6. Living With a River in Suburbia, a report on Salt Creek to the
Du Page County Forest Preserve District, Bauer Engineering, Inc.1974.
7. Report in preparation on Addison Creek Soil Conservation Service,
Lisle, Illinois.
8. A Flood Control Plan for Addison Creek, Bauer Engineering, Inc. 1975.
9. Tunnel and Reservoir Plan-Surface Storage Location Alternatives, a
report to the Metropolitan Sanitary District of Chicago, HarzaEngineering Company, 1973.
10. Environment, Power, and Society, Odum, Wiley Intersclence, 1971.
11. Rules and Regulations, Illinois Department of Transportation, Divisionof Water Resources, Rule 1.1, 1975.
12. Suggested Flood Plain Zoning Ordinance with Commentary, State of
Illinois, Department of Local Government Affairs, Sections 4.31 and4.32, April, 1974.
13. Suggested Flood Damage Prevention Ordinance with CommentaryNortheastern Illinois Planning Commission, p. it, revised December,1973.
14. Du Page County Zoning Ordinanace, Section IV, J, 2, October, 1974.
-26-
41

(D0 1-. 0D0QU) -4 0 C- 0Dbo00DC>-4 C 0o 0 cl %Co 0 CD 00 r. l) C 0 D 0C)0C00 eq Rn 0 0 co G
;~ ;C -: -;r ': C;c 0;. ; ; , " ; C C l C
CD C) 40 -4'-4 ( C C C.J CJ -E .4C ) ) CI CU3)
0D 0 u0 00 00 0 C) C nq DL o L) 0 0lCa, 0D (D 0rDC (A00) 0 w'D- L -0 01
0~~/ .-. cn(~ D )i'
C) C) CC) -D m C l -4(%J U DO
to 0 . ,toi
4
o* C)C)C
U) (nf~lf ~ L .Cl ) f
C~- U).. U, q c 0
Ow0 C
0~ 0.4~8 -4 u
C:
0 OC
U) M 0 L
AJ 0 &0
N -1
CVu. L
AA-

0 0 0 0 0 0 0 CD 00C ) > t
M C) OD N ) 0) 0) M ) DOC o m 00o C0) mc) ) 0 W M C) 00(00
0
to) C. 0 m) -W C ) 00 r. 0. -
co 0 to en ('v) -W ) (D 00:1 C
*~~~~E En~0 0 ) 1-4 0 I-- (
U)C 0 CD 0 C) w. r- n m -4 v)
-t 'U) Cdo co LI
o41
o
laU
0 I0. M
U)
'4.
46 4 oLO
> U to0 'U a~ 000 O oI.j Ln ZI 0~ to
*1 a

PREVAILING UNIT COSTSFOR
PLACING RESIDENTIAL FILLIN THE
WESTERN UNITED STATES
March 1975
* GENNIS, GRAY £JUSTICE, ENGINEERS1812 - 14.th StreetSacramento, CA 95814.

TABLE OF CONTENTS
I. INTRODUCTION
Objectives
Scope
I1. METHOD OF APPROACH
Data Collection
III. FINDINGS
Economy of ScaleHaul Costs
Royalty Costs
IV. CONCLUSIONS
Unit NomographSample Unit Cost Determinations Using
the Unit Nomograph
. . . . .I1l . . . . . . . l " . .. . . .. 1 I

K I LIST OF FIGURES
Figqure N4o.
1 Study Area Boundaries
.42 Form Used in Compiling Unit Cost Data
3 Sample Economy of Scale Graph
4 Unit Cost Nomograph
1 5 Sample Unit Cost Determinations

LIST OF TABLES
Table No.
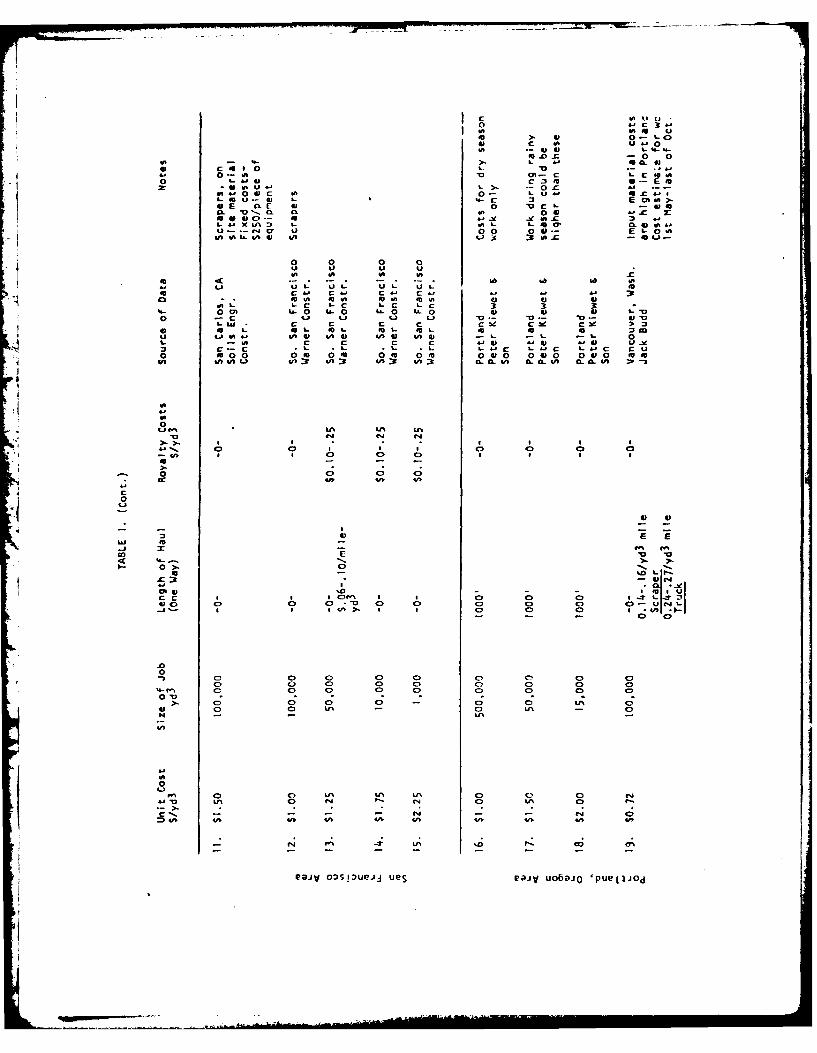
I Listing of Cost Information
2 Adjusted Unit Costs for Study Sub-areas
3 Sub-area Unit Cost Rankings
Haul Rates
*1 . II I I

I. INTRODUCTION
The firm of Gennis, Gray & Justice, Engineers, Sacramento, California, was
retained by the Hydrologic Engineering Center of the United States Army
Corps of Engineers to study prevailing unit costs for placing residential
fill in the western United States. This study was conducted by John C. Scroggs
and Rudy D. Michon under the general direction of Ivan F. Gennis, RCE8694.
STUDY OBJECTIVES
The purpose of this study is to aid administrators of the Corps of Engineer's
Flood Plain Information Programs in determining the reasonableness of unit
costs submitted for residential fill work. Prevailing unit costs were to be
obtained from contractors with work experience in placing residential fill.
Total quantity of fill material, haul distance, royalty costs, and prevailing
labor and equipment rates were to be analyzed with respect to unit fill costs.
SCOPE
This study is limited in scope to areas within the Western Continental
United States. Specifically, these areas include: California, Oregon,
Washington, and parts of Arizona and Utah. Prevailing unit costs developed
in this study could also be applied to sections of New Mexico, Nevada, and
Idaho. A graphical presentation of the study scope is presented in Figure 1.
Unit cost estimates received from contractors and cost engineers were based
on prevailing rates in effect during the 1974 construction season. An
Engineering News Record Construction Cost Index value of 2072 is therefore
considered typical for the unit costs included in this study.
II

S-CITIES SHOWN DENOTE LOCATIONSI. FROM WHICH DATA WAS OBTAINED4~Z-4
SANAL
) /
FRANCISCO * "r
LOS ANGELES0/
SAN DIEG *PHOENIXI, E Xc
IB
STUDY AREA BOUNDARIES

II. METHOD OF APPROACH
DATA COLLECTION
In general, unit cost information was obtained by telephone conversations
with contractors in the western United States study area. In some cases,
personal interviews and written correspondence also were used to obtain the
necessary unit cost data. Cost engineers from local and district offices
of the U. S. Army Corps of Engineers were also contacted to determine unit
fill costs used in engineering estimates. Whenever possible, contractors
and cost engineers were asked to quote unit costs that were bid or
estimated for a particular residential fill job. The conditions of each
job; location, haul distance, equipment and labor costs, royalty costs,
size of job, and any unique features were also discussed in conjunction with
the unit fill cost estimates.
In virtually all discussions with contractors and cost engineers, economy
of scale and the haul distance from the borrow area to the job site were two
of the most important factors affecting unit costs. To determine the
sensitivity of cost for these parameters, those interviewed were first asked
to estimate unit costs for residential fill jobs with haul distances of less
than 1,000 feet and job sizes ranging from 1,000 cubic yards to over one million
cubic yards. Estimates were then obtained for the additional costs corresponding
to haul distances greater than 1,000 feet. The form used in compiling cost
related data from telephone conversations and interviews is presented in
Figure 2.
Table 1 is a summary of the data collected for the residential fill cost study.
...

FORM USED IN COMPIL ING UNIT COST DATA
Contracting Firm___________ _______
K ~ ~~ Location _______________
Discussed Unit Cost Data Withlli_ _ _ _ __ _ _ _
Telephone Number__________ _______
Size of Job, cu. yd IHaul Distance, ff' (Miles)______ _____
Haul Rate, 1/cu.yd.-,00017
K Borrow Material Costs, S/cu.yd.(Royalty Costs)
Labor Rates, $/hr __
Equipment Rotes, $/hr. ___
Fill ConditionsWater Content%
Compaction % ___
Surface ReliefS ite__________________
Borrow Area __________ ______ _ _
Unit Cost, ,#/cu.yd._________________
NoIs
FIGURE 2

V 0 0 0
Z- 'A
W.- - -. 0.0 0. 416.A
0 >If M.-E- 3:l 0 "n C)
0- 0 '. 14) to 0 000C)
zO u L E"A c-
.3 L L: ~L40 4 01 M4 L: tj. Li3
v 1uJ 0i UJ 4Jw 414 0 *E * .?- c - - ~ 0 45 0 0 0 001
0~ ~ 44. 44 1- 40 4.3 q4-3 Li ci L04 0 m0 m 0 Oft4-) .- .- x U L
4D VV rVI IVI -- L4 4-1 C141 LV4.'
0
x W 00cc ccJ '
La m
C-1 W 0
C2 0 0 0 C 0 v ) C- 0 0C E 0D
a oI 0 a> r4 0 -4 aw- 0 0: 0, 0, 0 0 0 0 0 0
C) 0 4 i'a o 0-
01> a C) Ct' C) C' (3 C>' C' C- -
N
i
0
i ~ C) 0C 0 U 0 a r4 0 It
e~av sa(06uv Sol eovV XluaoL4d eeiv 4-S
......
0 -. 0 -C -0 0
0 10 ow :.m 3
o 1O In0. ..4 0--UIn 0 04- LC" x
0- r 0 c
'aU -4 I- 4 .-143E "D ( 43 0' onC' 0 2so 0 w ) . 0. -if0 -. 6- 61 X LA =1L LEO-CL''w0--N 0 0 043' EL
E)U 'S-( to o L3. .. L.
0 0 0 0
fjU L. U L U U41 'C "' r- - Uc"
da C. wk - C0 to4 4 m4 04 31L 4.-C IC L Lc X0. 04 L.-0 64-0 64.-0 14.0 43 W3 4 -
0 C r t LP LI CLI a.- *.-. 'a.- 43'0LW. C c c C c) Cd c ~ -Z c34 >
S. 41r 1 L E 1.4 14
0 o 00 0 :6 3t 0 :m 0 m 0430 043 0 043,0 14M
IIf
10
4n
0 C) C
cca , M a
0CC
.c3
L. r -be
-i I .ol C) Q
.0-)0 0 0D 0 n 0C0C> C) 0 0 C) 0 0 0
'4-- en a o 0 0 01 C 0 0
). 0o 0 C) 0 - 0 0A 4D4
43 0 0 % - 0. L^) -Inn
0LI L D -
0 C) 4.4- U) U 0 C C!
eajv 0~s iuej4 ues ~ o~~'u~j~

4. L I
CL u CIL a al OaC
0 L. ID L u u L
~~~ 4AU b ) n
0c c c cO C0
04 0 0 0-L 0- Lv 0i Li 0b a 0 0
1 0 L . 4 L > b eVa L i i V
U 0-a - "m -r. - -Y Je_ Y_ 3
0 0* QL rL 0. 0* eu5 0 u mL to ~ cc a c
oo _j_
0 0 0 0 C) 0 m ) 0 0o t' 0 01J) L, ES S SL a-CS I 1 .1 IL S
o> C
oj C)' A o t
CIDO Li~ L1
0f- Cm.c 3t- -v 0 O L c) 0 OI 0 0
04 - 0 c) ML-
01W r- 0) 7- - - - C- 00aQCICf c) C0 0) 0. 03 4 CC 10 0a
0 0 >. C1 0 0"- Lr -. C 0 0 C0
-o0
D 0 C0 0 0) 0) C 0) C0 0
-U 0 a C3 0 0) 0) C 0 C C>Ci> C0 0 n v% c3 C% a' Cm U 0 L^
DY- Ln - V% LA tA
In
0
S 0 0 C' 0 0 0) 0) 0 0 0Int v, 4^ In ^V VI 4^I q^ In4^I
0 -m 7 A *
eaj uo5~.io 'Pue(IOd aV4l 'A! ae I S

0
ICU. 0L I L
inn
I , 4, 0, 4 0 )
a.i 41 i L. a ~ .,.c 0 c
o vM u~ m> 0~ a0 g o Li -aa
0 c00 40u c , L E LE LE 0
o -
9, A 9- 0 2
-~ 0
0
CI -0
0 00 0 mID 0 L > C
00) O0 0 0 0p 0) 00C 00 0 C) C0 0
C,-t C) 0 C 0 0C 0C> 0 00 0, C 0 C 0
8 C. 0 0 0 0 0 -.0 UL - LA% LA;n
L00^C 94 00 L
C 0 0 0 n.
&'aaen m~ H av~e

4-.1- >
U, 4.j 0 0 o0.3 bw "4 U4 .- g
i- O 0 - 0 O
Ii. - V 0
0 00Cl :E C o 1 . L
< qf v u L) l 0 ww 0:1- 0 >- 0
0 0 1- - - -L. CO C0 0 C-L L. 'A ON 'To .;i -- i 0 * WL
W in in 'i r c >a CL E- E E eu 44 1f-! 0.- 0.- In 'A Wi0 10
"11 uu u D uV u 'a LL %-L U v c
le ~ ~ ~ ~ m. ui. n cmX:a u us u ,-
I0
USA
Lii0
0
4 CD
:3 0ov ) Dl t
-a 'D 0 L%4
us- C:) U ' C - :.. s
0 0 01 0 0 0 0 30
0 0 r- 0 00
0 C0 -f 0 C, 0 0-%
00
0) 0 C)l's U 0 0 u's 0)C
> . -w '0C. CLAs 0LN LAI-
LAs .
5up0~iu so ouueJe 6!Is~I~u ~ ' ~~e~
0I IJJe .~4.O LJJ~D 1JUt2~

0
I I I I0 0 0 I
o 0 00 0 0 0
L: L 0 0 0
0 0-L 0 0 i 0%n0 0 0 0 0 0
0 c 0004) 0 0 C0 0V 0j 0vE 0L E0 0 0 0
0) m mv 0 L m 0 0 0 UL O 0 0 0 0& 'L.L -C - L L- U - 00 L-:
01 0 r- UI 0- v CL~ 0 a L vE u 0d 'a m g0 ) t 0 lo- Ml 00 1 - - 7 0 -
NA4 -j (A ki .1c " A c "
00
CD C. , a A 0 0L
0A 0 I I I I ~ I " (
0~
E~vouwie
L" l.

W -A n fil In i
0toC- ) - ) - -
1 4 j 6 1 61 4n 01610.t 0.a 0. 0. 0 - 0 0. 0
0U (1 CU 4M EU EU all al- U (U- M
w 0 a ) U 0 4):: Uw ) .- ) -- -- ) E-- 0d -- 0
u ~~ 0n I M4 0 A - C M MV
EU c-) I Lb * L S #AC LC LI LC L- L 0 00 c0 C-
'0 M~ 0 ~ co 0 M do 0 - 0 0
-'> . C1 1 ONU~ U 1 6C- CL CC C C C C
o Eu EUO EUL U EUa EU EUE ECEU)L C)~ d ~ C)! U U~I tl )I UL
En3
-v n 4-i 00 41' n O
41 UN C) I ('00 0 0uC 0 0 0 0 M 0 0
M I - CY I
0 0
4--10
o) 00 0 0 CC) C) 0 03C ) C
00 C- C>- -Eu - 0 -- -EU (- C7
* ) EN EC) I n En C En% ECD~ En En
N1- LA. UNC3C) '
L L
00
0) 0 0 0 0 000 0- -T 00CI 0 0o 0o 0
0 0 0; 0 0
0D 0%0 0 %0 %0 % 0.
4)~~~ej If)i 0 0 00 I)0 S

Ica to
CL CL Ix aIIl VI0. 4aI OM SO4 CL I ULo
IV 10 11 00 0 0.M 0 01 50 4 0. 10
o U UweU U to so UV--
i L2 C Cto
LI 0I a 0W:16 C'A*VItJ tI LI LC E c l CA ~ VI al4 in4 I
al ; a E0C 'DC r- 3 ~ E* ,(0;.. .m -~ -11 3i "1 3KLa
'I 0. 01 4A 04 6 60ob 00 UP0 01I3m< e a ~ 'ULI4 2eI 6 3e 60 60 6 W6 ~
* -0 - -cU2 I- In>I 031 w I 40b- 4.1 t 4 , L,. ,-
44C- ~ ~ ~ C C- C> > E L U 4 4
IA-O ZI0 0A 4AI UII0 IA3I IflLI .24 Z.lO.
40
LIO~ 0' .0.
'o - av 0 00 0-
o 10, L.>CCE C o C 00
v Op
0 0, 00 0 C) a 0 4 06 a 06- C,
4D a a a 0 - -0 0a > 0. 01> CL
CC 0 0 0 0 m V 0 0 0 0a ' 0 .
.5- -A $A -A LA PVI - - - --
.0oN 0( a oG
00 C 4,0 C G o4, 04
01 01 0v 0l 011 0^ 0o 0 o
asi0 0 09( 0e 0~j 0 0 0 0

C>- 0 .0
C.,~~- C,-1> U l
0 0,
L ~ # W~L L 00
6 * * L c 0 0 . U
a u I3 0 o 1.) 3,) U; L; CO,Dr :1 WI0 3 , U, VI 0, - u-
dc 31 :0 0
6j C m wC * 55 ~4.O aO 6j 41
0, Lo , Iwo oU 0 0041~~~4 :It1 4a ~ : 4 ~ ) ~
U'6
* 40 4 -
*l D, Cl'4i 1 L4>- j I I I 1 10 14 C a
0*- 0 00 0 0' 0 0- C0
00
li - Co
*L -- - E W
- m f me- me -u mcm j .1 Ul 'A
a- ~ ~ C 51 C)0410 4 4j£ 14£0) 0 L
L LL - L L. - . LLO 0 LI-- 0 04- 0 04- W u 14-11% 0 0 041-
0 £ - - 1U - - a1U 4U. -44, 0, fL- 0 or. 0 O >O 00 C
1 D. 0 0 L. 40 Co 0. 0 0) 0. :N C 0 0. 0 I-
01 0 lo-.. ) 0l 0n " 0 40 0 *, 0 0o 0a1 1 40 -3 *4- C) -,.DD C- -4 3
*- - - -40
.0
4-D 0 3 0 000>)- C* 0 0 0 Q 0 40 0 0
0> 0 0 0 0 0 03 0
4A - f in n in% m u%'1 i
0
m~ in in% c 0 0o 0 C
C. 0 0 0 0 a 0 0) 04#1 4^ U) 4 4ol h vh 4tl
cW C; - N4 14 LA inr'. P, c o c 40c o c

Ill. FINDINGS
Analysis of the data presented in Table I indicates that considerable
variability exists among study location estimates for residential fill jobs
of similar size and scope. For example, earthmoving and fill placing jobs
of 10,000 cubic yards, short haul length, and no royalty costs in
San Francisco would probably be bid at $1.75 to $1.90 per cubic yard.
In contrast, contractors in Salt Lake City would estimate the unit cost for
this job at approximately $0.80. Contractors in Phoenix or San Diego would
typically estimate $1.15 per cubic yard for the same job.
In addition to the disparity of unit costs between cities for similar
residential fill jobs of short haul length, considerable variability was
found in the haul costs used to estimate jobs with haul lengths greater than
1,000 feet. Contractors in Los Angeles, San Diego, Phoenix, and Sacramento
estimate haul costs per cubic yard at approximately $0.12 to $0.18 for a
one-mile haul distance. Haul cost estimates for the North California coast
(Eureka-Arcata area) were as much as ten times higher for the same haul
distance.
Based on the above mentioned findings, location within the western United
States was established as a significant cost parameter. For the purpose
of this study, unit cost data was therefore divided into the following
location sub-areas: Los Angeles, San Diego, San Francisco, Sacramento,
North California Coast (not including San Francisco), North Central
California (not including Sacramento), Phoenix, Salt Lake City, Portland,
Walla Walla and Eastern Washington, and Seattle. Earthmoving and fill
placing variables affecting unit costs such as economy of scale and haul
costs were evaluated separately for each sub-area.

ECONOMY OF SCALE ANALYSIS
The sensitivity of unit costs to economy of scale was analy7ed for each
sub-area by adjusting the data compiled in Table 1. All unit costs were
normalized for a maximum haul length of 1,000 feet consistent with the
prevailing haul rates in each sub-area. Royalty costs were subtracted from
these unit costs to arrive at a final adjusted unit cost dependent only on
sub-area conditions and the size of the job.
Table 2 presents typical adjusted unit costs for residential fill work in
each sub-area. Unit costs are presented for job sizes ranging from
1,000 cubic yards to 1,000,000 cubic yards to show the effects of economy
of scale. The derivation of these unit costs for the various job sizes
shown was accomplished by graphing the adjusted unit costs against size
of job for each sub-area. A sample graph (showing data for Sacramento)
is presented in Figure 3.
Since all of the data in Table 2 has been adjusted by the same criteria,
relative cost comparisons can be made for the various sub-areas. Weighted
unit cost averages, presented in Table 3, have been used to rank the study
locations. The North California Coastal area and the San Francisco area
consistently displayed the highest adjusted unit cost and were therefore
ranked I and 2 respectively. The lowest adjusted unit costs in the western
United States study area were recorded in the Salt Lake City area.
Unit cost rankings presented in Table 3 appear reasonable when compared to
Engineering News Record Construction cost indicies. Indicies for the 1974
construction season list San Francisco with a construction cost index of
244 9 ; Los Angeles with 2147; and Seattle at 1994. Table 3 rankings are
also consistent with the prevailing operating engineer wage rates for
California counties presented in the Equipment Rental Rates and General
Prevailing Wage Rates publication of the California Department of
Transportation.
(.

HAUL COSTS
Although considerable variation wa. noted for haul co.t . for the various
study sub-areas, contractors in all study locations generally do not assess
any haul cost for haul lengths less than 1,000 feet. For haul distances greater
than 1,000 feet, haul rates ranged from $0.01 per cubic yard to $0.50 per
cubic yard for each additional 1,000 feet. Table 4 lists the haul rate range
and average for each study location.
ROYALTY COSTS
In general, contractors do not have to pay for borrow material used for
ri residential fill. When royalty costs are assessed, however, the amount paid
for the material ranges from $0.05 to $0.50 per cubic yard.
No relaticnship between royalty costs and location within the western
United States was observed. In addition, there was no obvious correlation
between the borrow material costs and the total quantity of borrow material
needed or the haul distance between borrow area and residential fill site.
Study of the factors affecting unit costs indicates that royalty costs are not
as critical to unit bids as location, economy of scale, or haul distance.
A possible exception to this general rule would occur for large fill jobs with
short haul lengths and royalty costs greater than $0.25 per cubic yard.
-I

.14
.1
CA11
0BN
crr
0
00
0 0 0 0
0 0 0 in0
o i 0 0 0
ApW.7/f '5S ) PAW Nfl. GJSt7'C V

-j 9= C )) C- N (
C> C
-Da-
*C) ' co
*n 40 %Dl
C)
M: - LL.-
cc M j 0; c)
= L)
a-
'n- f- M 0
W co r 0j 0
I-- -I. C3
( LJ (N - 0
C14J 4D/)
cc: 4n
V). Cnr- C
NI~~~C 0-I I- f* -'C0
< V)
C:) U)
CC)
U) z-I
U)) Zl LACOCO44 C3 0 0 0
a ) 0
U) L) LA N- A)-o Lo .0 0D 40 0C.. ) 0 C)> )C
C)
cul -u 0 CC)C

'V
TABLE 3
SUB-AREA UNIT COST RANKINGS
WEIGHTED AVERAGE
RANKING SUB-AREA UNIT COST
I Nlorth California Coast $1.51
2 San Francisco 1.49
3 Sacramento 1.37
4 North Central California 1.33
5 Los Angeles 1.19
6 Seattle 1.16
7 Phoenix .08
8 San Diego 1.03
9 Portland 1.02
10 Walla Wallaand Eastern Washington 1.01
11 Salt Lake City 0.67

TABLE 4
HAUL RATES
RANGE AVERAGE
*LOCATION $/YD3-1,000 FT $/YD3 -1,Ooo FT
Los Angeles $0.01 - $0.05 $0.03
San Diego $0.02 - $0.05 $0.03
aSan Francisco $0.01 - $0.02 $0.02
*Sacramento $0.01 - $0.05 $0.025
North California Coast $0.30 - $0.45 $0.35
North Central California $0.02 - $0.05 $0.04
*Phoenix $0.02 - $0.035 $0.03
Salt Lake City $0.02 - $0.10 $0.06
Portland $0.03 - $0.15 $0.06
Walla Walla andEastern Washington $0.04 - $0.25 $0.08
Seattle $0.06 - $0.12 $0.09

IV. CONCLUSIONS
Unit cost variations for placing residential fill in the western United
States is principally dependent on location within the study area, the total
quantity of fill material needed, and the required haul distance. To a
lesser extent, royalty costs may be an important cost factor for large jobs
with short haul distances.
Ranking the study locations as shown in Table 3 takes into account the
variations in equipment and wage rates in the western United States. As
noted previously, these rankings are consistent with the Twenty Cities
Construction Cost Index of the Engineering News Record.
Derivation of unit costs for placing residential fill when no royalty costs
are assessed and haul distances are less than 1,000 feet provides a useful
analysis of the effects of economy of scale. The dependence of unit costs
on the total quantity of fill material needed is shown on Table 2 and the
sample graph of Figure 3.
Computation of haul rate averages for the study locations indicates that
sub-areas can be grouped together with respect to haul costs. Haul rates
for San Francisco, Sacramento, North Central California, Los Angeles,
Phoenix, and San Diego all averaged approximately $0.03/cubic yard-l,000 ft.
Data presented in Table 4 indicates that $0.075/cubic yard-I,O00 ft
is a representative haul rate for Salt Lake City, Portland, Walla Walla,
and eastern Washington and Seattle. Haul rates received for the North
California Coast place this area in a separate, higher haul rate classifica-
tion.
UNIT COST NOMOGRAPH
A unit cost nomograph provides an effective means of combining important
cost factors in determining the reasonableness of unit bids. The dependence
of costs on total quantity of fill material, developed in Table 2, the

ranking of locations with respect to weiqhted average unit costs shown in
Table 3 and the haul rate averages derived In Table 4 have been combined
in the development of the unit cost nomograph shown in Figure 4.
Unit costs included in this study are based on an Engineering News Record
Construction Cost Index of 2072, the United States average index value for
the 1974 construction season. Use of the U. S. average value is appropriate
since construction cost index variations for each location have been taken
into account by the cost rankings developed in Table 3.
The relative position of sub-areas on the location scale of the unit nomograph
corresponds to the cost rankings shown on Table 3. The three haul distance
schedules used in the nomograph are consistent with the three typical haul
rates found for the western United States study area. Schedule A should be
used for residential fill jobs in the San Francisco, Sacramento, North
Central California, Los Angeles, Phoenix, and San Diego areas where typical
haul costs averaged $0.03/cubic yard-l,000 feet. Schedule B applies only
to the North California Coastal area since haul rates in this area were found
to be considerably higher than any of the other study locations. Schedule C
is applicable to Seattle, Portland, Walla Walla, and eastern Washington and
Salt Lake City since haul rates from these areas could be approximated at
$0.075/cubic yard-l,000 feet.
A logarithmic scale was used for total quantity of fill material. Use of
this scale is appropriate because it provides for the study of a greater
range of job sizes. In addition, graphical analysis of unit costs versus
job size generally resulted in a straight line relationship when a logarithmic
plot was used.
A royalty cost scale was not incorporated into the unit cost nomograph because
no correlation could be determined between royalty costs and the other cost
factors studied. It is suggested that in checking unit bids with royalty
costs this cost (in S/cubic yard) be added to the unit cost derived from the
nomograph in Figure 4.

SAMPLE UNIT COST DETERMINATIONS WITH THE UNIT COST NOMOGRAPH
To familiarize the user with the unit cost nomograph, three sample
determinations have been shown in Figure 5. The explanation of these
sample runs is as follows:
Sample Determination No. I
Assume that the location of the residential fill work is in theLos Angeles area. The haul distance from the borrow area to
the job site is approximately one mile. Fifty thousand cubic yards
of fill material are needed. There is no royalty cost associated
with the borrow material.
Solution:
With a straight edge, line up Los Angeles on the location scale
with a one-mile haul length on haul distance Schedule A. Extend
the straight line until it intersects the turning line. Line up
the point of intersection with 50,000 cubic yards on the total
quantity of fill material scale and read the unit cost.
Answer:
$1.05/cubic yard

* I
Sample Determination No. 2
The residential fill work is to be done along the North California
Coast. The haul distance is 1.5 miles and the total size of the
job is 10,000 cubic yards. There are no royalty costs Involved.
Solution:
With a straight edge, line up the North California Coast point on
the location scale with 1.5 miles on haul distance Schedule B.
As before, extend the straight line until it intersects the turning
line. From the intersecting point, line up 10,000 cubic yards and
read the unit cost.
Answer:
$3.98 /cubic yard
1

Sample Determination No. 3
The residential fill work is in the Salt Lake City area.
Fill material is readily available near the site (haul distance
less than or equal to 1,000 feet); however, a royalty cost of
$0.25/cubic yard is assessed. The total quantity of fill material
needed is approximately 500,000 cubic yards.
Solution:
Line up Salt Lake City with the 1,000 feet or less mark on
haul distance Scale C. Extend the line until it intersects the
turning line. From the intersection point find the 500,000 cubic
yard mark on the fill material scale and read the unit cost.
Answer:
$0.52/cubic yard; add $0.25/cubic yard for royalty costs for a
unit bid total of $0.77/cubic yard.
In addition to Figures 4 and 5, a mylar original of the unit cost nomograph
is provided in the back cover pocket of this report.

PREVAILING UNIT COSTS FORPLACING RESIDENTIAL FILL IN L0 USE wi'rl swicir I 96. 4iwd &,- LociFIO'd
MHE WESTERN UNITED STATrES Wrm ccvrpopm -,MM 05)::us
Mir41 COSTS 8151D0 GV F Af ft M£1.1 MVIN6 I4ME rol"' ITV vp TILL lCOES IRUCIOV COST I)hOrx OF 2072 oahao j, c1 cosr
111. AVERACE /
ONE-WAY TO TALL OCATrION HAUL DISTANCE UITw COST OUANrITY
fs" SC&***.V Mdoff sot l'-oar~ rwo 'jj OF FIL L
AMAMCAL
* Ifee" .. :tl
Mile~ Wel*-foort' We,*1-0.I
C,.,,~d I It '40
so L .f 1 .-30039
1.,,, *.99f - AB Cme
-crdl Ubi4 -.,. . o r~,,I
S.. ' .- so DI .
Schdul 1sg9f A4,0 B .,o' C .
Sehf~if 50011tPallo.4.Wellkheduf fow So.wvt I'.'c *Soe.I'
MoM c ar1C ''',# -.So-1 A ~ vee v~~
19 -
awaC.,. S..D'e. F 5c~9
See...e.P. ~~~FIUR 4deuci .,t~. ..

PRVAILING UNITr COSTS FORPLACING RESIDENT/AL FILL. IN FO 0J51 Wi IIb lvi t'. W.CAlleO
THE WESTERN UN/TED STATES - V,. ;;. 14, I,, Td4.'D
U~~r COSV-W ^tvI ON t4 "b , '..I *ON I ' l I 910 ' AIf
CONdSINUI11' CON' 'kill % Of .Vlj .ia
14VS AYJA'ACI J-
-1ioN(r- wA r Z TO TAL
L OCA TION HAUL DISTANCE v NIT COST QUANTITY
el See d at 1ut 0't.1" 1 j /CO. rwra F OF FItLL
AB I MATERIAL
j-J,
, 41!
5t.I,et &SAOPL E 3 S 2\oWjr.
we,-, .3We a
/er WO 00" * '
Pe. We'.. I
.000
schedule A e 50,e,3C.SQ O.*00
(~A C11110' C41101-0,g - --------A.,woe,~SO A~1mut/~ON 3 - 'o
Nsst Cea." o- C."'a
/Schedule C A.~ P,IW'o .cWall.
S'Pos,/SAMPLE 2Mew~ C.z 'l.w
SAMPL E UNIT COST DETRMINATI7ONSf FIGURE 5

APPENDIX
EXTENSION OF UNIT NOMOGRAPH TECHNIQUES
TO
EASTERN AND SOUTHEASTERN UNITED STATES LOCATIONS
4I

V. EXTENSION OF UNIT COST NOMOGRAPH TECHNIQUES
TO EASTERN AND SOUTHEASTERN UNITED STATES LOCATIONS
The method of approach used to determine the unit cost nomograph for western
United States locations shown in Figure 4 was applied to data obtained for
eastern and southeastern U. S. cities. This data, presented in Table 5,
indicates that prevailing unit costs for placing residential fill in the east
are less than those recorded for the west coast for jobs with haul distances
of less than 1,000 feet. Earthmoving and residential fill placing in eastern
locations with long hauls are comparable in costs with jobs in western cities
because of the generally higher haul rates in effect on the east coast. Data
for eastern United States cities was collected by telephone conversationswith U. S. Army Corps of Engineers District offices and private contractors.
Consistent with the findings presented in Section III of this report,
variability of cost exists among eastern study locations for residential fill
jobs of similar size and scope. Haul costs associated with haul lengths
greater than 1,000 feet also showed considerable variability. Based on these
findings, location, economy of scale, and haul distance were established
as significant cost parameters. Unit costs representative of each study
location take into account specific local earthmoving and placing conditions
such as high water table, poor drainage conditions, limited construction
seasons, and local labor and equipment rates. Analysis of economy of scale
includes mobilization and demobilization costs important for small earth fill
jobs but less significant for large contracts.
The unit cost nomograph developed for the eastern and southeastern United
States study areas is shown in Figure 6. Similar in construction to Figure 4,
the east coast nomograph indicates that unit costs developed for Savannah,
Georgia; Pittsburgh, Pennsylvania; and Chicago, Illinois were the highestjI
among study area locations. San Antonio-Galveston, Texas, and Nashvile-
Memphis, Tennessee, contributed some of the lowest unit cost bids for the
'I II, = = 'lI' -

same study region. The haul distance schedules provided correspond to
the various haul rates found. Use of Schedule A is appropriate for checking
costs for Philadelphia and Buffalo. These citie,. recorded the highest
haul rates estimated at aporoximately $0.25 per cubic yard per 1,000 feet
of haul up to one mile of haul and $0.15 per cubic yard per 1,000 feet
after the first mile. Schedule B, to be used for Pittsburgh, Chicago,
Baltimore, and Boston represents a haul rate of $0.15 per cubic yard per
1,000 feet for the first mile with a lower rate of $0.09 per cubic yard per
1,000 feet for longer distances. Determination of haul charges forSan Antonio-Galveston, Nashville-Memphis, Savannah, and Huntington (West
Virginia) is provided by Schedule C. This schedule corresponds to the
lowest haul rate estimated at $0.15/yd3/I,000 feet for the first mile of haul
and $0.041/yd3/1,000 feet for longer distances.
To allow for the study of a large range of job sizes, a logarithmic scale
was used for the total quantity of fill material axis. Use of this scale
is appropriate since graphical analysis of economy of scale factors for
each study location resulted in a straight line when a logarithmic plot was
utilized. Royalty or borrow material costs were not included in the unit
cost nomograph because of the large disparity of values recorded for each
location. If royalty costs are applicable on a particular bid, they should
be added to the unit cost determined from Figure 6.
Unit cost derived from Figure 6 corresponds to an Engineering News Record
Construction Cost Index of 2072. This index value represents the U. S.
average during the 1974 construction season, the period from which the unit
cost data was recorded.
To update unit costs determined from either Figure 4 or Figure 6, it is
suggested that the ratio of the future ENR 20 cities average construction cost
index and the index value of 2072 be applied to the values determined from
the unit cost nomographs.

41J 0 3
0 0
0,41
I-Z- IA0EO
v 0) z C41a.
In>m-r- 0 m A-. 4 1 l41t CL L
0I tnEa' On
0 L 0 U)0
LQ~ .O 4 '- 0 0C *> m 0 0 L- 0.)C.
41~~~).4 CLw 1u-L u, 'LU.i C- C L41f- L w 0.- .- ul in
L.) CA WCX 0L 0'-/ 0)0 L- >,) 4 >l0c m14 m14 Cl'* - >4jL C---.- 40 4 m tr_ C
C> U) ZM)I Vr)I 0Ln c . L CU~ mUI m 0to0e
< 0
knL 0
LU~i I- >
0- 0sO- 41
<0 0 L 4 C
LU </ C) 0
ca 0 La(D
-CO
411>
~ U 00 Ir 0 0m
U)u C)4 u -- *---0C> C)- C VV
LU < )E0)(
V) 0i 00 00U0
>J U3 00Co~A0
LU LAO (D CC0 r- LA
_0 0 O D 0 )C)C
V) .. LA%CD - 0 0) '-nC
SVX3 IdISS I 33S3.3

C 4n 0
-C a. 0.0 )4 L.0 4A 0 0k'-'@ 4,Lz u
c CO 0c -)e : -
Cj Cl C 0 E- C tu.)- 0 0 V0 1
LL, w)6 (A 6LC) L-~6)0r-- z %Azz614) I utw 0 =C c C C >-xc4 .;
X:-- 2:1- xI-U &
'.0
C) -UE
IA >1'0 E -4,-0 0 0~(n 0 -0
0~~~ 0 0 JL-4 QL
C 0
%10 00-V2~ 4-' x : -. ,4
4.0 E
'V Lu-' C) Lrx E * - C> 00 L C) 0 0 0 00C> L 0 4
'a CA 0) * r 44 C 0 L4, LA LA - >3 -
C.5
to 0 04,
41f %0
I.. 02 0 0DC
-V L LA -0 c- -) C ;C
- 0 0 0 nC'UL LL
0-.4-Y 0L'0
33SS3 I3I

0 c~4 I >. L-
an 0 v -4)
~L n~ L>O
v) &d-4 0Ly n m4UJ I-tL. L. 0 -U1L- 0 L." L-C - 41 0 -4 L
o3 3 V )c30 0 4' .- -:3 41 UC> =3 WL.WC7 3 nC IM:r uM D C3 L. -z up)IC3
41 W41OC 'OC- O . -a ~ 1.
o C)
LU 0 41
< E
CoC
z L
(z 0m0--
co
w) LA
00
U'N 4^ 00 0r 0r C (D.
V I0 U03A0 0 IIOI 0 S3 LA 01

41' 4-1 41' 414 *41'4. au '. u '. J '4 '4-u 4 -u
0 U,- 0 -C-0 UC 0 -- 0 C- 0 C4nOI. z f~ .fO~ mg" z Mw ) L L. n C L
ufLL- " 01 mfL-. " tAL. L41 £lL- AL.- 4 fl L. - 4JC-C A w3g 0 3 u CL~U O..J n CL OI O.QEn)L 0uh
L6J LU.O L W-0D - La o-0 L 0 ' L 0 -
LLJ< nc-'u O, C c-to ic-q ci 0n.i .cm mn
a, U1)jU- m
0) "D) 0- 0VUU) 4-' -u4 C
n~ Urn0
6j -v e. 6
Of m 0
LnC
mU %D *E 0,IV -j
= 2- 0 *o >- (4-41
C)'4 C>O b 0 0>
0l 0
0 fiJ 0 0 0U
* C) C)
CD 0 0 0 C C X
*o L- 0 00 00 0)(
'a 0 C 0 00 03 00' U J > - a - -
P 0 0 CD -4LA ~ CIA I. 0
LA C-C)C
4- M~ 0 0 0 0 0L0
- C';
V INVAIASNN~d

) E
044-
E0 C: >-0:3 0. .-
UE 2: F.CO. 0>o7 00t-
0 0 Ew 0D - 0
U)i V 4-'
aI L >- O >-) 0. >-0 . 0 0 >4) 0 00 0 0
C) tCI.. I.. &-. L- 4- . n L 0 #
0; - L. L4- L4- 4cc in 0z 0le M) 0 c- 0 r- 0
-! 4-4 4- CJ 4L4J U1L4 -AL
-~~,... 0 30 .03 00 00 . 0 .IF -I. -a n- InE. -- U-3 1 o Wc ic 3 = I 3 U)
4- >-
EU 4/E
C>.
w C.
0 0 0D00C0 AM'. a "-\ 0 0 0
eov V c3 -Cc Z IV'L- LUJ
C)
- 0 CK.D 0 0 0 0 0D0 00 0) 0) 0l 0 0) D
0U 0 -C4 ) C 0 0D 0 0r 0D 0
40 - 0D Ln 0 Ln 0-i U' U'% U\ LA
LA
"a UI CD00
LA 4^ U\ ULA UA - ; 0 0
EU*
('4(' (4 A) C4 rl4%
NV~OA I'UN OINVIA'dvN

0.- -AC
4.S C 0c0 - :3 (L. 0C.) CA C0 4-
-'04 0 X
a L) E - CL0E r
Cl 'I- :W Ui -C: L L l L -
C1CU
rN
C)
41 I
N1
4.1
CC
4)
m- LL- O-I
-o a
C ICi
LJ 0 0
too
Sl13snH3VS00
%pow--- 0

PREVAILNG vNir COSTS fOR? PL ACING RESI VTlAL FILL ro~W FA'?UG.d~LP~~~ t&~1
IN THE LASTERN AND SOVUlI/AS URN UNITED STATES & hPo.kl'I8eL...*vg ,c d w~wo reo
L OCATION ONE-WAY HAUL DISTANC (/NIr COST MA rFILSea AaoIe.I- ISee Schedgle &*low) fl1C.Wc Ywefed l.1 ~ rIJ (~ e Te
u400
I#.M
0.000 a
9 amu
I @oaft AVOW&
P~te~fta 4-ft
r.owft 4
am MOmW
w V.
Schedule A - Philadelphie, Bdlco.
Schodule 5 Pit shurph, C~ee /o,
Schedule C - SO: Antonio, Va/vealon. Noghvidle . DA1emph/e. Sava. RDA, firo SA00,000'
hiceee.Ift I
a.5
I~~~~ ..-- 71.

COST OF EARTHWORK FILLS
IN FLOODPLAINS OF THE
CENTRAL AND SOUTHERN UNITED STATES
PREPARED FOR
HYDROLOGIC ENGINEERING CENTER
U.So ARMY CORPS OF ENGINEERS
APRIL 1. 1975
-p
"sda

vtEngineers Planners Environmntia Scientists2701 Indepeiwlence Street. Metaire. I ujisiana 70002 1504) 455 3"1
March 26, 1975
Mr. William K. JohnsonHydrologic Engineering CenterU.S. Army Corps of Engineers609 Second StreetDavis, California 95616
RE: Cost Estimating for Earthwork FillsConstructed Within Floodplain Areas
Dear Mr. Johnson:
VTN is pleased to present this report in fulfillment of our segment ofthe HEC's nationwide assessment of the cost of earthwork fills constructedwithin floodplain areas. The report presents the findings of a ten-weekinventory and analysis effort. We trust that the HEC's staff will findthe base line data and the findings useful in the development of earth-work cost factors for use in Corps of Engineers planning studies.
VTN is very much interested in the results of the studies conducted forthe east coast and west coast regions, and in the conclusions of theHEC following coordination of the guidelines from all three studies.We look forward to hearing from you in this regard.
Respectfully submitted,
VTN LOUISIANA, INC.
Terry . rtman, P.E.
TJH/dw
Enclosures
. .--I -

TABLE OF CONTENTS
SECTION TITLE PG
Letter of Transmittal. .. .. ... ... .... . ....
Table of Contents .. .. .. . ... ... .... . .... ii
List of Figures and Tables .. .. ... ... .. .... iii
A. SUMMARY OF FINDINGS. .. . ... ..... ... .. ... 1
B. BACKGROUND AND STUDY OBJECTIVES. .. .. .. ... ..... 5
C. AUTHORIZATION .. .. .. ... ... .. ... .... .. 6
D. STUDY APPROACH. .. .. .. .... . ... ... .. ... 7
1) Methodology. .. .. .. ... ... ..... ..... 7
2) Study Depth and Limitations. .. .. .... . ..... 8
E. INVENTORY AND ANALYSIS OF CONSTRUCTION COSTS .. .. .... 10
1) Past and Present Cost of Earthwork Fills .. .. .....10
a) Compacted Earthwork Fills. .. .. .... . .... 10
b) Semi-Compacted Earthwork Fills. .. .. .. .... 11
c) Hydraulic Fill. .. ...... .. ... .. .... 14
d) Regional Variations in Construction Costs .. .. .. 16
2) Projecting Cost. .. .. .. ... ... ..... ... 17
F. APPENDIX .. .. ... ..... ... ... ..... ... 22
1) Study Participants .. .. ... ... .... . .... 22
2) References. .. .. .. ... ..... ... .. ... 23
3) Example Questionnarie .. .. .. .... ... ..... 24
1A. ..

LIST OF FIGURES AND TABLES
Figure 1 - Guidelines for Cost of Earthwork Fills in Floodplain
Areas - 1975
Figure 2 -Study Area Central United States and Regions of the Study
Figure 3 Representative Projects for Compacted Fills
Figure 4 - Representative Projects for Semi-Compacted Fills
Figure 5 - Representative Projects for Hydraulic Fills
Figure 6 - Trends of Labor and Material Cost Indexes
Figure 7 - Comparison of Cost Indexes
Figure 8 - Composite Cost Index of Earthwork Construction in Floodplain
Areas, Including Projections to 1985
Table 1 - Estimation of Cost Increases for Project Location and Timing
Table 2 - Regional Indices

A. SUMMARY OF FINDINGS.
The purposes of this comparative cost study is to develop costing indices
or guidelines to evaluate present and future projects which include earth-
work construction in floodplain areas of the central and south-central
United States. This report represents these cost guidelines based upon
a broad brush, planning level effort, and the findings of a multi-state
survey and literature search. This study was conducted in a very short
time considering the areal extent of the region studied, and was limited
in depth of study by a restricted budget. The background, methodology,
present construction trends, and expected projected unit costs utilized
to support the cost guidelines are described in the following chapters.
As specified in the Scope of Work for this study, true contract unit
prices for earthwork fills in floodplains were analyzed from bid summaries
of projects located in the central and southern states, leading to a base
unit cost index for earthwork construction by three principal categories:
compacted, semi-compacted and hydraulic fills. Unit costs for earthwork
construction vary considerably from one construction job to another
depending upon size, location, and construction method specified
(compacted, semi-compacted or hydraulic). All other factors remaining
constant, compacted earthwork construction is consistently the highest
unit cost method, requiring additional time and equipment to attain
required compaction specifications. Semi-comoacted fill is proportionately
lower cost, due to a lesser degree of compaction requirements. Hydraulic
earthwork fill, on an In-place unit cost basis, is the least cost method
of the aforementioned principal construction types.

A graphic index or guideline curve for earthwork fills cost was derived
from evaluation of the data collected. This guideline for cost of earth-
work fills in floodplain areas (Figure 1), represents a comparison of
unit cost of construction by type to size of project, in terms of the
quantity of cubic yards. The data was averaged and fitted by manual
methods.
The cost of compacted fill is influenced more by project size than the
other types; and of course, the smaller the quantity of fill in the
project, the higher the unit cost. Semi-compacted and hydraulic fills
compare closely, and graphically plane out in a narrow margin cost
range in the larger quantity projects. Sharp rises in unit cost are
encountered in the moderate to small quantity range of project size.
Regional variations in costs were computed for the central and south-
central states, resulting in a subdivision of the generalized study area
into southern, central and northern regions of the middle United States.
The regional cost variations are based on a comparative study of con-
struction costs in major cities in the three regions, and the comparison
is made relative to a base one (base = 1.0 or 100%) for the southern
region. A plus four per cent (+4%) cost increase was found for the
central region over the southern region and a plus 3 per cent (+3%) cost
increase for the northern region over the southern region.
A much greater base of data, i.e., number of construction projects, was
accumulated for the south-central states; therefore, this area was desig-
nated the base region for establishing current costs for comparison of
costs by location, and for forecasts of future costs. Forecasts of the
2
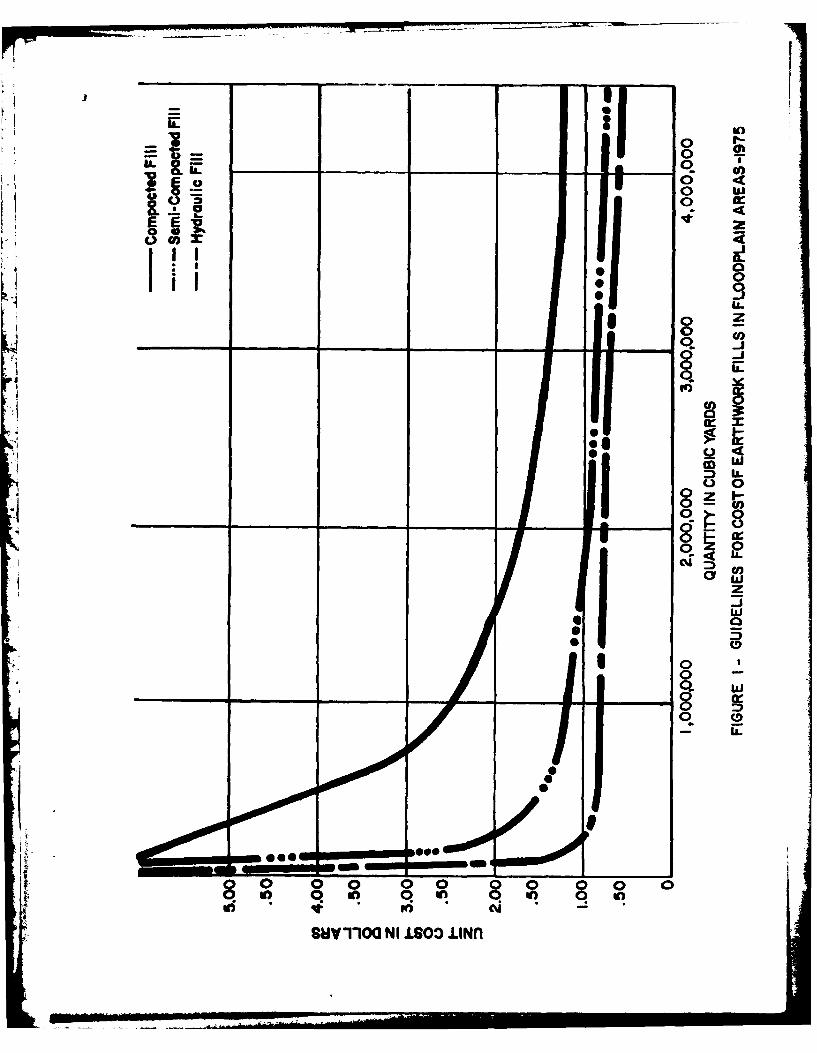
-- I"L
0@)0
- - 0
000
01 0q q 8 In IoA~
SHT0 I SO1~

future cost of earthwork fills was based upon cost projections to the
year 1985, extrapolated from trends of comparative construction costs
from the seven year period 1969 to 1975. A conservative forecast results
in a minimum annual cost incredse of 9.43%. Projected unit costs for
earthwork fills, based upon cost data trends from actual projects, were
computed by analysis of average unit costs for a variety of projects by
size (volume of earthwork) and type, and combined with the regional cost
adjustment for location (per cent increase). The forecast annual
inflationary cost increase by work location is indicated in Table 1.
TABLE 1
ESTIMATION OF COST INCREASES FOR PROJECT LOCATION AND TIMING
REGIONAL ANNUAL INFLATIONARYREGION INDEX (%) INCREASE
Southern Base = 1.0 9.43%/yr.
Central +4% = 1.04 9.43%/yr.
Northern +3% = 1.03 9.43%/yr.
Utilizing Figure 1 and Table 1 together, a good estimate of order of
magnitude costs for future earthwork fill construction in floodplain
areas can be obtained. These guidelines can readily serve planners in
the determination of future construction costs relative to flood control
project features and for assessment of the overall feasibility of project
development.
4

B. BACKGROUND AND STUDY OBJECTIVES.
In the planning and design of major public works projects for the regula-
tion of stream flow, and in consideration of alternatives which will permit
development within floodplain areas, reliable construction cost estimates
in conjunction with evaluation of project benefits are very important.
Good cost data assures realistic expectations of benefits as determined
for project justification. The construction cost data utilized in a
benefit-cost analysis may be the key to showing a proposed protective
work to be economically justified or not economically justified.
Landowners, local officials and citizen environmental groups also require
more accurate data for definition of flood protection project features,
particularly when reviewing the economic justification. Structural uses
of the floodplain area and improvements such as fill or protective works
which make economic uses feasible, rely heavily on good construction
cost estimates.
The purpose of this research study is to develop earthwork cost factors
intended for use at the planning level, and for use in the development
of realistic budget estimates for elements of economic feasibility
studies. The data developed is representative of projects located in the
central and south-central portions of the United States, as one of three
principal regions to be considered by the Corps on establishing the cost
of earthwork fills in floodplain areas, and this data is to be coordinated
by the Hydrologic Engineering Center with similar data provided by others
from eastern and western regions of the United States.
5
Jil

C. AUTHORIZATION
The Hydrologic Engineering Center, U.S. Army Corps of Engineers, was
the sole sponsor of this study as authorized by the Contracting Officer,
Mr. D. Lampshire, on purchase order No. DACWO5-75-P-1119, dated
January 29, 1975. VTN was selected to undertake the study in accord-
ance with the scope of services as described in the Contract Proposal
dated December 23 1974. The purpose of the study as stated in the
purchase order, is to prepare a written report on the results of a
review of reports on floodplain development and economic studies
relative to the cost of earthwork fills constructed within floodplain
areas, as directed and agreed upon.
,I
L6
..

COSTS OF PLACING FILL IN A FLOOD PLAIN.(U)
U4CLASSIFIw7 N2Glf f flWlf fl l lf f2llllf.8

D. STUDY APPROACH.
1) Me thodology. Major considerdir'. in the determination of the
earthwork fill construction cost estimates for this project included:
equipment types utilized in each particular project, soils material
types, transport distance, the method utilized in spreading and compact-
ing fills, job output in terms of production in cubic yards per day, and
unit costs including all labor, materials and equipment, so that an in-
place unit cost was achieved. To assure an accurate unit cost determination
for earthwork projects in floodplain regions of the central United States,
an obvious approach is the analysis of actual earthwork contracts in
various locations within the study area. From the data accumulated for
the various types of construction methods associated with earthwork fills,
average unit costs were derived. Construction contracts were sorted into
three major categories -- compacted, semi-compacted and hydraulic fills.
The limiting factors of time and distance made it essential to obtain a
great deal of the data through means of questionnaires relating to earth-
work fills on specific projects. The questionnaires were sent to federal.
state and local agencies and groups which had direct knowledge of contracts
for earthwork construction projects. A copy of the questionnaire utilized
is appended to this report. The questionnaire mailing list included 16
Corps of Engineers district offices, 15 state departments of public works,
other VTN offices, and 52 offices of the Associated General Contractors.
In some states within the study area, where questionnaires were unable to
be answered or returned and data availability was scarce, various sources
of published indexes were inventoried and analyzed in regard to earthwork
7

construction costs. Then data extrapolations were made from these sources
to derive representative unit cost figures for those regions.
This study proposes that the central and south-central regions of the
United States encompass the area generally described by the states of
North and South Dakota, Wyoming, Colorado, New Mexico, Nebraska, Kansas,
Oklahoma, Texas, Minnesota, Wisconsin, Iowa, Missouri, Arkansas, Louisiana,
Illinois, Mississippi and Alabama (Figure 2). Success in the data inventory
tasks of the study was widely varied by area, and the amount of informa-
tion made available by the return of questionnaires generally varied
inversely with the distance from Louisiana, location of the study office.
Construction cost adjustment indices for project locations are based upon
states or major cities in which the construction is located. The regional
cost index was multiplied times the cost estimated for a particular de-
scription of earthwork in the southern region, in order to arrive at a
cost adjustment for geographical differences of projects in the central
and northern regions.
2) Study Depth and Limitations. The scope of the study was broad
and complex in terms of the geographical extent, as well as the number
of individual construction projects needed to attain a representative
overall sample of typical project development costs. Judgment was
applied in establishing the depth of the study, or level of detail, suited
to the study scope and task assignment. Overall unit cost evaluations
were dependent on judgment as supported by evidence from data collections.
Specific analysis of every individual project in the total project area
and every element of all contracts associated with any earthwork construc-
Ation was not feasible within the time and budgetary limitations of this study.
8
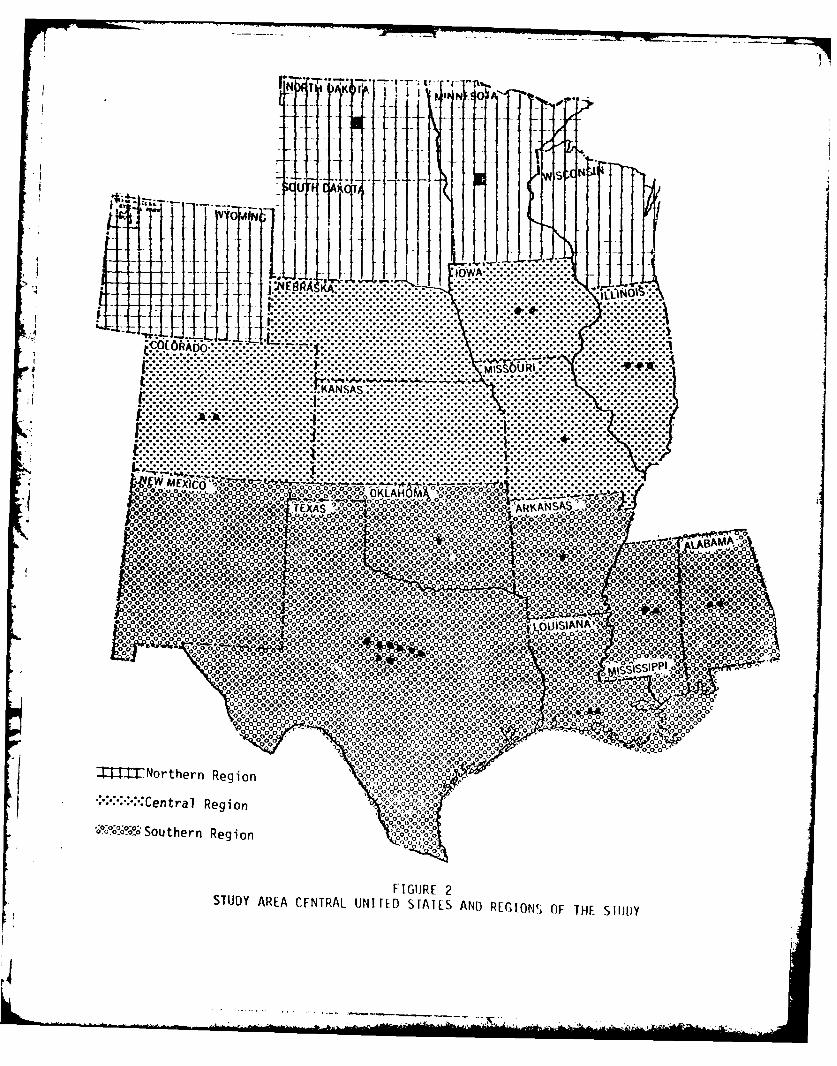
MT IT T4'':N. KA. .....
* ::::::kxx:::: .. ............. .**.:::: :::.:.:.:.:.:.,..-.
..... .. .. .. . ..
6h ... ~)Q% %% %. 0X100.
. . . . . . . . . ..~o~o 000 .. . . . . . . . . . . .0 0 0 0... 00 .00 . . . . ..... . . . . ............o00. ..................0o
...........o...00 0000 0000 .. .0000000..0 0 0 ~ 0 00~~ 0 %~ 0 000 c o ~~ o~ 0 .o ~ 0 .0 % 0 % o% oo 0 0 0 0 .4 ~ ~ ~ . . . . . . . . . . . . . . . . ..0 0.0 0 0 0c ~ % ; 0 % ~ o ~ o % 0 0 0 0 0 0 a T o ~ o ~ o o10~~. . . . . . . . . . . . . . . . . . . %o o . .. 0.00 0 00 0 0 0 00. ..00 %~0 0 0 0 0 00. . .. . .. . " .:0o0ooo0~~~ 0 00 00 0 00000 . o 00*0.0.00000000-0-0~~~0-0-0'.0.,0.,.... ....-.0..... .....0~ ..0000.00000..000...000 ~ 00
000 00a..0.0.0..00 00 0000.0.0 .. 0000
.00 0 0 0 0 0 0 0 0 00.. . . . . . .O 0 O0 0 0 0 0 0 0 0 0 00000........0. 0 0 00 000.00.000 000......PoOc
0ooo oo0 0 0 0 0
ooo o 0 0 ,?~ .00 . .... .0 ..... J 0
000 00 Q 0 0' -- 56"F 0 0 !0I000 0& 0P 00 SGPP 00 00
I.?0I.0 0 0 ~0 00'000 o000 oogoOo%0 o0~o 00000 0 Go00000 00000 00.. 0 0000 0 0 0 0 0 0oo 0 ooM K oooANSooo000 00 500V-0_0% 0 0 0 ~~) 0 a 4%%0 -co0OQoO00oooO6ooO00000oooo O0oomo0o0o 0000000G 00000o
0 0 0 0~~~~~~ 000 000 0G0 0 0 0 o, 0 o0-!9 '- 00000ooo0 %o 0000?00600000e000a0a 00
00 0 00 00 00 00 00 00 00000_o00weo o oo c G~00~000o~% 00000%'o000000Go 000op0000G000+to1 &oorthern.Q Region._ I oo'6 oIABMl*o~ GXeta RegionQ%*% _60MMON Sothr Rgon b 00ooMo% oooo 6o ooGoooQoGoo~ 2mcoVa66
Go ~ ~ ~ I~R 2 ~a "6og po.QGboWoo~N?~ STD AREA- CETA UNTE sri- ANDoom-em REGION OF_ TH -suimyoo~. G o oo c
d oIv o d oa-a-G---------- (R

E. INVENTORY AND ANALYSIS OF CONSTRUCTION COSTS.
1) task and Present Cost of Earthwork Fills. Utilizing the bid sum-
mary documents for earthwork construction from a number of public projects,
located in floodplain areas, and based upon records ranging from 1969 to
1975, the data plotted on Figures 3, 4 and 5 represents an average of
unit costs for fill relative to project size. These average projects
represent a cross section of typical construction contracts, such as
levee embankments, foundation fills, bridge approach fills, and road and
highway base fills. A "typical" earthwork project also includes construc-
tion procedures common to geographical location and features of a given
area, and with production requirements in the accepted range of the
various construction types, i.e., hydraulic fills, dragline castings, or
material hauling. Projects having unusual circumstances or special con-
ditions were not utilized, i.e., emergency repair work, force account
work, extensive foundation preparation, or significant slope protection
requirements.
a) Compacted Earthwork Fills. Earthwork construction in flood-
plain regions generally requires soil compaction requirements of varying
degrees. The specific conditions related to the compaction requirements
are soil types, geographical location and overall project purpose. The
unit cost for compacted earthwork fills in this study represent all mea-
sures required to initially transport the materials to the work site,
place and shape the materials and all techniques necessary to attain soil
compaction requirements. Due to the additional manpower, equipment and
time needed for compaction requirements, this type of earthwork has been
historically more expensive in unit measurements than the less specific
10.. I

earthwork construction.
The unit price ieasureninl.', fFord ',mp.a( ted e ,irlhwork project are statisti-
cal ly easy to grdph in thit thy p yiral ly lol low a trend of predictable
volume versus unit price relation.,hip. HiLtorically, the larger the pro-
ject as to cubic yardage measurements, the lower the unit cost of the
in-place materials (Figure 3).
b) Semi-Compacted Earthwork Fills. Semi-compacted fill, as used
in this report, is defined as earthwork projects requiring limited prepara-
tion of deposited materials, such that a minor degree of comoaction techni-
ques are required to stabilize the final earth foundation or structure.
In earthwork projects associated with floodplain regions, the majority of
semi-compacted earthwork projects consist of some type of levee protection
system. The materials are placed on the levee alignment, shaped, and then
compacted to a minor degree by associatel equipment passing over the
materials a given number of times. In this study, the greater number of
projects actually reviewed for cost breakdowns were of the semi-compaction
types, and records indicate an in-place unit costs much lower than that
of a similar project requiring compacted fills (Figure 4).
In reviewing cost data foc year; whure severul projects existed in the
semi-compacted category, avera(ps ot both unit prices and quantities were
attained and plotted to indicate general construction trends for a given
period (Figure 4). In some cases, individual jobs did not fit the overall
base data curve of project unit costs, but it must be understood that
contingencies such as the lcv'l of rjenor n l C. 114ttit)L for contracts,
unusual bid factors, or inaroJit'e il,inq 1,,y div~ort any particular project
1 ] " '

SONiVA 3I9Ml HI AIINVlb
C o C) C> 0
In (%Jcl
LUJ
2-Inn
LAaL-
4- nC4 )
v- 4-J
a'
CV) 0.
U.) 0
ty 0
U- >fS41I
( U
C)0Plea ON
z -
Plea ~ ~ a~ jut0~nu 7
CI CD ) C) C
Ln CLI -4
SHVIIOG~ ~ ~ ~ NIiiv- so
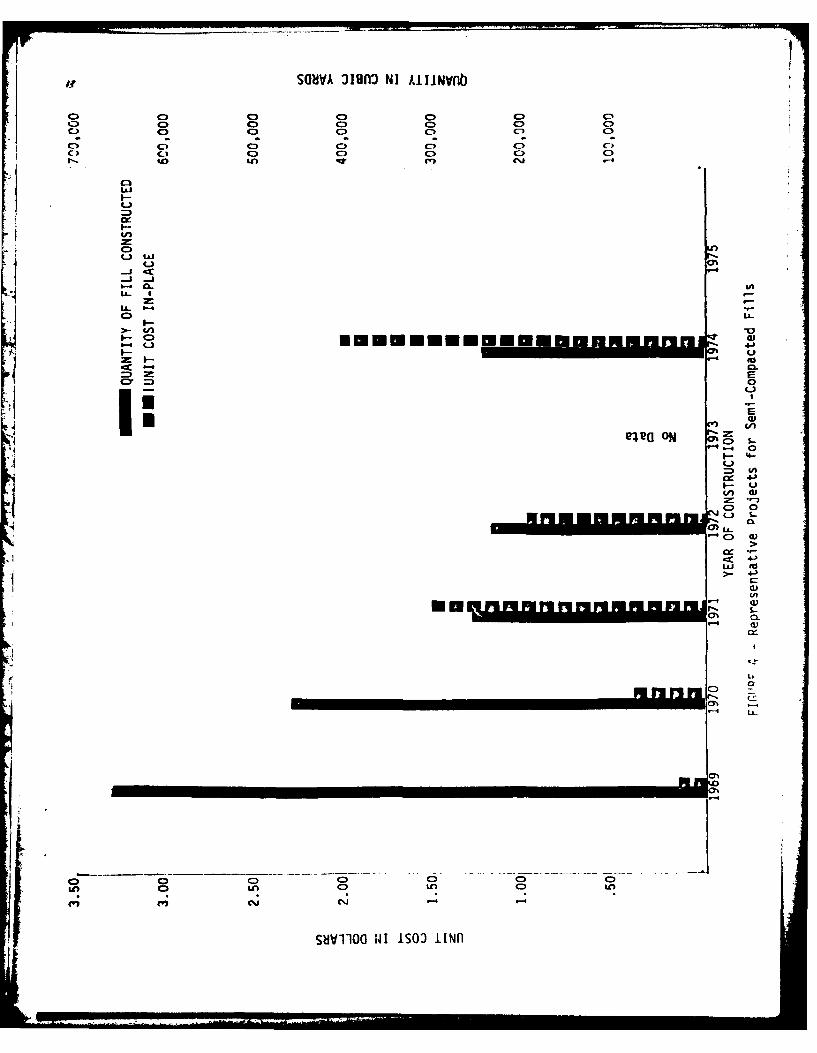
sUaIvA 3180l3 NI AliNVntJ
o C0 0 0 C) 40Co C) 0 C) C)
c), C) C) C )CC-) C-3 C3 cl) C) CD
C) ) C C) Ci C.)i
ix
tnLm
C)
-J ib.. 0.U
0) LI-
C-)~~~ MEMoENMI
2C E
-
C) 0
C)-1 OfU. o
- 4-
ME FRIMM0 S0L
SbIV11Oo WI IS03 iINfl

in relation to the trend of the average of "typical" project represented
in Figure 1.
c) Hydraulic Fill. A common alternative to earthwork construc-
tion other than the compaction methods is the hydraulic dredging of
materials from adjacent waterways. The dredged materials may be placed
along the levee alignment or stockpiled for future construction. The
hydraulic method of material transport over extended distances has proven
desirable in both efficiency and reduced unit cost.
The hydraulic method of earthwork construction is best designed for the
larger projects due to the associated cost of mobilization and demobili-
zation of the dredging plant and equipment. Projects ranging under the
30,000 cubic yard mark can usually be done at the same cost or for less
by some alternate method of construction such as dragline dredge work
or hauling equipment.
In instances where several projects existed in the hydraulic fill category
for the same period of time, averages of both the unit prices and the
quantities were attained and plotted to indicate general construction
trends for a given period (Figure 5). As noted for other earthwork types,
individual jobs did not fit the overall base data curve indicating project
costs, but it must be understood that contingencies such as the level of
general competition for contracts, unusual bid factors, or inaccurate
bidding may distort any particular project in relation to the trend of
the average or "typical" project represented in Figure 1.
14

7 s~rSUaVA 3180D UI AlI INVlt
Co C3C oC
CD C>C1o C) 0l
C) C)J CclC
IcJ
C3
I-
i -cc l ea ON C
LL I
I-.-
020
4.
Liu
8L-
0 4-)
4A)
LAJw- Acc
: LA
wi
C-
SHiV11OO NI 1S03 iIn

d) Regional Variations in Construction Costs. Construction costs
in all aspects of earthwork fills are not expected to remain constant through-
out the United States. Variations in cost for factors such as labor, mater-
ials, and equipment are different as job locations change. Earthwork fill
construction is no exception; therefore, regional variations are encountered
and can be predicted for given locations, provided a sufficient data bank
exists. The project area was subdivided into three main regions:
southern, central, and northern (Figure 2).
The scope of this study did not allow an in-depth research of cost factors
to adjust for various regions of the project. The approach to cost differ-
ences was adapted from researched cost indices published to aid engineers
and contractors in preliminary bidding.
Construction cost indexes for all major cities in the study area were com-
pared and a cost index representative of the three study regions was adopted
to adjust for varying cost for labor and materials (Table 2). The index for
equipment cost variance could not be determined due to the competitive nat-
ure of those items. The regional indices are produced to indicate the gen-
eral cost trends in geographical regions only, and do not indicate actual
construction costs.
TABLE 2
REGIONAL INDICES
DIVISION LABOR MATERIALS
Southern .78 .91
Central .93 .95
Northern .87 .97
Source: McGraw-Hill Information Systems Co., 1974Base of index 1967 = 1.0
116

From comparisons of actual projects completed of similar nature and in
different regions, as well as indices comparisons in the three regions,
the conclusion is drawn that the southern states can be operated in with
a smaller unit cost, and for comparison reasons will be considered as a
base cost of 1 (or 100%). The central states region of this study are
the most costly considering that the construction cost of in-place
materials averaged 4% higher in comparison with the southern states.
These increased costs are attributed to the increase in materials cost
as well as labor costs. Figure 1 is representative of base cost and
should be extrapolated by 4% to attain unit costs in the central region
for the three given construction types.
The northern region exhibited a 3% increase over the in-place unit cost
of the southern region. This increase was atributable primarily to an
increase in cost of materials. Again, this 3% cost increase should be
added to the base cost curves (Figure 1) to attain a unit cost in the
northern region.
2) Projecting Cost. Construction costs in general have greatly in-
creased in the last few years, and the immediate future holds no apparent
relief for this condition (Figures 6 and 7). The "Engineering News Record"
magazine forecast for December 1975 shows an expected 10.7% increase in
the ENR construction cost index over December 1974. Earthwork construc-
tion is an extremely fluxuating branch of the construction field, and
the projecting of any cost index to a given date must be qualified, and
the evaluations put into proper perspective.
17

In
II,
x 4
*OEo
aI 0
a ---- -- - - ----
>' 0
4-2-
IS L.-4-- C
CL 0
C) L) (fl4-
4 E4'0
So.01 UJ +3 cf -) go- - - -- -
41 4w 'A --I-
'.0 t"@ c C Laii
CD ~ Ol -0 3 DC(J U! 09 0.'

U-)
C)
CD
4-)
a, -4-4
0- --- ~- -- - - - - -.- - - - - - - - - - --- 4-)
LO OA :3
- - -1s 0 'o
a c -j
0)0 L
4 L = S,.-*-f- 4..L. 4 C)
4J .0C. C.4-3
Cl I- u4~ o Li toII i~CL~r I--a
-4 F) 4J)
0~~ 0 4 .
o ) tUoL -0 oe (u - - - L. 0
:3 0 - 0'
::3 r-oa - - -0ca L) '00c
U) :3 0 S
E. -- 3 W
W 03. 4
O~ C-
-1' C--C ClC ) )C
'UU'UC

A composit index of construction cost trends for earthwork fills in
floodplains was plotted for the years 1969 through 1975 (Figure 8). The
overall increase of construction costs for this period is 66%. This com-
puted is an average annual increase of 9.43%. This average extrapolated
in a straight line trend over a ten year projection is also plotted on
Figure 8. An earthwork project costing $1.10 per cubic yard in 1969 would
cost $3.04 per cubic yard in the year 1985. To forecast the cost of a
given project, an adjustment to a point on one of the cost curves (Figure
1) must be made in order to account for the period of time between 1975
and the expected construction date. An annual increase of 9.43% must be
added for every year past 1975. Regional variations in construction
costs (Table 1) must also be added to the cost for projects located in
the central or northern region.
Example:
To estimate the cost of a 1,500,000 cubic yard compacted earthwork project
in Iowa, to be constructed in 1980, utilizing the results of this study,
the following steps would be
(1) Locate the 1975 Base Cost for a 1,500,000 cubic yard
compacted earthwork fill project on Figure I ............ $2.00/c.y.
(2) 1980 inflation projection of 9.43% @ 4 years (Table 1). . .. 38%
(3) Regional ' variation for the central study (Table 1) ..... .... 4%
(4) Total cost factor adjustment ....... ..... ............ 42%
(5) Therefore: 1980 unit cost of $2.00/c.y. X 1.42% = $2.84/c.y.
or total estimated project cost for earthwork fill - $4,260,000.
20

2-1 -L _q. - -
LLj-
~Jt U
LLL
C3
0a,
* C:
V)0
) 01
U- -
3:
S.
0
cn
00
-- E
0.
0*
C)'-4
SH1VI11O NI ISOO lINfl

F. APPENDIX
1) StudyParticipants
Arnold J. Bernard Contractor (Monroe, Louisiana)
Alvin E. Benike, Inc. (Rochester, Minnesota)
A.S. Horner Construction Co. (Littleton, Colorado)
Ballew & Roberts Construction Co. (Montgomery, Alabama)
E. W. Johnson Construction Co. (Texarkana, Arkansas)
Gerald H. Phipps, Inc. (Denver, Colorado)
U Gervais F. Favrot Co., Inc. (New Orleans, Louisiana)
Iowa Natural Resources Council (Des Moines, Iowa)
Illinois Division of Water Resources (Springfield, Illinois)
North Dakota State Water Commission (Bismarck, North Dakota)
P.J. Parker Contractor (Poinsett County, Texas)
Roth & Associates (Storm Lake, Iowa)
Southwestern Industrial Contractors (El Paso, Texas)
State of Mississippi Board of Water Commissioners(Jackson, Mississippi)
Texas Water Development Board (Austin, Texas)
U.S. Army Corps of Engineers:
Chicago District (Chicago, Illinois)
Galveston District (Galveston, Texas)
Rock Island District (Rock Island, Illinois)
New Orleans District (New Orleans, Louisiana)
Mobile District (Mobile, Alabama)
Fort Worth District (Fort Worth, Texas)
St. Louis District (St. Louis, Missouri)
Vicksburg District (Vicksburg, Mississippi)
22
U.S. Amy Corps of Engineers: (continued)
Little Rock District (Little Rock, Arkansas)
Tulsa District (Tulsa, Oklahoma)
Wiley Hicks, Jr., General Contractor (Amarillo, Texas)
Waco Construction, Inc. (Waco, Texas)
2) References
a) McGraw-Hill Information Systems Company 1974; Dodge Guide
for Estimating Public Works Construction Cost
b) U.S. Department of Interior 1975; Construction Cost Trends
January 1975 Engineering and Research Center, Office of
Design and Construction, Denver, Colorado
c) McGraw-Hill's Engineering News-Record 1974-1975
23

Cost Estimatinq for Earthwork Fills
Constructed Within Flood Plain Areas
QUESTIONNAIRE
1. DREDGED EARTHWORK FILLS
A. General Description of Project:
1. Location (State and County):_2. Flood Plain Area (River):
3. Date (Month and year): . .... .... . .....
4. Purpose (Fill constructed for foundation, levee, road, bridge approach, etc.):
B. Project Specifics
1. Describe equipment type utilized: (Hydraulic or bucket dredges; horsepoweror machines; discharge statistics-bucket capacity; reach limitations-lifts;pumping distances, production in terms of cu. yd./day):
2. Fill soil types: (Describe general soil class, material weights, sieve re-
quirement):
3. Describe specified compaction requirements: (Secondary equipment utilized
for spreading and grading materials as well as compaction times and methods):
4. Describe special conditions
C. Construction Costs:
Describe any specific cost breakdowns, when possible, as to individual equipmentcost per hour (draglines - dredges-hauling and spreading equipment); specificmaterials cost (clam shells - rip rap-core materials, fuels) and finally a unitcost of in-place materials per cubic yard with all expenses included:__-......
I.I,i (If you feel attachment of the bid summary will answer fthis question, please...
include a copy.)
1. Quantity of total project fill: cu.yd.
2. Unit cost of earthwork fill in place: -__($/cu.yd.)

II. EARTHWORK FILLS - COMPACTED EMBANKMENT CONSTRUCTION
A. General Description of Project:
1. Location (State and County): .. . ..
2. Flood Plain Area (River): _---
3. Date (Month and Year): .. .
4. Purpose (Fill constructed for foundation, levee, road, bridge approach, etc.):
B. Project Speci fics
1. Describe equipment type'utilized: (Describe major types of hauling equip-ment - sizes, carrying capacity, distance of material haul, time/day worked,and production in terms of cu. yd./day): -,
2. Fill Soil Types: (Describe general soil class, material weights, sieve re-quirements):
3. Describe specified compaction requirements: (Compaction times and require-ments):
4. Describe special conditions:
C. Construction Costs:
Describe any specific cost breakdowns, when possible, as to individual equip-ment cost per hour; specific materials cost (clam shells - rip rap (slope pro-tection) core materials - fuels, unit cost of in-place materials per cubic yardwith all expenses included:
1. Quantity of total project fill: cu. yd.
2. Unit cost of earthwork fill in place: ($/cu.yd.
III. INFORMATION SOURCE
A. The above data was provided by the cooperation of
B. This questionnaire was completed by:
Name:Tel ephone:
Thank you for your cooperation in furnishing the above data.
VTN LOUISIANA, INC.2701 Independence StreetMetairie, Louisiana 70002504.455.3881