2 Financial analysis of customer accounts - Osborne Books · Financial analysis of customer...
24
The last chapter outlined the need for an organisation granting credit to obtain and analyse the financial accounts of: n a prospective new business customer, or n an existing business customer It is possible that your assessment will involve a detailed analysis of this type and so a study of this chapter should be seen as useful preparation for your assessment. This analysis involves the business obtaining the financial statements of the customer and carrying out the calculation of performance indicators. The performance indicators normally required include: n liquidity indicators n profitability indicators n financial position indicators, ie levels of borrowing and equity n EBITDA (operational profitability) indicators Your assessment is likely also to require you to apply a credit scoring system to the performance indicators calculated. This credit scoring system will give a numerical value to the results of the performance indicators and the total of these values will then indicate the level of credit risk shown by the financial statements. Financial analysis of customer accounts 2 this chapter covers...
Transcript of 2 Financial analysis of customer accounts - Osborne Books · Financial analysis of customer...
The last chapter outlined the need for an organisation granting credit to obtain andanalyse the financial accounts of:n a prospective new business customer, orn an existing business customer
It is possible that your assessment will involve a detailed analysis of this type and soa study of this chapter should be seen as useful preparation for your assessment.
This analysis involves the business obtaining the financial statements of the customerand carrying out the calculation of performance indicators.
The performance indicators normally required include:n liquidity indicatorsn profitability indicatorsn financial position indicators, ie levels of borrowing and equityn EBITDA (operational profitability) indicators
Your assessment is likely also to require you to apply a credit scoring system to theperformance indicators calculated.
This credit scoring system will give a numerical value to the results of the performanceindicators and the total of these values will then indicate the level of credit risk shownby the financial statements.
Financial analysis ofcustomer accounts
2
this chapter covers...
a n a ly s i n g c u s t o m e r a c c o u n t s
As we have seen in the last chapter, feedback from within the organisation isa valuable source of information for credit assessment. It is essential that itis backed up wherever possible by an analysis of past and up-to-datefinancial statements of the customer. If up-to-date financial statements arenot available, draft accounts or internal management reports should berequested for analysis.
As you will appreciate this requirement will be more appropriate for thelarger customers who prepare these types of accounts. Ideally, at least threeyears’ accounts should be analysed in order to show the trends in three keyareas:n liquidity – the ability of the business to repay debts as they fall duen profitability – the ability of the business to maintain its capital and to
provide funds for repayment of debts in the futuren gearing – the financial risk taken on by the business shown by comparing
interest bearing liabilities and total capital employed
You may well be familiar with the analysis of performance indicators fromyour other studies. If you are unsure about this subject, you arerecommended to study Osborne Books’ Financial Statements Tutorial,Chapter 7, ‘Interpretation of financial statements’.
p e r f o r m a n c e i n d i c a t o r s – i m p o r t a n t n o t eOccasionally there may be differences between the formulas for performanceindicator ratios used in AAT Units. Gearing is an example. This does notmean that these are errors – it reflects the fact that indicators are onlyindicators and they also vary in commercial practice.
w h a t i s a g o o d i n d i c a t o r ?The question is often asked: what is a ‘good’ current ratio or a ‘good’ liquidcapital ratio? The answer is that it is impossible to give a reliable answer.Businesses vary widely in the way their assets and liabilities are structured.There are some guidelines on the next two pages shown as notes, but theyshould be used for guidance only. We explain credit scoring as a method ofassessing credit risk in terms of performance indicators on page 28.
l i q u i d i t y i n d i c a t o r sThese indicators show the ability of the business to repay short-term debtfrom liquid or semi-liquid assets, and also to turn over its current assets suchas inventory and trade receivables.
f i n a n c i a l a n a l y s i s o f c u s t o m e r a c c o u n t s 2 1

2 2 c r e d i t c o n t r o l t u t o r i a l
indicator formula what it shows
current ratio current assets working capitalcurrent liabilities expressed as a ratio
- the higher the better*
* In your assessment you need to express this ratio as the first number of the ratio, forexample a current ratio of 1.5 : 1 is written as ‘1.5’.
liquid capital (‘quick’) ratio current assets – inventory a ratio comparing liquidity current liabilities with short-term debts, but
excluding inventory (which takes longer to turn into cash) - the higher the ratio, the
better** In your assessment this should be a single number, using the formula shown above.
accounts receivable trade receivables x 365 the number of days oncollection period (days) sales revenue average that it takes for a
trade receivable to pay – this will depend on the nature of the business;30 to 60 days is common
accounts payable trade payables x 365 the number of days onpayment period (days) cost of sales average that it takes to pay
a supplier – this will usefully show howpromptly the businesspays its trade payables
inventory holding period inventory x 365 the number of days on(days) cost of sales average that inventory is held
– this will depend entirely on the nature of the inventory; the figure should ideally not increase over time
p r o f i t a b i l i t y i n d i c a t o r sThese indicators show the ability of the business to generate profit which willenable it to repay its debts in the longer term.
indicator formula what it shows
gross profit margin gross profit x 100 profit made beforesales revenue deduction of expenses
– this should remain steadyand in line with the industryaverage

f i n a n c i a l a n a l y s i s o f c u s t o m e r a c c o u n t s 2 3
indicator formula what it shows
operating profit margin profit from operations x 100 profit made beforesales revenue deduction of tax and interest
– this should remain stable
profit for the period margin profit x 100 profit made aftersales revenue deduction of all expenses
– this should ideally increaseover the years, and not fall
interest cover profit before interest & tax the ability of a business to interest pay interest out of its profits
(calculated as a number)– the higher the figure the better (if the profit is negativethe interest cover figure is often stated as zero)
return on equity (or profit x 100 profit made related to thereturn on net assets) equity equity (ie the total assets
minus total liabilities)– the higher the better
return on capital employed operating profit x 100 profit made related to the(roce) capital employed capital employed by the
company (the total equity + the non-current liabilities)– the higher the better
f i n a n c i a l p o s i t i o nFinancial position measures the strength and long-term financing of acompany. The proportion of debt to capital is known as gearing. This showsthe extent to which the company is financed by debt. There are two mainways in which to calculate gearing. Note that ‘total debt’ in the two formulasincludes short-term debt as well as long-term debt. Short-term debt isborrowing on which interest is paid, a bank overdraft being a commonexample. Trade payables are not included in short-term debt (even thoughinterest is sometimes charged on late payments).
As you will see below, the difference between the formulas is the inclusionof external debt with equity on the bottom line of the first formula. This isprobably the more common formula.
gearing total debt x 100 the extent to which thetotal debt + equity business is funded by debt
– the higher the figure, the less secure the company
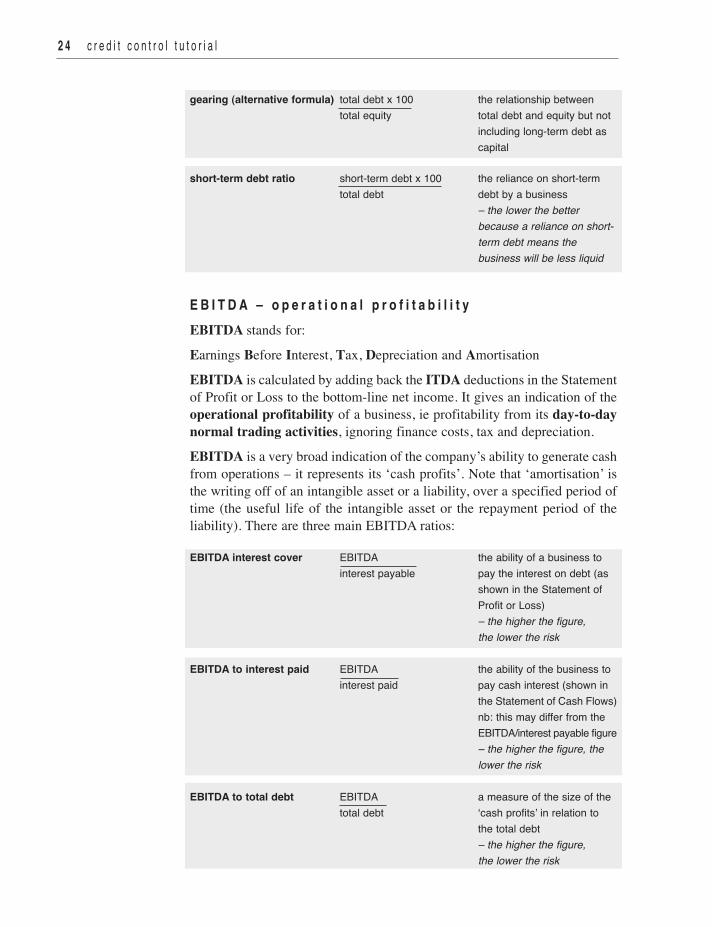
gearing (alternative formula) total debt x 100 the relationship betweentotal equity total debt and equity but not
including long-term debt as capital
short-term debt ratio short-term debt x 100 the reliance on short-termtotal debt debt by a business
– the lower the better because a reliance on short-term debt means the business will be less liquid
e B i t d a – o p e r a t i o n a l p r o f i t a b i l i t yEBITDA stands for:
Earnings Before Interest, Tax, Depreciation and Amortisation
EBITDA is calculated by adding back the ITDA deductions in the Statementof Profit or Loss to the bottom-line net income. It gives an indication of theoperational profitability of a business, ie profitability from its day-to-daynormal trading activities, ignoring finance costs, tax and depreciation.
EBITDA is a very broad indication of the company’s ability to generate cashfrom operations – it represents its ‘cash profits’. Note that ‘amortisation’ isthe writing off of an intangible asset or a liability, over a specified period oftime (the useful life of the intangible asset or the repayment period of theliability). There are three main EBITDA ratios:
eBitda interest cover EBITDA the ability of a business tointerest payable pay the interest on debt (as
shown in the Statement of Profit or Loss)– the higher the figure, the lower the risk
eBitda to interest paid EBITDA the ability of the business to interest paid pay cash interest (shown in
the Statement of Cash Flows)nb: this may differ from theEBITDA/interest payable figure– the higher the figure, the lower the risk
eBitda to total debt EBITDA a measure of the size of thetotal debt ‘cash profits’ in relation to
the total debt– the higher the figure, the lower the risk
2 4 c r e d i t c o n t r o l t u t o r i a l
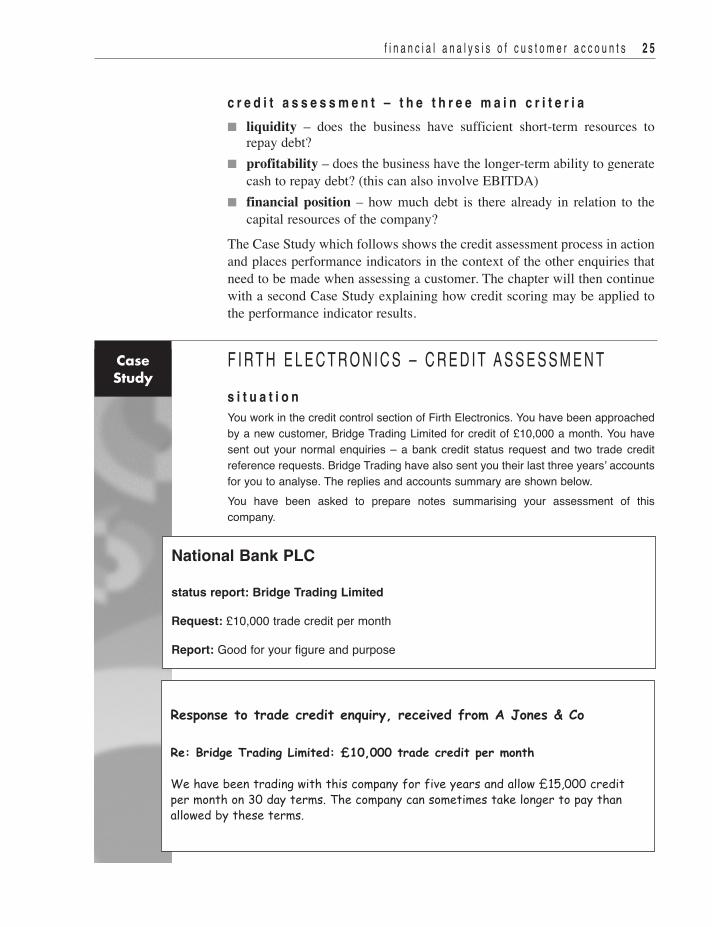
c r e d i t a s s e s s m e n t – t h e t h r e e m a i n c r i t e r i a n liquidity – does the business have sufficient short-term resources to
repay debt? n profitability – does the business have the longer-term ability to generate
cash to repay debt? (this can also involve EBITDA)n financial position – how much debt is there already in relation to the
capital resources of the company?
The Case Study which follows shows the credit assessment process in actionand places performance indicators in the context of the other enquiries thatneed to be made when assessing a customer. The chapter will then continuewith a second Case Study explaining how credit scoring may be applied tothe performance indicator results.
F I r T h E L E C T r o n I C S – C r E D I T A S S E S S m E n T s i t u a t i o nYou work in the credit control section of Firth Electronics. You have been approachedby a new customer, Bridge Trading Limited for credit of £10,000 a month. You havesent out your normal enquiries – a bank credit status request and two trade creditreference requests. Bridge Trading have also sent you their last three years’ accountsfor you to analyse. The replies and accounts summary are shown below. You have been asked to prepare notes summarising your assessment of thiscompany.
f i n a n c i a l a n a l y s i s o f c u s t o m e r a c c o u n t s 2 5
CaseStudy
national Bank Plc
status report: Bridge trading limited
request: £10,000 trade credit per month
report: Good for your figure and purpose
Response to trade credit enquiry, received from A Jones & Co
Re: Bridge Trading Limited: £10,000 trade credit per month
We have been trading with this company for five years and allow £15,000 creditper month on 30 day terms. The company can sometimes take longer to pay thanallowed by these terms.

2 6 c r e d i t c o n t r o l t u t o r i a l
s o l u t i o nYou process the data from the bank report, the two trade references and the threeyears’ accounts, and set out the results in the table shown on the next page.note: you have been asked to calculate gearing on the total debt/(total debt +equity) basis.
SUMMARY OF FINANCIAL ACCOUNTS: BRIDGE TRADING LIMITED
Year 1 Year 2 Year 3*
£000 £000 £000
Sales revenue 1,000 1,200 1,400
Cost of sales 600 800 1,000
Current assets 440 520 600
Current liabilities** 310 355 375
Inventory 200 220 280
Trade receivables 204 230 254
Trade payables 150 161 195
Profit from operations 80 94 112
Interest paid 20 34 32
Net profit 60 60 80
Long-term debt 200 200 250
Equity 400 460 520
* Year 3 was last year and the accounts were made up to 31 December.
** Current liabilities include short-term debt and trade payables only.
Response to trade credit enquiry, received from A Patel
Bridge Trading Limited, £10,000 credit per month
We allow this customer £5,000 credit per month on 60 day terms. The account is usuallypaid on time, although sometimes payment can be late. The figure you quote is higherthan the credit given by us but we know of no reasons why this customer should not beable to fulfil its liabilities.

f i n a n c i a l a n a l y s i s o f c u s t o m e r a c c o u n t s 2 7
You draw the following conclusions:bank reportThis indicates that the bank considers Bridge Trading Limited to be a reasonablecredit risk, which, as far as bank reports go, is a positive response.trade referencesBoth references draw attention to the fact that Bridge Trading Limited does payup, but is often late in doing so. The analysis of the three years’ accounts willtherefore need to concentrate on the liquidity ratios. Late payment can eitherresult from inefficiency or from poor liquidity.analysis of three years’ financial accountsThe profitability ratios (net profit and return on capital employed) and gearingpercentage all suggest a company with manageable debt and a consistentlysound profit record. The interest cover shows an ability to cover interest costsfrom profit.The current ratio and liquid capital (quick) ratio have both improved over the threeyears, although the current ratio does reflect a high level of trade payables (seebelow). The average accounts receivable collection period of 70 days shows thatthe business could be collecting its trade debts more efficiently. It is the accountspayable payment period that gives cause for concern, although there has beensome improvement. The reason is not a lack of liquidity, but is either a consciouspolicy of delaying payment to help with short-term financing, or just a lack ofefficiency. Firth Electronics should not accept similar delays in payment.recommendationBridge Trading Limited should be allowed the credit requested, as there issufficient liquidity in the company, but initially on 30 days’ terms. Payments should be carefully monitored and the company advised that anypersistent late payments could result in withdrawal of credit and an insistence ontrading on cash terms only.
ANALYSIS OF FINANCIAL ACCOUNTS: BRIDGE TRADING LIMITED
Year 1 Year 2 Year 3
Current ratio 1.42 1.46 1.60
Liquid capital (quick) ratio 0.77 0.85 0.85
Inventory holding period 122 days 100 days 102 days
Accounts receivable collection period 74 days 70 days 66 days
Accounts payable payment period 91 days 73 days 71 days
Net profit 6% 5% 6%
Return on capital employed 13.3% 14.2% 14.5%
Interest cover 4.0 times 2.8 times 3.5 times
Gearing 47.37% 46.14% 45.26%
Note: when quoting a ratio in an assessment you should omit the ‘: 1’ For example, you would enter‘1.60’ rather than ‘1.60 : 1’.

u s i n g a c r e d i t s c o r i n g s y s t e m
Credit scoring is a system which give a numerical value to the results of theperformance indicators calculated and the total of these values then indicatesthe level of credit risk shown by the financial statements. Normally a highscore will indicate a low risk, and a low score a high risk. An example of atypical scoring system is shown below and explained on the next page.
2 8 c r e d i t c o n t r o l t u t o r i a l
credit rating (scoring) system scoreProfit from operations marginLosses –5Less than 5% 05% and above but less than 10% 510% and above but less than 20% 1020% and above 20interest coverno cover –30Less than 1 –20more than 1 but less than 2 –10more than 2 but less than 4 04 and above 10current ratioLess than 1 –20Between 1 and 1.25 –10Between 1.26 and 1.5 0Above 1.5 10gearing (total debt/(total debt plus equity))Less than 25% 2025% and above but less than 50% 10more than 50% less than 65% 0Between 65% and 75% –20Between 76% and 80% –40Above 80% –100
risk aggregate scoreVery low risk Between 60 and 21Low risk Between 20 and 1medium risk Between 0 and –24high risk Between –25 and –50Very high risk Above –50
f i n a n c i a l a n a l y s i s o f c u s t o m e r a c c o u n t s 2 9
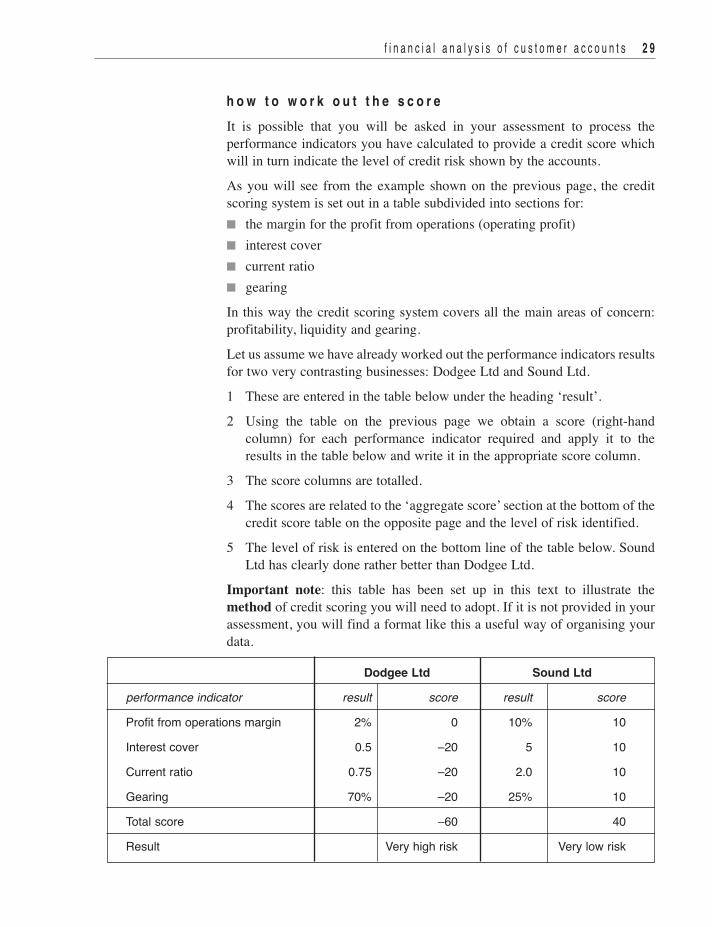
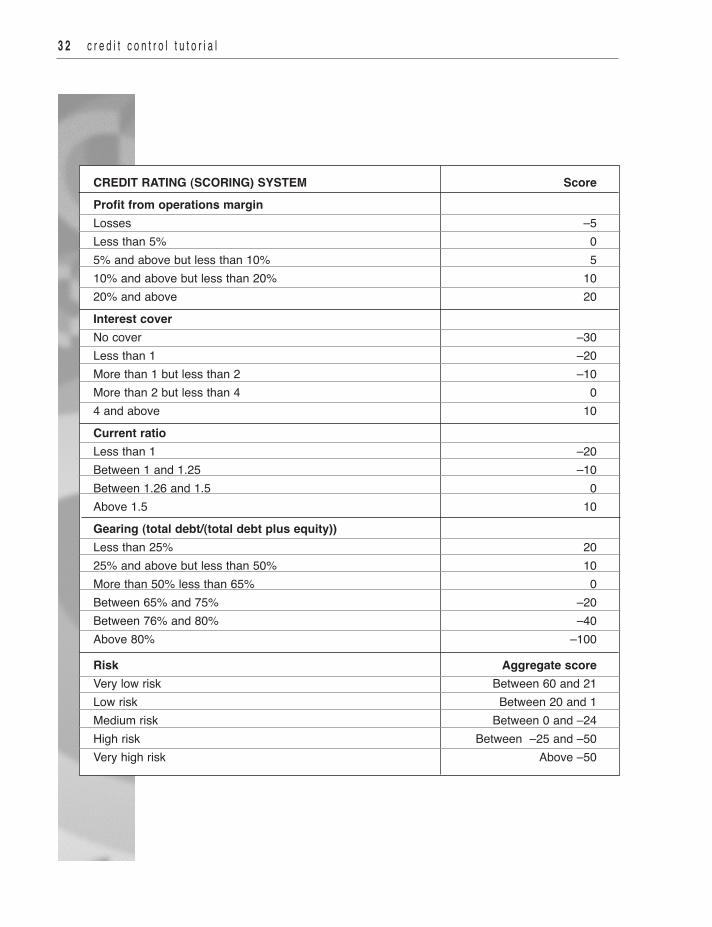
h o w t o w o r k o u t t h e s c o r eIt is possible that you will be asked in your assessment to process theperformance indicators you have calculated to provide a credit score whichwill in turn indicate the level of credit risk shown by the accounts.
As you will see from the example shown on the previous page, the creditscoring system is set out in a table subdivided into sections for:n the margin for the profit from operations (operating profit)n interest covern current ration gearing
In this way the credit scoring system covers all the main areas of concern:profitability, liquidity and gearing.
Let us assume we have already worked out the performance indicators resultsfor two very contrasting businesses: Dodgee Ltd and Sound Ltd.
1 These are entered in the table below under the heading ‘result’.
2 Using the table on the previous page we obtain a score (right-handcolumn) for each performance indicator required and apply it to theresults in the table below and write it in the appropriate score column.
3 The score columns are totalled.
4 The scores are related to the ‘aggregate score’ section at the bottom of thecredit score table on the opposite page and the level of risk identified.
5 The level of risk is entered on the bottom line of the table below. SoundLtd has clearly done rather better than Dodgee Ltd.
Important note: this table has been set up in this text to illustrate themethod of credit scoring you will need to adopt. If it is not provided in yourassessment, you will find a format like this a useful way of organising yourdata.
dodgee ltd sound ltd
performance indicator result score result score
Profit from operations margin 2% 0 10% 10
Interest cover 0.5 –20 5 10
Current ratio 0.75 –20 2.0 10
Gearing 70% –20 25% 10
Total score –60 40
result Very high risk Very low risk

CaseStudy
s h o r t c o m i n g s o f c r e d i t s c o r i n gIt should be pointed out that not all accounts will be credit scored in this way.In fact it is a rather arbitrary way of making a judgement of credit risk as itdoes not take in the other opinions that can be obtained from creditreferences given by banks, traders and other sources. For example it may bethat you find out from the press that Sound Ltd (see the example on theprevious page) is a major supplier to a manufacturer that has gone intoliquidation. This could have a major effect on its future liquidity. Creditscoring would not tell you that.
There now follows a Case Study which covers the whole process ofcalculating performance indicators and credit scoring the results.
I P E x L I m I T E D : C r E D I T A S S E S S m E n T A n D C r E D I T S C o r I n Gs i t u a t i o nYou work in the credit control section of Ipex Limited which uses a credit rating(scoring) system to assess the credit status of new and existing customers. You have been asked to carry out three tasks on the last two years’ accounts ofKennedy Enterprises Ltd, a new customer that has requested a £50,000 creditlimit.1 Calculate the performance indicators shown in the table below, using the
financial data shown on the next page for both Year 2 and Year 1. You areto complete the ‘Indicator’ column below as appropriate.
2 Calculate the credit score on the basis of the table on page 32. You are tocomplete the ‘Score’ column below as appropriate.
3 State the level of risk shown by the credit score.
3 0 c r e d i t c o n t r o l t u t o r i a l
Kennedy enterprises limited indicator score indicator scoreYear 2 Year 2 Year 1 Year 1
operating profit margin %
Interest cover
Current ratio
Gearing %
Total score
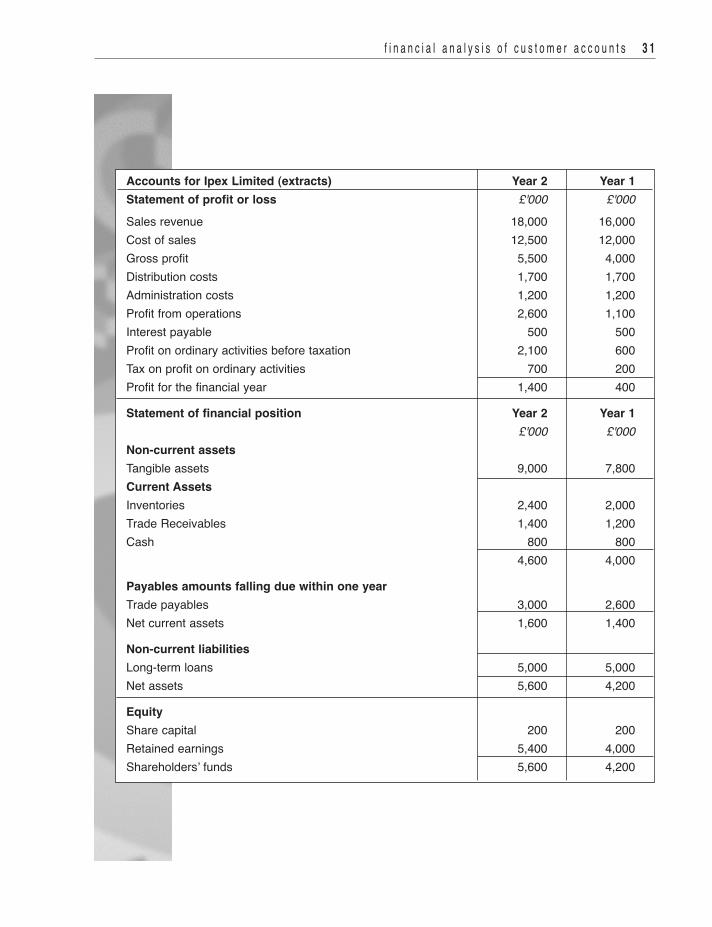
f i n a n c i a l a n a l y s i s o f c u s t o m e r a c c o u n t s 3 1
accounts for ipex limited (extracts) year 2 year 1statement of profit or loss £'000 £'000Sales revenue 18,000 16,000Cost of sales 12,500 12,000Gross profit 5,500 4,000Distribution costs 1,700 1,700Administration costs 1,200 1,200Profit from operations 2,600 1,100Interest payable 500 500Profit on ordinary activities before taxation 2,100 600Tax on profit on ordinary activities 700 200Profit for the financial year 1,400 400
statement of financial position year 2 year 1£'000 £'000
non-current assetsTangible assets 9,000 7,800current assetsInventories 2,400 2,000Trade receivables 1,400 1,200Cash 800 800
4,600 4,000
Payables amounts falling due within one yearTrade payables 3,000 2,600net current assets 1,600 1,400
non-current liabilitiesLong-term loans 5,000 5,000net assets 5,600 4,200
equityShare capital 200 200retained earnings 5,400 4,000Shareholders’ funds 5,600 4,200
3 2 c r e d i t c o n t r o l t u t o r i a l
credit rating (scoring) system scoreProfit from operations marginLosses –5Less than 5% 05% and above but less than 10% 510% and above but less than 20% 1020% and above 20interest coverno cover –30Less than 1 –20more than 1 but less than 2 –10more than 2 but less than 4 04 and above 10current ratioLess than 1 –20Between 1 and 1.25 –10Between 1.26 and 1.5 0Above 1.5 10gearing (total debt/(total debt plus equity))Less than 25% 2025% and above but less than 50% 10more than 50% less than 65% 0Between 65% and 75% –20Between 76% and 80% –40Above 80% –100
risk aggregate scoreVery low risk Between 60 and 21Low risk Between 20 and 1medium risk Between 0 and –24high risk Between –25 and –50Very high risk Above –50
s o l u t i o n
tasks 1 and 2
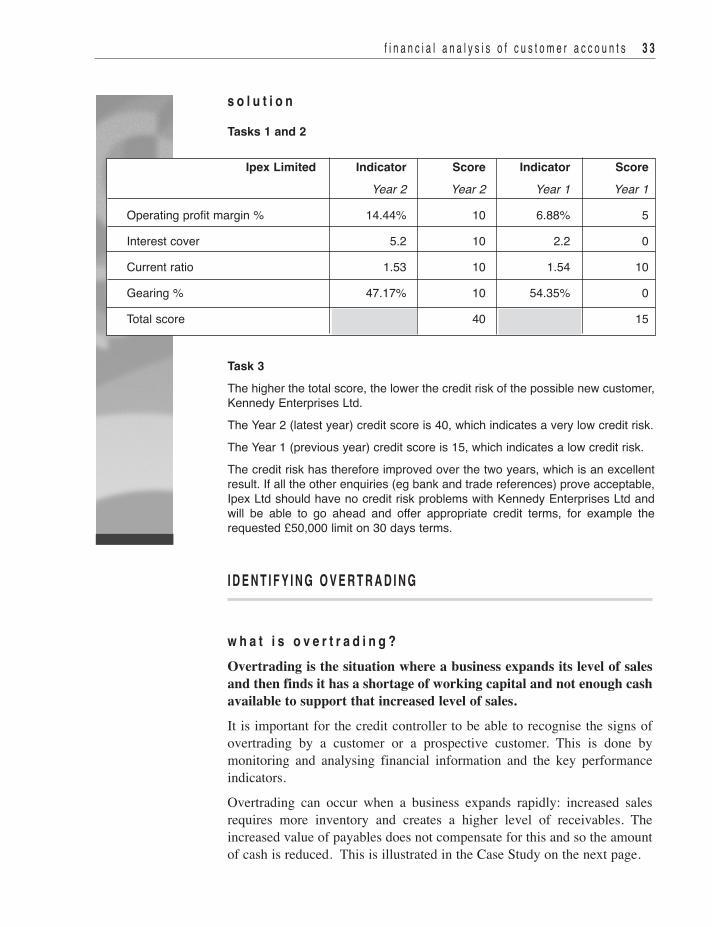
task 3The higher the total score, the lower the credit risk of the possible new customer,Kennedy Enterprises Ltd. The Year 2 (latest year) credit score is 40, which indicates a very low credit risk.The Year 1 (previous year) credit score is 15, which indicates a low credit risk.The credit risk has therefore improved over the two years, which is an excellentresult. If all the other enquiries (eg bank and trade references) prove acceptable,Ipex Ltd should have no credit risk problems with Kennedy Enterprises Ltd andwill be able to go ahead and offer appropriate credit terms, for example therequested £50,000 limit on 30 days terms.
f i n a n c i a l a n a l y s i s o f c u s t o m e r a c c o u n t s 3 3
ipex limited indicator score indicator scoreYear 2 Year 2 Year 1 Year 1
operating profit margin % 14.44% 10 6.88% 5
Interest cover 5.2 10 2.2 0
Current ratio 1.53 10 1.54 10
Gearing % 47.17% 10 54.35% 0
Total score 40 15
i d e n t i f y i n g o v e r t r a d i n g
w h a t i s o v e r t r a d i n g ?Overtrading is the situation where a business expands its level of salesand then finds it has a shortage of working capital and not enough cashavailable to support that increased level of sales.
It is important for the credit controller to be able to recognise the signs ofovertrading by a customer or a prospective customer. This is done bymonitoring and analysing financial information and the key performanceindicators.
Overtrading can occur when a business expands rapidly: increased salesrequires more inventory and creates a higher level of receivables. Theincreased value of payables does not compensate for this and so the amountof cash is reduced. This is illustrated in the Case Study on the next page.

S T r A P T- 4 - C A S h L I m I T E D : o V E r T r A D I n GStrapt-4-Cash Limited, used to be a well-run family business run by the Adamsfamily. At the end of the year it had a working capital of £180,000. The situationchanged when the managing Director, John Adams, retired in January and hisson Denver took over his post and the running of the business. he immediatelyset about increasing sales by cutting prices and taking on more sales reps.As a result, sales, inventories, trade receivables and trade payables all increasedby 50%. Unfortunately there were no further resources available for workingcapital, which remained at £180,000, as shown by the two sets of figures below:
before £ after £Inventory 100,000 150,000Trade receivables 140,000 210,000Bank 40,000 (30,000)Less trade payables (100,000) (150,000)Working Capital 180,000 180,000
The old managing Director, John Adams, was unpleasantly surprised on a visit tothe company to see that the bank account, which was previously kept well incredit was now £30,000 overdrawn. he spotted that trade payables hadincreased to £150,000 with a number of those accounts overdue and demandingpayment. he also noted that credit control had become lax and receivableaccounts were not paying up on time. It was a classic case of overtrading andregrettably Strapt-4-Cash went into liquidation within the year.
3 4 c r e d i t c o n t r o l t u t o r i a l
CaseStudy
o v e r t r a d i n g – t h e w a r n i n g s i g n sOvertrading can occur even if the business is profitable, and it can result inthe business having to cease trading. These are the usual warning signs:n rapidly increasing sales without an increase in resources (eg new capital
being introduced)n a reduction in the level of credit control, resulting in lengthening credit
periods and trade receivables not paying on time, or at alln a consequent increase in irrecoverable debtsn cash balances reducing and the bank account going overdrawn on a
regular or a permanent (‘hard core’) basisn suppliers not being paid on timen profit margins falling
o v e r t r a d i n g – r e m e d i e sA business which is overtrading can try and remedy the situation by:n reducing sales levels to a manageable level n managing the sales ledger accounts more effectively n increasing resources through the introduction of fresh capital

f i n a n c i a l a n a l y s i s o f c u s t o m e r a c c o u n t s 3 5
n A valuable exercise in credit assessment is the ratio analysis of customerfinancial accounts – preferably from three consecutive years. ratio analysiswill extract performance indicators relating to liquidity, profitability and thefinancial position. All of these will provide information about the customer’sability to repay invoices when they fall due.Individual performance indicators are listed in the Key Terms below.
n A technique used to assess the credit risk of an organisation is creditscoring. This applies a numerical value, known as a ‘rating’ or ‘score’ to anumber of performance indicators and the total of these ‘scores’ is appliedto a scale of risk which runs from very high risk (very low score) to very lowrisk (very high score).
n Credit scoring is a useful technique, but it must be used in combination withother assessment methods, for example bank and trade references, whichmay reveal information and trends not shown in purely numerical analysis.
n overtrading is the situation where a business expands its level of sales andthen finds it has a shortage of working capital and not enough cashavailable to support that increased level of sales. overtrading can lead tothe failure of the business as the working capital dries up.
liquidity indicators performance indicators which show the extent of theliquidity of a business, ie its ability to repay short-term liabilities:
current ratio current assets working capitalcurrent liabilities expressed as a ratio
liquid capital (‘quick’) ratio current assets – inventory a ratio comparing liquidity current liabilities with short-term debts, but
excluding inventory
accounts receivables trade receivables x 365 the number of days oncollection period (days) sales revenue average that it takes for a
trade receivable to pay
accounts payable trade payables x 365 the number of days onpayment period (days) cost of sales average that it takes to pay
a supplier
inventory holding period inventory x 365 the number of days on(days) cost of sales average that inventory is held
ChapterSummary
KeyTerms

profitability indicators these ratios show the ability of the business togenerate the profit needed to provide liquidity:
gross profit margin gross profit x 100 profit made beforesales revenue deduction of expenses
operating profit margin profit from operations x 100 profit made beforesales revenue deduction of tax and interest
profit for the period margin profit x 100 profit made aftersales revenue deduction of all expenses
interest cover profit before interest and tax the ability of a business to interest pay interest out of its profits
return on capital employed operating profit x 100 profit made related to the(roce) capital employed total equity + non-current
liabilities
financial position the extent of the reliance of the business on externaldebt as opposed to capital – the less dependent thebusiness is on external financing, the better it will beable to repay its own debts:
gearing (common formula) total debt x 100 the extent to which thetotal debt + equity business is financed by debt
gearing (alternative formula) total debt x 100 the relationship betweenequity total debt and equity but
excluding long-term debt as equity
short-term debt ratio short-term debt x 100 the reliance on short-termtotal debt debt by a business
eBitda earnings Before interest, tax, depreciation and amortisation – indicators of operational profitability
eBitda interest cover EBITDA the ability of a business tointerest payable pay the debt interest shown in
the Statement of Profit or Loss
eBitda to interest paid EBITDA the ability of the business tointerest paid pay cash interest shown in
the Statement of Cash Flows
eBitda to total debt EBITDA a measure of ‘cash profits’ intotal debt relation to total debt
3 6 c r e d i t c o n t r o l t u t o r i a l

f i n a n c i a l a n a l y s i s o f c u s t o m e r a c c o u n t s 3 7
2.1 You are assessing an application for a credit limit of £20,000 from a new customer, SwordsafeLimited. The company has provided you with a summary of its accounts for the last three years (see below).
(a) you are to calculate the performance indicators listed in the left-hand column of the table on the next page for Years 1,2 and 3 and insert the figures in the appropriate columns. Work to two decimal places, except for the gearing and the days for the collection and payment periods which should be rounded to the nearest whole number.When entering the answer for the current ratio and liquid capital (quick) ratio, enter only thefirst part of the ratio and omit the ‘: 1’ which forms the second part of the ratio.
EXTRACT FROM FINANCIAL ACCOUNTS: SWORDSAFE LIMITED
Year 1 Year 2 Year 3
£000 £000 £000
Sales revenue 750 781 720
Purchases 350 363 348
Current assets 360 353 375
Current liabilities 340 330 364
Short-tem debt (included in current liabilities) 120 110 115
Inventory 200 220 280
Trade receivables 88 93 95
Trade payables 58 63 62
Profit from operations 80 86 94
Interest paid 60 71 80
Profit for the period 20 15 14
Long-term debt 121 150 190
Equity 125 145 145
Activities

3 8 c r e d i t c o n t r o l t u t o r i a l
year 1 year 2 year 3
Current ratio
Liquid capital (quick) ratio
Accounts receivable collection period
Accounts payable payment period
Profit for the period %
Interest cover
Gearing
(b) you are to write comments on the performance indicators under the headings set out below:
liquidity
ProfitaBility

f i n a n c i a l a n a l y s i s o f c u s t o m e r a c c o u n t s 3 9
financial Position
(c) State whether you consider that Swordsafe Limited should be granted the requested credit limit of£20,000.
yes no4 4
2.2 You decide to make a list of the warning signs shown by a company which is overtrading.you are to tick the trends below which can indicate that a company is overtrading.
4
(a) Falling sales and no injections of capital
(b) Trade receivables taking less time to pay their accounts
(c) An increasing number of irrecoverable debts
(d) Suppliers not being paid on time
(e) rising profitability
(f) A decline in operating profit
(g) A fall in the trade receivables payment period
(h) A fall in the trade payables collection period
(i) An increase in level of the bank overdraft
(j) An increasing tendency for the bank account to remain overdrawn
(k) A substantial increase in the level of sales and no injection of capital
4 0 c r e d i t c o n t r o l t u t o r i a l
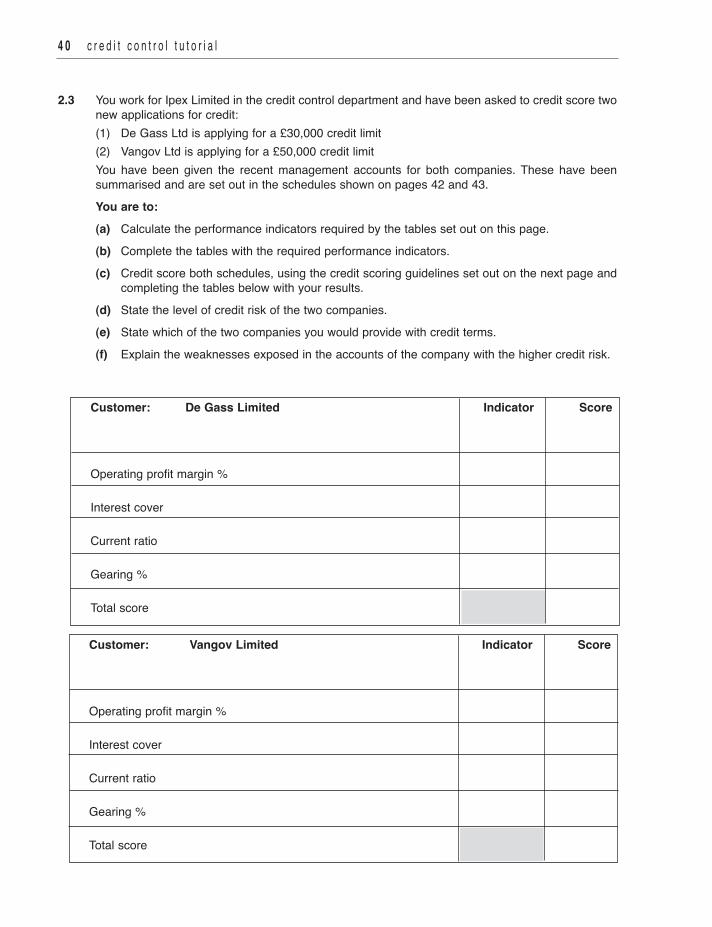
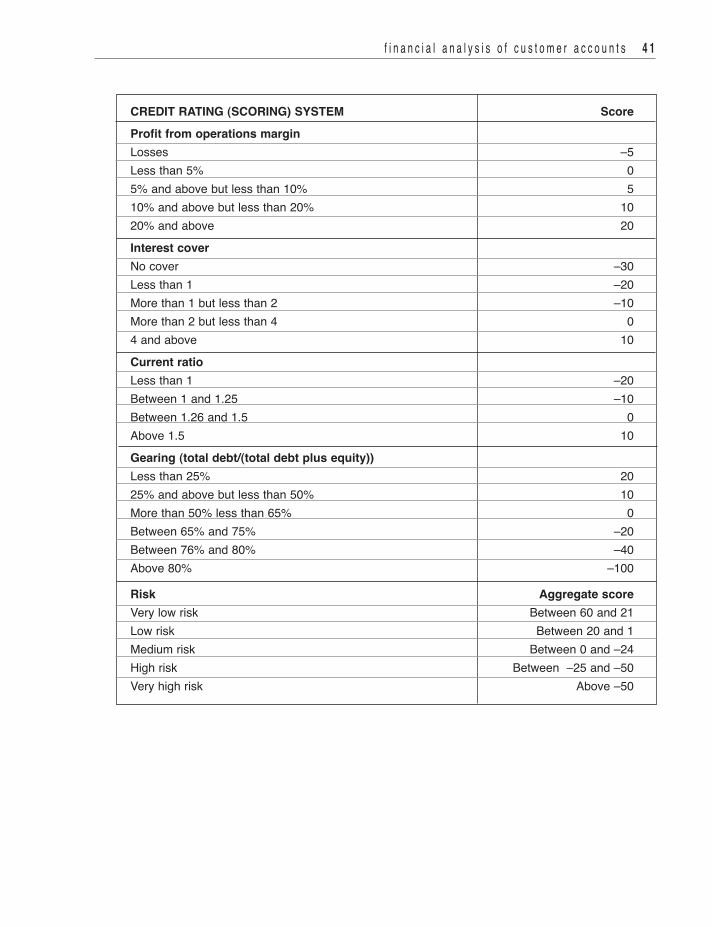
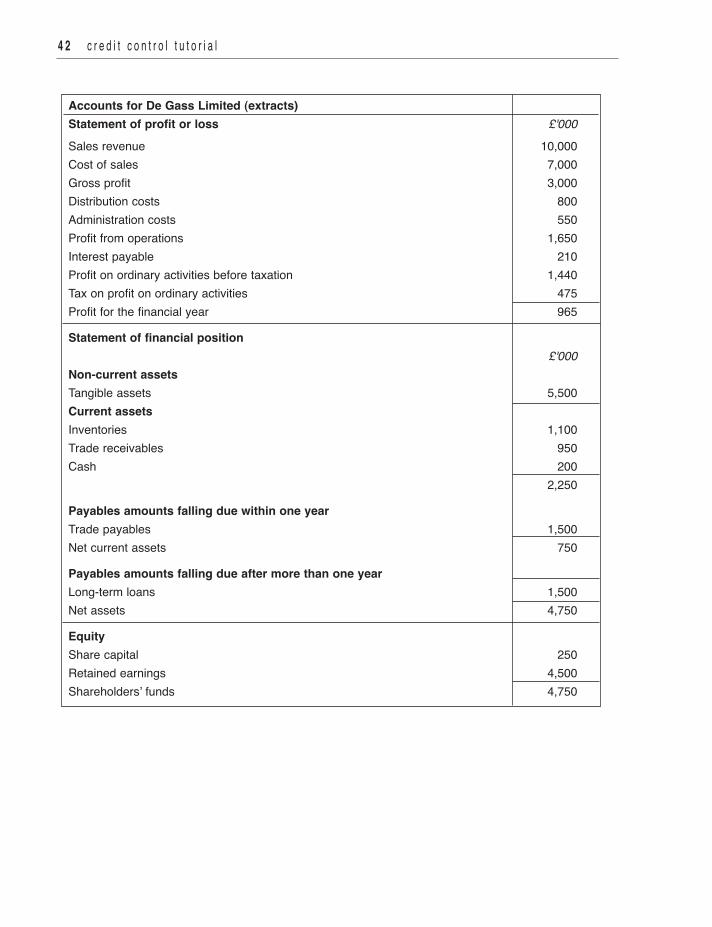
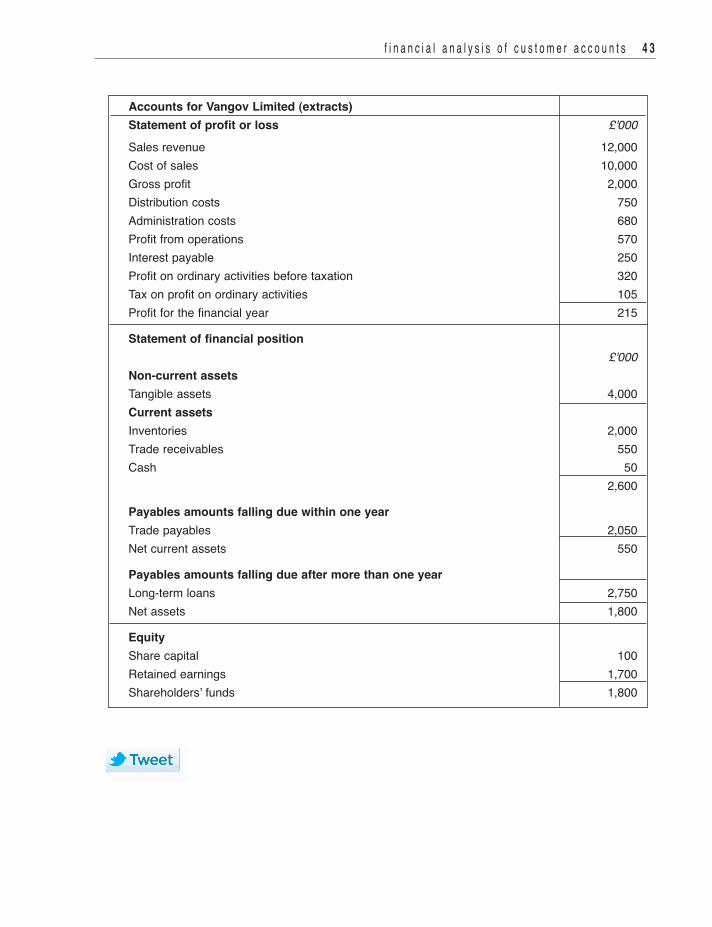
2.3 You work for Ipex Limited in the credit control department and have been asked to credit score twonew applications for credit:(1) De Gass Ltd is applying for a £30,000 credit limit(2) Vangov Ltd is applying for a £50,000 credit limitYou have been given the recent management accounts for both companies. These have beensummarised and are set out in the schedules shown on pages 42 and 43.you are to:(a) Calculate the performance indicators required by the tables set out on this page.(b) Complete the tables with the required performance indicators.(c) Credit score both schedules, using the credit scoring guidelines set out on the next page and
completing the tables below with your results.(d) State the level of credit risk of the two companies.(e) State which of the two companies you would provide with credit terms.(f) Explain the weaknesses exposed in the accounts of the company with the higher credit risk.
customer: de gass limited indicator score
operating profit margin %
Interest cover
Current ratio
Gearing %
Total score
customer: vangov limited indicator score
operating profit margin %
Interest cover
Current ratio
Gearing %
Total score
f i n a n c i a l a n a l y s i s o f c u s t o m e r a c c o u n t s 4 1
credit rating (scoring) system scoreProfit from operations marginLosses –5Less than 5% 05% and above but less than 10% 510% and above but less than 20% 1020% and above 20interest coverno cover –30Less than 1 –20more than 1 but less than 2 –10more than 2 but less than 4 04 and above 10current ratioLess than 1 –20Between 1 and 1.25 –10Between 1.26 and 1.5 0Above 1.5 10gearing (total debt/(total debt plus equity))Less than 25% 2025% and above but less than 50% 10more than 50% less than 65% 0Between 65% and 75% –20Between 76% and 80% –40Above 80% –100
risk aggregate scoreVery low risk Between 60 and 21Low risk Between 20 and 1medium risk Between 0 and –24high risk Between –25 and –50Very high risk Above –50
4 2 c r e d i t c o n t r o l t u t o r i a l
accounts for de gass limited (extracts)statement of profit or loss £'000Sales revenue 10,000Cost of sales 7,000Gross profit 3,000Distribution costs 800Administration costs 550Profit from operations 1,650Interest payable 210Profit on ordinary activities before taxation 1,440Tax on profit on ordinary activities 475Profit for the financial year 965
statement of financial position£'000
non-current assetsTangible assets 5,500current assetsInventories 1,100Trade receivables 950Cash 200
2,250
Payables amounts falling due within one yearTrade payables 1,500net current assets 750
Payables amounts falling due after more than one yearLong-term loans 1,500net assets 4,750
equityShare capital 250retained earnings 4,500Shareholders’ funds 4,750
f i n a n c i a l a n a l y s i s o f c u s t o m e r a c c o u n t s 4 3
accounts for vangov limited (extracts)statement of profit or loss £'000Sales revenue 12,000Cost of sales 10,000Gross profit 2,000Distribution costs 750Administration costs 680Profit from operations 570Interest payable 250Profit on ordinary activities before taxation 320Tax on profit on ordinary activities 105Profit for the financial year 215
statement of financial position£'000
non-current assetsTangible assets 4,000current assetsInventories 2,000Trade receivables 550Cash 50
2,600
Payables amounts falling due within one yearTrade payables 2,050net current assets 550
Payables amounts falling due after more than one yearLong-term loans 2,750net assets 1,800
equityShare capital 100retained earnings 1,700Shareholders’ funds 1,800