2-Dimensional Electrophoresisalereimondo.no-ip.org/Electrophoresis/uploads/8/4.Proteomics.pdf ·...
60
2-Dimensional Electrophoresis
Transcript of 2-Dimensional Electrophoresisalereimondo.no-ip.org/Electrophoresis/uploads/8/4.Proteomics.pdf ·...

2-Dimensional Electrophoresis
����� ��

Proteomics Pathway

Proteomics Pathway

History of 2-DE
n1956
-paper & starch gel
n1975
-Coupling of IEF & SDS-PAGE

n IPG-IEF
uImmobilized pH Gradient
uIsoElectric Focusing
uCan use pH gradients 3-12
2DE-Techniques


History of IEFn NEPHGE (Non-Equilibrium pH
Gradient Electrophoresis)
n IPG IEF (Immobilized pH Gradient IEF)

IEF – pH Rangen Range of pH 3-12
n Majority falling between pH 4-7
n Ex: BIO-RAD commercial strip pH range

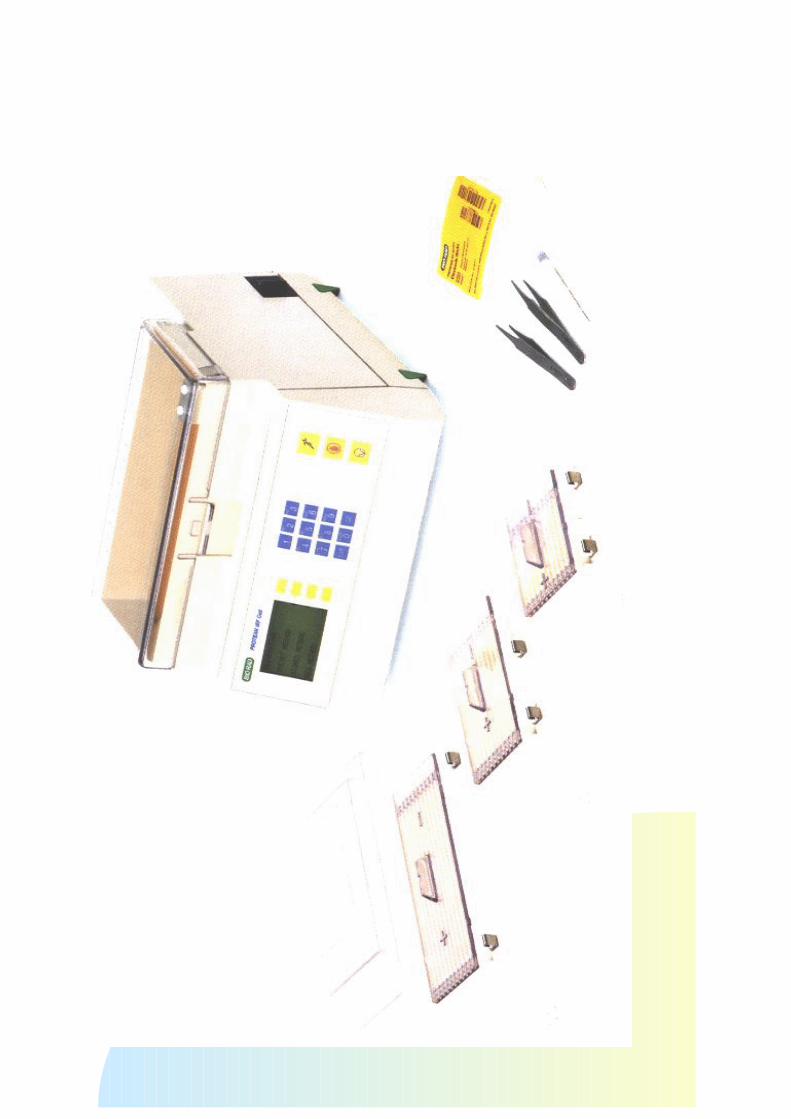
IEF
1.Rehydration
2.Wick
3.Conditioning time
4.Voltage ramping
5.Final focusing
6.Hold step
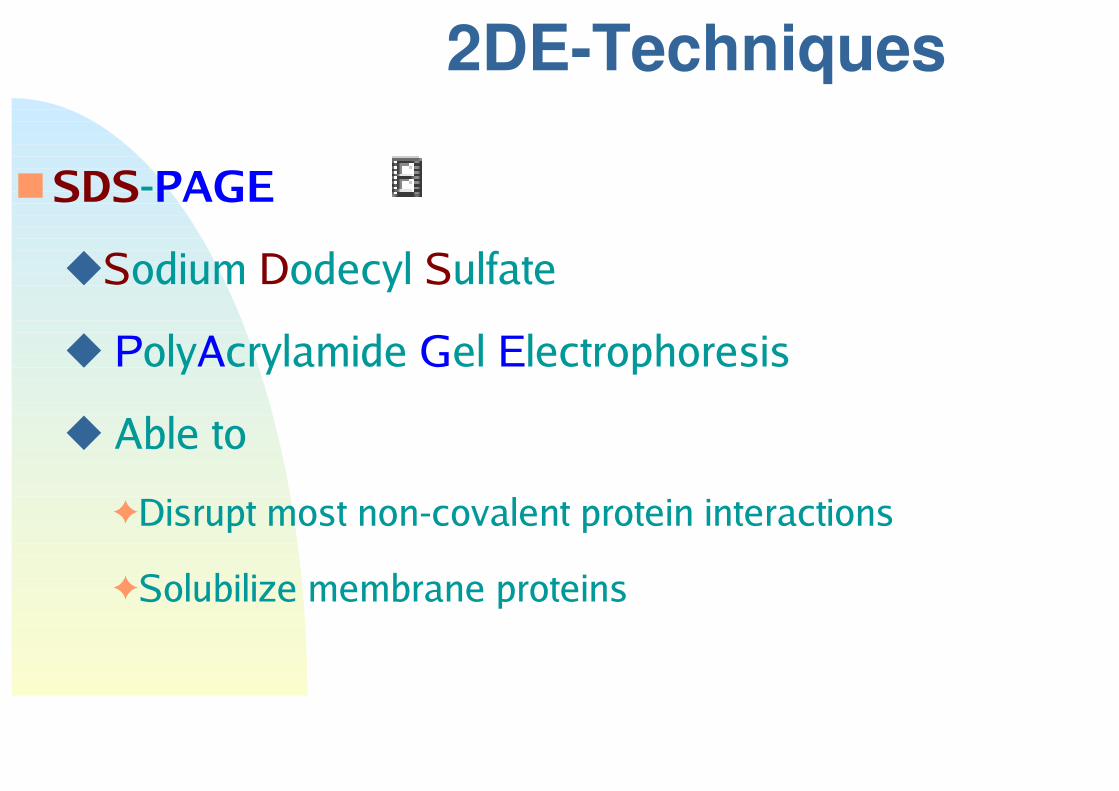
2DE-Techniques
n SDS-PAGE
uSodium Dodecyl Sulfate
u PolyAcrylamide Gel Electrophoresis
u Able to
FDisrupt most non-covalent protein interactions
FSolubilize membrane proteins

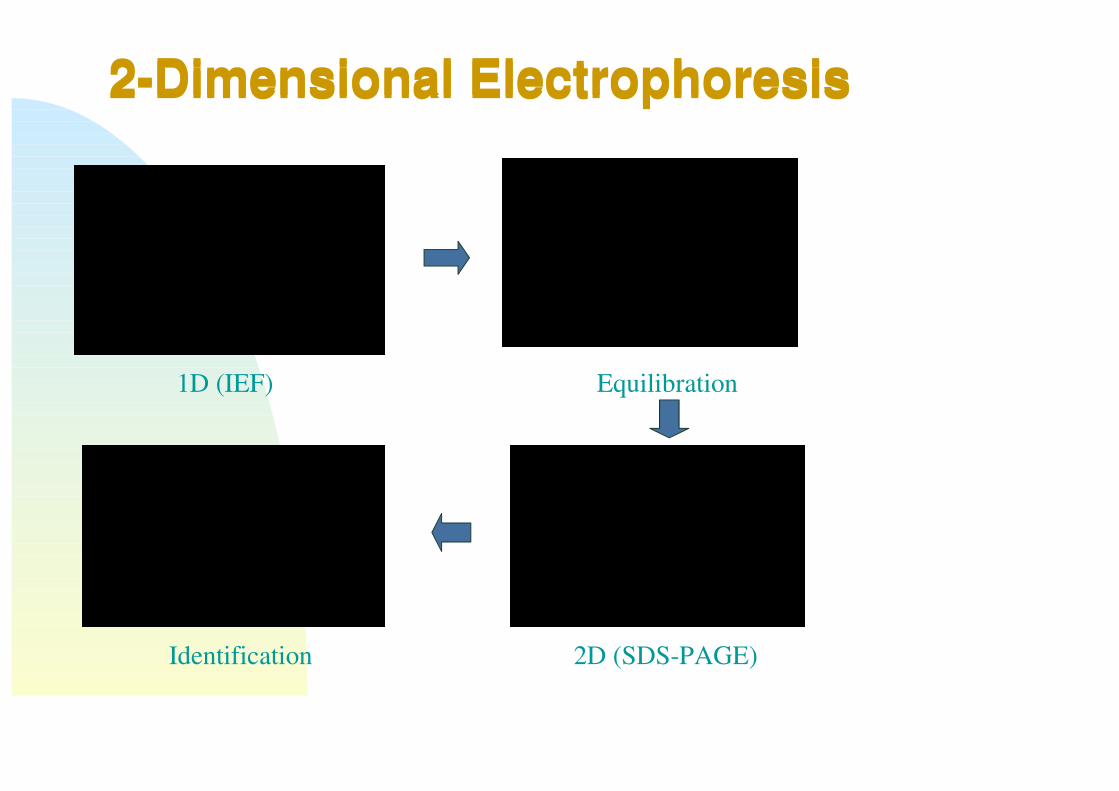
2-Dimensional Electrophoresis 2-Dimensional Electrophoresis
1D (IEF) Equilibration
2D (SDS-PAGE)Identification
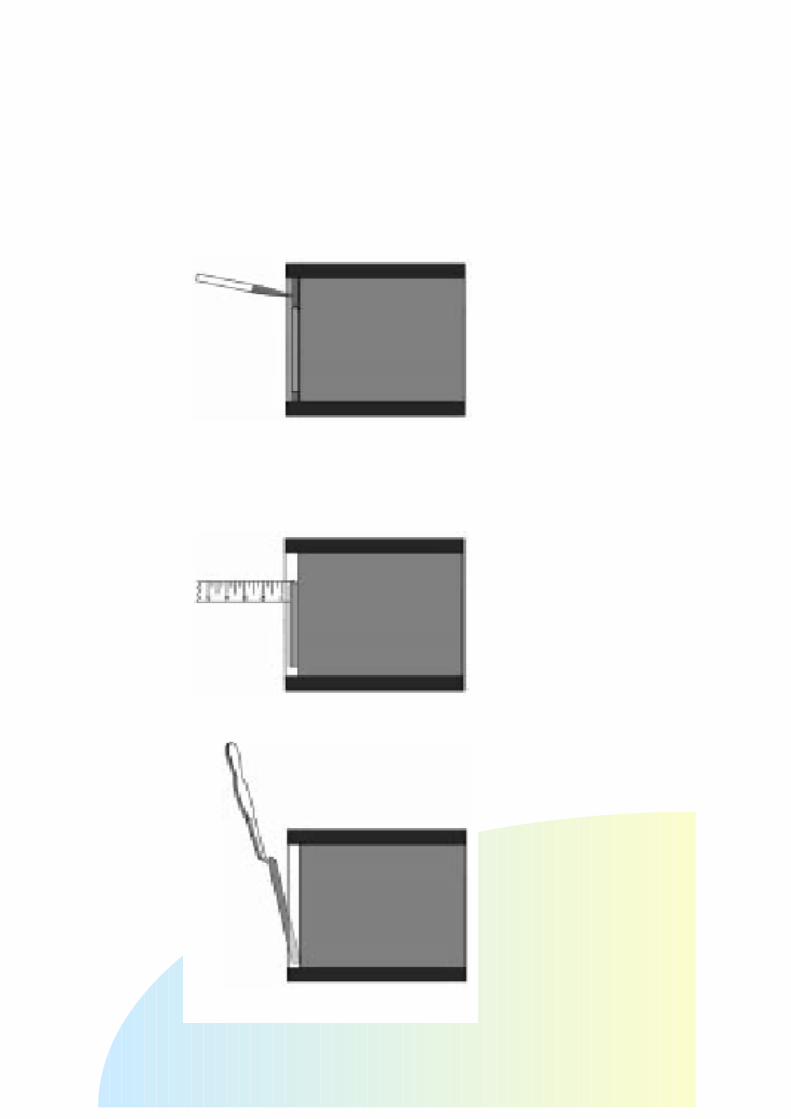
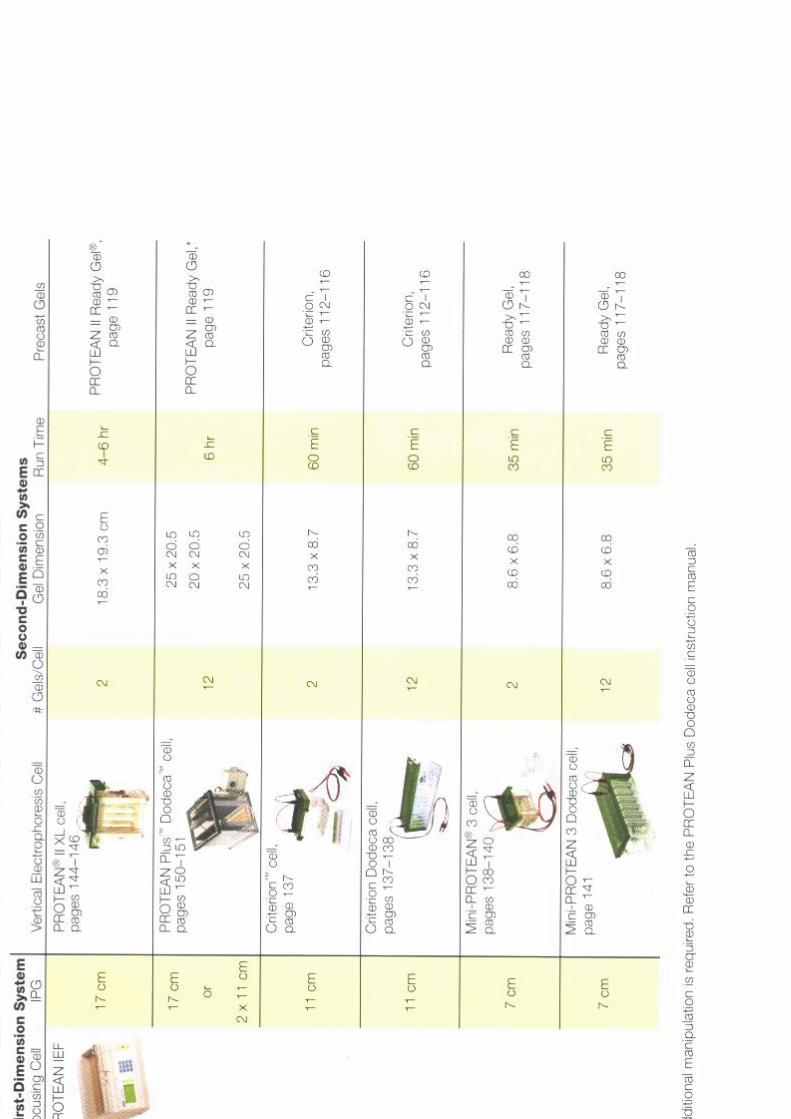


SDS-PAGE
IEF
+

Sample preparation
n Solubility, size, charge, isoelectric point
n No universal method due to the diverse nature of samples.
n Essential to minimize protein modifications.
n Protease
n Salt
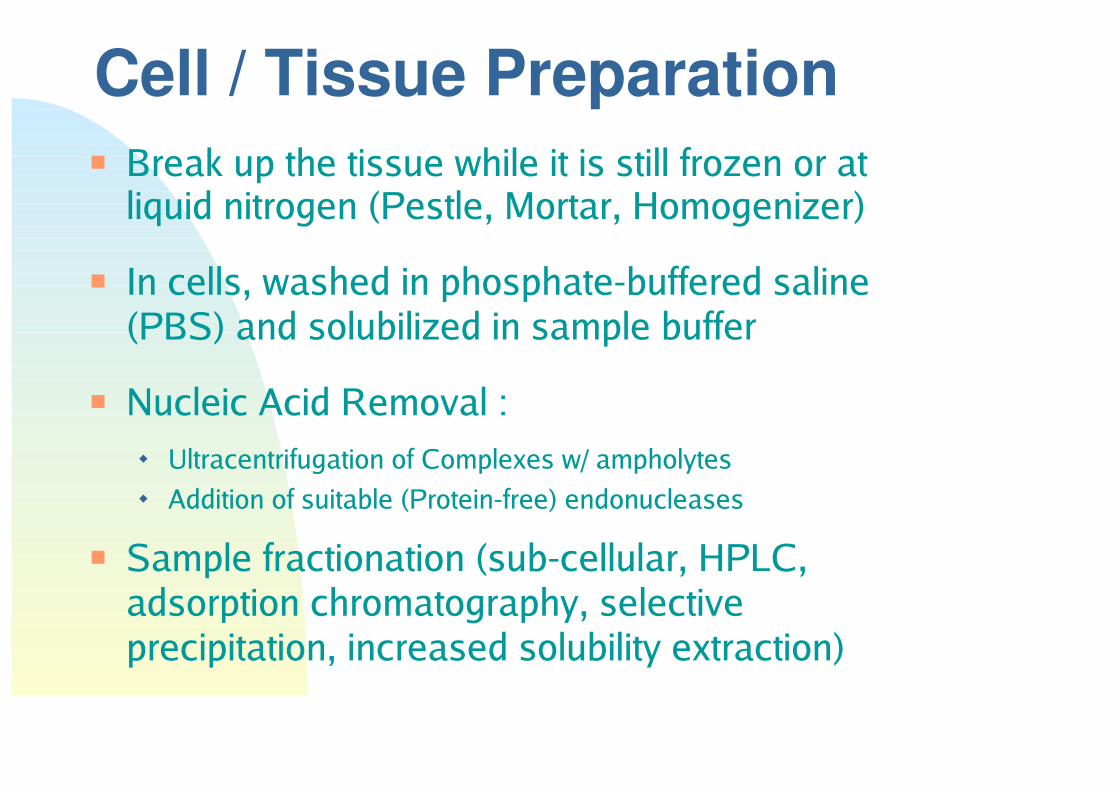
Cell / Tissue Preparationn Break up the tissue while it is still frozen or at
liquid nitrogen (Pestle, Mortar, Homogenizer)
n In cells, washed in phosphate-buffered saline (PBS) and solubilized in sample buffer
n Nucleic Acid Removal :
u Ultracentrifugation of Complexes w/ ampholytes
u Addition of suitable (Protein-free) endonucleases
n Sample fractionation (sub-cellular, HPLC, adsorption chromatography, selective precipitation, increased solubility extraction)

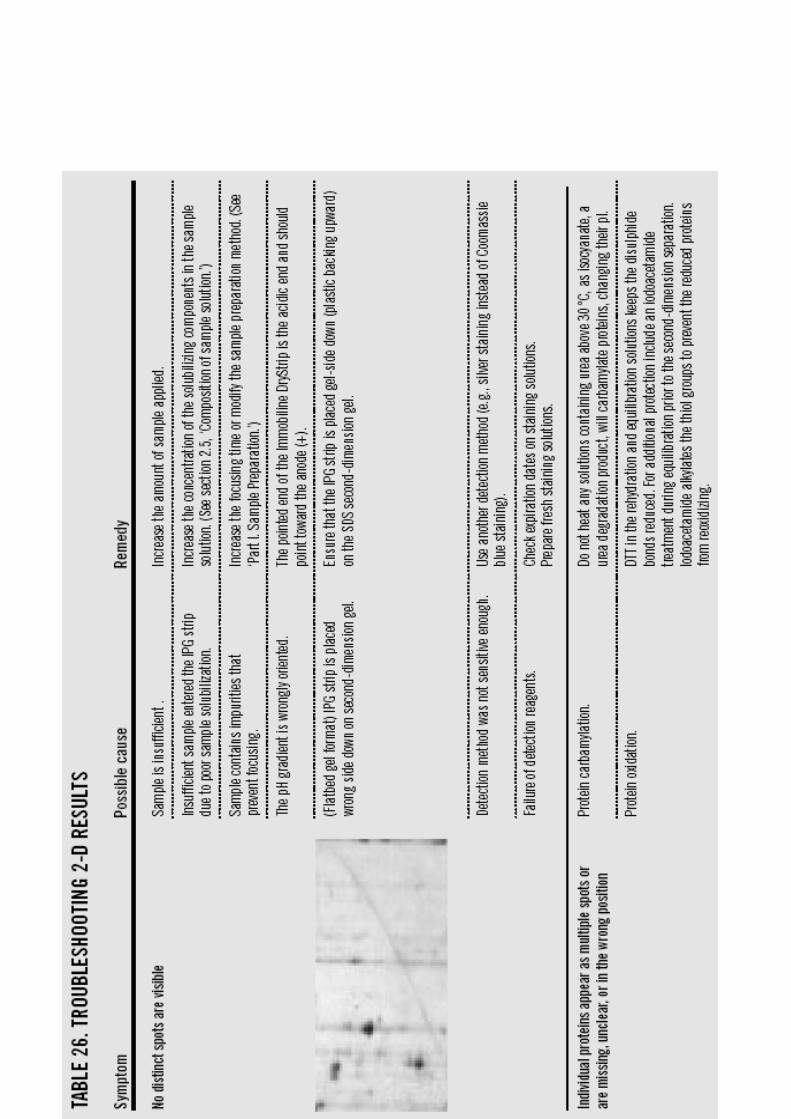
Troubleshooting

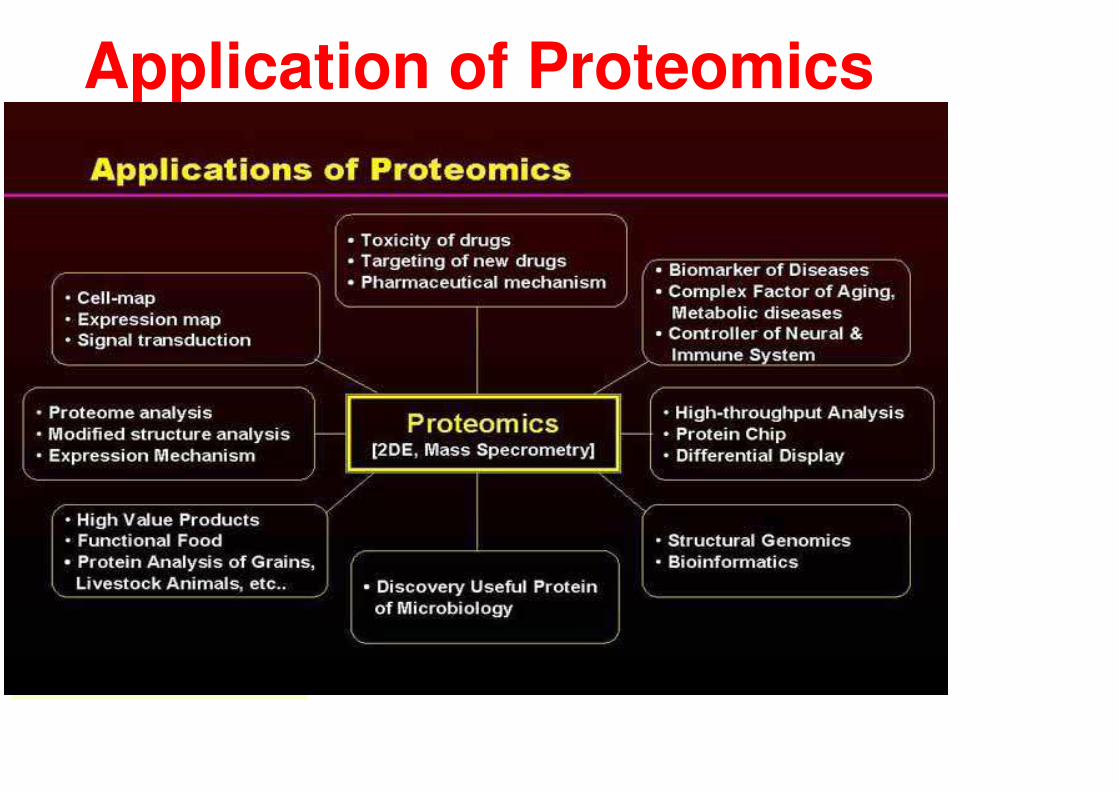
Application of Proteomics


n Introductionn Organic dyes and silver stainsn Reverse stainsn Colloidal dispersion stainsn Organic fluorophore stainsn Metal chelate stains
Detecting proteins in polyacrylamide gels and on electroblot membrane
Introduction
n History of stains used to visualize proteinsu Bromophenol blue Amido black
Coomassie blue R-250 Coomassie blue G-250 Silver staining Colloidal staining Negative staining SYPRO Red, Orange, Ruby staining

Organic dyes
n Organic dyesu Coomassie blue: wide spread popularity
since its introduction in the early 1960s, capable of detecting as little as 30-100ng (limit 8-10ng)
u Amido black : largely relegated to medium sensitivity, colorimetric detection of electro blotted proteins on PVDF and nitrocellulose membranes

Coomassie blue

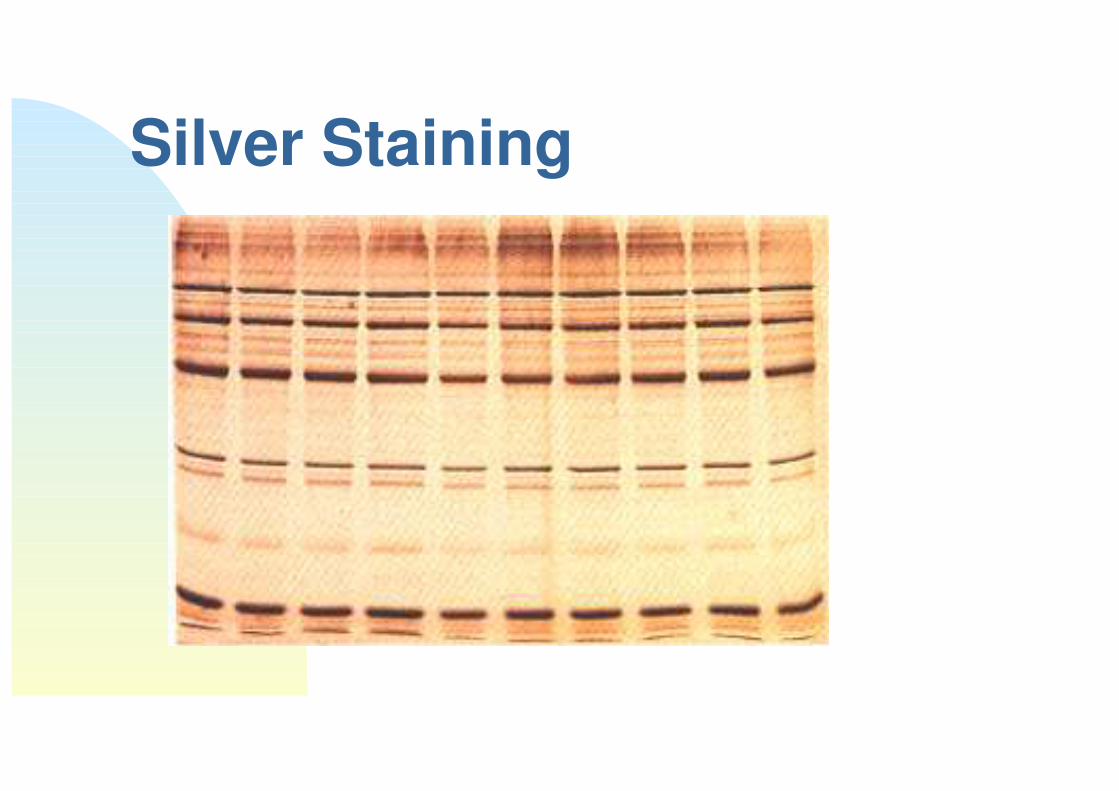
Silver Stainsn Silver staining
u Detection sensitivity: 0.6-1.2ng
u Alkaline/silver diamine and acidic/silver nitrate are most commonly used
F Alkaline/silver diamine: histological producers and use ammonium hydroxide to form soluble silver-diamine complex
F Acidic/silver nitrate: photographic procedures and rely upon gel impregnation with silver ions at acidic pH
u Cons: Some aa-modification
Silver Staining
Reverse stainsn Reverse stains were developed specifically to
improve protein recovery from polyacrylamide gels
n Staining is quite rapid, usually requiring 5-15min to complete and the biological activity of proteins is often preserved

Copper staining

Zinc staining
Limit Detection: 10-20 ng per band Compatible w/ MALDI-TOF

Colloidal dispersion stains
n The stains contain fine particles with high affinity for protein
n The stains are not generally used for detection of proteins in polyacryl-amide gels (PAGE)
n India ink stain: simple to perform and inexpensive
n Colloidal metal stains: gold staining

Organic fluorophore stainsn Fluorescent detection of proteins after
electrophoresis is gaining popularity with laboratories engaging in large-scale proteome research
u Covalently bound fluorophores: more recently propyl-Cy3 and methyl-Cy5 dyes have been utilized
u Noncovalently bound fluorophores (2-10 ng):
F SYPRO OrangeF SYPRO Red

SYPRO Orange staining
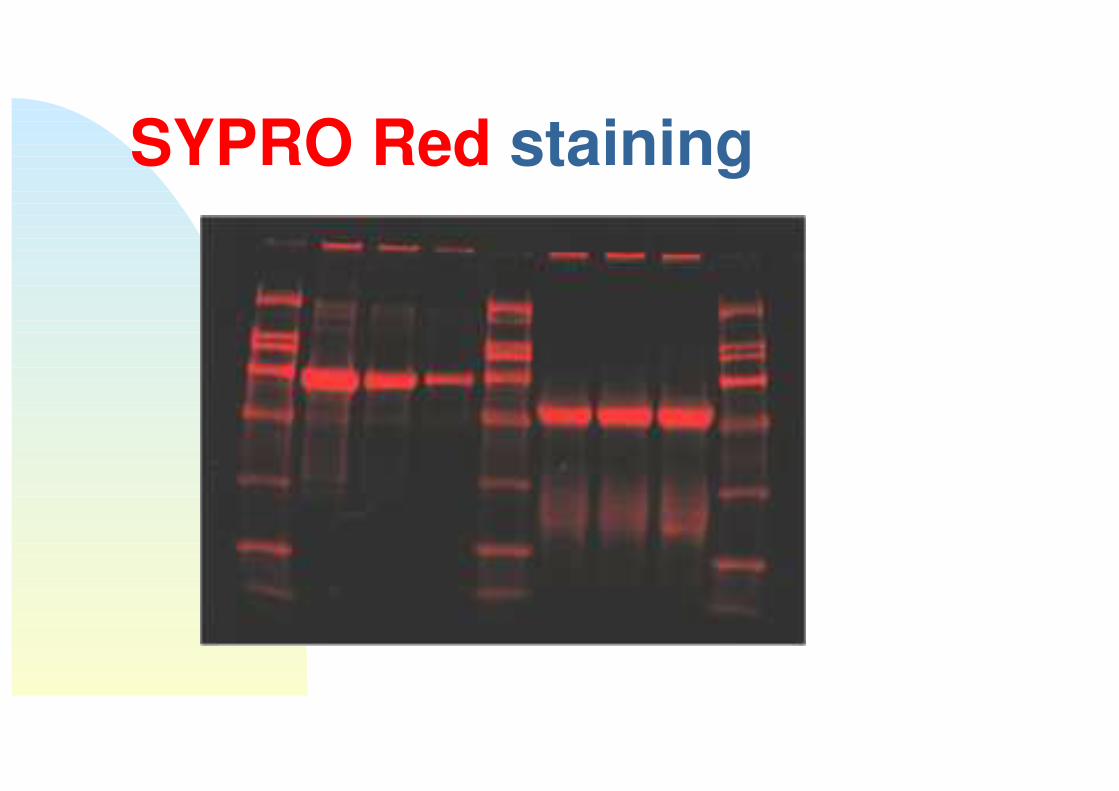
SYPRO Red staining
Metal chelate stainign The metal chelate are a relatively new family of
protein visualization reagents developed to be compatible with modern proteomics research
u Colorimetric metal chelate stains: disulfonate/ferrous(600ng), copper phthalocyanine tetrasulfonate(10-20ng)
u Luminescent metal chelate stains: SYPRO Ruby 2-DE and IEF stains allow one-step, low
background staining of proteins in polyacrylamide gels without resorting to lengthy destaing steps (0.25-1 protein/mm2).

SYPRO Ruby staining

Properties of an ideal general protein stain
n The seven Ss of superior stainingu Safety no hazardous materials
u Sensitivityideally subnanogram detection
u Simplicity simple incubation in 1 solution (< time)
u Specificitydetect proteins (no lipids, CHOs, NAs)
u Speed rapid w/ no destaining step
u Stability stable staining solutions at room T
u Synergy compatible w/ a wide range of applications


2-D Staining

Conclusionn With the development of proteomics into a
high-throughput approach for the study of global protein regulation, new demands are being placed on protein visualization methods
n Newer stains such as Zinc-imidazole, and the noncovalently fluorescent stains (SYPRO dyes) are available to meet the growing demand of modern protein micro-characterization technologies

Image Analysis of Two-dimensional Gels
����� ���

2DE-Image Analysis – Introduction
n Scanning of gel image
n Image processing
n Spot detection and quantitation
n Gel matching
n Data analysis
n Data presentation and interpretation
n Creation of 2-DE databases

2DE – Data acquisitionn Image acquisition devices mainly used for 2-DE
XXGel (fluorescent-labeled)
XXGel silver-, color-stained
XPhosphor image plate
XxX-ray film (radiolabeled sample)
Fluorescent
imagerStorage
phosphor imager
Densitometer White-light or
laser
Camera TV/CCD
Scanning device
Information carrier
2DE – Digital image processing
n To determining the shape and size of protein spot
u Smoothing operator � statistical noise (Gaussian function)
u Contrast enhancement- spot / background
u Edge detection
u Background subtraction

Rolling disk
BackgroundSubtraction

2DE - Protein spot detection and quantitation
n X/y position, shape parameters, integrated spot intensity
-> spot detection
n Detection algorithm:
u Gaussian fitting, Laplacian of Gaussian spot detection
u The line analysis & chain analysis
u Watershed transformation (WST)

2DE - Gel matchingn The comparative analysis of alteration on
protein spot expression
n Chemical & physical features uNo �perfect� geluNo exactly same position
n Two types of matching:uPixel LeveluSpot level
n Use characteristic spots as landmarks


2DE - Data analysisn The evaluation of quality assurance
n The determination of qualitative
u The normalization of the individual spot intensities is based in the average intensity of the related gel image.
n The determination of quantitative change in protein expression
u t-test, Mann-Whitney test, correspondence analysis

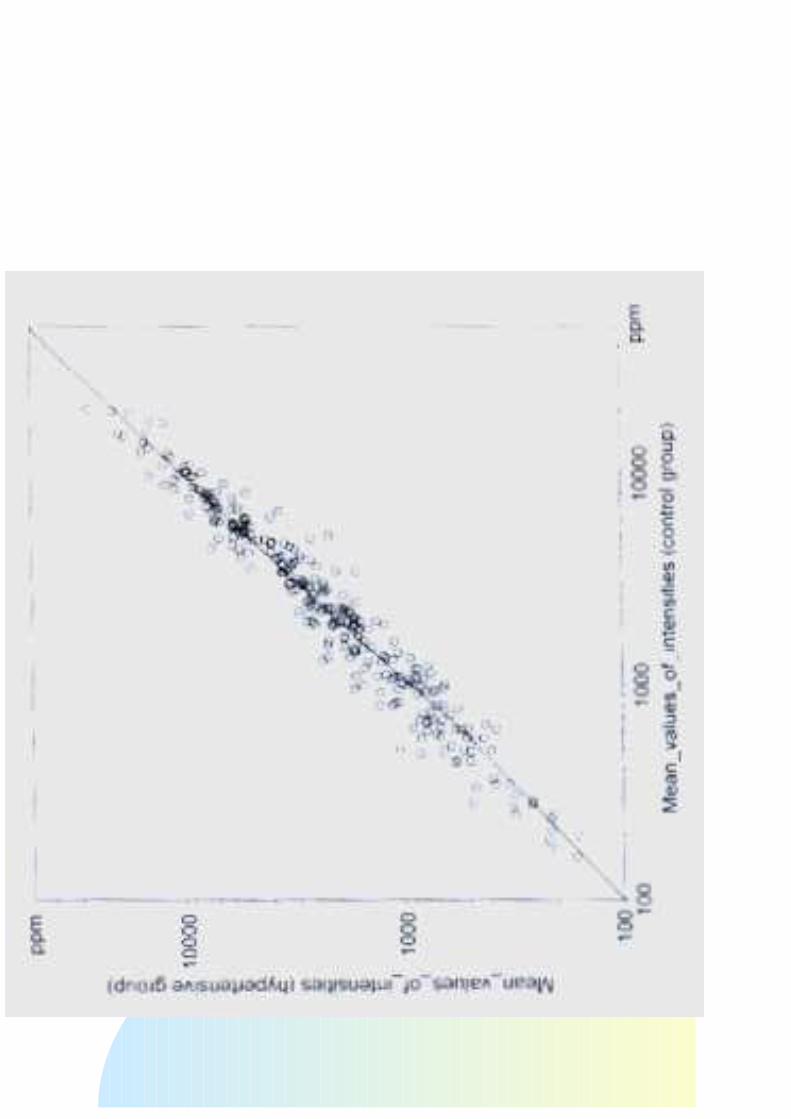

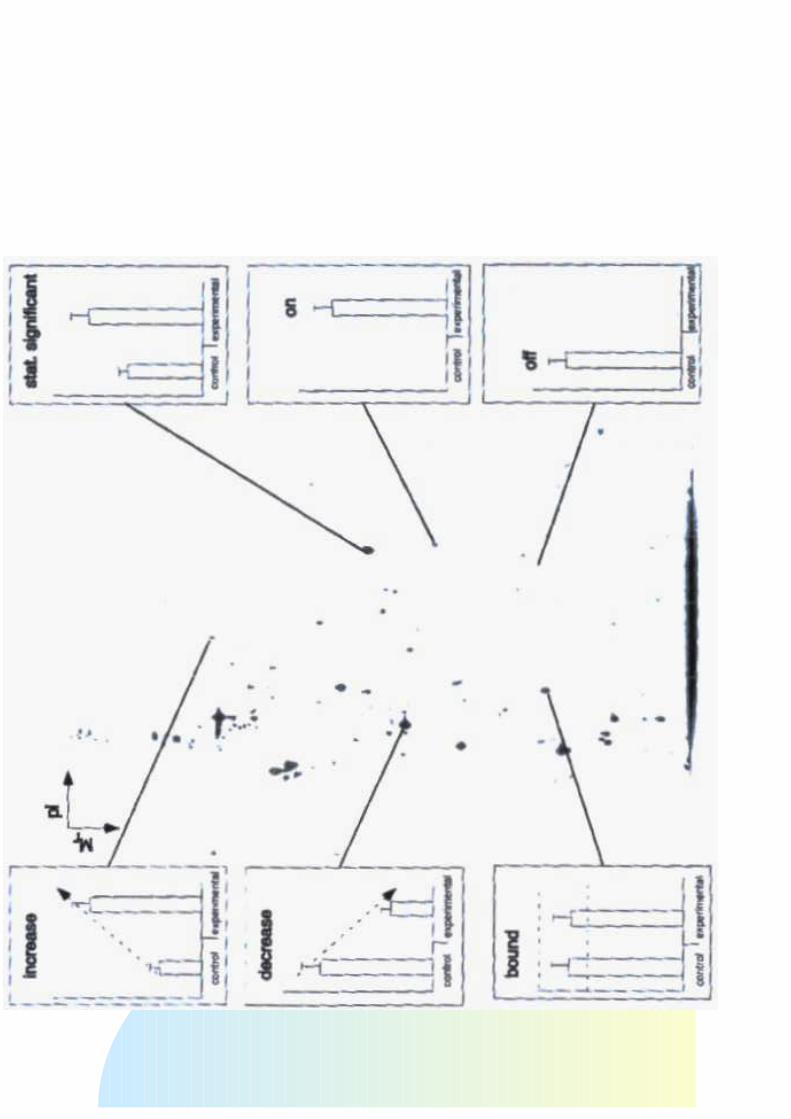
2DE - Data presentation
n Each detected protein spot should have an assigned Mr/pI.
n Graphs or bar charts can be used to compare spot quantitation and reflect alteration trends of spots.
2DE - Databasesn Construction of 2-DE database
u If a protein spot is marked on the image, the descriptive information should appear
u If the protein name or other descriptive information is known, the location of this protein on the image has to be shown and annotated
n Comparing internet-distributed 2-DE databases