2. Competition - Western Michigan...
11
1 Dr. S. Malcolm BIOS 3010: Ecology Lecture 5: slide 1 BIOS 3010: Ecology Lecture 5: Processes: Intraspecific competition • Lecture summary: – Competition definition. – Extremes of intraspecific competition. – Density dependence. – Discrete breeding model. – Continuous breeding model. Dr. S. Malcolm BIOS 3010: Ecology Lecture 5: slide 2 2. Competition: • An interactive process that is a product of combined demand for resources that results in competition among individuals either intraspecifically or interspecifically and a negative outcome for all competitors. • Thus competition can be defined as: • "Competition is an interaction between individuals, brought about by a shared requirement for a resource [in limited supply], and leading to a reduction in the survivorship, growth and/or reproduction of at least some of the competing individuals concerned” (Begon et al., 1996). – Thus the ultimate effect of competition on an individual is a decreased contribution to the next generation compared with the outcome in the absence of competition. Dr. S. Malcolm BIOS 3010: Ecology Lecture 5: slide 3 3. Two kinds of intraspecific competition: • Two kinds of intraspecific competition which represent extremes of a continuum: – exploitation or scramble: • interact indirectly via direct resource use. • e.g. flies on a cow pat, or plants competing for light, or resource depletion zones - RDZs – interference or contest: • interact directly via indirect resource use • e.g. territoriality, or fighting for females, or use of allelochemicals and space as a resource) – Figs. 5.1 & 5.2 show both kinds and negative effects of competition in single species populations.
Transcript of 2. Competition - Western Michigan...

1
Dr. S. Malcolm BIOS 3010: Ecology Lecture 5: slide 1
BIOS 3010: Ecology Lecture 5: Processes: Intraspecific competition
• Lecture summary: – Competition definition. – Extremes of
intraspecific competition.
– Density dependence. – Discrete breeding
model. – Continuous breeding
model.
Dr. S. Malcolm BIOS 3010: Ecology Lecture 5: slide 2
2. Competition: • An interactive process that is a product of combined demand for
resources that results in competition among individuals either intraspecifically or interspecifically and a negative outcome for all competitors.
• Thus competition can be defined as: • "Competition is an interaction between individuals,
brought about by a shared requirement for a resource [in limited supply], and leading to a reduction in the survivorship, growth and/or reproduction of at least some of the competing individuals concerned” (Begon et al., 1996).
– Thus the ultimate effect of competition on an individual is a decreased contribution to the next generation compared with the outcome in the absence of competition.
Dr. S. Malcolm BIOS 3010: Ecology Lecture 5: slide 3
3. Two kinds of intraspecific competition: • Two kinds of intraspecific competition which
represent extremes of a continuum: – exploitation or scramble:
• interact indirectly via direct resource use. • e.g. flies on a cow pat, or plants competing for light, or
resource depletion zones - RDZs – interference or contest:
• interact directly via indirect resource use • e.g. territoriality, or fighting for females, or use of
allelochemicals and space as a resource) – Figs. 5.1 & 5.2 show both kinds and negative effects of
competition in single species populations.
2
Dr. S. Malcolm BIOS 3010: Ecology Lecture 5: slide 4
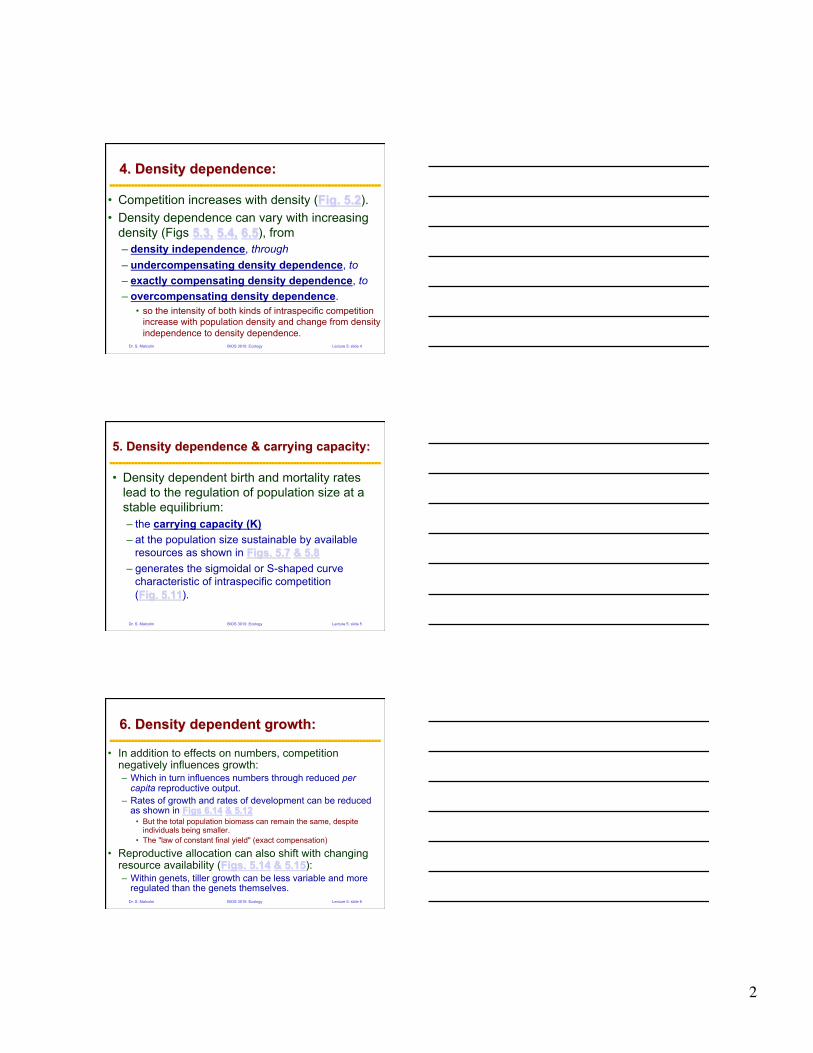
4. Density dependence:
• Competition increases with density (Fig. 5.2). • Density dependence can vary with increasing
density (Figs 5.3, 5.4, 6.5), from – density independence, through – undercompensating density dependence, to – exactly compensating density dependence, to – overcompensating density dependence.
• so the intensity of both kinds of intraspecific competition increase with population density and change from density independence to density dependence.
Dr. S. Malcolm BIOS 3010: Ecology Lecture 5: slide 5
5. Density dependence & carrying capacity:
• Density dependent birth and mortality rates lead to the regulation of population size at a stable equilibrium: – the carrying capacity (K) – at the population size sustainable by available
resources as shown in Figs. 5.7 & 5.8 – generates the sigmoidal or S-shaped curve
characteristic of intraspecific competition (Fig. 5.11).
Dr. S. Malcolm BIOS 3010: Ecology Lecture 5: slide 6
6. Density dependent growth:
• In addition to effects on numbers, competition negatively influences growth: – Which in turn influences numbers through reduced per
capita reproductive output. – Rates of growth and rates of development can be reduced
as shown in Figs 6.14 & 5.12 • But the total population biomass can remain the same, despite
individuals being smaller. • The "law of constant final yield" (exact compensation)
• Reproductive allocation can also shift with changing resource availability (Figs. 5.14 & 5.15): – Within genets, tiller growth can be less variable and more
regulated than the genets themselves.

3
Dr. S. Malcolm BIOS 3010: Ecology Lecture 5: slide 7
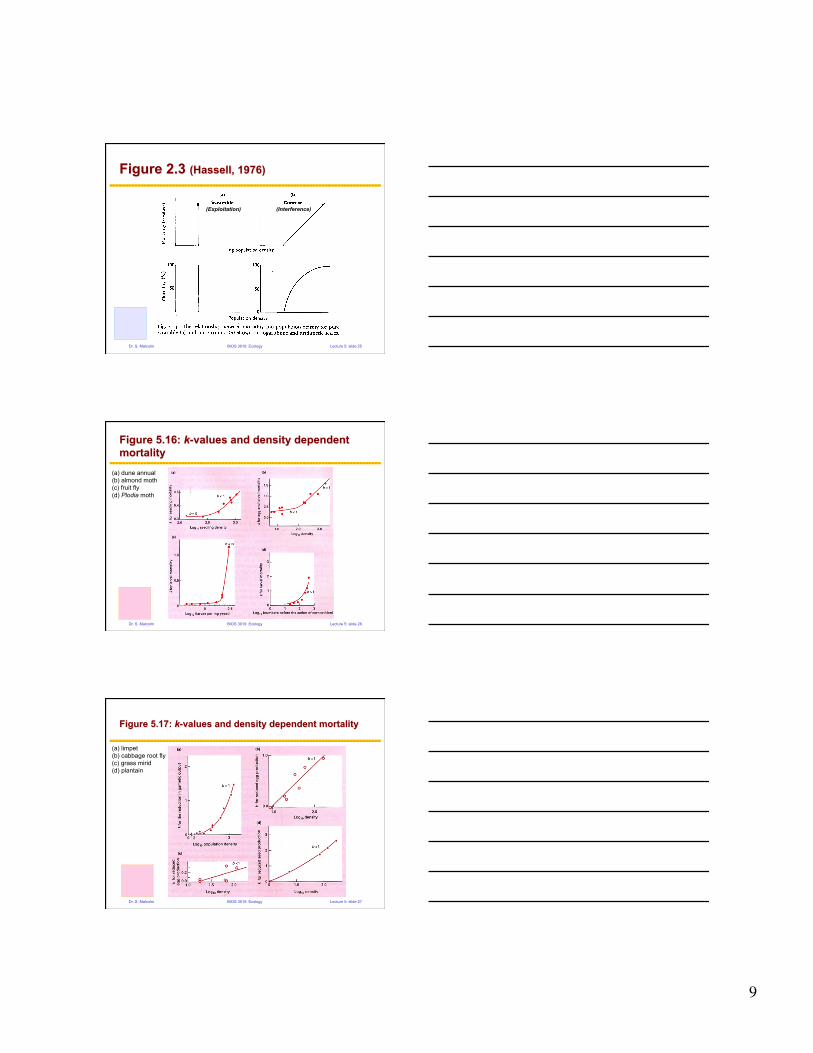
7. k-values and density dependent mortality: • Use of k-values of mortality due to competition can define
competition according to the slope b of the relationship of k-values plotted against the logarithm of initial density (before the effects of competition) (Fig. 5.16). – b = 0: density independence – b < 1: undercompensating density dependence – b = 1: exact density dependent compensation
(contest competition) – b > 1: overcompensating density dependence – b = ∞: overcompensating density dependence
(scramble competition) • see Fig. 2.3 from Hassell (1976) of scramble & contest • k-mortality is shown in Fig 5.16 & k-fecundity in Fig. 5.17
Dr. S. Malcolm BIOS 3010: Ecology Lecture 5: slide 8
8. Discrete breeding season model of intraspecific competition:
• Using the net reproductive rate (R) and population sizes of Nt (at time t) and Nt+1 (at time t+1), in the absence of competiton, the model describes population increase simply as: Nt+1 = Nt R and,
Nt = NoRt
• this describes exponential population growth
across discrete generations as in Fig. 5.18.
Dr. S. Malcolm BIOS 3010: Ecology Lecture 5: slide 9
9. Discrete breeding and competitive limitation to a carrying capacity:
• At high density when the ratio of Nt/Nt+1 = 1 this is by definition the carrying capacity K.
• So in the presence of competition the population rises to K as shown in Fig. 5.18 according to: Nt+1 = NtR/1+(aNt)
• the unrealistic R in the first equation is now replaced by the more realistic R/(1 + aNt)
• as a and Nt increase so does the effect of competition and R is decreased.

4
Dr. S. Malcolm BIOS 3010: Ecology Lecture 5: slide 10
10. Density dependence of the model:
• The k-value is thus the difference between logNtR and logNtR/(1 + aNt).
• Plotting these values shows that the model exactly compensates (Fig. 5.20).
– A more realistic model of competition that incorporates a range of competitive regulation was derived by Hassell (1975) (not Maynard Smith & Slatkin, 1973) in which he simply added the slope of the k-value plotted against log initial density:
Nt+1 = NtR/1+(aNt)b – in which b is the slope of population size (log10Nt) against mortality (k)
and a substitutes for (R-1)/K as before (see Figs. 5.21 & 6.26 for fit to real data).
Dr. S. Malcolm BIOS 3010: Ecology Lecture 5: slide 11
11. Continuous breeding - exponential growth:
• The model above was for discrete time steps described by a "difference" equation.
• For continuously breeding populations (birth and death continuous) we need a continuous form of the model using a "differential" equation.
• For exponential population increase the rate of population increase is dN/dt and this speed of change is described by: dN/dt = rN
• where r is the intrinsic rate of natural increase which is lnR or lnRo/T
– The continuous equivalent to Fig. 5.18 is shown in Fig. 5.23 and this is the differential form of the difference equation Nt = NoRt
Dr. S. Malcolm BIOS 3010: Ecology Lecture 5: slide 12
12. Continuous breeding, carrying capacity & the logistic equation:
• The differential form of Nt+1 = NtR/(1+aNt) in Fig 5.18 is given by: dN/dt = rN((K - N)/K)
– this is the famous logistic equation (Fig. 5.23)
• Shows that exponential increase is decreased to carrying capacity (K) by the logistic term (K - N)/K

5
Dr. S. Malcolm BIOS 3010: Ecology Lecture 5: slide 13
Figure 5.1: Intraspecific competition among cave beetles eating cricket eggs (a) exploitation, (b) interference
Dr. S. Malcolm BIOS 3010: Ecology Lecture 5: slide 14
Figure 5.2: Red deer population size, birth weight and survivorship
Dr. S. Malcolm BIOS 3010: Ecology Lecture 5: slide 15
Figure 5.3: Density dependent mortality in flour beetles (1 = density independent, 2 = undercompensating mortality, 3 = overcompensating mortality)

6
Dr. S. Malcolm BIOS 3010: Ecology Lecture 5: slide 16
Figure 5.4: Density & mortality in trout fry
Dr. S. Malcolm BIOS 3010: Ecology Lecture 5: slide 17
Figure 6.5 (3rd ed.): Density dependent mortality in soybeans - overcompensation with time
Dr. S. Malcolm BIOS 3010: Ecology Lecture 5: slide 18
Figure 5.7: Density dependent birth & mortality - equilibrium at carrying capacity (K)
7
Dr. S. Malcolm BIOS 3010: Ecology Lecture 5: slide 19
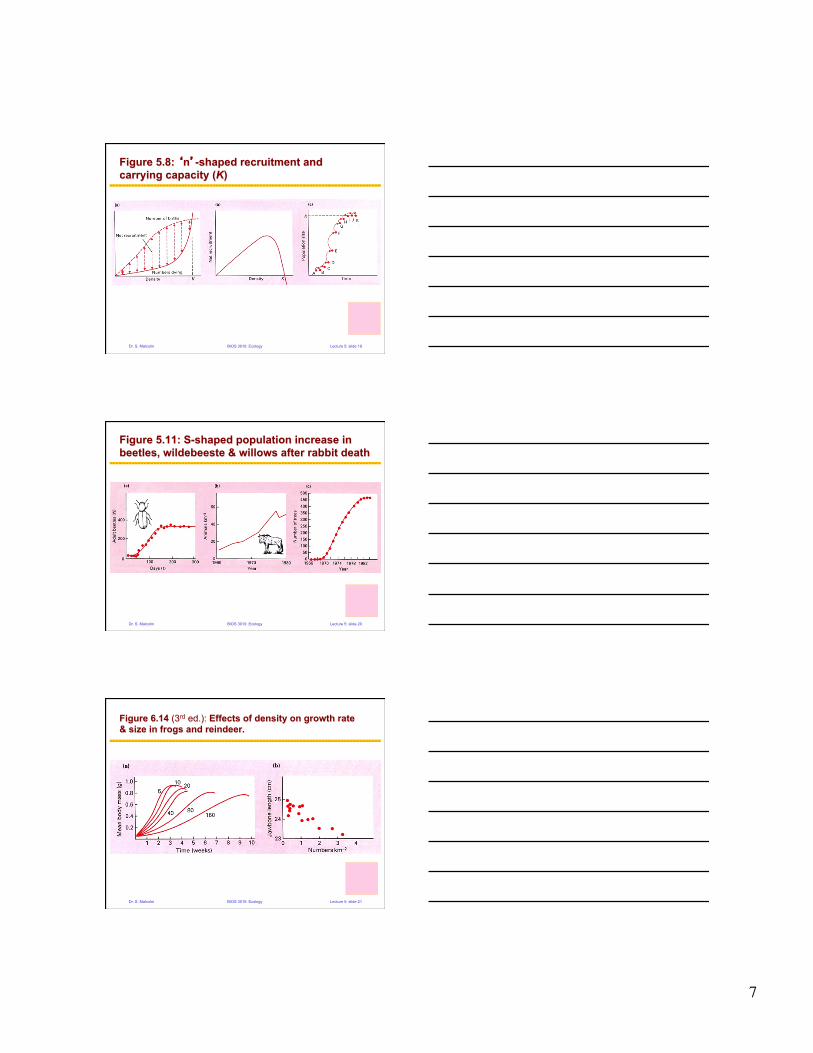
Figure 5.8: ‘n’-shaped recruitment and carrying capacity (K)
Dr. S. Malcolm BIOS 3010: Ecology Lecture 5: slide 20
Figure 5.11: S-shaped population increase in beetles, wildebeeste & willows after rabbit death
Dr. S. Malcolm BIOS 3010: Ecology Lecture 5: slide 21
Figure 6.14 (3rd ed.): Effects of density on growth rate & size in frogs and reindeer.
8
Dr. S. Malcolm BIOS 3010: Ecology Lecture 5: slide 22
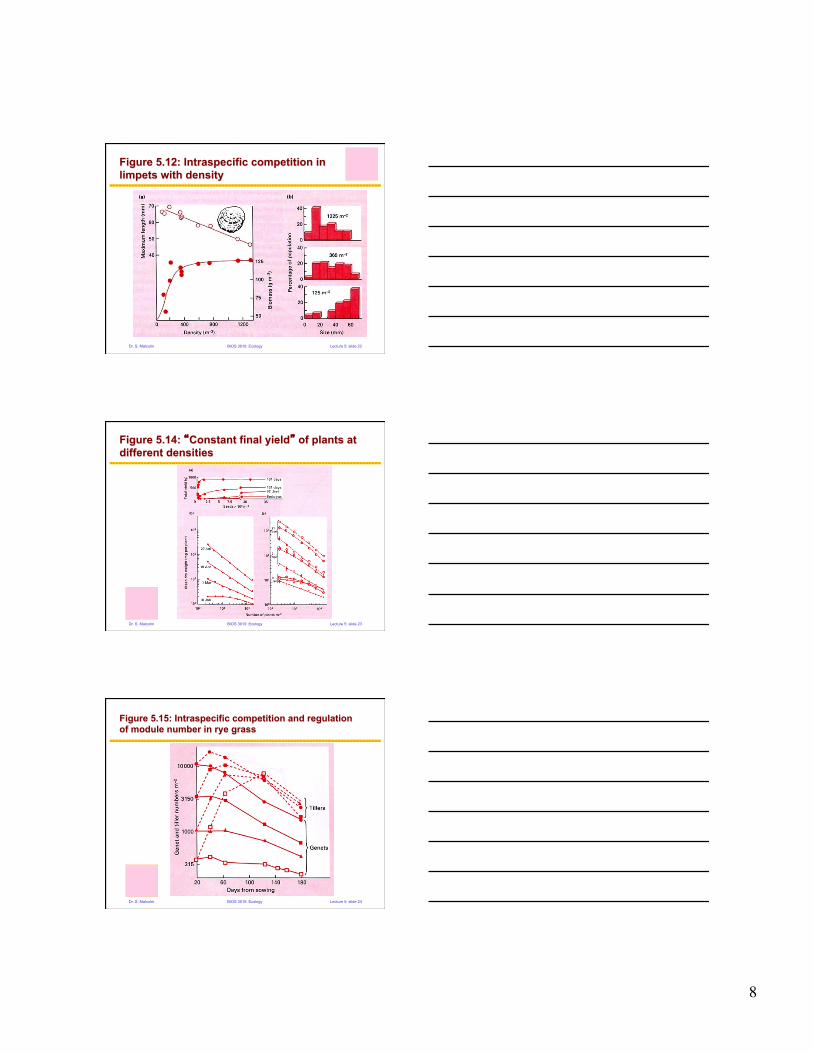
Figure 5.12: Intraspecific competition in limpets with density
Dr. S. Malcolm BIOS 3010: Ecology Lecture 5: slide 23
Figure 5.14: “Constant final yield” of plants at different densities
Dr. S. Malcolm BIOS 3010: Ecology Lecture 5: slide 24
Figure 5.15: Intraspecific competition and regulation of module number in rye grass
9
Dr. S. Malcolm BIOS 3010: Ecology Lecture 5: slide 25
Figure 2.3 (Hassell, 1976)
(Exploitation) (Interference)
Dr. S. Malcolm BIOS 3010: Ecology Lecture 5: slide 26
Figure 5.16: k-values and density dependent mortality
(a) dune annual (b) almond moth (c) fruit fly (d) Plodia moth
Dr. S. Malcolm BIOS 3010: Ecology Lecture 5: slide 27
Figure 5.17: k-values and density dependent mortality
(a) limpet (b) cabbage root fly (c) grass mirid (d) plantain

10
Dr. S. Malcolm BIOS 3010: Ecology Lecture 5: slide 28
Figure 5.18: Discrete model of population increase with time - exponential and sigmoidal
Dr. S. Malcolm BIOS 3010: Ecology Lecture 5: slide 29
Figure 5.20: Slopes (b = 1) of k against log density for exact compensation
Dr. S. Malcolm BIOS 3010: Ecology Lecture 5: slide 30
Figure 5.21: Variable slopes (b) for k mortality due to competition against log density

11
Dr. S. Malcolm BIOS 3010: Ecology Lecture 5: slide 31
Figure 6.26 (3rd ed.): Discrete model fit to data for 4 beetle species (a, b, c, e) and the winter moth (d)
Dr. S. Malcolm BIOS 3010: Ecology Lecture 5: slide 32
Figure 5.23: Continuous model of exponential and sigmoidal population increase