2 45 wayne de veydt
14
Navigating the Health Insurance Landscape: What to Expect and What Surprises are in Store Annual Insurance Executive Conference Wayne DeVeydt Executive Vice President, Chief Financial Officer December 17, 2013
-
Upload
summit-professional-networks -
Category
Business
-
view
342 -
download
12
description
Transcript of 2 45 wayne de veydt

Navigating the Health Insurance Landscape:What to Expect and What Surprises are in Store
Annual Insurance Executive Conference
Wayne DeVeydtExecutive Vice President, Chief Financial Officer
December 17, 2013

A Health Benefits Leader
2
`̀
BC or BCBS licensed plans
Medicaid presenceBC or BCBS licensed plans + Medicaid presence
BC or BCBS plans in 14 states andMedicaid presence in 19 states
Medicare4%
BlueCard14%
Medicaid13%
Individual 5%
National Accounts19%
LocalGroup41%
FEP4%
Diverse customer base of36 million medical members

Projected Sources of Insurance Coverage2012-2021
3
2012
2021
Employer
-10%Uninsured
-38%Exchanges Medicaid
+20%Medicare
+30%
14052 54 50
12632 30 65 65
Source: Analysis of Avalere / Booze & Co. / McKinsey / WellPoint Enrollment Models; Assumes 15 states opt out of Medicaid expansion: AK, AL, GA, IA, ID, IN, LA, MS, NE, NC, OK, SC, TX, VA, WI

State HIX Federal HIX State Agency
2.3MDetermined Eligible
for Medicaid
ACA Medicaid Expansion Eligibility Determinations
4
65%
12%
23%
Federal and State Exchange Enrollment
365,000
227KState Total
138KFederal Total
October November
Source: HHS Enrollment Update; December 11, 2013
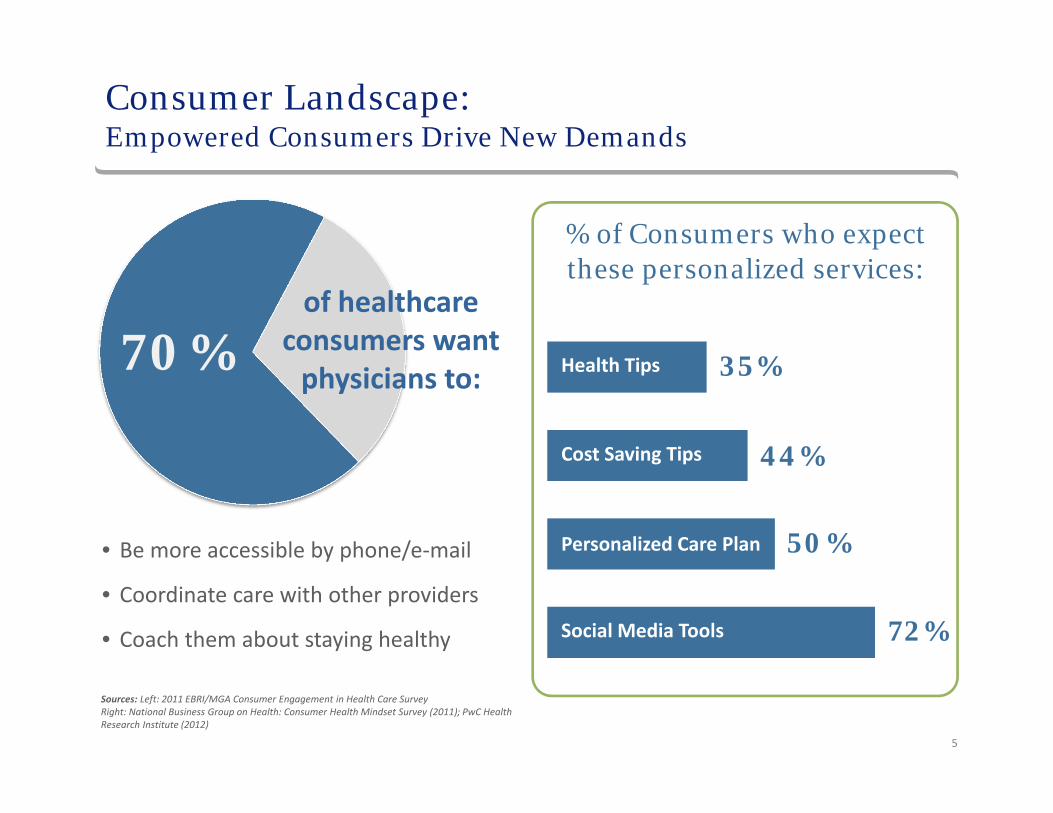
70%
Consumer Landscape: Empowered Consumers Drive New Demands
of healthcare consumers want physicians to:
• Be more accessible by phone/e‐mail
• Coordinate care with other providers
• Coach them about staying healthy
50%
44%
35%
72%Social Media Tools
Personalized Care Plan
Cost Saving Tips
Health Tips
% of Consumers who expect these personalized services:
Sources: Left: 2011 EBRI/MGA Consumer Engagement in Health Care Survey Right: National Business Group on Health: Consumer Health Mindset Survey (2011); PwC Health Research Institute (2012)
5

675
725
775
825
875
925
2008 2010 2015 2020 2025
DemandSupply
Source: American Academy of Medical Colleges
Americans without access to primary care
60million
Average wait for non-emergency appointment
20.3days
PCPs accepting new patients 49.8%
National Association of Community Health Centers. March 2009. Primary Care Access: An Essential Building Block of Health Reform; Merritt Hawkins and Associates: 2009 Survey of Physician Appointment Wait Times; Center for Studying Health System Change: 2008 Health Tracking Physician Survey 6
Consumer Landscape: Supply & Demand of Physicians
Physicians (in 000s)

Consumer Landscape:Preference for Less Expensive Plans & Narrower Networks
7
Numbers are rounded; Source: McKinsey Consumer Exchange Simulation 2011‐2013

Source: Hospital and Health Networks; Physician Compensation and Production Survey, Medical Group Management Survey, 2002‐012; Merritt Hawkins 2012 Review of Physician Recruiting Incentives; Dealogic
Provider Landscape:National Trend Towards Provider Consolidation
8
78% of hospitals are consolidating or exploring consolidation
0%
10%
20%
30%
40%
50%
60%
70%
80%
2002 03 04 05 06 07 08 09 10 2011
Physician owned Hospital Owned
Hospital employment of physicians is increasing nationwide
Source: Avalere Health. (2010. analysis of American Hospital Association Annual Survey)
2,373 2,321 2,251 2,172 2,142 2,044
2,542 2,606 2,668 2,755 2,868 2,941
2000 2002 2004 2006 2008 2010
Independent Hospitals In Health Systems

9
31%
10%
1%3%
23%
11%
19%
2% Primary Care
Internal Medicine
Pediatrics
General Surgery
Surgical Specialties
Emergency Medicine
Other Specialties
Unknown
2010 Physician Assistants by Specialty
Source: 2010 AAPA Physician Assistant Census Report
Decrease in healthcare workforce productivity 1992-2012
94%Increase in Nurse Practitioner
Jobs Projected by 2025
Average Annual Growth over 20 Years
0.6%

Provider Landscape:Blurring Lines Between Providers & Payers
Source: Hospital and Health Networks; Physician Compensation and Production Survey, Medical Group Management Survey, 2002‐12;
23%16%
40%
63%71%
53%
14%14%7%
Managing carecoordination
Performancemeasurement
Population healthmanagement
Not at all Prepared Somewhat Prepared Very Prepared
Numbers are rounded. Source: Executive Survey on Hospital and Physician Affiliation Strategies, Sponsored by McKesson. 10
Accountable Care Preparedness
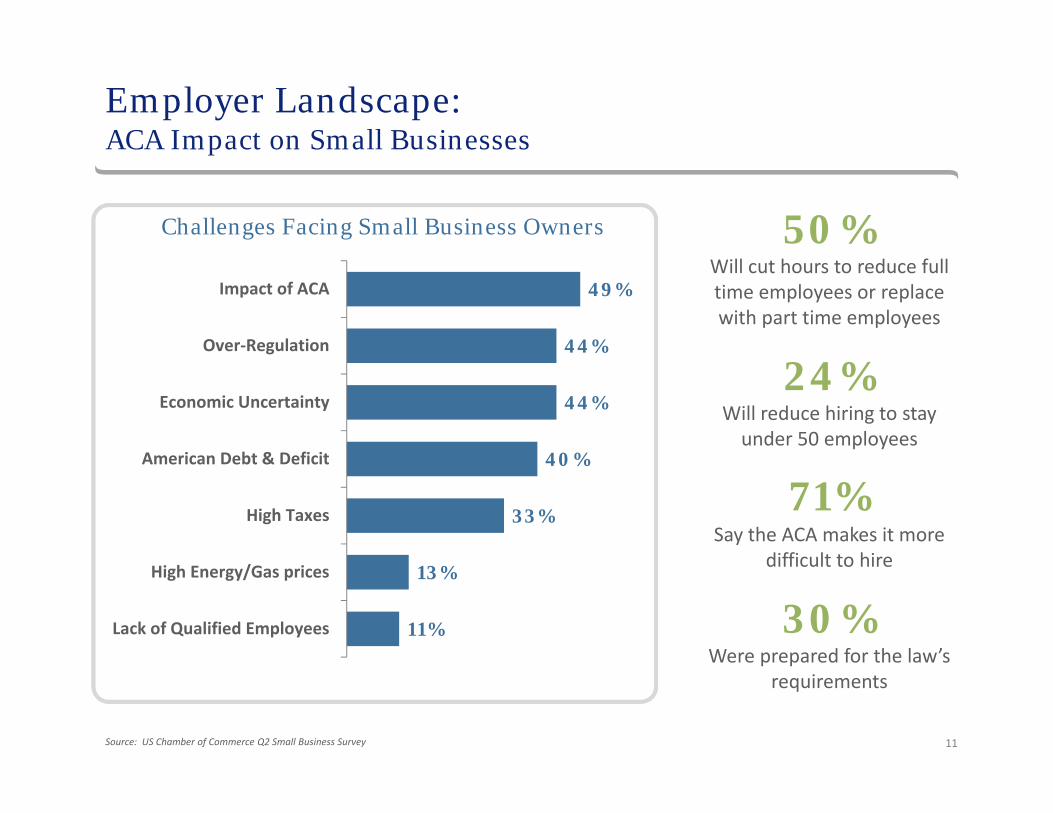
Employer Landscape:ACA Impact on Small Businesses
11
50%Will cut hours to reduce full time employees or replace with part time employees
24%Will reduce hiring to stay under 50 employees
71%Say the ACA makes it more
difficult to hire
30%Were prepared for the law’s
requirements
Source: US Chamber of Commerce Q2 Small Business Survey
49%
44%
44%
40%
33%
13%
11%
Impact of ACA
Over‐Regulation
Economic Uncertainty
American Debt & Deficit
High Taxes
High Energy/Gas prices
Lack of Qualified Employees
Challenges Facing Small Business Owners
12
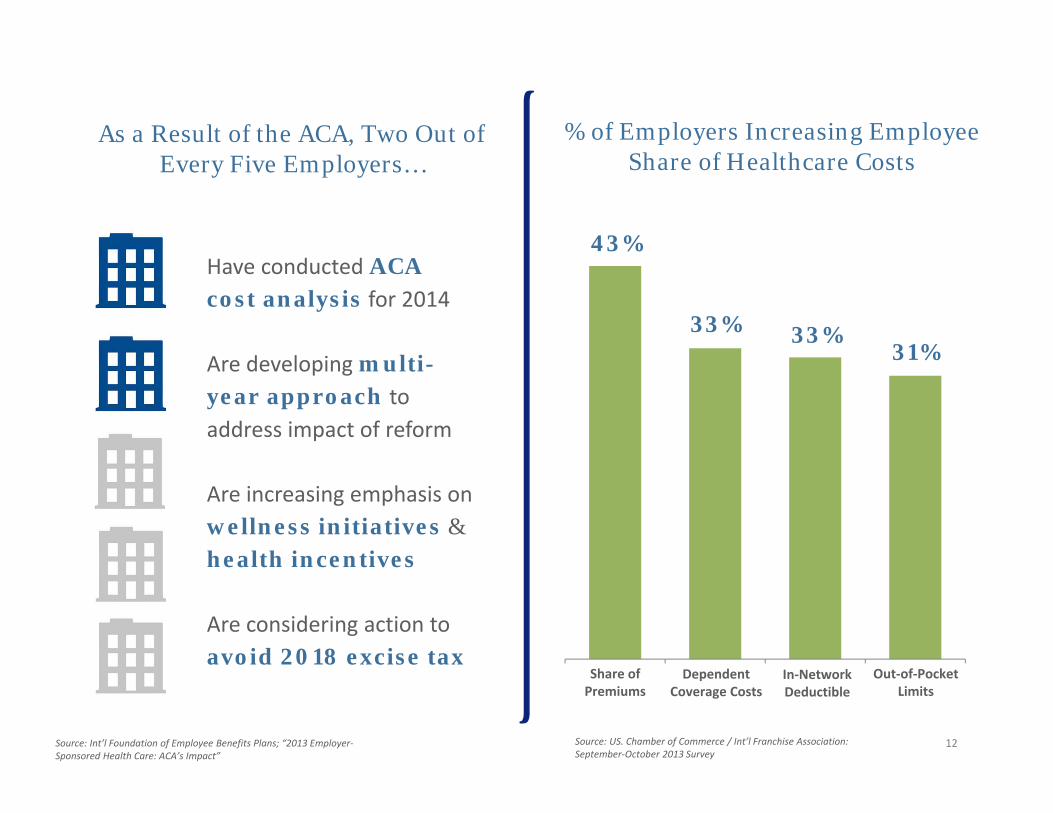
Share of Premiums
Dependent Coverage Costs
In‐Network Deductible
Out‐of‐Pocket Limits
% of Employers Increasing Employee Share of Healthcare Costs
33%31%
33%
43%Have conducted ACAcost analysis for 2014
Are developing multi-year approach to address impact of reform
Are increasing emphasis on wellness initiatives &health incentives
Are considering action to avoid 2018 excise tax
As a Result of the ACA, Two Out of Every Five Employers…
Source: Int’l Foundation of Employee Benefits Plans; “2013 Employer‐Sponsored Health Care: ACA’s Impact”
Source: US. Chamber of Commerce / Int’l Franchise Association: September‐October 2013 Survey

Employer Landscape:Interest in Private Exchanges
13Source: Private Exchange: Accenture analysis, based on data from: U.S. Census, Bureau of Labor and Statistics, Kaiser Employer Health Benefits 2012 Annual Survey. Calculations exclude post‐65 retirees and individuals.Public Exchange: Congressional Budget Office 2013 Estimate of the Effects of the Affordable Care Act on Health Insurance Coverage, CBO’s February 2013 Baseline, depicts average monthly enrollment, including spouses and dependents for individual and SHOP.
20% 26% 26% 23%
62% 57% 55%49%
0%
10%
20%
30%
40%
50%
60%
70%
80%
90%
10 to 50 51 to 100 101 to 3000 >3,000
Would consider switching as long as they saw savings of at least 10%
Would consider switching for no savings
Percent of employers who would consider switching to a private exchange
9
15
2730 31
1
9
19
30
40
0
5
10
15
20
25
30
35
40
45
2014 2015 2016 2017 2018
Public Exchange Private Exchange
Enrollm
ent (millions)
Projected Public vs. Private ExchangeAnnual Enrollment
# of employees