2 3 - INVESTBANK · Mr. Abdul Raheem Nizar Abdul Raheem Jardaneh Ma'daba Co. for Financial...
58
Transcript of 2 3 - INVESTBANK · Mr. Abdul Raheem Nizar Abdul Raheem Jardaneh Ma'daba Co. for Financial...


32 H
is Royal M
ajesty King Abdullah
the Second Bin Al H
ussein

54 H
is Royal H
ighness Hussein bin Al Abdullah
Crown Prince of Jordan

Our PromisesBoard of DirectorsChairman of Board StatementAction Plan for the year 2012-2014Board of Directors’ RecommendationActivities and Financial Statement Major Financial IndicatorsAdditional StatementsIndependent Auditor’s Report and Consolidated Financial Statements for 2011

Chairman Abdul Raheem Jardaneh & Sons Co. represented by Mr. Bisher M. Jardaneh
Vice ChairmanMr. Ayman S. Jmean, until April 27, 2011Ma'daba Co. for Financial Investment represented by Mr. Ayman S. Jmean as of May 19, 2011Vice ChairmanRa'ouf Abu Jaber & Sons Co. Represented by Mr. Ziad Ra'ouf S. Abu Jaber from April 27, 2011 till May 19, 2011
Members Dr. Mohammed K. Al-TalDr. Nabeel H. QaddumiRa'ouf Abu Jaber & Sons Co. Represented by Mr. Ziad Ra'ouf S. Abu JaberMr. Abdul Raheem Nizar Abdul Raheem JardanehMa'daba Co. for Financial Investment represented by Dr. Foti I. Khamis until April 27, 2011Dr. Foti I. Khamis as of April 27, 2011Ma'daba Co. for Financial Investment represented by Mr. Muhannad Al-Shuaiti as of April 27, 2011 till May 19, 2011Mrs. Zina Nizar Abdul Raheem Jardaneh until April 27, 2011Abdul Raheem Jardaneh & Sons Co. (second membership) represented by Mrs. Zina Jardaneh April 27, 2011 till May 19, 2011Jordan Drug Store Company represented by Mrs. Zina Jardaneh as of May 15, 2011Oussoul investment & Economic Co represented by Mrs Wijdan M. Al Talhouni as of April 27, 2011Mrs. Wijdan M. Al Talhouni as of April 27, 2011Al-Nahda Financial Investments represented by Mr. Walid E. Finan until April 27, 2011Bank of Palestine represented by Mr. Hashem H. Al-ShawaMr. Fehmi Bin Fa'aiq Abu Khadra'a as of April 27, 2011
General ManagerMr. Muntaser I. Dawwas as of August 1, 2011
Acting Chief Executive Office/General ManagerMr. Jamal Fariz till February 28, 2011
Acting Chief Executive Office/General ManagerMr. Ibrahim Besharat from March 1, 2011 until August 1, 2011
Our promises..We only make the pledges we can ful�llWe are committed to o�er creative banking solutionsWe are committed to launching responsible partnershipsWe are committed to building special relationships with our customers
Board of Directors

1110Dear Shareholders,
It is a pleasure for me as we meet again this year to present to you on behalf of myself and my colleagues, members of the board and the entire Investbank family the 29th Annual Report for the year 2011, a year that witnessed defining events in the entire Arab region. We are currently experiencing the repercussions of these events that are interloping with the global financial and economic crisis, which continues unabated in different forms, including the sovereign debts crisis in the EU and the weak world and regional economic growth.
Jordan’s Economy
It was hoped that the Jordanian economy would pass the bottleneck but the accelerating events in the Arab region and the financial and economic crises had their again. These factors negatively affected the GDP growth, which remained around 2.5%, coupled with a budget deficit, rising state debts, shrinking investments and a decline in revenues from tourism and expatriate remittances.
Safe Umbrella
Undoubtedly, the Central Bank of Jordan remains the safe umbrella of the banking sector, thanks to its prudent policies and the institutionalized nature of its decisions and instructions that are characterized by consistency. This has enforced the pillars of the banking sector and enhanced its ability to respond to crises and developments and rendered the sector the catalyst of economic activity, especially since the new leadership of the CBJ is the best choice to boost this confidence and add to the accomplishments.
Good Performance
Within this context as we are preparing to mark the 30th anniversary of the bank, a glimpse into its results in 2011 would indicate that it performed well, reflecting the relentless efforts exerted over the past year to improve these results. These efforts paid off, particularly in terms of shareholders’ equity, which grew from JD79.230 million in 2007 to JD131.897 in 2011.
In light of continued implementation of a policy to widen capital base, with the aim of raising capital to JD100 million, a private placement was launched involving 14.75 million shares, with a coverage ration of 95.7%. This is prone to enhance our status as a local bank that offers comprehensive and distinguished banking, commercial and investment services and reinforce the bank’s ability to compete more aggressively in the Jordanian market and expand operations and activities into various sectors. Chairman of Board
Statement

1312The Best Competitive Edge
This comes amid an ongoing restructuring process to meet the best performance and achievement criteria, in line with the bank’s overall strategy, which yielded the corporate identity and produced new branches and advanced services. Among the other results the focus on compliance risks, enhancing good governance, financing medium-sized companies and offering special banking services and investment banking, in addition to expansion in the specialized financial subsidiaries like Al Mawared for Brokerage. The new strategy also focused on the supply (chain finance) and financial lease. The bank continued concentrating on developing the various services, with focus on e-services to create the best competitive edge.
Modern Leadership
Because Investbank is on a non-stop mission to develop all factors of growth and modernization and as part of its policy to recruit the best qualified cadres in the banking industry that are able to bring about added value, Mr. Muntaser Dawas was appointed as the new general manager. He enjoys the banking experience and the right personality to add to the success of the bank and help it improve its result to meet your expectations.
Investbank will always a model of balanced banking performance because experience, knowledge, skills and a high sense of responsibility have taken roots in this bank despite time changes. It will adhere to the rules set by founders as cornerstones of success, on which loyal shareholders built, as they believed in the message of the bank and supported its march towards achievement.
Chairman
Bisher Mohammad Jardaneh
Chairman of B
oard Statement
Dear Shareholders,
It is a pleasure to present you the 29th annual report including key achievements and activities in 2011, in addition to financial statements and auditors’ report for the year ending on December 31, 2011, outlining the performance of the bank in this exceptional banking year.
Financial Achievements
The bank achieved in 2011 net profits amounting to JD9.596 million, compared with JD10.887 million in 2010. Profits before taxes stood at JD13.650 million, with tax deduction of JD4.054 million. As always, the profits made reflect the efforts of the bank, despite the impact of the surrounding conditions and the general economic performance. Efforts are being exerted to increase profits so as to enhance solvency and raise capital. Profits were distributed as shown in the table below.
Total Income
The bank’s total income for the year 2011 stood at JD36.492 million, with an increase of 4.6% when 2010 reached JD34.889 million. Net interests and commissions earnings constituted 80% of the total income for the year 2011.
Chai
rman
Let
ter
20104.9821.6150.3528.92015.869
20114.0541.378
(0.031)8.24913.650
Statement/Data
Tax DeductionLegal Reserves 10%General Banking Risks ReservesRetained EarningsTotal
To nearest million dinars

1514Balance Sheet Position
At the end of 2011, the size of the balance sheet was JD692 million, compared with JD677 at the end of 2010. The size of credit facilities stood at JD387 million (net figure was JD350 million) in 2011, compared with JD374 million in 2010 (net figure was JD350 million), with a growth rate of 3.5%. Deposits at the CBJ and banks in Jordan and abroad also grew by 23%, while clients deposits rose by 4.7%. The following table shows the major changes on the main items of the balance sheet:
Important Statements
Unified Balance Sheet
This presentation concerns a unified balance sheet of the bank, Al Mawared for Brokerage, Tamkeen Leasing, and Investbank’s finance chain company.
Capital Adequacy
The bank maintained a high capital adequacy ratio as of the end of 2011, reaching 18.03%, while the required ratio by the CBJ is 12% and Basel Committee’s requirement is 8%.
Facilities Portfolio
The bank’s total facilities portfolio grew by the end of 2011 to JD387 million (net figure was JD350 million). The portfolio was distributed among the various sectors such as general trade, constructions, transportation services and stock trading, in addition to personal, housing and auto loans and external trade financing.
Chairman Letter
201136.49229.03813.6509.596470
386.55720.63863.076
174.486
201034.88929.62615.86910.887
449373.81622.16775.445
240.049
Statement/Data
Total Income Net Interests & Commissions Earnings Net Profit before Tax Deduction Year Profit (After Tax Deduction)Clients DepositsTotal of Direct Credit FacilitiesBank Net Stock PortfolioOutstanding LOCOutstanding Insurance Policies & LOC
To nearest million
Credit Rating
Capital Intelligence maintained the bank’s ranking in terms of financial strength at BB+/outlook stable
Corporate Governance
In fulfillment of its responsibilities, the board of directors formed committees to ensure the application of corporate governance in line with a guide issued by the CBJ. These committees continue to carry out the missions they are tasked with in line with the bank’s corporate governance policy. These committees are:
Corporate governance committeeAudit committeeRisk management and compliance committeeNominations and remunerations committee In addition to the following committees:Higher committee for facilities Investment committee
Corporate Governance Policy
The bank’s corporate governance policy, along with the board of directors’ bylaws and the nominations and remunerations system were adopted in accordance with the corporate governance guide. The corporate governance policy was amended in fulfillment of the corporate governance rules set by the JSC. We are working currently to endorse the other required policies.
Anti-Money Laundering
The Compliance Department at the bank is closely monitoring all transactions carried out at the bank on a daily basis so as to prevent any risks that might ensue from any suspected illegal acts. This is done out of the Investbank’s keenness to protect its reputation and the interests of all clients.
In 2011, the bank introduced the OBI reporting system concerned with banking operations. The system generates reports that are forwarded to the compliance the anti-money laundering department, allowing it to obtain all the data necessary to monitor all transactions carried out at all the departments and branches of the bank.
The compliance the anti-money laundering department is also monitoring the SWIFT system at the bank to make sure that none of the persons listed on blacklists compiled by BEO, EU, UN or OFAC is involved in transactions taking place at the bank.
The
Twen
ty-E
ight
h An
nual
Rep
ort o
f 201
1
1716Shareholders’ Equity
The bank increased its capital through the capitalization of JD7.750 million in the second half of 2011, thus raising capital to 85.250 million dinar/share. The aim is to increase capital to 100 million dinar/share in line with CBJ instructions. In this regard, the bank offered 14.750 million shares for a private placement (after obtaining the permission of the Jordan Securities Commission (JSC) on November 22, 2011) among the shareholders as registered in the bank’s records on December 6, 2011. The placement, which took place between December 19, 2011- January 1, 2012, was covered by 95.7%. In line with the JSC instructions pertaining to placement rights, and with the aim of preserving the rights of shareholders who did not subscribe to the placement, the non-subscribed shares were offered for sale at Amman Stock Exchange during the period February 15, 2012- March 30, 2012. The number of these shares stands at 633327 shares and they are expected to be sold and thus capital will be raised to JD100 million by March 30, 2012.
Bank’s Action Plan for 2012
Investbank continues the implementation of its strategic plan for the years 2012-2014, building on its 2009 strategy, which has since then further crystallized and become more consistent with the achievements made by the bank in the past three years, which form the launching pad for more accomplishments in the coming three years. The bank seeks to make a strong appearance among Jordanian banks as by offering high-quality services to targeted clients that include large, medium and small businesses, in addition to mid-market companies.
To implement the strategy, the bank focused on a group of aspects, including credit and credit processing. Prudent credit policies are in place to ensure flexibility and cut short on the time needed to make a decision and extend credit facilities to clients. This is prone to enhance clients confidence in the bank and help expand its operations.
The other aspect is the work model. Concerning facilities extended to individuals and medium-sized companies, the bank has adopted a strategy based on developing innovative products targeting these categories. As for large and commercial companies, they are offered a high-level client service through a qualified team of PR managers.
There is also the IT aspect, where focus is placed on developing the infrastructure and the various IT systems, including e-banking services and the call center. The aim is to provide a diversified set of communication channels with the bank in a way that meets the needs of clients and accelerates and facilitates banking transactions, ensuring the highest degree of accuracy and safety.
The strategic plan also featured the corporate identity of the bank and its new public image, which it seeks to promote among existing and potential clients through a well-studied and effective marketing campaign. The plan also stipulates the enhancement the role of the public relations apparatus at the bank.
The Twenty-Eighth Annual R
eport of 2011
Another pillar in the strategy is the branch network. The bank is conducting a study of the locations of its branches and making blueprints for re-designing their interiors. Upon completion, the study will suggest either keeping the branch in question or moving it to another location and propose locations for new branches and ATM locations, selecting the most strategic areas of the highest concentration of our clients It is noteworthy to mention that the bank has re-located its headquarters to a new building that features the new corporate identity.
The strategic plan also paid attention to the human resources aspect. The bank focuses on investment in its most important asset: the human capital, seeking to upgrade services, improve performance and raise productivity through retaining qualified personnel, develop their capacity and attract new outstanding employees to join a team that can add to the progress and achievements of the bank.
The strategy also focused on subsidiaries, as the bank is working to expand its operations through a group of specialized subsidiaries. The ultimate goal is to provide clients with a matrix of comprehensive and integrated services that meet current and future needs of existing and potential clients. The bank will be working to develop the business of these subsidiaries in the fields of brokerage, leasing and finance chain.
The
Twen
ty-E
ight
h An
nual
Rep
ort o
f 201
1

19181. Approving the financial statement for the year 2011 and to free members of the board of directors of any liabilities as per the said period 2. Confirming the appointment of Jordan Drug Store Company as of June 15, 2011 on the board of directors after Abdul Raheem Jardaneh & Sons Co. relinquished its second seat on June 15, 20113. Approving the board of directors’ decision to distribute 8% of the paid capital through or JD8 million (eight million Jordanian dinar)4. Any other issuesThe board of directors thanks the shareholders and all those dealing with the bank for their trust and kind support. They also thank the bank’s employees for their loyal efforts, which contributed effectively to the bank continuous success.
Board of Directors’ Recommendations
2120Bank’s Activities and Financial Statements
The year 2011 witnessed the beginning of the so-called Arab Spring, which characterized the entire landscape in the region and imposed itself on the pace of events throughout the entire year, rendering 2011 a special year by all standards, especially in the economic realm. This was coupled with the EU sovereign debts crisis which brought back to minds the global financial crisis. All that had grave repercussions on the Jordanian economy as official figures indicate, including a 2.5% GDP growth. Despite all that, Investbank continued its activities, armed with a will and determination to make achievements that fuel progress of the bank while observing the established banking norms and credit standards. Such an approach enabled the bank to overcome the repercussions of the year and their local effects as it stands at the threshold of a new era of progress, achievement and success.
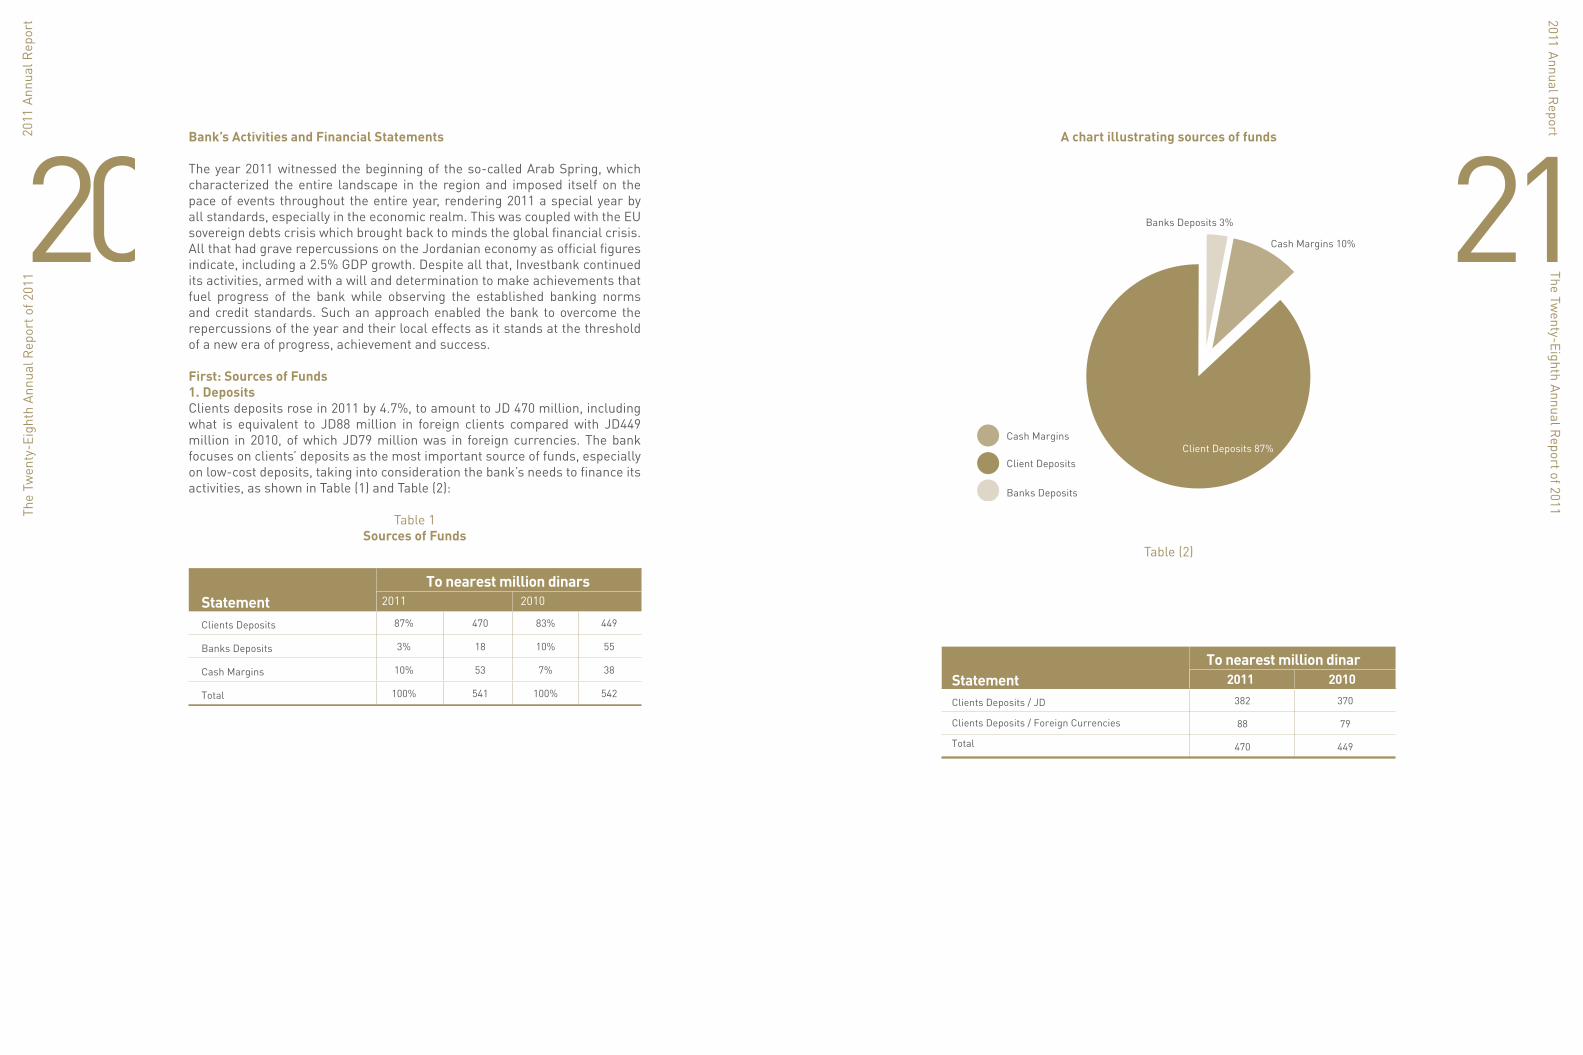
First: Sources of Funds1. Deposits Clients deposits rose in 2011 by 4.7%, to amount to JD 470 million, including what is equivalent to JD88 million in foreign clients compared with JD449 million in 2010, of which JD79 million was in foreign currencies. The bank focuses on clients’ deposits as the most important source of funds, especially on low-cost deposits, taking into consideration the bank’s needs to finance its activities, as shown in Table (1) and Table (2):
Table 1Sources of Funds
The
Twen
ty-E
ight
h An
nual
Rep
ort o
f 201
1
449
55
38
542
83%
10%
7%
100%
470
18
53
541
87%
3%
10%
100%
2011 2010Statement
Clients Deposits
Banks Deposits
Cash Margins
Total
To nearest million dinars
A chart illustrating sources of funds
Table (2)
The Twenty-Eighth Annual R
eport of 2011
Cash Margins 10%
Banks Deposits 3%
Cash Margins
Banks Deposits
Client DepositsClient Deposits 87%
370
79
449
382
88
470
2011 2010Statement Clients Deposits / JD
Clients Deposits / Foreign Currencies
Total
To nearest million dinar

23222. Growth in Shareholders’ Equity
By the end of 2011, shareholders’ equity rose to JD131 million from JD107 million at the end of 2010, with a growth rate of 22%.
Second: Uses of Funds
Table (3) illustrates the distribution of assets usage on various sectors as wellas the share of each sector
Table 3
Illustration of asset management for 2011
The
Twen
ty-E
ight
h An
nual
Rep
ort o
f 201
1
58
41
374
184
657
9%
6%
57%
28%
100%
83
39
387
168
677
12%
6%
57%
25%
100%
2011 2010Statement
Banks/Banking Institutions Accounts
& Deposits
Cash and Accounts at the Central
Bank of Jordan
Credit Facilities
Stock Portfolio
Total
To nearest million dinars
Cash and accounts at the Central Bank of Jordan 6%
Banks/Banking Institutions accounts & Deposits 12%
Stock Portfolio 25%
Stock Portfolio
Credit Facilities
Cash and accounts at the Central Bank of Jordan
Banks/Banking Institutions accounts & Deposits
Credit Facilities 57%
The Twenty-Eighth Annual R
eport of 2011
The following are details of some of the items pointed out above as follows:
- Investment in financial assets portfolio
Table (4): Size of bank’s investments at the end of 2011 as compared to 2010
22
162
184
20
148
168
2011 2010Statement
Financial Instruments/ Stock
Financial Instruments/ Bonds
Total
To nearest million dinar
20112010
2011
2010
20112010
180
160
140
120
100
80
60
40
20
0
Financial Instruments/ BondsFinancial Instruments/ Stock
25243. Credit Facilities
The bank was keen during 2011 to continue applying a prudent policy on extending credit facilities. Applications for credit were well studied and sorted out in line with the established credit criteria, regarding both direct and indirect facilities, as follows:
A: Direct Facilities
Despite the bank’s focus in 2011 on personal and housing loans programs in addition to various funding programs, the bank targeted SMEs as well as funding external trade and projects in the most active sectors. However, the bank followed a cautious policy before granting these facilities to avoid credit risks and to maintain the interest of clients themselves and shareholders in the first place. In spite of all these challenges and restrictions, the bank results in 2011 showed an increase in the size of credit facilities portfolio to reach a net of JD387 million, compared with JD374 million in 2010.
B: Indirect Facilities
Aware of the importance of financing external trade operations (through letters of credit, bills of collection, guarantees) as the second option for the usage of funds, the bank continued granting facilities to this sector, taking into consideration the inherent risks. Therefore, applications were reviewed and studied carefully. The bank sought to increase its share in the total funding extended to the external trade sector at the Kingdom’s level. The facilities offered by the bank to this sector reached in 2011 around JD238 million, compared with JD315 million in 2010.
Table (5) illustrates the indirect facilities:
240.049
75.445
315.494
174.486
63.076
237.562
2011 2010Statement
Outstanding of Insurance Policies & LOC
Outstanding Guarantees
Total
To nearest million dinar
The
Twen
ty-E
ight
h An
nual
Rep
ort o
f 201
1
Third: Statement of Income and Changes to Shareholders’ Equity
A: Statement of Income
Total earnings amounted in 2011 to JD36.492 million, while net profits stood at JD9.596 million after tax. Table (5) shows key revenues and expenses for 2011 and 2010.
Table (5)
100%
77%
12%
0%
10%
100%
47%
34%
19%
51.625
39.911
6.450
0.194
5.070
35.755
16.735
12.159
6.861
15.869
4.982
10.887
100%
78%
8%
6%
8%
100%
42%
33%
25%
53.221
41.458
4.309
2.952
4.502
39.571
16.729
13.062
9.780
13.650
4.054
9.596
Statement
Total Earnings
Debited Interests
Net Commissions
Profits of Financial Assets
Currency Differences & Others
Total Expenditures
Credited Interests
Administrative, General Expenditures& Consumptions
Debts Provisions & Various Provisions
Net Profits before Tax
Income Tax
Net Profits after Tax
To nearest million dinar
2011 Percentage 2010 Percentage
The Twenty-Eighth Annual R
eport of 2011
2726B: Statement of Changes in Shareholders’ Equity
Profits
Distributable profits reached JD9.382 million in 2011, including the profits made during the year and retained profits of 13,129. This includes JD2.131 million whose usage is restricted under the CBJ instructions and JD1.615 mil-lion restricted as a result of the effect of early application of the standard of the International Financial Reporting Number (9). The usage of this sum is restricted except for what can be actually achieved through sale in line with JSC instructions.
Changes to rounded up profits are illustrated in Table (6).
8,320,811
-
10,893,192
(7,500,000)
(1,967,392)
9,746,611
9,746,611
2,885,693
9,594,044
(7,750,000)
(1,347,300)
13,129,048
2011 2010Statement
Balance at the Beginning of the year
Effect of Early Application of the Standard of the
International Financial Reporting Number (9)
Year’s profits
Transferred to Capital
Transferred to (from) Reserves
Balance of Retained Profits at Yearend
To nearest million dinar
The
Twen
ty-E
ight
h An
nual
Rep
ort o
f 201
1
Shareholders’ Equity
A total of 14,750,000 shares were offered to private placement with the purpose of raising capital to JD100 million, where the private placement was14,116,574. The unsubscribed shares were 633,426 and will be handled in line with instructions governing equity issued by the JSC. The shares offered for capital raise were listed in Amman Stock Exchange as of January 30, 2012.
Accordingly, shareholders’ equity stood at JD131 million, compared with JD107 million in 2010, with a 22% increase. Table (7) shows total shareholders’ equity for 2011 and 2010:
Table (7)
77,500,000
-
13,331,959
3,211,949
3,630,749
-
9,746,611
107,421,268
85,250,000
14,116,574
14,710,442
3,180,766
-
1,035,208
13,129,048
131,422,038
2011 2010Statement
Paid Capital
Capital Raise Payments
Legal Reserves
General Banking Risks Reserves
Variation of Fair Value
Net Fair Value Reserve
Retained Profits
Total
To nearest million dinar
The Twenty-Eighth Annual R
eport of 2011
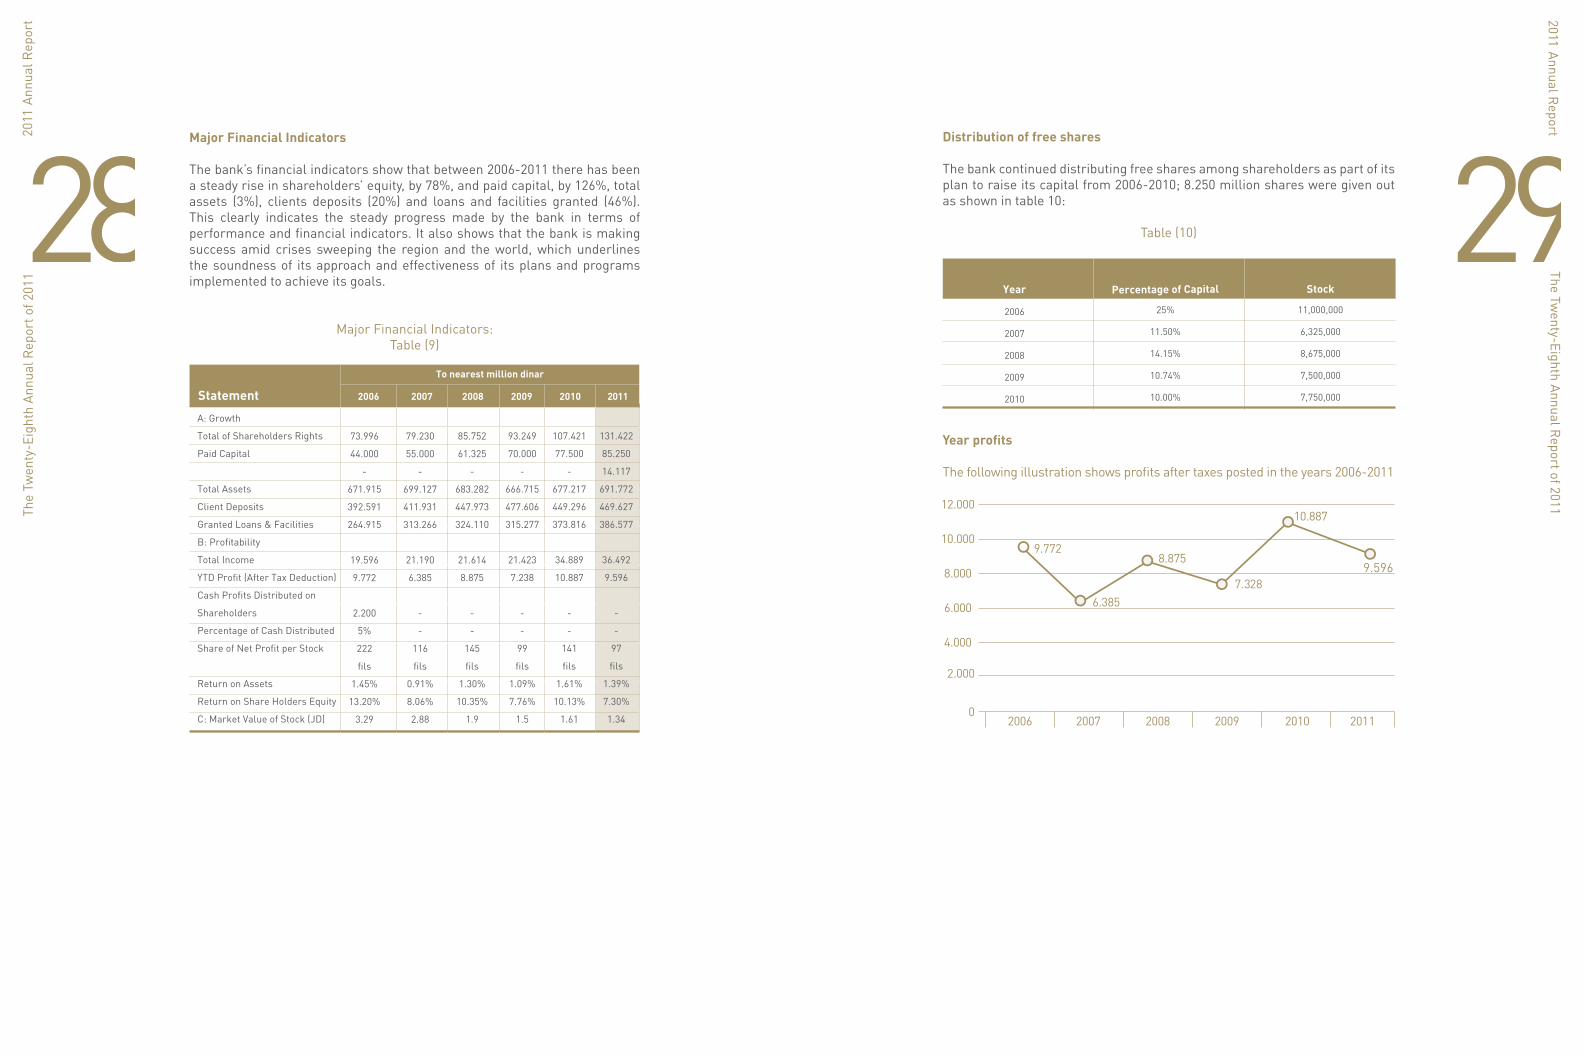
2928Major Financial Indicators
The bank’s financial indicators show that between 2006-2011 there has been a steady rise in shareholders’ equity, by 78%, and paid capital, by 126%, total assets (3%), clients deposits (20%) and loans and facilities granted (46%). This clearly indicates the steady progress made by the bank in terms of performance and financial indicators. It also shows that the bank is making success amid crises sweeping the region and the world, which underlines the soundness of its approach and effectiveness of its plans and programs implemented to achieve its goals.
Major Financial Indicators:Table (9)
To nearest million dinar
2006Statement 2007 2008 2009 2010 2011
A: Growth
Total of Shareholders Rights
Paid Capital
Total Assets
Client Deposits
Granted Loans & Facilities
B: Profitability
Total Income
YTD Profit (After Tax Deduction)
Cash Profits Distributed on
Shareholders
Percentage of Cash Distributed
Share of Net Profit per Stock
Return on Assets
Return on Share Holders Equity
C: Market Value of Stock (JD)
73.996
44.000
-
671.915
392.591
264.915
19.596
9.772
2.200
5%
222
fils
1.45%
13.20%
3.29
79.230
55.000
-
699.127
411.931
313.266
21.190
6.385
-
-
116
fils
0.91%
8.06%
2.88
85.752
61.325
-
683.282
447.973
324.110
21.614
8.875
-
-
145
fils
1.30%
10.35%
1.9
93.249
70.000
-
666.715
477.606
315.277
21.423
7.238
-
-
99
fils
1.09%
7.76%
1.5
107.421
77.500
-
677.217
449.296
373.816
34.889
10.887
-
-
141
fils
1.61%
10.13%
1.61
131.422
85.250
14.117
691.772
469.627
386.577
36.492
9.596
-
-
97
fils
1.39%
7.30%
1.34
The
Twen
ty-E
ight
h An
nual
Rep
ort o
f 201
1
Distribution of free shares
The bank continued distributing free shares among shareholders as part of its plan to raise its capital from 2006-2010; 8.250 million shares were given out as shown in table 10:
Table (10)
Year profits
The following illustration shows profits after taxes posted in the years 2006-2011
11,000,000
6,325,000
8,675,000
7,500,000
7,750,000
25%
11.50%
14.15%
10.74%
10.00%
Percentage of Capital StockYear
2006
2007
2008
2009
2010
9.596
The Twenty-Eighth Annual R
eport of 2011

3130
Stake owned by board members and top management personnel and their relatives and companies they control for 2010-2011
3332Th
e Tw
enty
-Eig
hth
Annu
al R
epor
t of 2
011
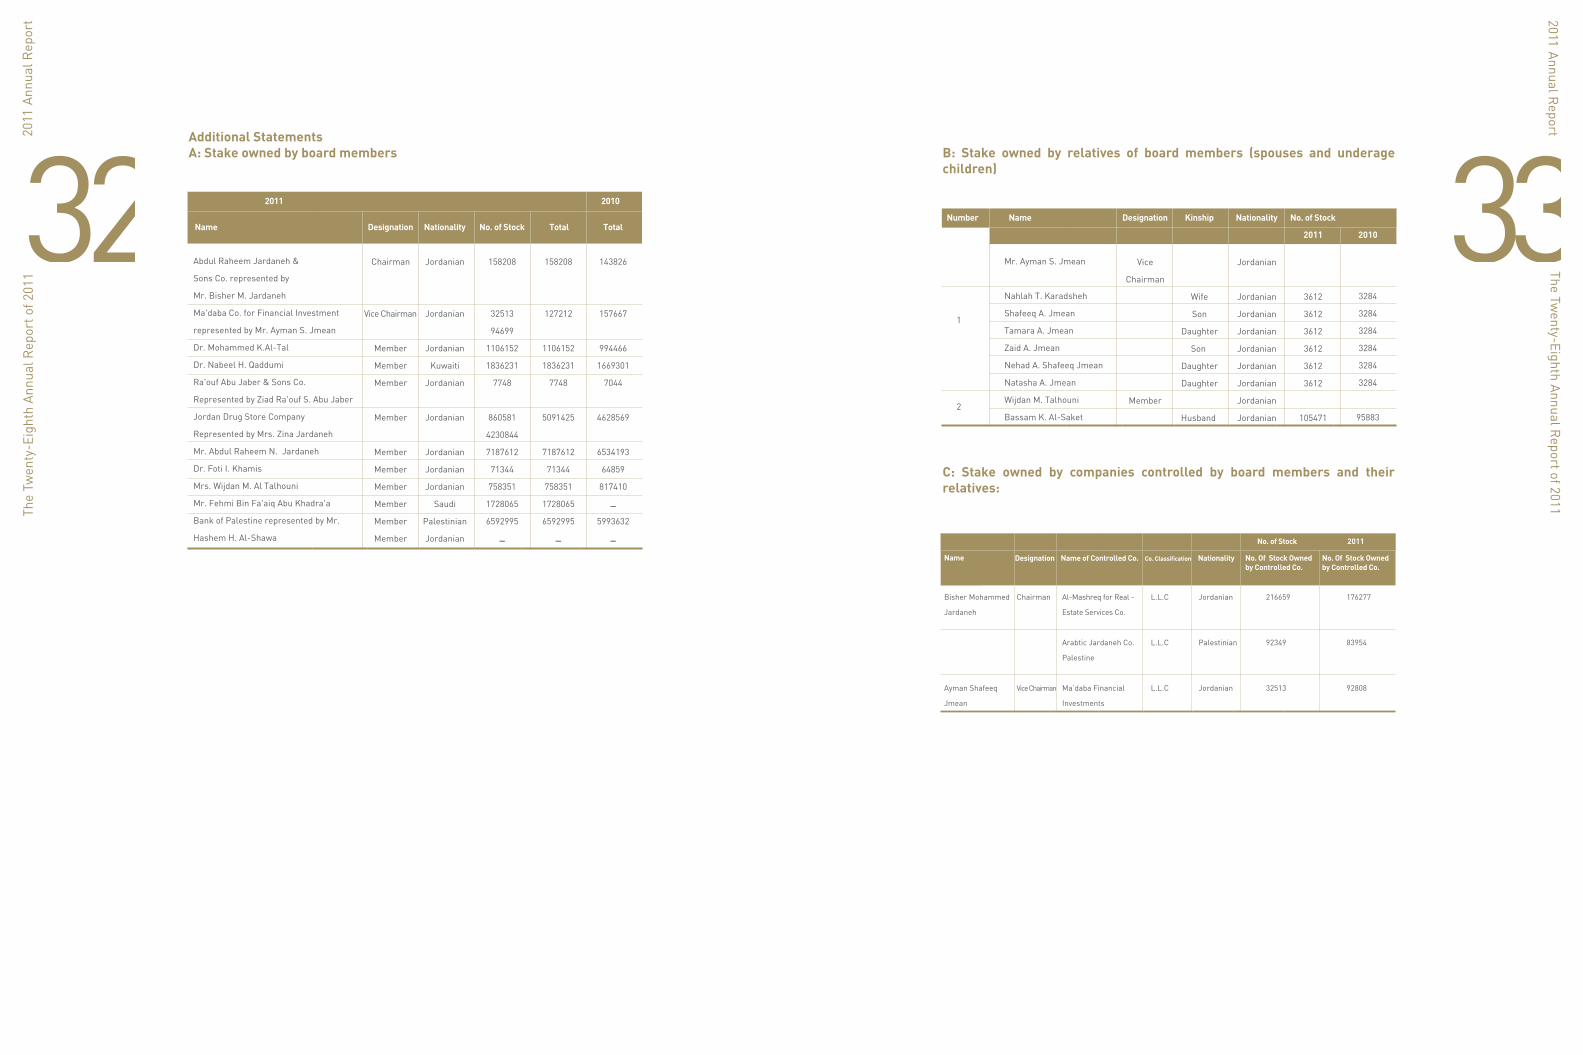
Additional Statements A: Stake owned by board members
2011 2010
Designation
Chairman
Vice Chairman
Member
Member
Member
Member
Member
Member
Member
Member
Member
Member
Nationality
Jordanian
Jordanian
Jordanian
Kuwaiti
Jordanian
Jordanian
Jordanian
Jordanian
Jordanian
Saudi
Palestinian
Jordanian
No. of Stock
158208
32513
94699
1106152
1836231
7748
860581
4230844
7187612
71344
758351
1728065
6592995
ــ
Total
158208
127212
1106152
1836231
7748
5091425
7187612
71344
758351
1728065
6592995
ــ
Total
143826
157667
994466
1669301
7044
4628569
6534193
64859
817410
ــ
5993632
ــ
Name
Abdul Raheem Jardaneh &
Sons Co. represented by
Mr. Bisher M. Jardaneh
Ma'daba Co. for Financial Investment
represented by Mr. Ayman S. Jmean
Dr. Mohammed K.Al-Tal
Dr. Nabeel H. Qaddumi
Ra'ouf Abu Jaber & Sons Co.
Represented by Ziad Ra'ouf S. Abu Jaber
Jordan Drug Store Company
Represented by Mrs. Zina Jardaneh
Mr. Abdul Raheem N. Jardaneh
Dr. Foti I. Khamis
Mrs. Wijdan M. Al Talhouni
Mr. Fehmi Bin Fa'aiq Abu Khadra'a
Bank of Palestine represented by Mr.
Hashem H. Al-Shawa
The Twenty-Eighth Annual R
eport of 2011
B: Stake owned by relatives of board members (spouses and underage children)
C: Stake owned by companies controlled by board members and their relatives:
No. of StockNationalityKinshipDesignation
Vice
Chairman
Member
Wife
Son
Daughter
Son
Daughter
Daughter
Husband
Jordanian
Jordanian
Jordanian
Jordanian
Jordanian
Jordanian
Jordanian
Jordanian
Jordanian
3612
3612
3612
3612
3612
3612
105471
3284
3284
3284
3284
3284
3284
95883
NameNumber
Mr. Ayman S. Jmean
Nahlah T. Karadsheh
Shafeeq A. Jmean
Tamara A. Jmean
Zaid A. Jmean
Nehad A. Shafeeq Jmean
Natasha A. Jmean
Wijdan M. Talhouni
Bassam K. Al-Saket
1
2
20102011
No. of Stock
NationalityCo. ClassificationDesignation Name of Controlled Co.Name
Bisher Mohammed
Jardaneh
Ayman Shafeeq
Jmean
Chairman
Vice Chairman
Al-Mashreq for Real -
Estate Services Co.
Arabtic Jardaneh Co.
Palestine
Ma’daba Financial
Investments
L.L.C
L.L.C
L.L.C
Jordanian
Palestinian
Jordanian
216659
92349
32513
176277
83954
92808
2011
No. Of Stock Owned by Controlled Co.
No. Of Stock Owned by Controlled Co.
34D: Stake owned by members of the top/executive management
There are no stocks owned by members of the higher/executive management E: Stake owned by companies controlled by relatives of members of the top/executive management (spouses and underage children)
There are no stocks owned by companies controlled by relatives of members of the higher/executive management.
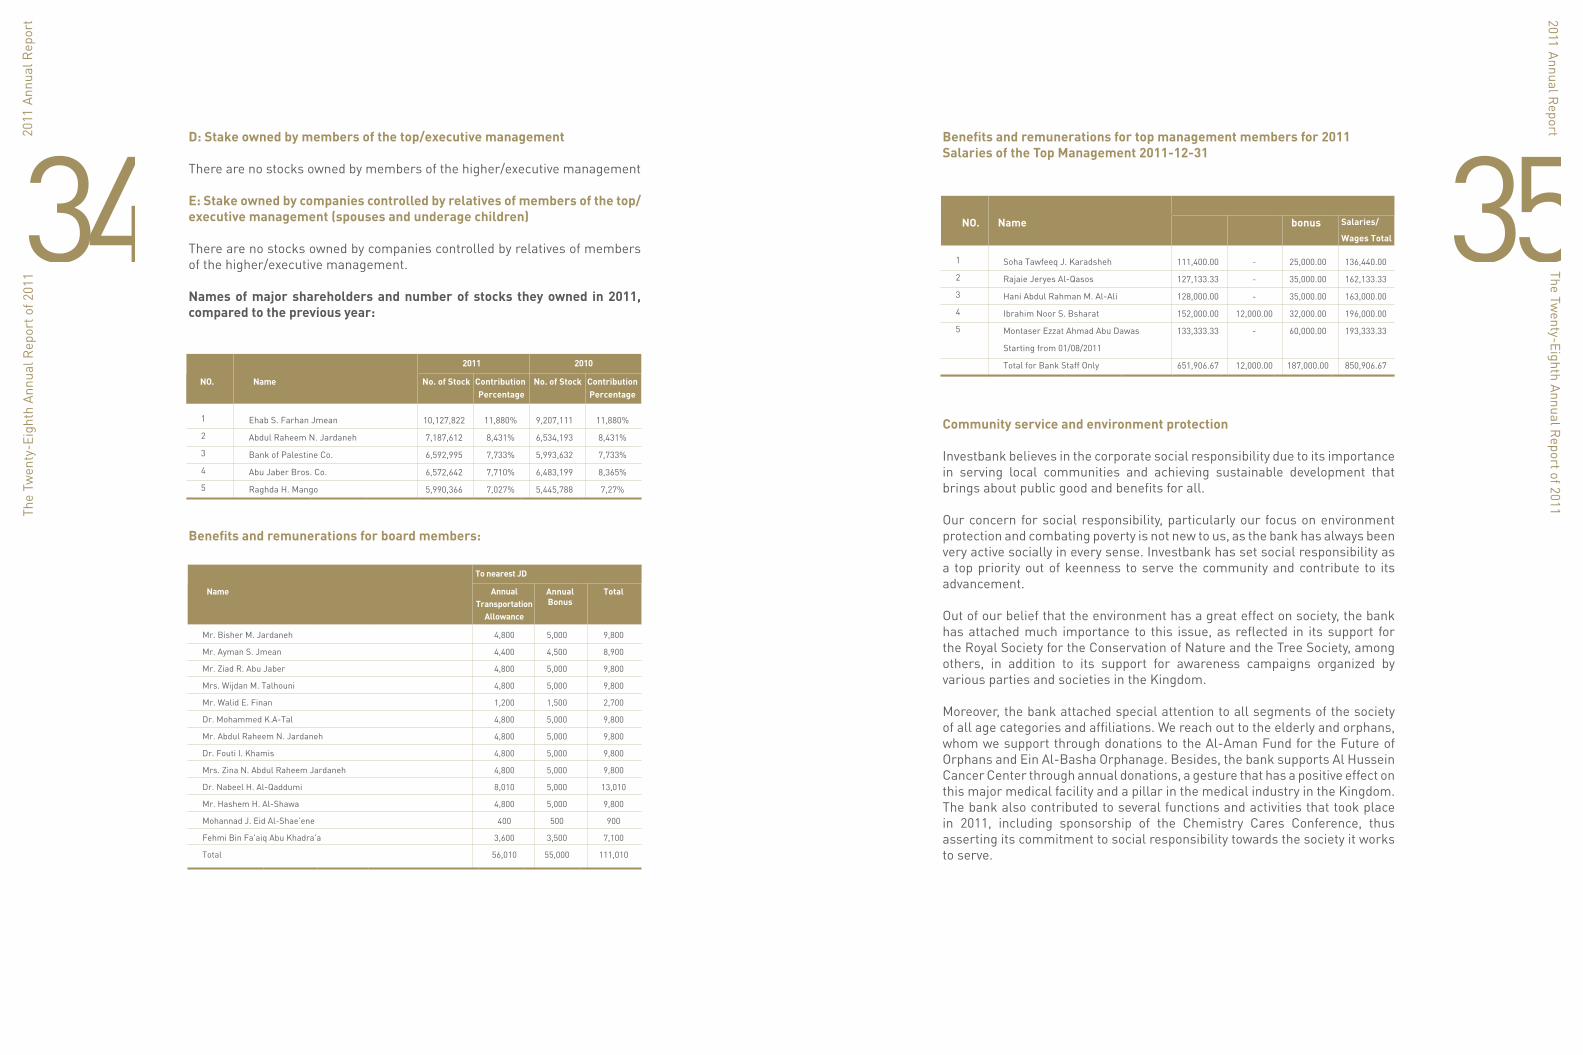
Names of major shareholders and number of stocks they owned in 2011, compared to the previous year:
Benefits and remunerations for board members:
The
Twen
ty-E
ight
h An
nual
Rep
ort o
f 201
1
20102011
10,127,822
7,187,612
6,592,995
6,572,642
5,990,366
11,880%
8,431%
7,733%
7,710%
7,027%
9,207,111
6,534,193
5,993,632
6,483,199
5,445,788
11,880%
8,431%
7,733%
8,365%
7,27%
NameNO.
Ehab S. Farhan Jmean
Abdul Raheem N. Jardaneh
Bank of Palestine Co.
Abu Jaber Bros. Co.
Raghda H. Mango
1
2
3
4
5
ContributionPercentage
No. of StockContribution Percentage
No. of Stock
To nearest JD
4,800
4,400
4,800
4,800
1,200
4,800
4,800
4,800
4,800
8,010
4,800
400
3,600
56,010
5,000
4,500
5,000
5,000
1,500
5,000
5,000
5,000
5,000
5,000
5,000
500
3,500
55,000
9,800
8,900
9,800
9,800
2,700
9,800
9,800
9,800
9,800
13,010
9,800
900
7,100
111,010
Name
Mr. Bisher M. Jardaneh
Mr. Ayman S. Jmean
Mr. Ziad R. Abu Jaber
Mrs. Wijdan M. Talhouni
Mr. Walid E. Finan
Dr. Mohammed K.A-Tal
Mr. Abdul Raheem N. Jardaneh
Dr. Fouti I. Khamis
Mrs. Zina N. Abdul Raheem Jardaneh
Dr. Nabeel H. Al-Qaddumi
Mr. Hashem H. Al-Shawa
Mohannad J. Eid Al-Shae'ene
Fehmi Bin Fa'aiq Abu Khadra'a
Total
TotalAnnualBonus
AnnualTransportation
Allowance
35Benefits and remunerations for top management members for 2011Salaries of the Top Management 2011-12-31
Community service and environment protection
Investbank believes in the corporate social responsibility due to its importance in serving local communities and achieving sustainable development that brings about public good and benefits for all.
Our concern for social responsibility, particularly our focus on environment protection and combating poverty is not new to us, as the bank has always been very active socially in every sense. Investbank has set social responsibility as a top priority out of keenness to serve the community and contribute to its advancement.
Out of our belief that the environment has a great effect on society, the bank has attached much importance to this issue, as reflected in its support for the Royal Society for the Conservation of Nature and the Tree Society, among others, in addition to its support for awareness campaigns organized by various parties and societies in the Kingdom.
Moreover, the bank attached special attention to all segments of the society of all age categories and affiliations. We reach out to the elderly and orphans, whom we support through donations to the Al-Aman Fund for the Future of Orphans and Ein Al-Basha Orphanage. Besides, the bank supports Al Hussein Cancer Center through annual donations, a gesture that has a positive effect on this major medical facility and a pillar in the medical industry in the Kingdom. The bank also contributed to several functions and activities that took place in 2011, including sponsorship of the Chemistry Cares Conference, thus asserting its commitment to social responsibility towards the society it works to serve.
The Twenty-Eighth Annual R
eport of 2011
111,400.00
127,133.33
128,000.00
152,000.00
133,333.33
651,906.67
-
-
-
12,000.00
-
12,000.00
25,000.00
35,000.00
35,000.00
32,000.00
60,000.00
187,000.00
136,440.00
162,133.33
163,000.00
196,000.00
193,333.33
850,906.67
NameNO.
Soha Tawfeeq J. Karadsheh
Rajaie Jeryes Al-Qasos
Hani Abdul Rahman M. Al-Ali
Ibrahim Noor S. Bsharat
Montaser Ezzat Ahmad Abu Dawas
Starting from 01/08/2011
Total for Bank Staff Only
1
2
3
4
5
Salaries/
Wages Total
bonus
To nearest million dinar

3736Auditing fees for the bank and subsidiariesAuditing fees for Investbank stood in 2011 at JD69,960 Auditing fees for Al-Mawared for Brokerage stood in 2011 at JD11,658Auditing fees for Tamkeen Leasing stood in 2011 at JD1,500Auditing fees for the IB Bank Co. for Supply Chain Funding stood in 2011 at JD4080.300 Human resources developmentThe bank’s management is concerned with attracting qualified job candidates and then sorting them out, applying established selection rules and ensuring that there is an enough number of qualified competitors at the same time in line with the plans of the personnel and bank’s organizational chart. The aim is to recruit qualified and competent persons who are able to shoulder full responsibility for delivering the bank’s message and achieve its goals. The bank appointed in 2011 a group of highly qualified and experienced employees to support its banking team. By the end of the year, the total number of employees stood at 372.
Number of the bank’s employees and their educational levels:
(Excluding Subsidiaries)
The
Twen
ty-E
ight
h An
nual
Rep
ort o
f 201
1
10,000
28,125
3,000
10,000
17,056
15,000
150
83,331
Al-Aman Fund for the Future of Orphans
Royal Society for the Conservation of Nature
Coffee Break Sponsor
Tree Society
The Jordan Hashemite Fund for Human Development
Al Hussein cancer Center
Ein Al-Basha Orphanage
Total
Donation Recipient Amount/JD
0
27
204
54
10
30
325
Doctorate
Master's Degree
Bachelor
Diploma
High School Level
Below High School Level
Total
Statement No.
Distribution of employees among headquarters and branches
Employees are distributed among the main offices, branches, Imdad and Al Mawared for Brokerage subsidiaries in line with job requirements and in away that ensures they do their jobs with the highest level of proficiency and productivity. They are distributed as follows:
The Twenty-Eighth Annual R
eport of 2011
8
14
6
9
9
9
8
10
9
9
325
13
21
13
47
Mecca Branch/Mecca St.
Main Branch/General Administration
Emaar Branch
Al-Madina Branch/King Hussein St.
Sweifieh Branch/Opposite the 7th Circle
Al-Wihdat Branch/Middle East Circle
Sahab Branch/Industrial Estate
Al-Zarqa Branch/King Hussein St.
Irbid Branch/Wasfi Al-Tal St.
Aqaba Branch/Al-Nahda St.
Total
Al-Mawared for Brokerage/Shmeisani
Imdad/Jwaideh
Tamkeen Leasing
Total
General Administration 234
Subsidiaries
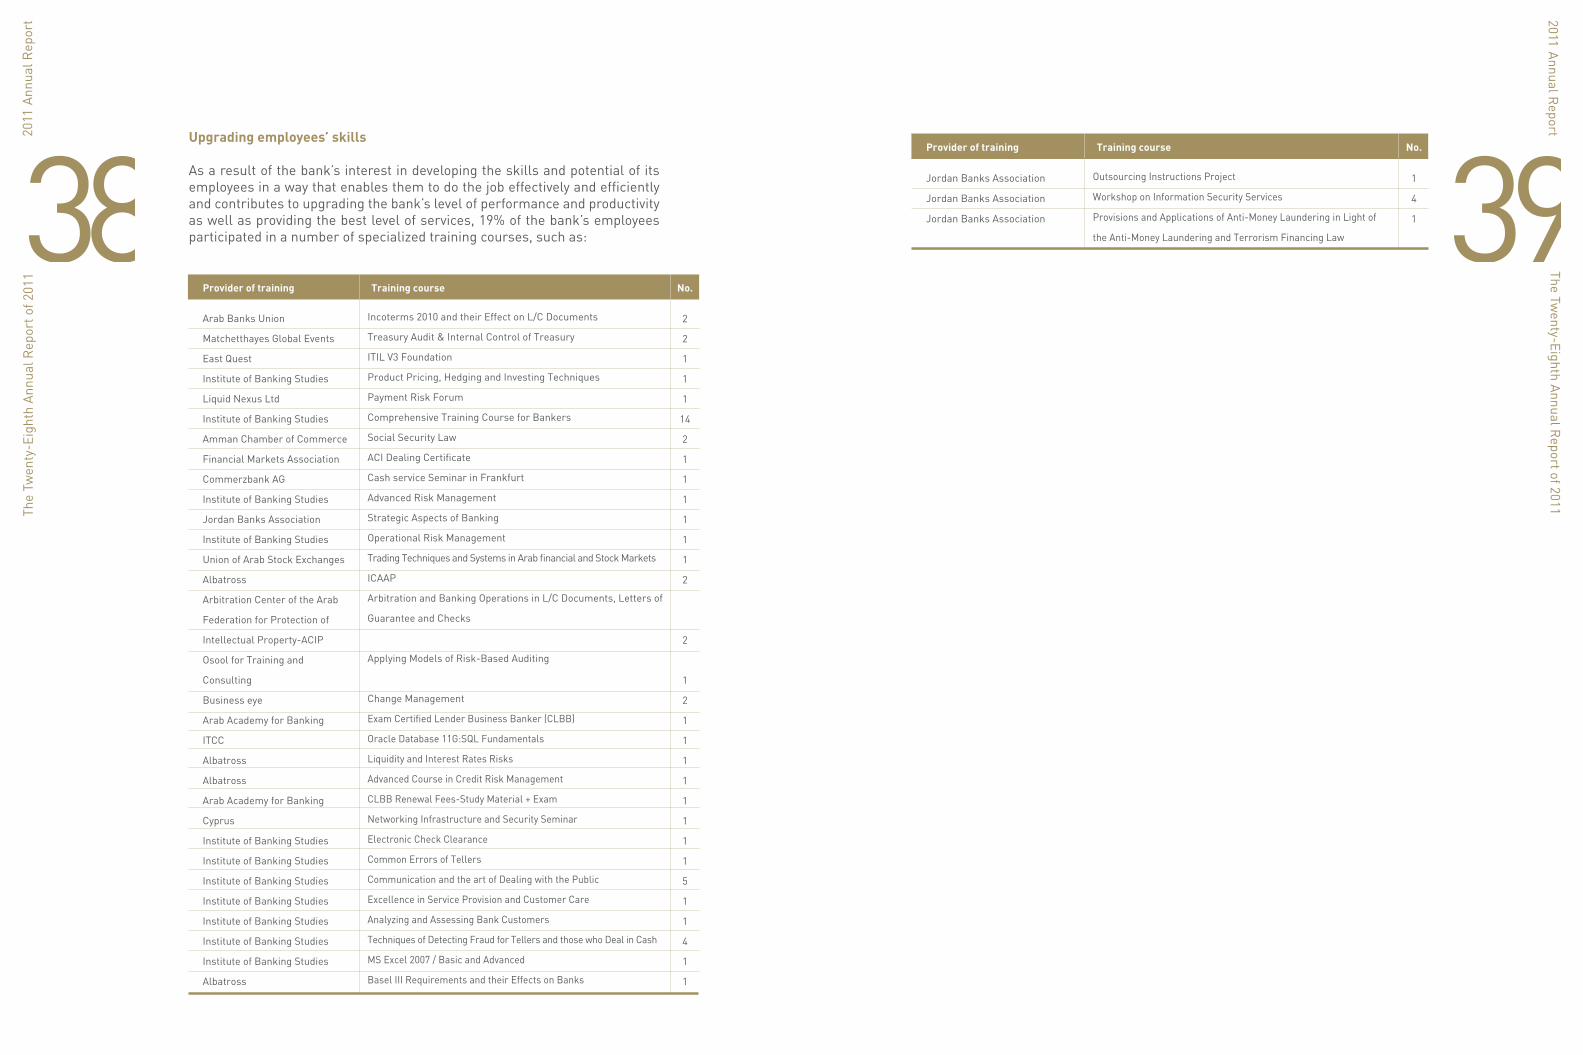
3938Upgrading employees’ skills
As a result of the bank’s interest in developing the skills and potential of its employees in a way that enables them to do the job effectively and efficiently and contributes to upgrading the bank’s level of performance and productivity as well as providing the best level of services, 19% of the bank’s employees participated in a number of specialized training courses, such as:
The
Twen
ty-E
ight
h An
nual
Rep
ort o
f 201
1
2
2
1
1
1
14
2
1
1
1
1
1
1
2
2
1
2
1
1
1
1
1
1
1
1
5
1
1
4
1
1
Arab Banks Union
Matchetthayes Global Events
East Quest
Institute of Banking Studies
Liquid Nexus Ltd
Institute of Banking Studies
Amman Chamber of Commerce
Financial Markets Association
Commerzbank AG
Institute of Banking Studies
Jordan Banks Association
Institute of Banking Studies
Union of Arab Stock Exchanges
Albatross
Arbitration Center of the Arab
Federation for Protection of
Intellectual Property-ACIP
Osool for Training and
Consulting
Business eye
Arab Academy for Banking
ITCC
Albatross
Albatross
Arab Academy for Banking
Cyprus
Institute of Banking Studies
Institute of Banking Studies
Institute of Banking Studies
Institute of Banking Studies
Institute of Banking Studies
Institute of Banking Studies
Institute of Banking Studies
Albatross
Provider of training Training course No.
Incoterms 2010 and their Effect on L/C Documents
Treasury Audit & Internal Control of Treasury
ITIL V3 Foundation
Product Pricing, Hedging and Investing Techniques
Payment Risk Forum
Comprehensive Training Course for Bankers
Social Security Law
ACI Dealing Certificate
Cash service Seminar in Frankfurt
Advanced Risk Management
Strategic Aspects of Banking
Operational Risk Management
Trading Techniques and Systems in Arab financial and Stock Markets
ICAAP
Arbitration and Banking Operations in L/C Documents, Letters of
Guarantee and Checks
Applying Models of Risk-Based Auditing
Change Management
Exam Certified Lender Business Banker (CLBB)
Oracle Database 11G:SQL Fundamentals
Liquidity and Interest Rates Risks
Advanced Course in Credit Risk Management
CLBB Renewal Fees-Study Material + Exam
Networking Infrastructure and Security Seminar
Electronic Check Clearance
Common Errors of Tellers
Communication and the art of Dealing with the Public
Excellence in Service Provision and Customer Care
Analyzing and Assessing Bank Customers
Techniques of Detecting Fraud for Tellers and those who Deal in Cash
MS Excel 2007 / Basic and Advanced
Basel III Requirements and their Effects on Banks
The Twenty-Eighth Annual R
eport of 2011
1
4
1
Jordan Banks Association
Jordan Banks Association
Jordan Banks Association
Provider of training Training course No.
Outsourcing Instructions Project
Workshop on Information Security Services
Provisions and Applications of Anti-Money Laundering in Light of
the Anti-Money Laundering and Terrorism Financing Law

40D: Subsidiaries
1) Al-Mawared for BrokerageClassification: L.L.CMain Activity: Business FinancialBroke through broker, dealer, and margin fundingCapital: JD10 million Percentage of Bank Ownership: 100%Address: Amman – Shmeisani – Abdul Hamid Sharaf Street - Building No. 43, next to Professional Associations Complex - Investbank BuildingTel: +962 6 5630500 - Fax: +962 6 5622405No. of Employees: 13Branches Address: No BranchesProjects owned by the company and its capitals: NoneMember of managers board/general manager : Miss Hana Al-Harasees
2) Tamkeen Leasing Company:Classification: L.L.C (license number 13153)Main Activity: Lease Business and importing of items related to its operationCapital: JD3 millionPercentage of Bank Ownership: 90%Address: Mecca St. – Building no. 244 – Investbank BuildingTel: +962 6 5502610 - Fax: +962 6 5502609No. of Employees: 13Branches Address: No BranchesProjects owned by the company and their capitals: All assets and projects are registered in the name of the company through leasing contractsThe company is accredited and licensed
3) Al ImdadClassification: L.L.CMain Activity: Financing performing capitals, imports and exports of goods and basic commoditiesCapital: JD3 millionPercentage of Bank Ownership: 94%Address: Amman – Jwaideh – Salah Fleih Ateyat St. – Building No. 19Tel: +96 2 4130301 – Fax: +962 6 4130412No. of Employees: 21Branch addresses: Investbank Bonded – Sahab – King Abdullah Industrial EstateProjects owned by company: None
Capital Investment:The bank’s capital investment reached JD26,387,692 by December 31, 2011.
The Competitive Status of the Bank:The bank’s share of the local banking market was as follows: Client Depositsreached 1.93%, whereas the total facilities share reached 2.44%.
The
Twen
ty-E
ight
h An
nual
Rep
ort o
f 201
1
2011
INVESTB
AN
K(A
PU
BLIC
SHA
REH
OLD
ING
C
OM
PAN
Y)A
MM
AN
- JOR
DA
ND
ECEM
BER
31, 2011
Independent Auditor's R
eport
Consolidated Statem
ent ofC
omprehensive Incom
eC
onsolidated Statement of C
hangesin O
wners' Equity
Consolidated Statem
ent of Cash Flow
s
Independent auditor's reportA
nnual Report
Consolidated Statem
ent of Income
Consolidated Statem
ent ofFinancial P
osition
Notes to C
onsolidated Financial Statements
41

4342Independent Auditor’s
Report 31/12/2011
44
Independent Auditor’s Report AM/ 31664To the Shareholders ofINVESTBANKAmman – The Hashemite Kingdom of Jordan
Report on the Consolidated Financial StatementsWe have audited the accompanying consolidated financial statements of INVESTBANK (a public shareholding company), which comprise of the consolidated statement of financial position as of December 31, 2011, and the consolidated statements of income, comprehensive income, changes in owners’ equity and cash flows for the year then ended, and a summary of significant accounting policies and other explanatory information.
Management’s Responsibility for the Consolidated Financial StatementsManagement is responsible for the preparation and fair presentation of these consolidated financial statements in accordance with International Financial Reporting Standards, and for such internal control as management determines necessary to enable the preparation of financial statements that are free from material misstatement, whether due to fraud or error.
Auditor’s ResponsibilityOur responsibility is to express an opinion on these consolidated financial statements based on our audit. We conducted our audit in accordance with International Standards on Auditing. Those standards require that we comply with ethical requirements and plan and perform the audit to obtain reasonable assurance whether the consolidated financial statements are free from material misstatement. An audit involves performing procedures to obtain audit evidence about the amounts and disclosures in the consolidated financial statements. The procedures selected depend on the auditor’s judgment, including the assessment of the risks of material misstatement of the consolidated financial statements, whether due to fraud or error. In making those risk assessments, the auditor considers internal control relevant to the Bank’s preparation and fair presentation of the consolidated financial statements in order to design audit procedures that are appropriate in the circumstances, but not for the purpose of expressing an opinion on the effectiveness of the Bank’s internal control. An audit also includes evaluating the appropriateness of accounting policies used and the reasonableness of accounting estimates made by management, as well as evaluating the overall presentation of the consolidated financial statements.
We believe that the audit evidence we have obtained is sufficient and appropriate to provide a basis for our audit opinion.
45
OpinionIn our opinion, the consolidated financial statements present fairly, in all material respects, the consolidated financial position of INVESTBANK as of December 31, 2011, and its consolidated financial performance and its consolidated cash flows for the year then ended in accordance with International Financial Reporting Standards.
Report on Other Legal and Regulatory RequirementsThe Bank maintains proper accounting records and the accompanying consolidated financial statements are in agreement therewith and with the consolidated financial statements presented in the Board of Directors’ report. We recommend that the General Assembly of Shareholders approve these consolidated financial statements.
The accompanying consolidated financial statements are a translation of the statutory financial statements which are in the Arabic language to which reference should be made.
Amman – Jordan Deloitte & Touche (M.E.) – JordanFebruary 22, 2012
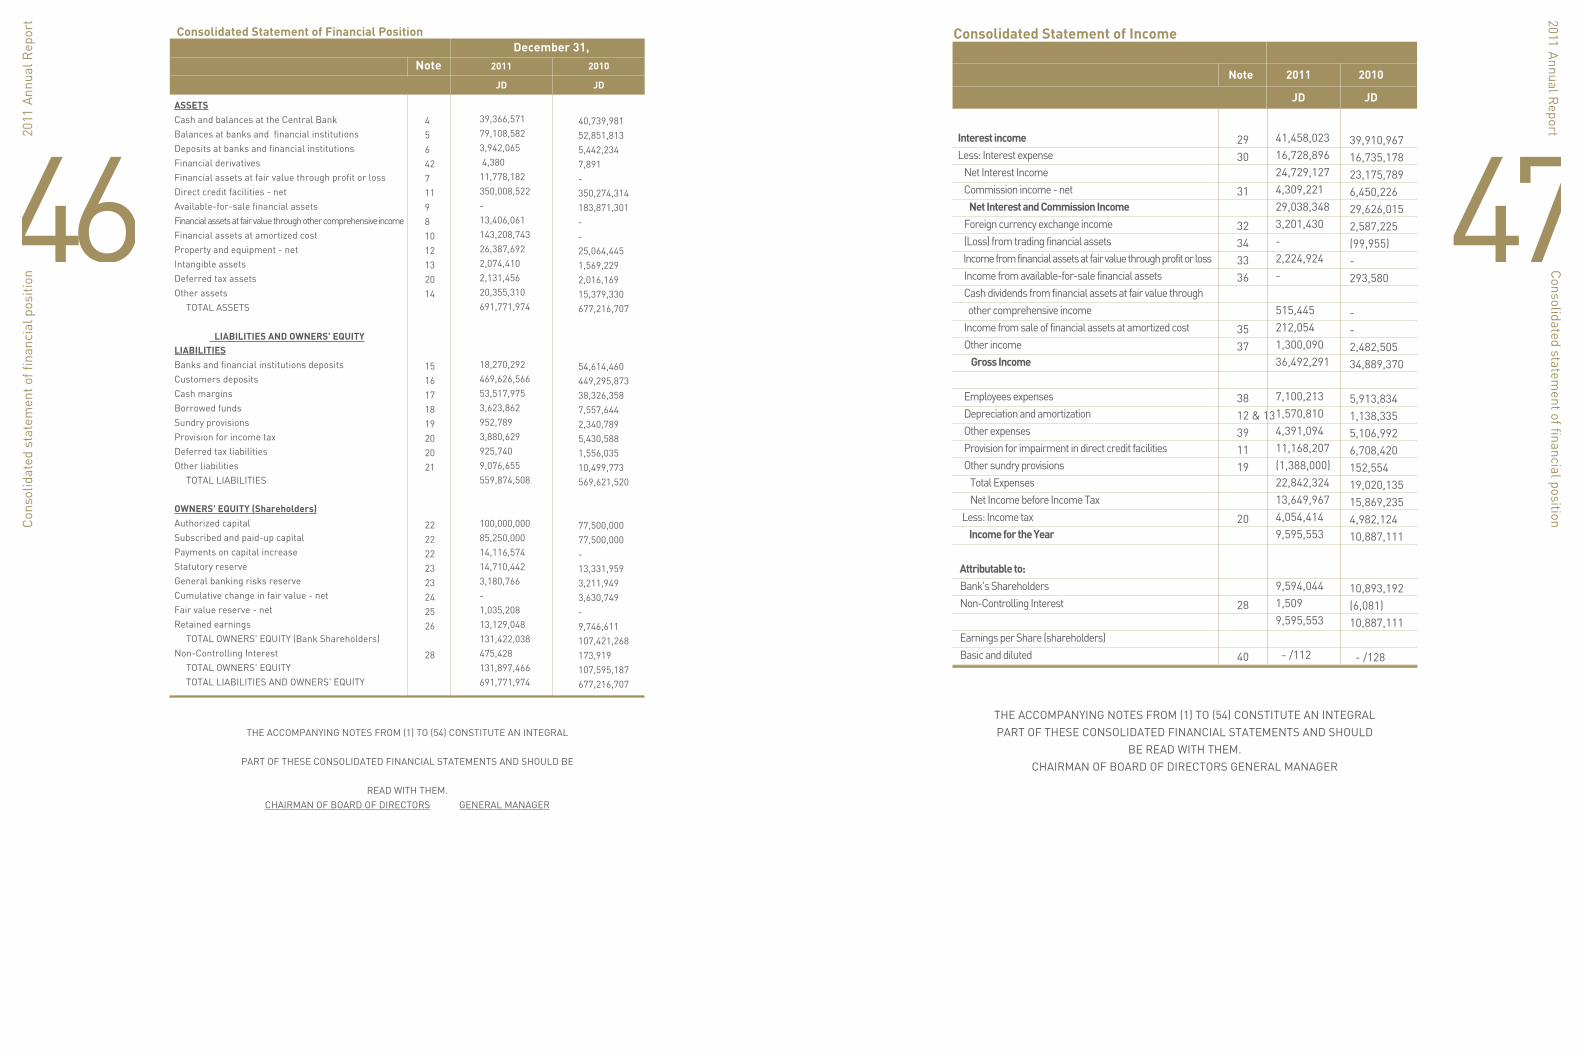
46Consolidated Statement of Financial Position
Note 2011 2010
JD JD
December 31,
ASSETSCash and balances at the Central BankBalances at banks and financial institutionsDeposits at banks and financial institutionsFinancial derivativesFinancial assets at fair value through profit or lossDirect credit facilities - netAvailable-for-sale financial assetsFinancial assets at fair value through other comprehensive incomeFinancial assets at amortized costProperty and equipment - netIntangible assetsDeferred tax assetsOther assets TOTAL ASSETS
LIABILITIES AND OWNERS' EQUITYLIABILITIESBanks and financial institutions deposits Customers depositsCash marginsBorrowed fundsSundry provisionsProvision for income taxDeferred tax liabilitiesOther liabilities TOTAL LIABILITIES
OWNERS' EQUITY (Shareholders)Authorized capitalSubscribed and paid-up capitalPayments on capital increaseStatutory reserveGeneral banking risks reserveCumulative change in fair value - netFair value reserve - netRetained earnings TOTAL OWNERS' EQUITY (Bank Shareholders)Non-Controlling Interest TOTAL OWNERS' EQUITY TOTAL LIABILITIES AND OWNERS' EQUITY
4 5 6 42 7 11 9 8 10 12 13 20 14 15 16 17 18 19 20 20 21 22 22 22 23 23 24 25 26 28
39,366,57179,108,5823,942,065 4,380 11,778,182 350,008,522-13,406,061143,208,74326,387,6922,074,4102,131,45620,355,310691,771,974
18,270,292469,626,56653,517,9753,623,862952,7893,880,629925,7409,076,655559,874,508
100,000,00085,250,00014,116,57414,710,4423,180,766-1,035,20813,129,048131,422,038 475,428131,897,466 691,771,974
40,739,98152,851,8135,442,2347,891-350,274,314183,871,301--25,064,4451,569,2292,016,16915,379,330677,216,707
54,614,460449,295,87338,326,3587,557,6442,340,7895,430,5881,556,03510,499,773569,621,520
77,500,00077,500,000-13,331,9593,211,9493,630,749-9,746,611107,421,268 173,919107,595,187 677,216,707
THE ACCOMPANYING NOTES FROM (1) TO (54) CONSTITUTE AN INTEGRAL
PART OF THESE CONSOLIDATED FINANCIAL STATEMENTS AND SHOULD BE
READ WITH THEM.CHAIRMAN OF BOARD OF DIRECTORS GENERAL MANAGER
47Consolidated Statement of Income
2011 2010
JD JD
Interest incomeLess: Interest expense Net Interest Income Commission income - net Net Interest and Commission Income Foreign currency exchange income (Loss) from trading financial assets Income from financial assets at fair value through profit or loss Income from available-for-sale financial assets Cash dividends from financial assets at fair value through other comprehensive income Income from sale of financial assets at amortized cost Other income Gross Income
Employees expenses Depreciation and amortization Other expenses Provision for impairment in direct credit facilities Other sundry provisions Total Expenses Net Income before Income Tax Less: Income tax Income for the Year
Attributable to: Bank's Shareholders Non-Controlling Interest
Earnings per Share (shareholders) Basic and diluted
2930 31
32343336
3537
3812 & 13391119
20
28
40
41,458,023 16,728,896 24,729,127 4,309,221 29,038,348 3,201,430 - 2,224,924 -
515,445 212,054 1,300,090 36,492,291
7,100,213 1,570,810 4,391,094 11,168,207 (1,388,000) 22,842,324 13,649,967 4,054,414 9,595,553
9,594,044 1,509 9,595,553
- /112
39,910,967 16,735,178 23,175,789 6,450,226 29,626,015 2,587,225 (99,955) - 293,580
- - 2,482,505 34,889,370
5,913,834 1,138,335 5,106,992 6,708,420 152,554 19,020,135 15,869,235 4,982,124 10,887,111
10,893,192 (6,081) 10,887,111
- /128
THE ACCOMPANYING NOTES FROM (1) TO (54) CONSTITUTE AN INTEGRALPART OF THESE CONSOLIDATED FINANCIAL STATEMENTS AND SHOULD
BE READ WITH THEM.CHAIRMAN OF BOARD OF DIRECTORS GENERAL MANAGER
Note
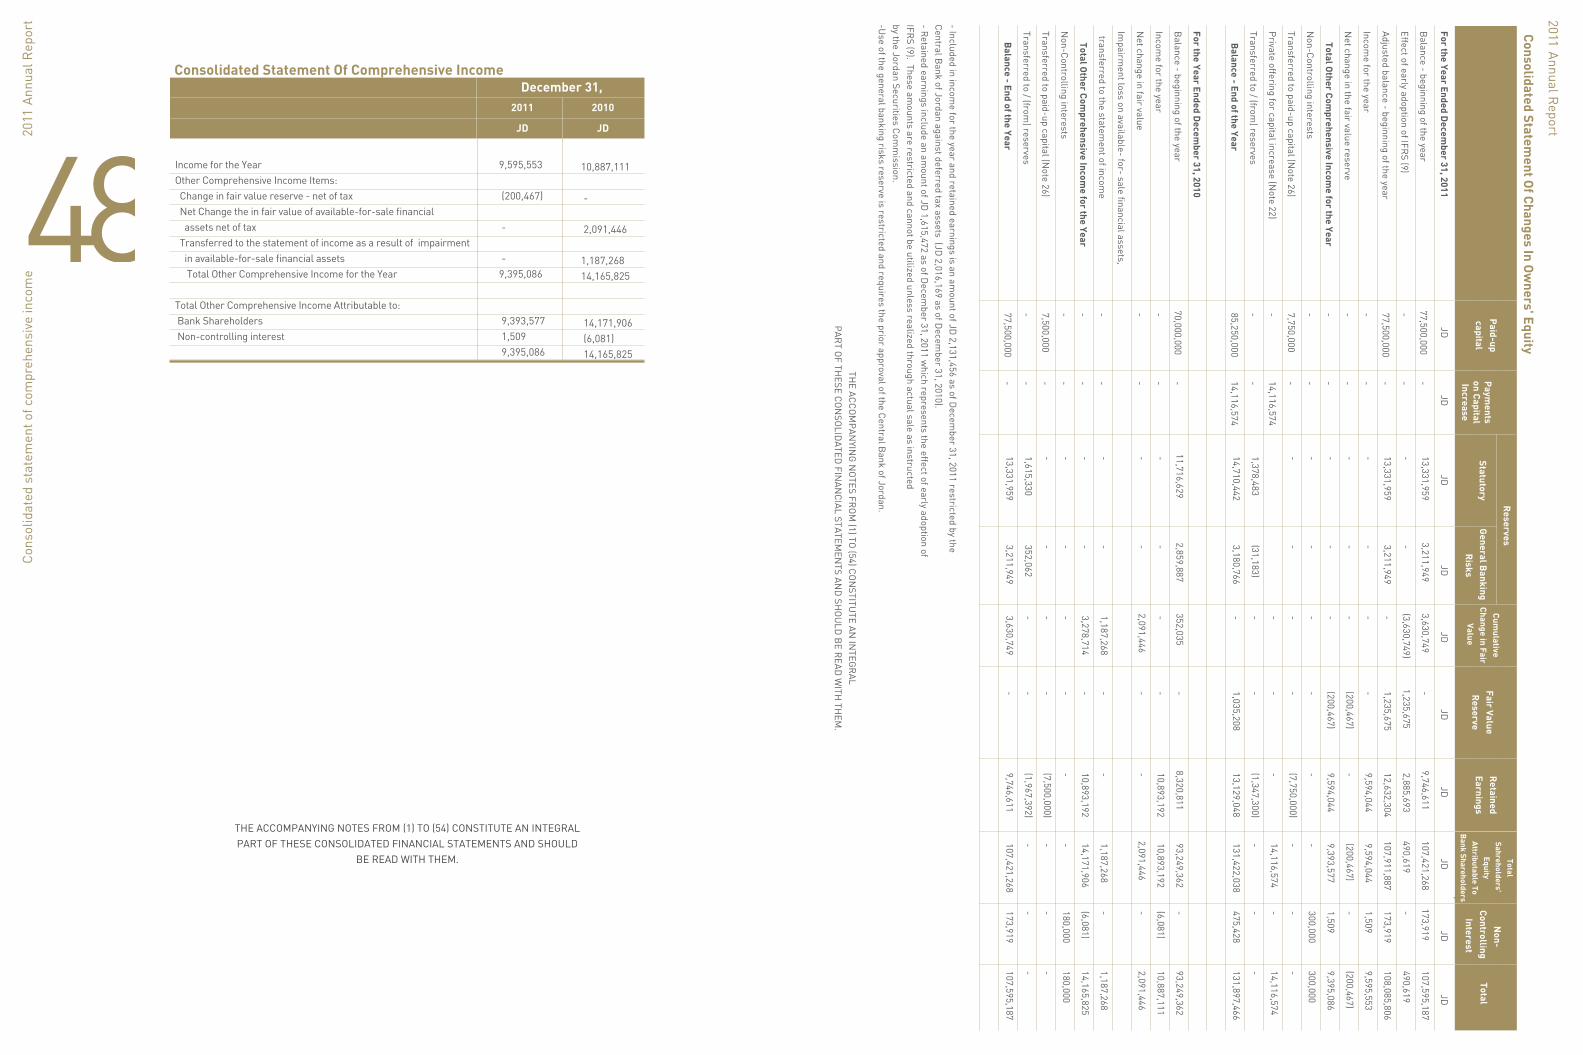
48 Consolidated Statement Of Comprehensive Income
2011 2010
JD JD
December 31,
Income for the YearOther Comprehensive Income Items: Change in fair value reserve - net of tax Net Change the in fair value of available-for-sale financial assets net of tax Transferred to the statement of income as a result of impairment in available-for-sale financial assets Total Other Comprehensive Income for the Year
Total Other Comprehensive Income Attributable to: Bank Shareholders Non-controlling interest
9,595,553
(200,467)
-
- 9,395,086
9,393,577 1,509 9,395,086
10,887,111
-
2,091,446
1,187,268 14,165,825
14,171,906 (6,081) 14,165,825
THE ACCOMPANYING NOTES FROM (1) TO (54) CONSTITUTE AN INTEGRAL PART OF THESE CONSOLIDATED FINANCIAL STATEMENTS AND SHOULD
BE READ WITH THEM.
Consolidated Statem
ent Of C
hanges In Ow
ners' Equity
Fair Value R
eserve Statutory
Paid-up
capitalR
etainedEarnings
Non-
Controlling Interest
Total P
ayments
on Capital
Increase
Total Sahreholders'
Equity A
ttributable To B
ank Shareholders
Reserves
General B
anking R
isks
Cum
ulative C
hange in Fair Value
Balance - beginning of the year
Effect of early adoption of IFRS (9)
Adjusted balance - beginning of the year
Income for the year
Net change in the fair value reserve
Total Other C
omprehensive Incom
e for the Year
Non-Controlling interests
Transferred to paid-up capital (Note 26)
Private offering for capital increase (Note 22)
Transferred to / (from) reserves
Balance - End of the Year
For the Year Ended Decem
ber 31, 2010
Balance - beginning of the year
Income for the year
Net change in fair value
Impairm
ent loss on available- for- sale financial assets,
transferred to the statement of incom
e
Total Other C
omprehensive Incom
e for the Year
Non-Controlling interests
Transferred to paid-up capital (Note 26)
Transferred to / (from) reserves
Balance - End of the Year
For the Year Ended Decem
ber 31, 2011
77,500,000
-
77,500,000
-
-
-
-
7,750,000
-
-
85,250,000
70,000,000
-
-
-
-
-
7,500,000
-
77,500,000
JDJD
JDJD
JDJD
JDJD
JDJD
-
-
-
-
-
-
-
-
14,116,574
-
14,116,574
-
-
-
-
-
-
-
-
-
13,331,959
-
13,331,959
-
-
-
-
-
1,378,483
14,710,442
11,716,629
-
-
-
-
-
-
1,615,330
13,331,959
3,211,949
-
3,211,949
-
-
-
-
-
(31,183)
3,180,766
2,859,887
-
-
-
-
-
-
352,062
3,211,949
3,630,749
(3,630,749)
-
-
-
-
-
-
-
-
-
352,035
-
2,091,446
1,187,268
3,278,714
-
-
-
3,630,749
-
1,235,675
1,235,675
-
(200,467)
(200,467)
-
-
-
-
1,035,208
-
-
-
-
-
-
-
-
-
9,746,611
2,885,693
12,632,304
9,594,044
-
9,594,044
-
(7,750,000)
-
(1,347,300)
13,129,048
8,320,811
10,893,192
-
-
10,893,192
-
(7,500,000)
(1,967,392)
9,746,611
173,919
-
173,919
1,509
-
1,509
300,000
-
-
-
475,428
-
(6,081)
-
-
(6,081)
180,000
-
-
173,919
107,421,268
490,619
107,911,887
9,594,044
(200,467)
9,393,577
-
-
14,116,574
-
131,422,038
93,249,362
10,893,192
2,091,446
1,187,268
14,171,906
-
-
-
107,421,268
107,595,187
490,619
108,085,806
9,595,553
(200,467)
9,395,086
300,000
-
14,116,574
-
131,897,466
93,249,362
10,887,111
2,091,446
1,187,268
14,165,825
180,000
-
-
107,595,187
- Included in income for the year and retained earnings is an am
ount of JD 2,131,456 as of D
ecember 31, 2011 restricted by the
Central Bank of Jordan against deferred tax assets (JD
2,016,169 as of Decem
ber 31, 2010).- R
etained earnings include an amount of JD
1,615,472 as of Decem
ber 31, 2011 which represents the effect of early adoption of
IFRS (9). These am
ounts are restricted and cannot be utilized unless realized through actual sale as instructed by the Jordan Securities Com
mission.
-Use of the general banking risks reserve is restricted and requires the prior approval of the Central B
ank of Jordan.
THE ACCO
MPAN
YING
NO
TES FRO
M (1) TO
(54) CON
STITUTE AN
INTEG
RAL
PART O
F THESE CO
NSO
LIDATED
FINAN
CIAL STATEMEN
TS AND
SHO
ULD
BE R
EAD W
ITH TH
EM.

51CASH FLOWS FROM OPERATING ACTIVITIES: Net income before income tax Adjustments: Depreciation and amortization Impairment loss on available-for-sale financial assets Provision for impairment in credit facilities Provision for employees end-of-service indemnity Surplus / provision for lawsuits against the bank Provision for contingent liabilities (Gains) losses on sale of property and equipment Provision for impairment in assets seized by the bank (Gains) from sale of assets seized by the bank (Revenue) from assets seized by the bank for bad debts Unrealized losses from valuation of financial assets at fair value through profit or loss Interest expense (income) - net Effect of exchange rate fluctuations on cash and cash equivalents Income before Changes in Assets and LiabilitiesNet Changes in Assets and Liabilities: Decrease (increase) in deposits at banks and financial institutions due after 3 months Decrease in trading financial assets Decrease in financial asset at fair value through profit or loss Decrease in financial derivatives (Increase) in direct credit facilities (Increase) decrease in other assets (Decrease) in banks and financial institutions deposits due after 3 months Increase (decrease) in clients deposits Increase in cash margins (Decrease) increase in other liabilities Net Cash Flows from (used in) Operating Activities before Tax, lawsuits and Employees Indemnities Paid Employees indemnities paid Paid from the provision for lawsuits Income tax paid Net Cash Flows from (used in) Operating Activities
CASH FLOWS FROM INVESTING ACTIVITIES: Decrease in available-for-sale financial assets Decrease in financial assets at amortized cost (Purchases) of property and equipment and payment on purchases of property and equipment and projects under construction Proceeds from sale of property and equipment (Purchases) of intangible assets Net Cash Flows from Investing Activities
CASH FLOWS FROM FINANCING ACTIVITIES: Proceeds from capital increase (Decrease) increase in borrowed funds Non- controlling interest Net Cash Flows from Financing Activities Effect of exchange rate fluctuations on cash and cash equivalents Net Increase (Decrease) in Cash and Cash Equivalents Cash and cash equivalents - beginning of the year Cash and Cash Equivalents - End of the Year
12&13 11 19 19 19 33 32 19 19 20 12 13 22 32 41 41
JD 13,649,967
1,570,810 - 11,168,207 - (1,465,000) 77,000 (3,273) - (13,524) - 965,945 95,561 (152,524) 25,893,169
1,500,169 - 935,804 3,511 (10,902,415)(3,239,961) - 20,330,693 15,191,617 (3,241,174)
46,471,413 - - (6,264,040) 40,207,373
- 13,780,803
(2,445,079)27,880 (978,766)10,384,838
14,116,574 (3,933,782)300,000 10,482,792 152,524 61,227,527 38,977,334 100,204,861
JD 15,869,235
1,138,335 1,187,268 6,708,420 379 152,175 - 6,374 914,611 (185,211)(1,586,067) - (630,505)(232,605) 23,342,409
(1,543,392) 898,016 - 11,527 (57,384,323) 1,500,754 (30,267)(28,310,397) 3,505,722 1,673,207
(56,336,744)(950)(35,450)(4,283,777) (60,656,921)
14,147,673 -
(8,772,223) 5,634 (791,427) 4,589,657
- 1,760,608 180,000 1,940,608 232,605 (53,894,051) 92,871,385 38,977,334
2011NOTE 2010
THE ACCOMPANYING NOTES FROM (1) TO (54) CONSTITUTE AN INTEGRAL PART OF THESE CONSOLIDATED FINANCIAL STATEMENTS AND SHOULD BE READ WITH THEM
CONSOLIDATED STATEMENT OF CASH FLOWS
INVESTBANK(a public shareholding company)Amman – jordanNotes to the consolidtaed financial statements
1.General Invest Bank was established as a Jordanian public shareholding company under number (173) on August 12, 1982 in accordance with the Companies Law No. 12 for the year 1964 with a paid-up capital of JD 6 million distributed over 6 million shares with a par value of JD 1 per share. The Bank’s capital was increased several times, the last of which was during the year 2011. According to the resolution of the Bank’s general assembly in its extraordinary meeting held on June 15, 2011 the Bank’s authorized and subscribed capital has been increased to become JD 100 million through the capitalization of JD 7,750,000 from retained earnings and the remaining through a private offering provided to the investors registered at the bank of JD 14,750,000. On August 29, 2011, the bank capitalized JD 7,750,000 from retained earnings increasing the banks subscribed and paid up capital to JD 85,250,000 which was approved by the Jordan Securities Commission on September 4, 2011, noting the private offering has not been completed at the date of the consolidated financial statements.
The Bank’s headquarter is in Amman, Abdel Hameed Sharaf Street, Shmesani, Tel: 5001500, P.O. Box 950601, Amman 11195 – Jordan.
The Bank is engaged in banking and related financial operations through its headquarter, branches in the Hashemite Kingdom of Jordan totaling 9 branches, and the subsidiary companies.
The Bank’s is a public shareholding company listed in Amman Stock Exchange.
The consolidated financial statements have been approved by the Bank’s Board of Directors, in its meeting held on February 22, 2012, and are subject to the approval of the General Assembly of Shareholders
2. Significant Accounting PoliciesBasis of Presentation- The accompanying consolidated financial statements of the Bank and its subsidiary companies are prepared in accordance with the standards issued by the International Accounting Standards Board (IASB), interpretations issued by the Committee of the IASB, prevailing local laws, and regulations of the Central Bank of Jordan.
- The consolidated financial statements are prepared under the historical cost convention except for financial assets at fair value through profit or loss, financial assets at fair value through other comprehensive income and financial derivatives which have been measured at fair value at the date of preparation of the consolidated financial statements. Moreover, hedged assets and liabilities are stated at fair value.
Notes to the consolidtaed financial statem
ents
5352-The reporting currency of the consolidated financial statements is the Jordanian Dinar, which is also the functional currency of the Bank.
- The accounting policies for the current year are consistent with those used in the year ended December 31, 2010, expect for the effect of adoption of the new and modified standard as in note (53 – a) and the effect of the adoption of the following:
IFRS 9 Financial Instruments Issued in November 2009 and Amended in October 2010
The Bank and its subsidiaries have early adopted the first stage for (IFRS 9) in the preparation of the consolidated financial statements as of January 1, 2011 in accordance with the requirements of the Securities Exchange Commission, the Central Bank of Jordan and the transitional provisions of the standard. Therefore the comparative figures for the previous year have not been adjusted, which is permitted by the standard. Therefore, the beginning balance, for retained earnings, cumulative change in fair value and deferred tax liabilities have been reclassified as of January 1, 2011.
The effects of applying the IFRS (9) on the consolidated financial statements are detailed in note (52).
The followings are the significant new and revised IFRSs adopted during the year ended December 31, 2011:
a. Financial Assets at Amortized Cost
- Financial assets at amortized cost are the financial assets which the Bank’s management intends according to its business model to hold for the purpose of collecting the contractual cash flows which comprise the contractual cash flows that are solely payments of principal and interest on the principal outstanding.
- Financial assets are recorded at cost upon purchase plus acquisition expenses. Moreover, the issue premium \ discount is amortized using the effective interest rate method, and recorded to interest account. Provisions associated with the decline in value of these investments leading to the inability to recover the investment or parts thereof are deducted. Any impairment is registered in the consolidated statement of income and should be presented subsequently at amortized cost less any impairment losses. - The amount of the impairment loss recognised is the difference between the asset’s carrying amount and the present value of estimated future cash flows discounted at the original effective interest rate.
- It is not allowed to reclassify any financial assets from / to this category except for certain cases specified at the International Financial Reporting Standards (and in the case of selling those assets before its maturity date, the results should be recorded in a separate account in the consolidated statement of income, disclosures should be made in accordance to the requirements of
Not
es to
the
cons
olid
taed
fina
ncia
l sta
tem
ents
International Financial Reporting Standards).
b. Financial Assets at Fair Value through Profit or Loss
- It is the financial assets held by the Bank for the purpose of trading in the near future and achieving gains from the fluctuations in market prices in the short term or trading margins.
- Financial assets at fair value through profit or loss are initially stated at fair value at acquisition date (purchase costs are recorded at the consolidated statement of income upon acquisition) and subsequently measured at fair value. Moreover, changes in fair value are recorded in the consolidated statement of income including the change in fair value resulting from translation of non monetary assets stated at foreign currency. Gains or losses resulting from the sale of these financial assets are taken to the consolidated statement of income.- Dividends and interests from these financial assets are recorded in the consolidated statement of income.- It is not allowed to reclassify any financial assets to / from this category except for the cases specified in International Financial Reporting Standards.
- It is not allowed to classify any financial assets that do not have prices in active markets and active dealings in this items.
c. Financial Assets at Fair Value through Other Comprehensive Income
- Those financial assets represent the investments in equity instruments held for long term.
- Financial assets at fair value through other comprehensive income are initially stated at fair value plus transaction costs. Subsequently, they are measured at fair value with gains and losses arising from changes in fair value recognized in the consolidated statement of other comprehensive income and within owner’s equity, including the changes in fair value resulting from translation of non monetary assets stated at foreign currency. Gain or loss from the sale of these investments should be recognized in the consolidated statement of comprehensive income and within owner’s equity, and the balance of the evaluation reserve for these assets should be transferred directly to the retained earnings not to the consolidated statement of income.
- No impairment testing is required for those assets.
- Dividends are recorded in the consolidated statement of income.
IAS 24 Related party disclosures - Amended
- IAS 24: Related Party Disclosures simplifies disclosures for related entities to simplify the determination of a related party and reduce the discrepancies upon implementation.
- There was no impact on the consolidated financial position or financial performance upon the implementation of the amended standard.
IAS 32 financial instruments – Classification of Rights Issues - Amended
- IAS 32 financial instruments – Classification and presentation of Rights Issues: The amendment on IAS 32 for the classification of rights issues. For
Notes to the consolidtaed financial statem
ents
5554rights issues offered for a fixed amount of foreign currency current practice appears to require such issues to be accounted for as derivative liabilities. The amendment states that if such rights are issued pro rata to an entity’s all existing shareholders in the same class for a fixed amount of currency, they should be classified as equity regardless of the currency in which the exercise price is denominated.
- There was no effect on the consolidated financial position or financial performance upon the implementation of the amended standard.
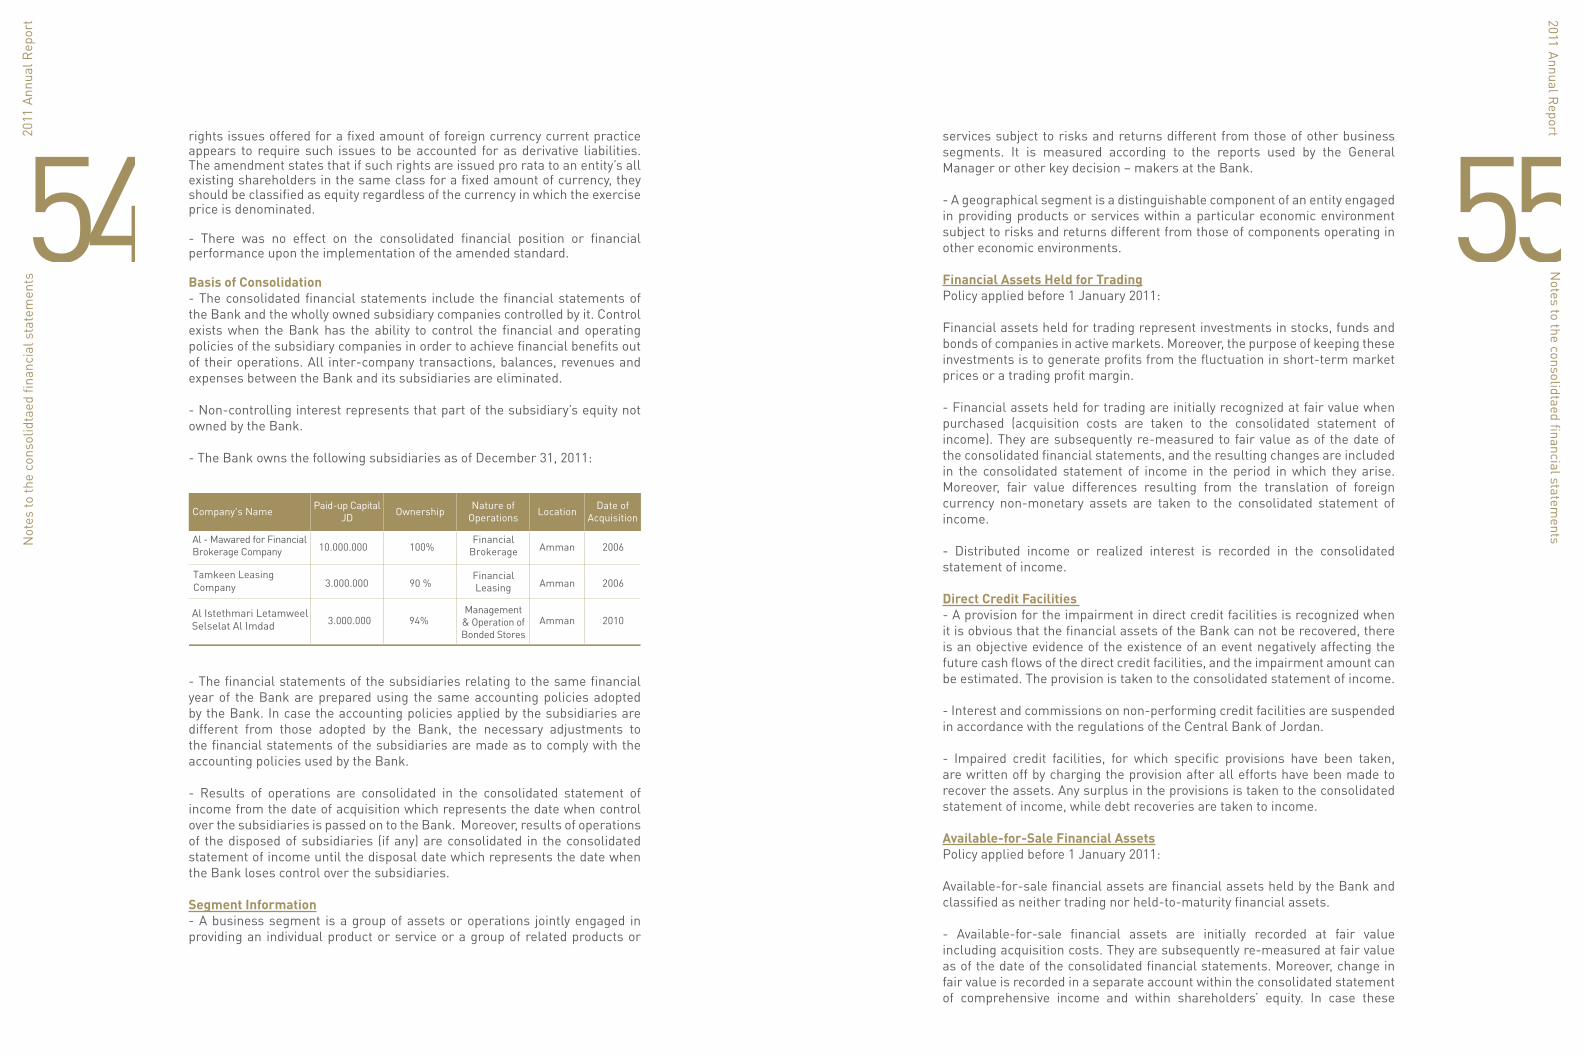
Basis of Consolidation- The consolidated financial statements include the financial statements of the Bank and the wholly owned subsidiary companies controlled by it. Control exists when the Bank has the ability to control the financial and operating policies of the subsidiary companies in order to achieve financial benefits out of their operations. All inter-company transactions, balances, revenues and expenses between the Bank and its subsidiaries are eliminated.
- Non-controlling interest represents that part of the subsidiary’s equity not owned by the Bank.
- The Bank owns the following subsidiaries as of December 31, 2011:
- The financial statements of the subsidiaries relating to the same financial year of the Bank are prepared using the same accounting policies adopted by the Bank. In case the accounting policies applied by the subsidiaries are different from those adopted by the Bank, the necessary adjustments to the financial statements of the subsidiaries are made as to comply with the accounting policies used by the Bank. - Results of operations are consolidated in the consolidated statement of income from the date of acquisition which represents the date when control over the subsidiaries is passed on to the Bank. Moreover, results of operations of the disposed of subsidiaries (if any) are consolidated in the consolidated statement of income until the disposal date which represents the date when the Bank loses control over the subsidiaries.
Segment Information- A business segment is a group of assets or operations jointly engaged in providing an individual product or service or a group of related products or
Not
es to
the
cons
olid
taed
fina
ncia
l sta
tem
ents
services subject to risks and returns different from those of other business segments. It is measured according to the reports used by the General Manager or other key decision – makers at the Bank.
- A geographical segment is a distinguishable component of an entity engaged in providing products or services within a particular economic environment subject to risks and returns different from those of components operating in other economic environments.
Financial Assets Held for TradingPolicy applied before 1 January 2011:
Financial assets held for trading represent investments in stocks, funds and bonds of companies in active markets. Moreover, the purpose of keeping these investments is to generate profits from the fluctuation in short-term market prices or a trading profit margin.
- Financial assets held for trading are initially recognized at fair value when purchased (acquisition costs are taken to the consolidated statement of income). They are subsequently re-measured to fair value as of the date of the consolidated financial statements, and the resulting changes are included in the consolidated statement of income in the period in which they arise. Moreover, fair value differences resulting from the translation of foreign currency non-monetary assets are taken to the consolidated statement of income.
- Distributed income or realized interest is recorded in the consolidated statement of income.
Direct Credit Facilities - A provision for the impairment in direct credit facilities is recognized when it is obvious that the financial assets of the Bank can not be recovered, there is an objective evidence of the existence of an event negatively affecting the future cash flows of the direct credit facilities, and the impairment amount can be estimated. The provision is taken to the consolidated statement of income.
- Interest and commissions on non-performing credit facilities are suspended in accordance with the regulations of the Central Bank of Jordan.
- Impaired credit facilities, for which specific provisions have been taken, are written off by charging the provision after all efforts have been made to recover the assets. Any surplus in the provisions is taken to the consolidated statement of income, while debt recoveries are taken to income.
Available-for-Sale Financial AssetsPolicy applied before 1 January 2011:
Available-for-sale financial assets are financial assets held by the Bank and classified as neither trading nor held-to-maturity financial assets.
- Available-for-sale financial assets are initially recorded at fair value including acquisition costs. They are subsequently re-measured at fair value as of the date of the consolidated financial statements. Moreover, change in fair value is recorded in a separate account within the consolidated statement of comprehensive income and within shareholders’ equity. In case these
Notes to the consolidtaed financial statem
ents
5756assets are fully or partially sold, disposed of, or determined to be impaired, the income or losses are recorded in the consolidated statement of income, including the related amounts previously recorded within owners’ equity. The loss resulting from the impaired value of the debt instruments is reversed when it is objectively evident that the increase in their fair value occurred after the losses had been recognized and recorded in the consolidated statement of income. Impairment losses resulting from the decline in the value of equity securities are reversed through the cumulative change in fair value and through the statement of comprehensive income.
- Income and losses from foreign exchange of interest-bearing debt instruments within available - for - sale financial assets are included in the consolidated statement of income. Differences in the foreign currency of equity instruments are included in the cumulative change in fair value within the consolidated statement of comprehensive income.
- Interest from available-for-sale financial instruments is recorded in the consolidated statement of income using the effective interest rate method. Impairment in such assets is recorded in the consolidated statement of income when incurred.
- Financial assets for which fair value cannot be reliably determined are shown at cost. Any impairment is recorded in the consolidated statement of income.
Held-to-Maturity Financial AssetsPolicy applied before 1 January 2011:
Held-to-maturity investments are financial assets with fixed or determinable payments and the Bank has the positive intent and ability to hold to maturity.
- Held-to-maturity investments are recorded at cost (fair value) plus acquisition costs. Premiums and discounts are amortized in the consolidated statement of income according to the effective interest rate method. Provisions associated with irrecoverable impairment in their value, partially or totally, are deducted. Any impairment in assets is recorded in the consolidated statement of income.
Fair ValueFair value represents the closing market price (Acquisition of assets/ Sale of liabilities) of financial assets and derivatives on the date of the consolidated financial statements. In case the declared market prices do not exist, active trading of some financial assets and derivatives is not available, or the market is inactive, fair value is estimated by one of several methods including the following:
- Comparison with the fair value of another financial asset with similar terms and conditions.- Analysis of the estimated future cash flows and discounted cash flows at current rates applicable for items with similar terms and risk characteristics. - Adoption of the option pricing models.- Evaluation of long term assets and liabilities that bears no interest in accordance to discounted cash flows using effective interest rate, premiums
and discounted are amortized within interest revenue or expense in the consolidated statement of income.
The evaluation methods aim to provide a fair value reflecting the expectations of the market, and take into consideration market factors, risks and expected benefits, at the time of evaluation of the financial instruments. In case the fair value of an investment can not be measured reliably, it is stated at cost less any impairment.
Financial assets, the fair value of which can not be reliably measured, are stated at cost less any impairment.
Impairment in the Value of Financial AssetsThe Bank reviews the values of financial assets on the date of the consolidated statement of financial position in order to determine if there are any indications of impairment in their value individually or in the form of a portfolio. In case such indications exist, the recoverable value is estimated in order to determine the impairment loss.
Impairment is determined as follows:
- Impairment in financial assets recorded at amortized cost represents the difference between the book value and the present value of the expected cash flows discounted at the original interest rate.
- Impairment in financial assets available for sale recorded at fair value (policy applied before 1 January 2011) represents the difference between book value and fair value.
The impairment in value is recorded in the consolidated statement of income. Any surplus in the following period resulting from previous impairment in the value of debt instruments is taken to the consolidated statement of income and any impairment in the value of equity instruments is taken to the consolidated statement of other comprehensive income.
Property and Equipment - Property and equipment are stated at cost net of accumulated depreciation and any impairment in value. Moreover, property and equipment (except for land) are depreciated according to the straight-line method over their estimated useful lives using the following rates:

5958- When the carrying values of property and equipment exceed their recoverable values, assets are written down to the recoverable value, and impairment losses are recorded in the consolidated statement of income.
- The useful lives of property and equipment are reviewed at the end of each year. In case the expected useful life is different from what was determined before, the change in estimate is recorded in the following years, being a change in estimate.
- Property and equipment are derecognized when disposed of or when there is no expected future benefit from their use or disposal.
Provisions- Provisions are recognized when the Bank has an obligation on the date of the consolidated statement of financial position as a result of past events, it is probable to settle the obligation, and a reliable estimate of the amount of the obligation can be made.
Provision for Employees End-of-Service Indemnities- The employees’ end-of-service indemnities provision is calculated at a rate of one month per service year for contracted employees more than 60 years old.
- The required provision for end-of-service indemnities for the year is recorded in the consolidated statement of income while payments to departing employees are deducted from the provision amount.
Cost of Issuing or Purchasing Bank SharesAny costs that result from purchasing or issuing bank shares are charged to retained earnings (net of the tax effect relating to those costs, if any). If the underwriting process or purchase process was incomplete, these costs are charged to the consolidated statement of income.
Income Tax- Income tax expenses represent accrued taxes and deferred taxes.
- Income tax expenses are accounted for on the basis of taxable income. Moreover, taxable income differs from income declared in the consolidated financial statements because the latter includes non-taxable revenue or tax expenses not deductible in the current year but deductible in subsequent years, accumulated losses acceptable by the tax authorities, and items not accepted for tax purposes or subject to tax.
- Taxes are calculated on the basis of the tax rates prescribed according to the prevailing laws, regulations, and instructions in Jordan.
- Deferred taxes are taxes expected to be paid or recovered as a result of temporary timing differences between the value of the assets and liabilities in the consolidated financial statements and the value of the taxable amount. Deferred tax is calculated on the basis of the liability method in the consolidated statement of financial position according to the rates expected to be applied when the tax liability is settled or tax assets are recognized.
- Deferred tax assets are reviewed as of the date of the consolidated financial statements, and reduced in case it is expected that no benefit will arise therefrom, partially or totally.
Accounts Managed on Behalf of ClientsThis item represents the accounts managed by the Bank on behalf of its clients and is not part of the Bank’s assets. The fees and commissions for managing these accounts are shown in the consolidated statement of income. Furthermore, a provision is taken against the decline in the value of capital-guaranteed portfolios managed on behalf of clients.
OffsettingFinancial assets and financial liabilities are offset, and the net amount is reflected in the consolidated statement of financial position only when there are legal rights to offset the recognized amounts, the Bank intends to settle them on a net basis, or assets are realized and liabilities settled simultaneously.
Realization of Income and Recognition of Expenses- Interest income is realized and expenses are recognized using the effective interest rate method, except for interest and commission on non-performing loans which are not recognized as revenue but recorded in the interest and commission in suspense account until they are received in cash.
- Expenses are recognized on the accrual basis.
- Commission is recorded as revenue when the related services are provided. - Dividends are recorded when realized (decided upon by the General Assembly of Shareholders).
Recognition of Financial Assets Financial assets are recognized on the trading date which is the date the Bank commits itself to purchase or sell the financial assets.
Financial Derivatives and Hedge AccountingFor hedge accounting purposes, financial derivatives are stated at fair value. Hedges are classified as follows:
- Fair value hedge: Hedge for the change in the fair value exposures of the Bank’s assets and liabilities.
When the conditions of effective fair value hedge are met, the resulting gain or loss from re-measuring the fair value hedge is recognized in the consolidated statement of income.
When the conditions of effective portfolio hedge are met, the gain or loss resulting from the revaluation of the hedging instrument at fair value as well as the change in the fair value of the assets or liabilities portfolio are recorded in the consolidated statement of income for the same period.
Notes to the consolidtaed financial statem
ents
6160- Cash flow hedge: Hedge for the change in the current and expected cash flows exposures of the Bank’s assets and liabilities.
When the conditions of effective cash flow hedge are met, the gain or loss of the hedging instruments is recognized in the consolidated statement of other comprehensive income in owners’ equity. Such gain or loss is transferred to the consolidated statement of income in the period in which the hedge transaction impacts the consolidated statement of income.
- Hedge for net investment in foreign entities: When the conditions of the hedge for net investment in foreign entities are met, fair value is measured for the hedging instrument of the hedged net assets. In case of an effective relationship, the effective portion of the loss or profit related to the hedging instrument is recognized in the consolidated statement of other comprehensive income and in owner’s equity. The ineffective portion is recognized in the consolidated statement of income. The effective portion is recorded in the consolidated statement of income when the investment in foreign entities is sold.
When the conditions of the effective hedge do not apply, gain or loss resulting from the change in the fair value of the hedging instrument is recorded in the consolidated statement of income in the same period.
Financial Derivatives for TradingThe fair value of financial derivatives for trading such as forward foreign currency contracts, future interest rate contracts, swap agreements, and foreign currency options is recorded in the consolidated statement of financial position under other assets or other liabilities as the case may be. Fair value is measured according to the prevailing market prices, and if they are not available, the measurement method should be disclosed. The change in their fair value is recognized in the consolidated statement of income.
Repurchase and Resale Agreements- Assets sold with a simultaneous commitment to repurchase them at a future date continue to be recognized in the consolidated financial statements as a result of the Bank’s continuous control over these assets and as the related risks and benefits are transferred to the Bank upon occurrence. They also continue to be measured in accordance with the adopted accounting policies. Amounts received against these contracts are recorded within liabilities under borrowed funds. The difference between the sale price and the repurchase price is recognized as an interest expense amortized over the contract period using the effective interest rate method.
- Purchased assets with corresponding commitment to sell at a specific future date are not recognized in the consolidated financial statements because the Bank has no control over such assets and the related risks and benefits are not transferred to the Bank upon occurrence. Payments related to these contracts are recorded under deposits with banks and other financial institutions or loans and advances in accordance with the nature of each case. The difference between the purchase price and resale price is recorded as interest revenue
Not
es to
the
cons
olid
taed
fina
ncia
l sta
tem
ents
amortized over the life of the contract using the effective interest rate method. Assets Seized by the BankAssets seized by the Bank are shown under “other assets” at the acquisition value or fair value, whichever is lower. As of the consolidated financial statements date, these assets are revalued individually at fair value. Any decline in their market value is taken to the consolidated statement of income whereas any such increase is not recognized. A subsequent increase is taken to the consolidated statement of income to the extent it does not exceed the previously recorded impairment.
Intangible Assets- Intangible assets purchased in an acquisition are stated at fair value at the date of acquisition. Intangible assets purchased other than through acquisition are recorded at cost.
-Intangible assets are to be classified on the basis of either definite or indefinite useful life. Intangible assets with definite useful economic lives are amortized over their useful lives and recorded as an expense in the consolidated statement of income. Intangible assets with indefinite lives are reviewed for impairment as of the consolidated financial statements date, and impairment loss is treated in the consolidated statement of income as an expense for the period.
- No capitalization of internally generated intangible assets resulting from the Bank’s operations is made. They are rather recorded as an expense in the consolidated statement of income for the period.
-Any indications of impairment in the value of intangible assets as of the consolidated financial statements date are reviewed. Furthermore, the estimated useful lives of the impaired intangible assets are reassessed, and any adjustment is made in the subsequent period.
-The following is the accounting policy for each item of the intangible assets owned by the Bank and its subsidiaries:
Softwares and computer programs are amortized over their estimated useful economic lives at a rate of 20% annually.
Foreign Currency-Transactions in foreign currencies during the year are recorded at the exchange rates prevailing at the date of the transaction.
-Financial assets and financial liabilities denominated in foreign currencies are translated at the average rates prevailing on the consolidated statement of financial position date and declared by the Central Bank of Jordan.
-Non-monetary assets and liabilities denominated in foreign currencies and recorded at fair value are translated on the date when their fair value is determined.
Notes to the consolidtaed financial statem
ents
6362-Gains or losses resulting from foreign currency translation are recorded in the consolidated statement of income.
-Translation differences on non-monetary assets and liabilities denominated in foreign currencies are recorded as part of the change in fair value.
Cash and Cash EquivalentsCash and cash equivalents comprise cash balances with the Central Bank of Jordan and balances with banks and financial institutions maturing within three months, less balances due to banks and financial institutions maturing within three months and restricted funds.
Accounting Estimates Preparation of the consolidated financial statements and the application of the accounting policies require the Bank’s management to perform assessments and assumptions that affect the amounts of financial assets and liabilities, fair value reserve and the disclosure of contingent liabilities. Moreover, these assessments and assumptions affect revenues, expenses, provisions, and changes in the fair value shown within the consolidated statement of other comprehensive income. In particular, this requires the Bank’s management to issue significant judgments and assumptions to assess future cash flow amounts and their timing. Moreover, the said assessments are necessarily based on assumptions and factors with varying degrees of consideration and uncertainty. In addition, actual results may differ from assessments due to the changes resulting from the conditions and circumstances of those assessments in the future.
-A provision is set against the lawsuits raised against the Bank. This provision is subject to an adequate legal study prepared by the Bank’s legal advisors. Moreover, the study highlights potential risks that the Bank may encounter in the future. Such legal assessments are reviewed periodically.
- A provision for performing and non-performing loans is taken on the bases and estimates approved by the Bank’s management in conformity with International Financial Reporting Standards (IFRS). The outcome of these bases and estimates is compared against the adequacy of the provisions as per the Central Bank of Jordan’s instructions. The strictest outcome that conforms to International Financial Reporting Standards is used for determining the provision.
-Impairment loss (if any) is booked after a sufficient and recent evaluation of the assets seized by the Bank has been conducted by approved surveyors. The impairment loss is reviewed periodically.
-Management periodically reassesses the economic useful lives of tangible and intangible assets for the purpose of calculating annual depreciation and amortization based on the general condition of these assets and the assessment of their useful economic lives expected in the future. Impairment loss (if any) is taken to the consolidated statement of income.
Not
es to
the
cons
olid
taed
fina
ncia
l sta
tem
ents
-Management frequently reviews the financial assets stated at cost to estimate any decline in their value. Impairment loss (if any) is taken to the consolidated statement of income as an expense for the year.
-Management estimates the impairment in fair value when the market value reaches a certain limit indicative of the amount of impairment loss.
- Fair Value Hierarchy:The Bank determines and discloses the level in the fair value hierarchy into which the fair value measurements are categorised in their entirety, segregating fair value measurements in accordance with the levels defined in IFRS. Differentiating between Level 2 and Level 3 fair value measurements, i.e., assessing whether inputs are observable and whether the unobservable inputs are significant, may require judgement and a careful analysis of the inputs used to measure fair value, including consideration of factors specific to the asset or liability.
We believe that our estimates adopted in the preparation of the consolidated financial statements are reasonable.
Notes to the consolidtaed financial statem
ents
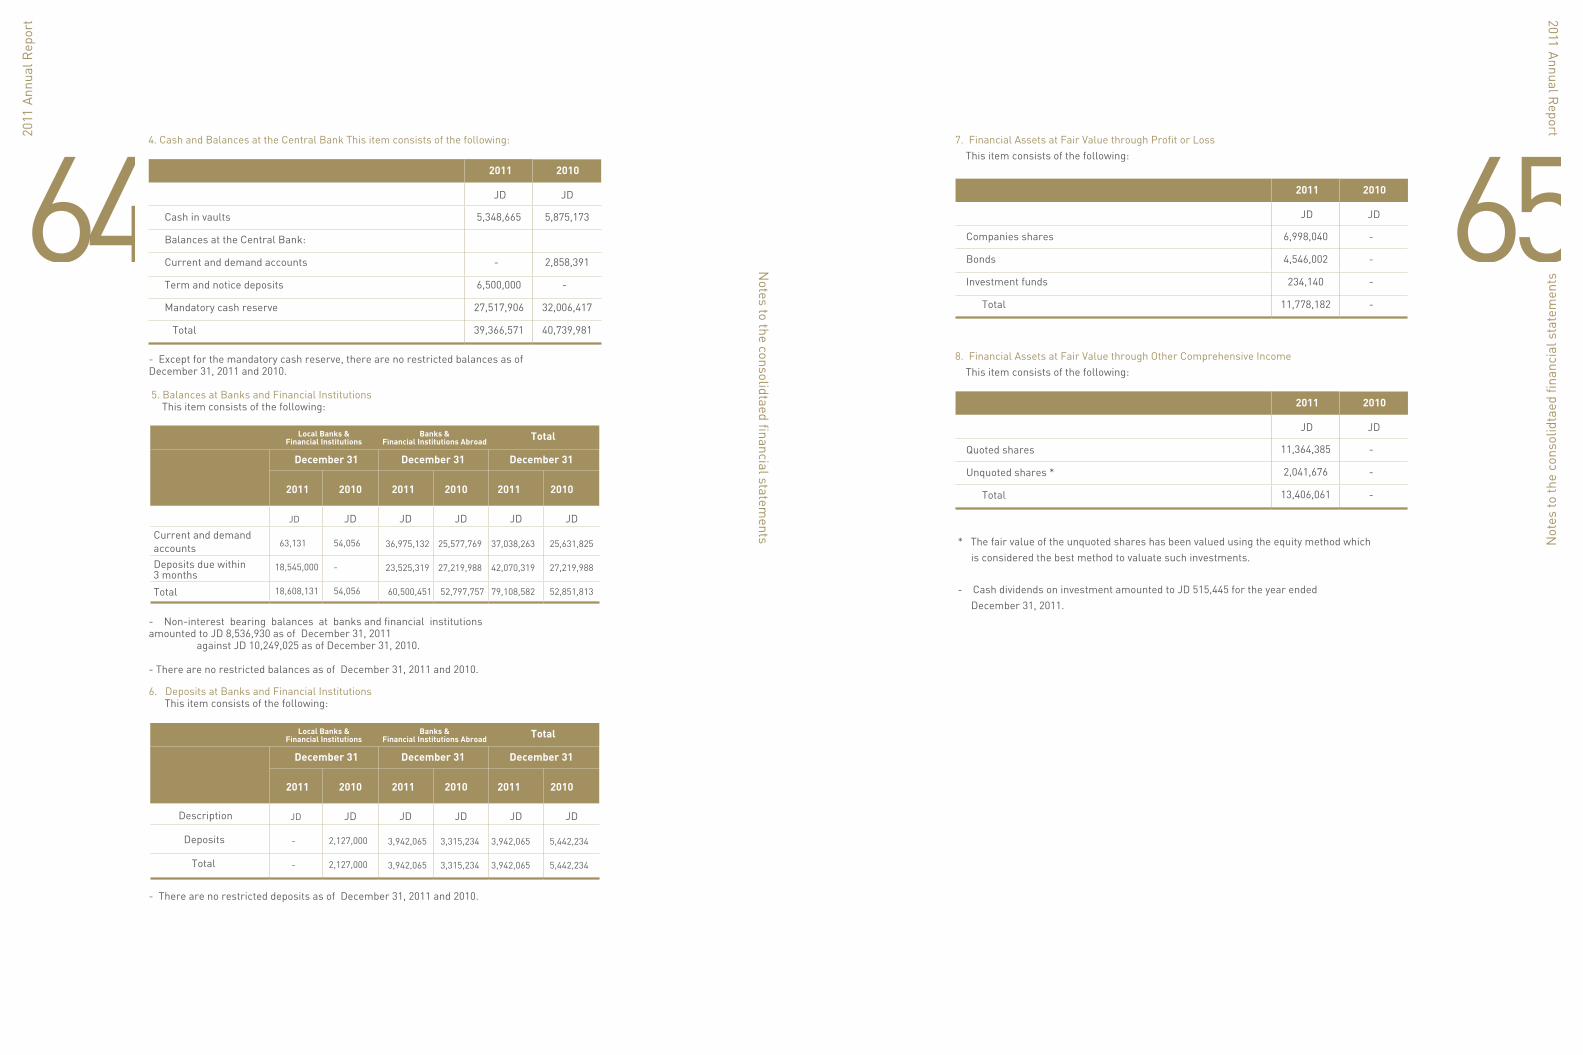
6564
Notes to the consolidtaed financial statem
ents
JD
2011
5,348,665
-
6,500,000
27,517,906
39,366,571
5,875,173
2,858,391
-
32,006,417
40,739,981
JD
2010
Cash in vaults
Balances at the Central Bank:
Current and demand accounts
Term and notice deposits
Mandatory cash reserve
Total
4. Cash and Balances at the Central Bank This item consists of the following:
- Except for the mandatory cash reserve, there are no restricted balances as of December 31, 2011 and 2010.
- Non-interest bearing balances at banks and financial institutions amounted to JD 8,536,930 as of December 31, 2011 against JD 10,249,025 as of December 31, 2010. - There are no restricted balances as of December 31, 2011 and 2010.
5. Balances at Banks and Financial Institutions This item consists of the following:
6. Deposits at Banks and Financial Institutions This item consists of the following:
- There are no restricted deposits as of December 31, 2011 and 2010.
JD
63,131
18,545,000
18,608,131
54,056
-
54,056
36,975,132
23,525,319
60,500,451
25,577,769
27,219,988
52,797,757
37,038,263
42,070,319
79,108,582
25,631,825
27,219,988
52,851,813
JD JD JD JD JD
December 31 December 31December 31
Local Banks &Financial Institutions
Banks &Financial Institutions Abroad Total
Current and demandaccountsDeposits due within 3 months
Total
2011 2010 2011 2010 2011 2010
JD
-
-
2,127,000
2,127,000
3,942,065
3,942,065
3,315,234
3,315,234
3,942,065
3,942,065
5,442,234
5,442,234
JD JD JD JD JD
December 31 December 31December 31
Local Banks &Financial Institutions
Banks &Financial Institutions Abroad Total
Description
Deposits
Total
2011 2010 2011 2010 2011 2010
Not
es to
the
cons
olid
taed
fina
ncia
l sta
tem
ents
JD
2011
6,998,040
4,546,002
234,140
11,778,182
-
-
-
-
JD
2010
Companies shares
Bonds
Investment funds
Total
JD
2011
11,364,385
2,041,676
13,406,061
-
-
-
JD
2010
Quoted shares
Unquoted shares *
Total
7. Financial Assets at Fair Value through Profit or Loss This item consists of the following:
8. Financial Assets at Fair Value through Other Comprehensive Income This item consists of the following:
* The fair value of the unquoted shares has been valued using the equity method which is considered the best method to valuate such investments. - Cash dividends on investment amounted to JD 515,445 for the year ended December 31, 2011.

6766
Notes to the consolidtaed financial statem
ents
20102011
JD JD
9. Available-for-Sale Financial Assets The details of this item are as follows:
- Unquoted available-for-sale financial assets are recorded at cost/amortized cost as their fair values cannot be reliably determined. These assets amounted to JD 3,069,980 as of December 31, 2010.
10. Financial Assets at Amortized Costs The details of this item are as follows:
-
-
-
-
-
-
-
-
-
-
141,422,388
20,281,983
19,096,950
180,801,321
-
3,069,980
3,069,980
183,871,301
161,704,371
161,704,371
Quoted Available-for-Sale Financial Assets:
Governmental bonds or bonds guaranteed by the Government
Companies bonds and debentures
Companies shares
Total Quoted Available-for-Sale Financial Assets
Unquoted Available-for-Sale Financial Assets:
Governmental bills
Companies shares
Total Unquoted Available-for-Sale Financial Assets
Total Available-for-Sale Financial Assets
Bonds and Bills Analysis:
Fixed return
Total
December 31,
20102011
JD JD
99,024,247
17,500,804
116,525,051
12,634,109
2,002,078
12,047,505
26,683,692
143,208,743
143,208,743
143,208,743
-
-
-
-
-
-
-
-
-
-
Quoted available-for-sale financial assets:
Governmental bills
Governmental bonds or bonds guaranteed by the government
Total Quoted Available-for-sale Financial Assets
Unquoted Available-for-Sale Financial Assets:
Governmental bills
Governmental bonds or bonds guaranteed by the government
Companies bonds and debentures
Total Unquoted Available-for-Sale Financial Assets
Total Available-for-Sale Financial Assets
Bonds and Bills analysis:
Fixed return
Total
December 31,
Not
es to
the
cons
olid
taed
fina
ncia
l sta
tem
ents
20102011
JD JD
11 . Direct Credit Facilities - NetThis item consists of the following:
11,698,281
29,423,289
1,682,340
60,882,502
55,834,119
195,075,296
10,366,955
20,723,575
891,122
386,577,479
31,315,775
5,253,182
350,008,522
18,796,480
26,661,223
1,761,025
63,141,293
56,413,540
181,351,730
9,715,414
12,347,380
3,627,843
373,815,928
20,590,439
2,951,175
350,274,314
Individuals (retail)
Overdraft
Loans and promissory notes*
Credit Cards
Real estate loans
Companies
Large Companies
Overdraft
Loans and promissory notes*
Medium and small companies
Overdraft
Loans and promissory notes*
Government and public sector
Total
Less: Provision for impairment in direct credit facilities
Suspended interest
Net Direct Credit Facilities
December 31,
* Net after deducting interest and commissions received in advance of JD 5,008,566 as of December 31, 2011 against JD 4,205,882 as of December
31, 2010. - Non-performing credit facilities amounted to JD 50,776,611 which is equivalent to (13.1%) of total direct credit facilities as
of December 31, 2011 against JD 41,434,644, which is equivalent to (11.1%) of total credit facilities as of December 31, 2010. - Non- performing credit facilities excluding interest and commissions in suspense amounted to JD 45,523,429 which is
equivalent to (11.9%) of total direct credit facilities after excluding interest in suspense as of December 31, 2011 against JD JD38,483,471 which is
equivalent to (10.4%) of total credit facilities after excluding interest in suspense as of December 31, 2010. - Direct credit facilities granted to / guaranteed by the Government of Jordan amounted to JD 891,122 which is equivalent to
(0.2%) of total direct facilities against JD 3,627,843, which is equivalent to (1%) as of December 31, 2011.

68
Notes to the consolidtaed financial statem
ents
Provision for Impairment in Direct Credit Facilities: The movement on the provision for impairment in direct credit facilities was as follows:
- The provisions no longer needed due to settlements or repayments of debts and transferred against other debts amounted to JD 4,172,680 against JD 1,883,116 for the previous year. The provision for impaired credit facilities representing underwatch and non-performing loans is calculated based on the individual customer and not the portfolio.
JD
4,759,241
2,786,058
437,847
7,107,452
3,402,899
1,385,221
28,879
4,759,241
1,823,147
3,718,027
-
5,541,174
599,320
1,223,827
-
1,823,147
8,316,717
4,037,774
5,024
12,349,467
5,326,064
2,997,057
6,404
8,316,717
5,691,334
626,348
-
6,317,682
4,589,019
1,102,315
-
5,691,334
20,590,439
11,168,207
442,871
31,315,775
13,917,302
6,708,420
35,283
20,590,439
JD JD JD JD
Real EstateLoans
LargeCompanies
Small andMedium Companies TotalIndividuals
Companies
Balance – beginning of the year
Provision for the year taken from revenue
Used during the year (written-off) *
Balance – End of the Year
2010
Balance – beginning of the year
Provision for the year taken from revenue
Used during the year (written-off) *
Balance – End of the Year
2011
Interest in Suspense- The movement on interest in suspense is as follows:
* As per in the decision of the board of directors and the board of directors of Al-Mawared (subsidiary company), non-performing credit facilities with their related interest in suspense have been written off for the amount of JD 470,900 during the year 2011 against JD 57,813 for the year 2010.
JD
786,762
487,216
78,741
28,029
1,167,208
813,267
313,880
317,855
22,530
786,762
289,014
914,681
34,072
-
1,169,623
83,340
215,160
9,486
-
289,014
959,500
1,034,345
59,734
-
1,934,111
198,498
930,576
169,574
-
959,500
915,899
93,949
27,608
-
982,240
666,323
348,967
99,391
-
915,899
2,951,175
2,530,191
200,155
28,029
5,253,182
1,761,428
1,808,583
596,306
22,530
2,951,175
JD JD JD JD
Real EstateLoans
LargeCompanies
Small andMedium Companies TotalIndividuals
Companies
2011
Balance – beginning of the year
Add: Interest in suspense for the year
Less: Interest taken to income
Interest in suspense written-off *
Balance - End of the Year
2010
Balance – beginning of the year
Add: Interest in suspense for the year
Less: Interest taken to income
Interest in suspense written-off *
Balance - End of the Year
2011
69
Not
es to
the
cons
olid
taed
fina
ncia
l sta
tem
ents
12. Property and Equipm
ent - Net
The details of this item are as follow
s:
Furniture,Fixtures and
Equipment
LandTotal
Buildings
VehiclesC
omputers
Cost:
Balance - beginning of the year
Additions
Disposals
Transfers
Balance - End of the year
Accumulated D
epreciation:
Balance - beginning of the year
Additions
Disposals
Balance - End of the year
Net B
ook Value of Fixed Assets
Year 2010
Cost:
Balance - beginning of the year
Additions
Disposals
Transfers
Balance - End of the year
Accumulated D
epreciation:
Balance - beginning of the year
Additions
Disposals
Balance - End of the year
Net B
ook Value of Fixed Assets
2011
6,030,272
-
-
4,946,673
10,976,945
-
-
-
-
10,976,945
3,644,336
1,746,910
-
639,026
6,030,272
-
-
-
-
6,030,272
JDJD
JDJD
JDJD
JD
2,329 ,765
-
-
8,188,996
10,518,761
1,082,608
143,150
-
1,225,758
9,293,003
2,878,586
-
-
(548,821)
2,329,765
949,231
133,377
-
1,082,608
1,247,157
3,166,415
366,252
17,030
656,291
4,171,928
1,498,767
741,219
14,278
2,225,708
1,946,220
2,092,086
268,149
328,230
1,134,410
3,166,415
1,434,078
380,911
316,222
1,498,767
1,667,648
331,864
22,885
40,000
-
314,749
115,470
51,395
18,145
148,720
166,029
288,626
111,436
68,198
-
331,864
111,024
72,644
68,198
115,470
216,394
570,959
136,540
-
455,540
1,163,039
247,635
161,461
-
409,096
753,943
478,348
153,001
69,048
8,658
570,959
241,264
75,419
69,048
247,635
323,324
15,579,650
1,919,402
-
(14,247,500)
3,251,552
-
-
-
-
3,251,552
10,320,196
6,492,727
-
(1,233,273)
15,579,650
-
-
-
-
15,579,650
28,008,925
2,445,079
57,030
-
30,396,974
2,944,480
1,097,225
32,423
4,009,282
26,387,692
19,702,178
8,772,223
465,476
-
28,008,925
2,735,597
662,351
453,468
2,944,480
25,064,445
- Property and Equipment as of D
ecember 31, 2011 include an am
ount of JD 5,311,293 representing fully depreciated property and equipm
ent JD
4,611,815 as of Decem
ber 31, 2010. * This item
represents down paym
ents for the purchase of furniture, fixtures and equipment for the purposes of the banks branch at Shm
esani (new location) and its tw
o branches at Emar Tow
ers and bonded which are still under construction as of the statem
ent of financial position date.
Dow
n Paym
ent for P
urchaseing Fixed A
ssets & P
rojects under C
onstruc-tion *
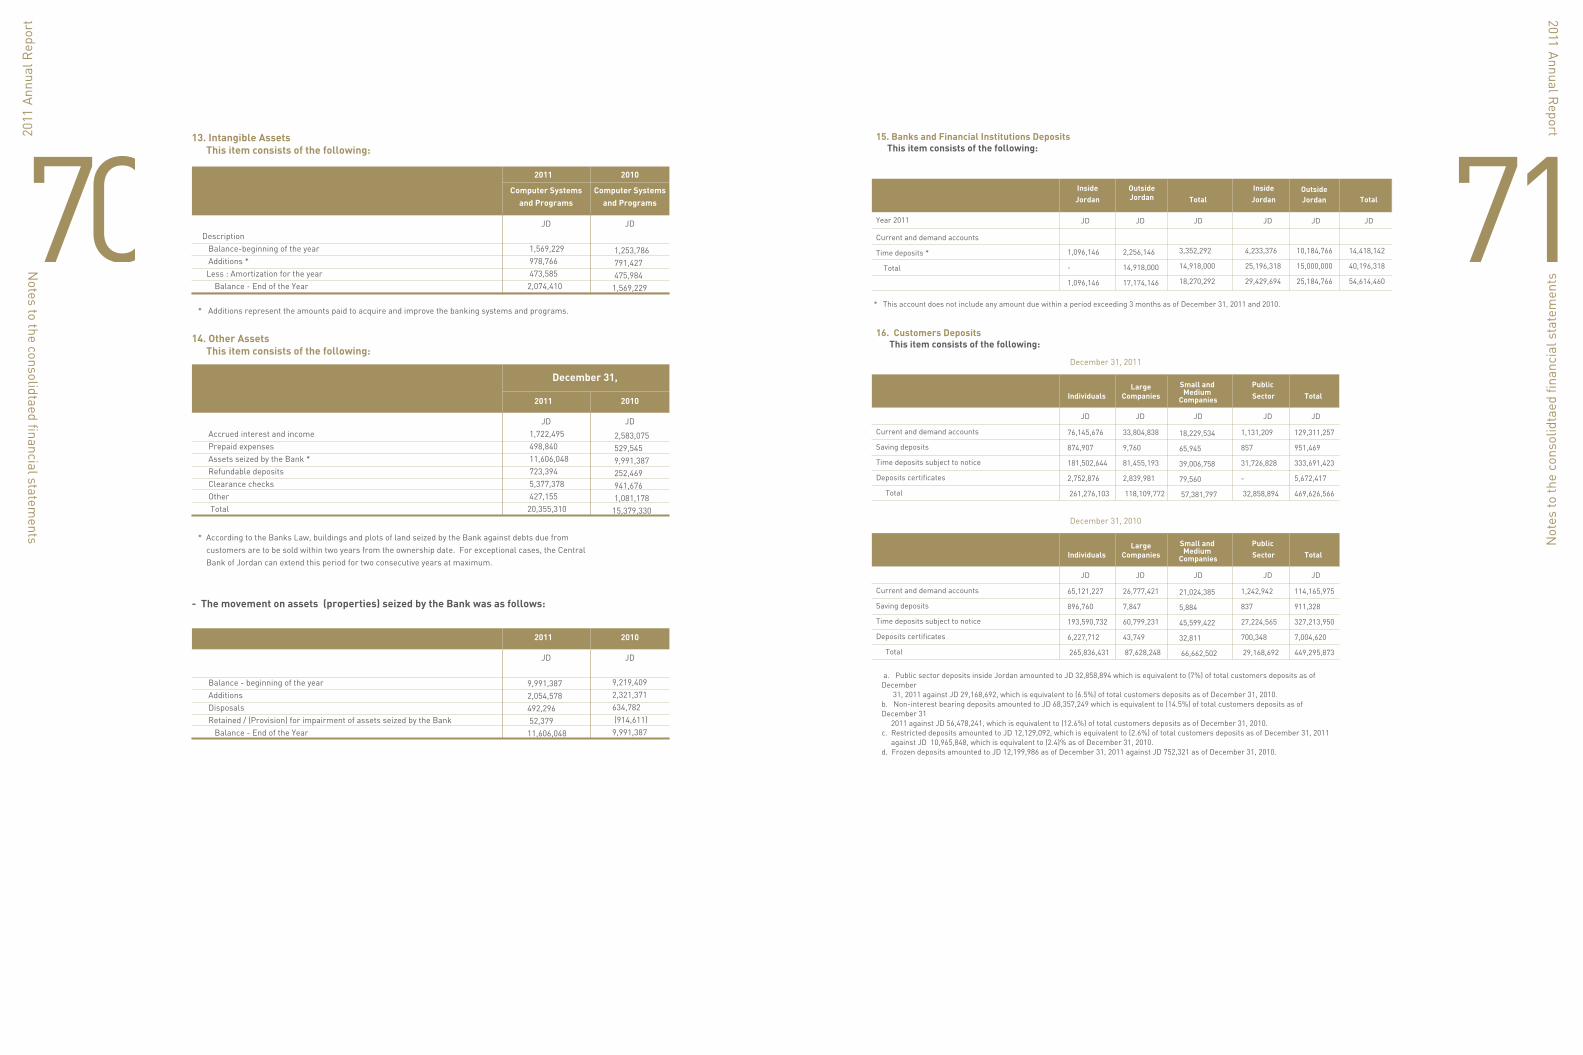
7170
Notes to the consolidtaed financial statem
ents
13. Intangible Assets This item consists of the following:
14. Other Assets This item consists of the following:
- The movement on assets (properties) seized by the Bank was as follows:
Computer Systemsand Programs
Computer Systemsand Programs
20102011
JD JD Description Balance-beginning of the year Additions * Less : Amortization for the year Balance - End of the Year * Additions represent the amounts paid to acquire and improve the banking systems and programs.
1,569,229 978,766 473,585 2,074,410
1,253,786 791,427 475,984 1,569,229
December 31,
20102011
JD JD Accrued interest and income Prepaid expenses Assets seized by the Bank * Refundable deposits Clearance checks Other Total
* According to the Banks Law, buildings and plots of land seized by the Bank against debts due from customers are to be sold within two years from the ownership date. For exceptional cases, the Central Bank of Jordan can extend this period for two consecutive years at maximum.
1,722,495 498,840 11,606,048 723,394 5,377,378 427,155 20,355,310
2,583,075 529,545 9,991,387 252,469 941,676 1,081,178 15,379,330
20102011
JD JD Balance - beginning of the year Additions Disposals Retained / (Provision) for impairment of assets seized by the Bank Balance - End of the Year
9,991,3872,054,578492,296 52,379 11,606,048
9,219,4092,321,371634,782 (914,611)9,991,387
Not
es to
the
cons
olid
taed
fina
ncia
l sta
tem
ents
15. Banks and Financial Institutions Deposits This item consists of the following:
16. Customers Deposits This item consists of the following:
TotalInsideJordan Total
OutsideJordan
InsideJordan
OutsideJordan
Current and demand accounts
Time deposits *
Total
Year 2011
1,096,146
-
1,096,146
JD JD JD JD JDJD
2,256,146
14,918,000
17,174,146
3,352,292
14,918,000
18,270,292
4,233,376
25,196,318
29,429,694
10,184,766
15,000,000
25,184,766
14,418,142
40,196,318
54,614,460
* This account does not include any amount due within a period exceeding 3 months as of December 31, 2011 and 2010.
Small andMedium
CompaniesIndividualsLarge
CompaniesPublic Sector Total
Current and demand accounts
Saving deposits
Time deposits subject to notice
Deposits certificates
Total
December 31, 2011
76,145,676
874,907
181,502,644
2,752,876
261,276,103
JD JD JD JD JD
33,804,838
9,760
81,455,193
2,839,981
118,109,772
18,229,534
65,945
39,006,758
79,560
57,381,797
1,131,209
857
31,726,828
-
32,858,894
129,311,257
951,469
333,691,423
5,672,417
469,626,566
Small andMedium
CompaniesIndividualsLarge
CompaniesPublic Sector Total
Current and demand accounts
Saving deposits
Time deposits subject to notice
Deposits certificates
Total
December 31, 2010
65,121,227
896,760
193,590,732
6,227,712
265,836,431
JD JD JD JD JD
26,777,421
7,847
60,799,231
43,749
87,628,248
21,024,385
5,884
45,599,422
32,811
66,662,502
1,242,942
837
27,224,565
700,348
29,168,692
114,165,975
911,328
327,213,950
7,004,620
449,295,873
a. Public sector deposits inside Jordan amounted to JD 32,858,894 which is equivalent to (7%) of total customers deposits as of December 31, 2011 against JD 29,168,692, which is equivalent to (6.5%) of total customers deposits as of December 31, 2010.b. Non-interest bearing deposits amounted to JD 68,357,249 which is equivalent to (14.5%) of total customers deposits as of December 31 2011 against JD 56,478,241, which is equivalent to (12.6%) of total customers deposits as of December 31, 2010.c. Restricted deposits amounted to JD 12,129,092, which is equivalent to (2.6%) of total customers deposits as of December 31, 2011 against JD 10,965,848, which is equivalent to (2.4)% as of December 31, 2010. d. Frozen deposits amounted to JD 12,199,986 as of December 31, 2011 against JD 752,321 as of December 31, 2010.
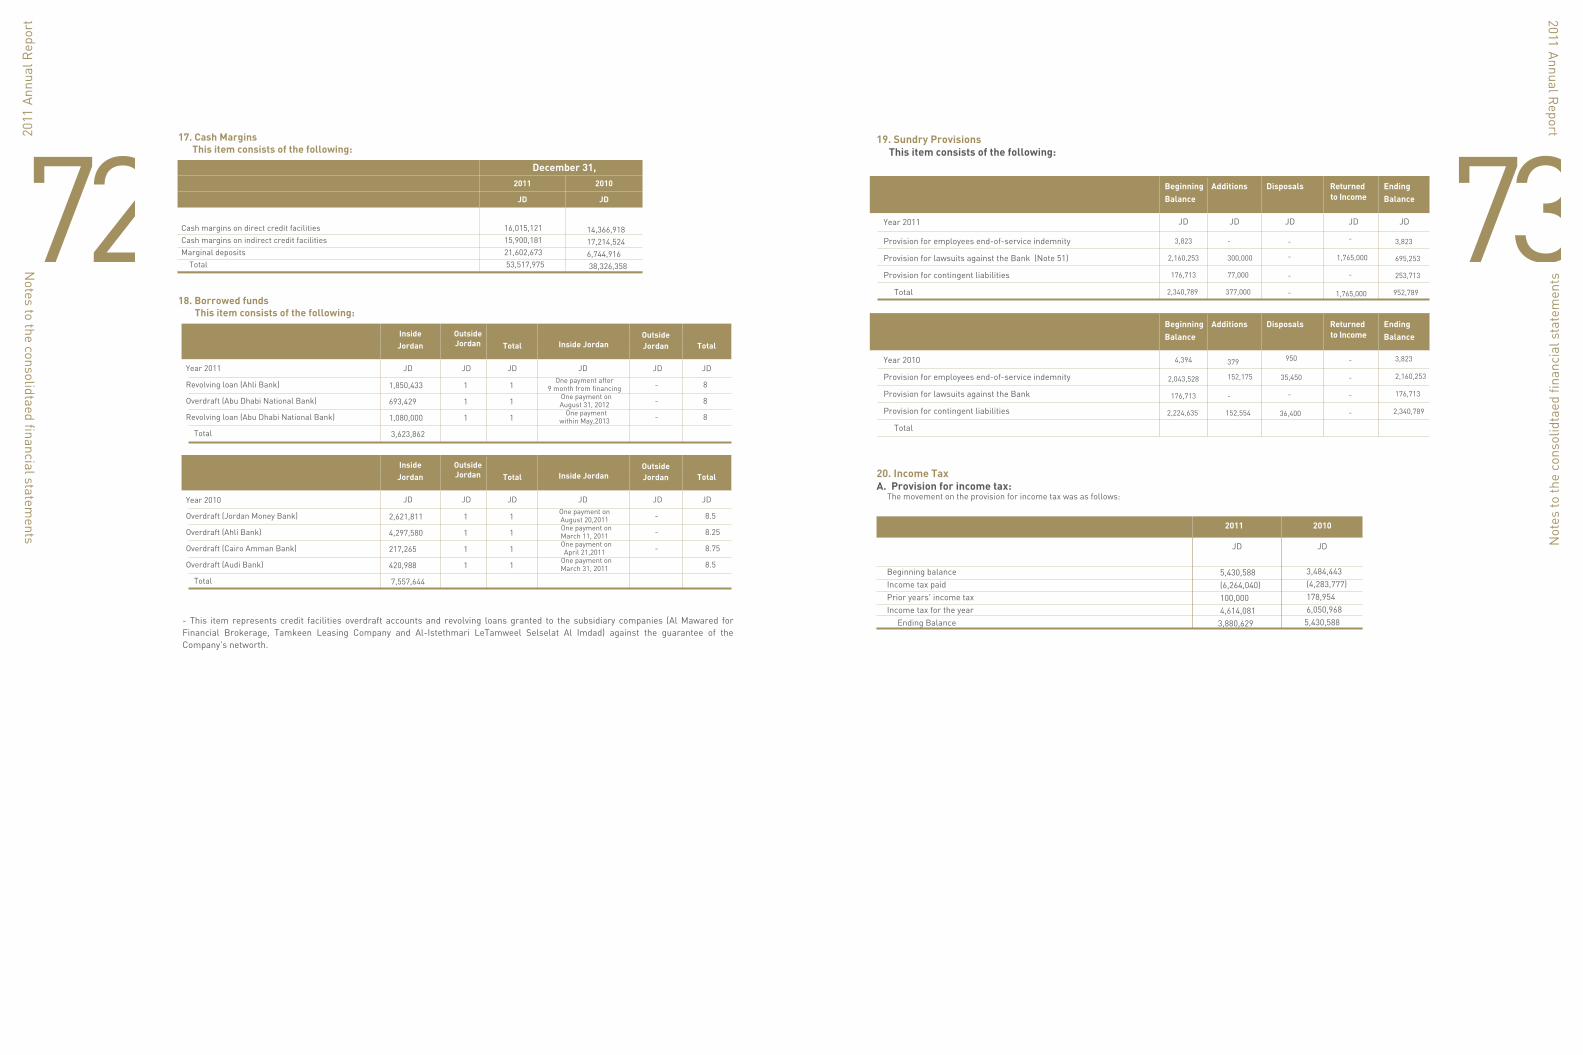
7372
Notes to the consolidtaed financial statem
ents
17. Cash Margins This item consists of the following:
18. Borrowed funds This item consists of the following:
2011 2010
JD JD
December 31,
Cash margins on direct credit facilities Cash margins on indirect credit facilities Marginal deposits Total
16,015,121 15,900,181 21,602,673 53,517,975
14,366,91817,214,5246,744,916 38,326,358
- This item represents credit facilities overdraft accounts and revolving loans granted to the subsidiary companies (Al Mawared for Financial Brokerage, Tamkeen Leasing Company and Al-Istethmari LeTamweel Selselat Al Imdad) against the guarantee of the Company's networth.
TotalInsideJordan Total
OutsideJordan Inside Jordan
OutsideJordan
Revolving loan (Ahli Bank)
Overdraft (Abu Dhabi National Bank)
Revolving loan (Abu Dhabi National Bank)
Total
Year 2011
1,850,433
693,429
1,080,000
3,623,862
JD JD JD JD JDJD
1
1
1
1
1
1
One payment after 9 month from financing
One payment onAugust 31, 2012
One paymentwithin May,2013
-
-
-
8
8
8
TotalInsideJordan Total
OutsideJordan Inside Jordan
OutsideJordan
Overdraft (Jordan Money Bank)
Overdraft (Ahli Bank)
Overdraft (Cairo Amman Bank)
Overdraft (Audi Bank)
Total
Year 2010
2,621,811
4,297,580
217,265
420,988
7,557,644
JD JD JD JD JDJD
1
1
1
1
1
1
1
1
One payment on August 20,2011 One payment onMarch 11, 2011 One payment on
April 21,2011 One payment onMarch 31, 2011
-
-
-
8.5
8.25
8.75
8.5
Not
es to
the
cons
olid
taed
fina
ncia
l sta
tem
ents
19. Sundry Provisions This item consists of the following:
20. Income TaxA. Provision for income tax: The movement on the provision for income tax was as follows:
JD
3,823
2,160,253
176,713
2,340,789
4,394
2,043,528
176,713
2,224,635
-
300,000
77,000
377,000
379
152,175
-
152,554
-
-
-
-
950
35,450
-
36,400
-
1,765,000
-
1,765,000
-
-
-
-
3,823
695,253
253,713
952,789
3,823
2,160,253
176,713
2,340,789
JD JD JD JD
Additions Disposals Returned to Income
EndingBalance
BeginningBalance
Additions Disposals Returned to Income
EndingBalance
BeginningBalance
20102011
JD JD
Beginning balance Income tax paid Prior years' income tax Income tax for the year Ending Balance
5,430,588 (6,264,040) 100,000 4,614,081 3,880,629
3,484,443 (4,283,777) 178,954 6,050,968 5,430,588
Year 2011
Provision for employees end-of-service indemnity
Provision for lawsuits against the Bank (Note 51)
Provision for contingent liabilities
Total
Year 2010
Provision for employees end-of-service indemnity
Provision for lawsuits against the Bank
Provision for contingent liabilities
Total
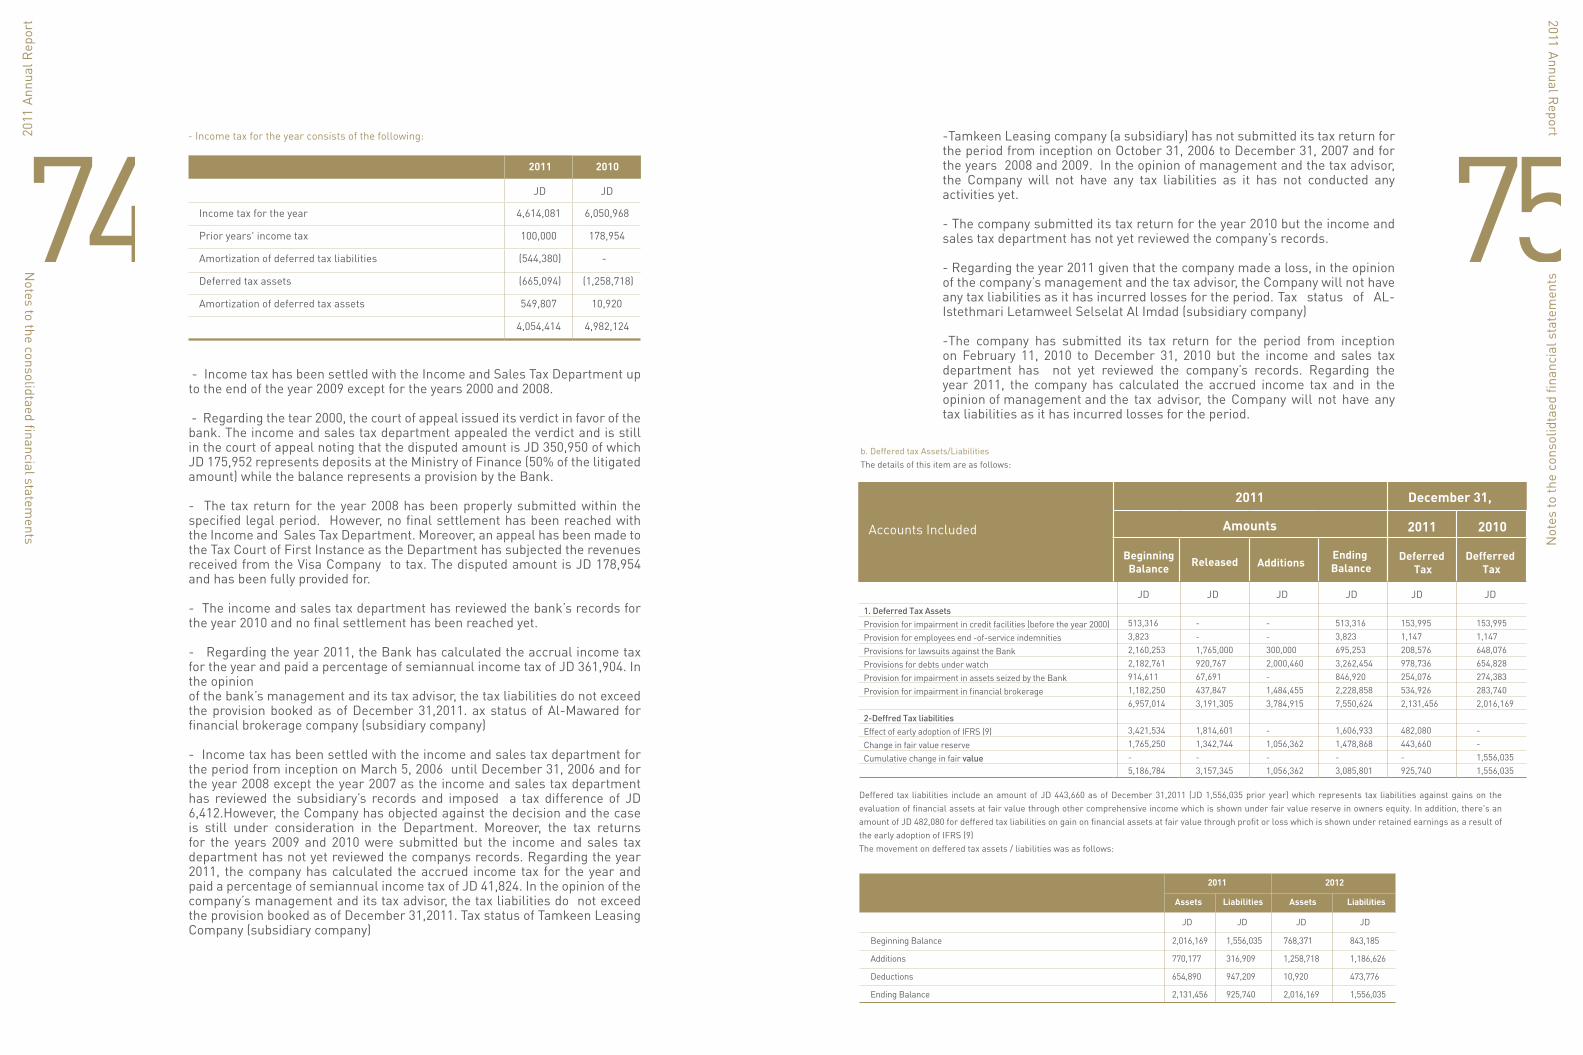
7574 - Income tax has been settled with the Income and Sales Tax Department up to the end of the year 2009 except for the years 2000 and 2008. - Regarding the tear 2000, the court of appeal issued its verdict in favor of the bank. The income and sales tax department appealed the verdict and is still in the court of appeal noting that the disputed amount is JD 350,950 of which JD 175,952 represents deposits at the Ministry of Finance (50% of the litigated amount) while the balance represents a provision by the Bank.
- The tax return for the year 2008 has been properly submitted within the specified legal period. However, no final settlement has been reached with the Income and Sales Tax Department. Moreover, an appeal has been made to the Tax Court of First Instance as the Department has subjected the revenues received from the Visa Company to tax. The disputed amount is JD 178,954 and has been fully provided for.
- The income and sales tax department has reviewed the bank’s records for the year 2010 and no final settlement has been reached yet.
- Regarding the year 2011, the Bank has calculated the accrual income tax for the year and paid a percentage of semiannual income tax of JD 361,904. In the opinion of the bank’s management and its tax advisor, the tax liabilities do not exceed the provision booked as of December 31,2011. ax status of Al-Mawared for financial brokerage company (subsidiary company)
- Income tax has been settled with the income and sales tax department for the period from inception on March 5, 2006 until December 31, 2006 and for the year 2008 except the year 2007 as the income and sales tax department has reviewed the subsidiary’s records and imposed a tax difference of JD 6,412.However, the Company has objected against the decision and the case is still under consideration in the Department. Moreover, the tax returns for the years 2009 and 2010 were submitted but the income and sales tax department has not yet reviewed the companys records. Regarding the year 2011, the company has calculated the accrued income tax for the year and paid a percentage of semiannual income tax of JD 41,824. In the opinion of the company’s management and its tax advisor, the tax liabilities do not exceed the provision booked as of December 31,2011. Tax status of Tamkeen Leasing Company (subsidiary company)
Notes to the consolidtaed financial statem
ents
JD
2011
4,614,081
100,000
(544,380)
(665,094)
549,807
4,054,414
6,050,968
178,954
-
(1,258,718)
10,920
4,982,124
JD
2010
Income tax for the year
Prior years' income tax
Amortization of deferred tax liabilities
Deferred tax assets
Amortization of deferred tax assets
- Income tax for the year consists of the following: -Tamkeen Leasing company (a subsidiary) has not submitted its tax return for the period from inception on October 31, 2006 to December 31, 2007 and for the years 2008 and 2009. In the opinion of management and the tax advisor, the Company will not have any tax liabilities as it has not conducted any activities yet.
- The company submitted its tax return for the year 2010 but the income and sales tax department has not yet reviewed the company’s records.
- Regarding the year 2011 given that the company made a loss, in the opinion of the company’s management and the tax advisor, the Company will not have any tax liabilities as it has incurred losses for the period. Tax status of AL-Istethmari Letamweel Selselat Al Imdad (subsidiary company) -The company has submitted its tax return for the period from inception on February 11, 2010 to December 31, 2010 but the income and sales tax department has not yet reviewed the company’s records. Regarding the year 2011, the company has calculated the accrued income tax and in the opinion of management and the tax advisor, the Company will not have any tax liabilities as it has incurred losses for the period.
Not
es to
the
cons
olid
taed
fina
ncia
l sta
tem
ents
JDJD JD JD JD JD
20102011
December 31,2011
Amounts
BeginningBalance Released Additions
Ending Balance
Deferred Tax
Defferred Tax
b. Deffered tax Assets/Liabilities The details of this item are as follows:
1. Deferred Tax AssetsProvision for impairment in credit facilities (before the year 2000) Provision for employees end -of-service indemnities Provisions for lawsuits against the Bank Provisions for debts under watch Provision for impairment in assets seized by the Bank Provision for impairment in financial brokerage
2-Deffred Tax liabilitiesEffect of early adoption of IFRS (9)Change in fair value reserveCumulative change in fair value
Beginning Balance
Additions
Deductions
Ending Balance
513,3163,8232,160,2532,182,761914,6111,182,2506,957,014
3,421,5341,765,250-5,186,784
2,016,169
770,177
654,890
2,131,456
1,556,035
316,909
947,209
925,740
768,371
1,258,718
10,920
2,016,169
843,185
1,186,626
473,776
1,556,035
--1,765,000920,76767,691437,8473,191,305
1,814,6011,342,744-3,157,345
--300,0002,000,460-1,484,4553,784,915
-1,056,362-1,056,362
513,3163,823695,2533,262,454846,9202,228,8587,550,624
1,606,9331,478,868-3,085,801
153,9951,147208,576978,736254,076534,9262,131,456
482,080443,660-925,740
153,9951,147648,076654,828274,383283,7402,016,169
--1,556,0351,556,035
Deffered tax liabilities include an amount of JD 443,660 as of December 31,2011 (JD 1,556,035 prior year) which represents tax liabilities against gains on the evaluation of financial assets at fair value through other comprehensive income which is shown under fair value reserve in owners equity. In addition, there's an amount of JD 482,080 for deffered tax liabilities on gain on financial assets at fair value through profit or loss which is shown under retained earnings as a result of the early adoption of IFRS (9) The movement on deffered tax assets / liabilities was as follows:
Liabilities Assets Liabilities
20122011
Assets
Accounts Included
JDJDJDJD
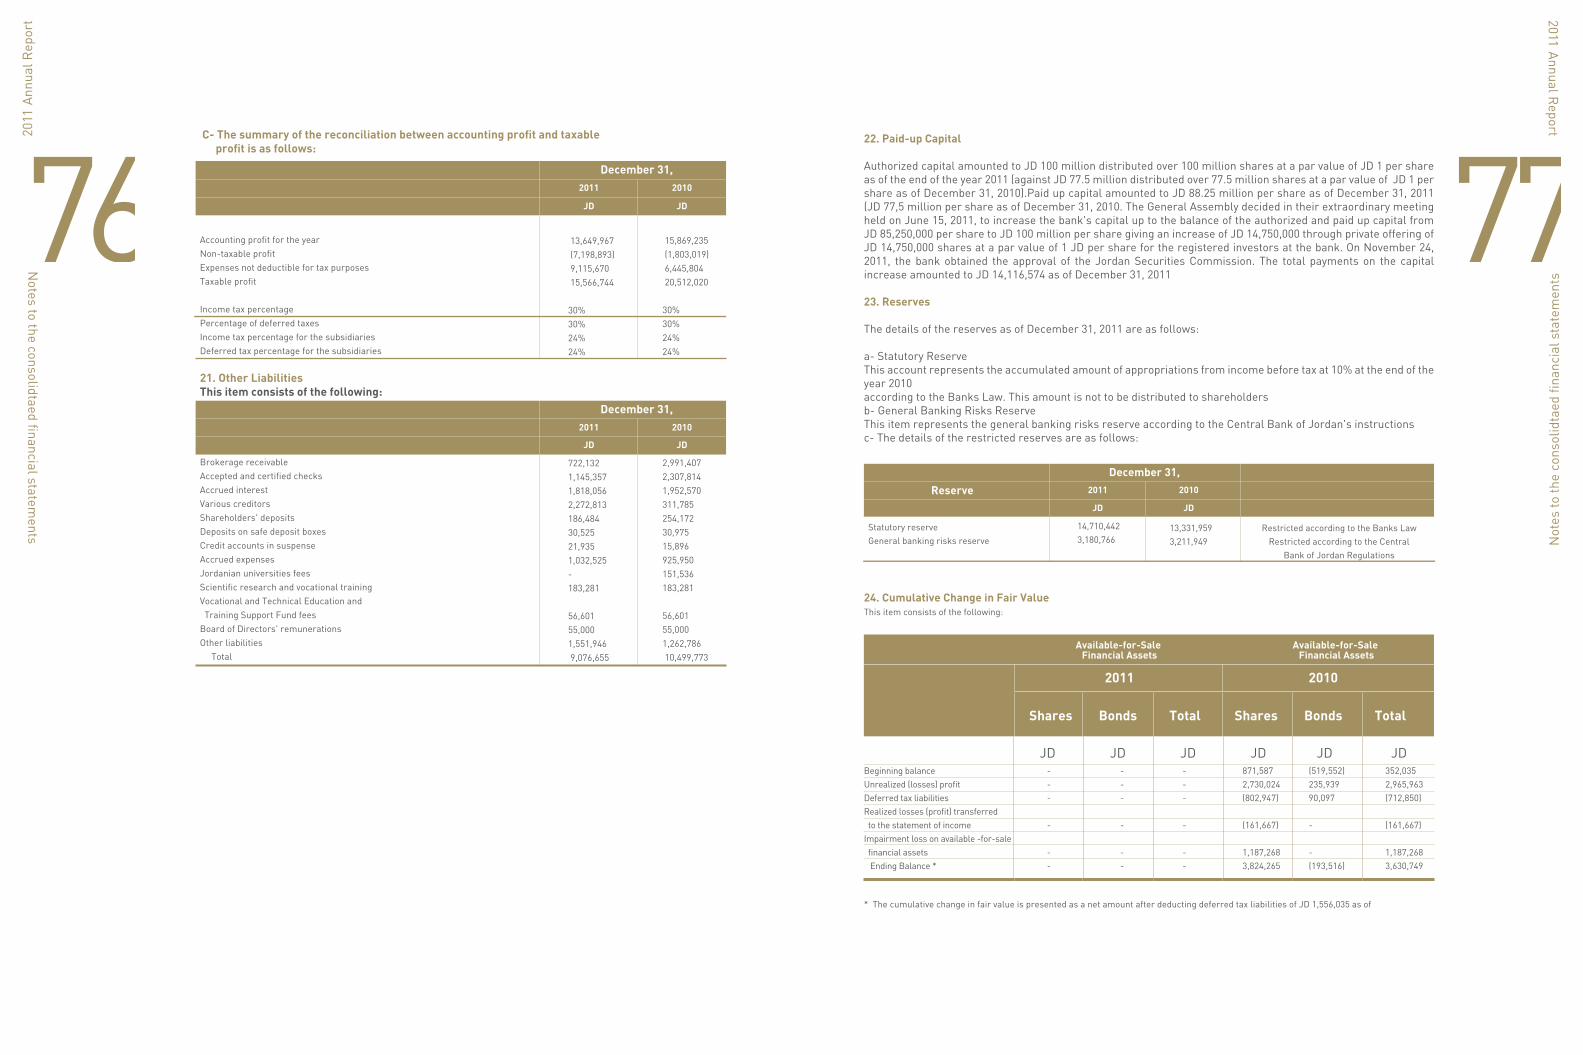
7776
Notes to the consolidtaed financial statem
ents
13,649,967 (7,198,893) 9,115,670 15,566,744
30%30%24%24%
722,1321,145,3571,818,0562,272,813186,48430,52521,9351,032,525-183,281
56,60155,0001,551,946 9,076,655
15,869,235 (1,803,019) 6,445,804 20,512,020
30%30%24%24%
2,991,4072,307,8141,952,570311,785254,17230,97515,896925,950151,536183,281
56,60155,0001,262,786 10,499,773
C- The summary of the reconciliation between accounting profit and taxable profit is as follows:
2011 2010
JD JD
December 31,
2011 2010
December 31,
Accounting profit for the yearNon-taxable profitExpenses not deductible for tax purposesTaxable profit
Income tax percentagePercentage of deferred taxes Income tax percentage for the subsidiariesDeferred tax percentage for the subsidiaries
21. Other LiabilitiesThis item consists of the following:
Brokerage receivableAccepted and certified checksAccrued interest Various creditors Shareholders' depositsDeposits on safe deposit boxesCredit accounts in suspenseAccrued expensesJordanian universities feesScientific research and vocational trainingVocational and Technical Education and Training Support Fund feesBoard of Directors' remunerationsOther liabilities Total
JD JD
Not
es to
the
cons
olid
taed
fina
ncia
l sta
tem
ents
JDJD JD JD JD JD
20102011
Available-for-Sale Financial Assets
Available-for-Sale Financial Assets
Shares Bonds Total Shares Bonds Total
2011 2010
JD JD
December 31,
Reserve
Statutory reserveGeneral banking risks reserve
14,710,4423,180,766
13,331,9593,211,949
Restricted according to the Banks LawRestricted according to the Central
Bank of Jordan Regulations
22. Paid-up Capital
Authorized capital amounted to JD 100 million distributed over 100 million shares at a par value of JD 1 per share as of the end of the year 2011 (against JD 77.5 million distributed over 77.5 million shares at a par value of JD 1 per share as of December 31, 2010).Paid up capital amounted to JD 88.25 million per share as of December 31, 2011 (JD 77,5 million per share as of December 31, 2010. The General Assembly decided in their extraordinary meeting held on June 15, 2011, to increase the bank's capital up to the balance of the authorized and paid up capital from JD 85,250,000 per share to JD 100 million per share giving an increase of JD 14,750,000 through private offering of JD 14,750,000 shares at a par value of 1 JD per share for the registered investors at the bank. On November 24, 2011, the bank obtained the approval of the Jordan Securities Commission. The total payments on the capital increase amounted to JD 14,116,574 as of December 31, 2011
23. Reserves The details of the reserves as of December 31, 2011 are as follows:
a- Statutory ReserveThis account represents the accumulated amount of appropriations from income before tax at 10% at the end of the year 2010 according to the Banks Law. This amount is not to be distributed to shareholdersb- General Banking Risks Reserve This item represents the general banking risks reserve according to the Central Bank of Jordan's instructionsc- The details of the restricted reserves are as follows:
24. Cumulative Change in Fair Value This item consists of the following:
Beginning balanceUnrealized (losses) profitDeferred tax liabilitiesRealized losses (profit) transferred to the statement of incomeImpairment loss on available -for-sale financial assets Ending Balance *
- - -
-
- -
- - -
-
- -
- - -
-
- -
871,587 2,730,024 (802,947)
(161,667)
1,187,268 3,824,265
(519,552) 235,939 90,097
-
- (193,516)
352,035 2,965,963 (712,850)
(161,667)
1,187,268 3,630,749
* The cumulative change in fair value is presented as a net amount after deducting deferred tax liabilities of JD 1,556,035 as of

7978
Notes to the consolidtaed financial statem
ents
JD
2011
-
1,235,675
85,915
(286,382)
1,035,208
-
-
-
-
-
JD
2010
Beginning balance
Effect of early adoption of IFRS (9)
Deferred tax liabilities
Unrealized (losses)
Ending Balance *
25. Fair Value Reserve - Net This item consists of the following:
* The fair value reserve is presented as a net after deducting deferred tax liabilities of JD 443,660 as of December 31, 2011.
JD
2011
9,746,611
2,885,693
12,632,304
9,594,044
(1,347,300)
(7,750,000)
13,129,048
8,320,811
-
8,320,811
10,893,192
(1,967,392)
(7,500,000)
9,746,611
JD
2010
Beginning balance
Effect of early adoption of IFRS (9)
Adjusted balance
Profit for the year
(Transferred) to reserves
Transferred to capital
Ending Balance
26. Retained Earnings This item consists of the following:
- Included in retained earnings is an amount of JD 2,131,456 restricted against deferred tax assets as of December 31, 2011 (JD 2,016,169 as of December 31, 2010). - Retained earnings include an amount of JD 1,615,472 as of December 31, 2011 which represents the effect of early adoption of IFRS (9). These amounts are restricted amounts and cannot be utilized unless realized as instructed by the Jordan Securities Commission. - During the year 2011, an amount of JD 7.75 million was capitalized from retained earnings, equivalent to 10% of capital against JD 7.5 million equivalent to 10.714% for the year 2010. 27 - Proposed Dividends: a. The Board of Directors decided to recommend to the General Assembly of Shareholders to distribute JD 8 million about 8% of capital. In addition, the General Assembly of Shareholders approved the Board of Directors' recommen-dation in their extraordinary meeting to distribute JD 7.75 million as free shares for the year 2010, equivalent to 10% of capital, through capitalizing part of retained earnings. Moreover, the free shares have been listed effective from May 19, 2011 after obtaining the approval of the Jordan Securities Commission.
28. Non-Controlling InterestThis item consists of the following:
Non ControllingInterest Shareof Net Assets
Non-ControllingInterest Share
Non ControllingInterest Shareof Net Assets
Non-ControllingInterest Share
of Net Profit(Loss) for the Year
Non-ControllingInterest Share
Non-ControllingInterest Share
of Net(Loss) for the Year
Tamkeen leasing Company
Al-Istethmari LeTamweel Selselat Al Imdad
%
10
6
JD JD JDJD
(8,322)
9,831
1,509
291,678
183,750
475,428
%
-
6
-
(6,081)
(6,081)
-
173,919
173,919
Not
es to
the
cons
olid
taed
fina
ncia
l sta
tem
ents
29. Interest IncomeThis item consists of the following:
2011 2010
JD JD
December 31,
Direct credit facilities: Individuals (retail): Overdraft Loans and promissory notes Credit cards Real estate loans Companies Large companies Overdraft Loans and promissory notes Medium and small companies Overdraft Loans and promissory notes Government and public sector Balances and deposits at banks and financial institutions Financial assets at fair value through profit or loss Available-for-sale financial assets Financial assets at amortized cost Total
1,142,4593,272,588237,6845,123,583
5,071,76715,292,979
1,314,4831,566,83577,153337,989267,678-7,752,82541,458,023
1,532,0312,932,929185,5905,407,194
2,400,77514,416,673
1,641,124828,971235,810157,443-10,172,427-39,910,967
30. Interest ExpenseThis item consists of the following:
2011 2010
JD JD
December 31,
Deposits at banks and financial institutionsCustomers Deposits: Current and demand accounts Saving accounts Time and notice deposits Certificates of depositCash marginsBorrowed funds Deposit guarantee fees Total
548,555
1,674,8796,53512,249,067269,939828,612219,103932,20616,728,896
419,883
1,246,5955,96112,946,549476,05899,326710,447830,35916,735,178
31. Commission Income - NetThis item consists of the following:
2011 2010
JD JD
December 31,
Commission Income: Direct credit facilities commissions Indirect credit facilities commissions Brokerage commissions Other commissions Total Commissions Income Less: Commissions expense Net Commissions Income
1,807,5741,807,537629,920739,7834,984,814675,5934,309,221
2,259,3522,747,6051,355,683663,8267,026,466576,2406,450,226
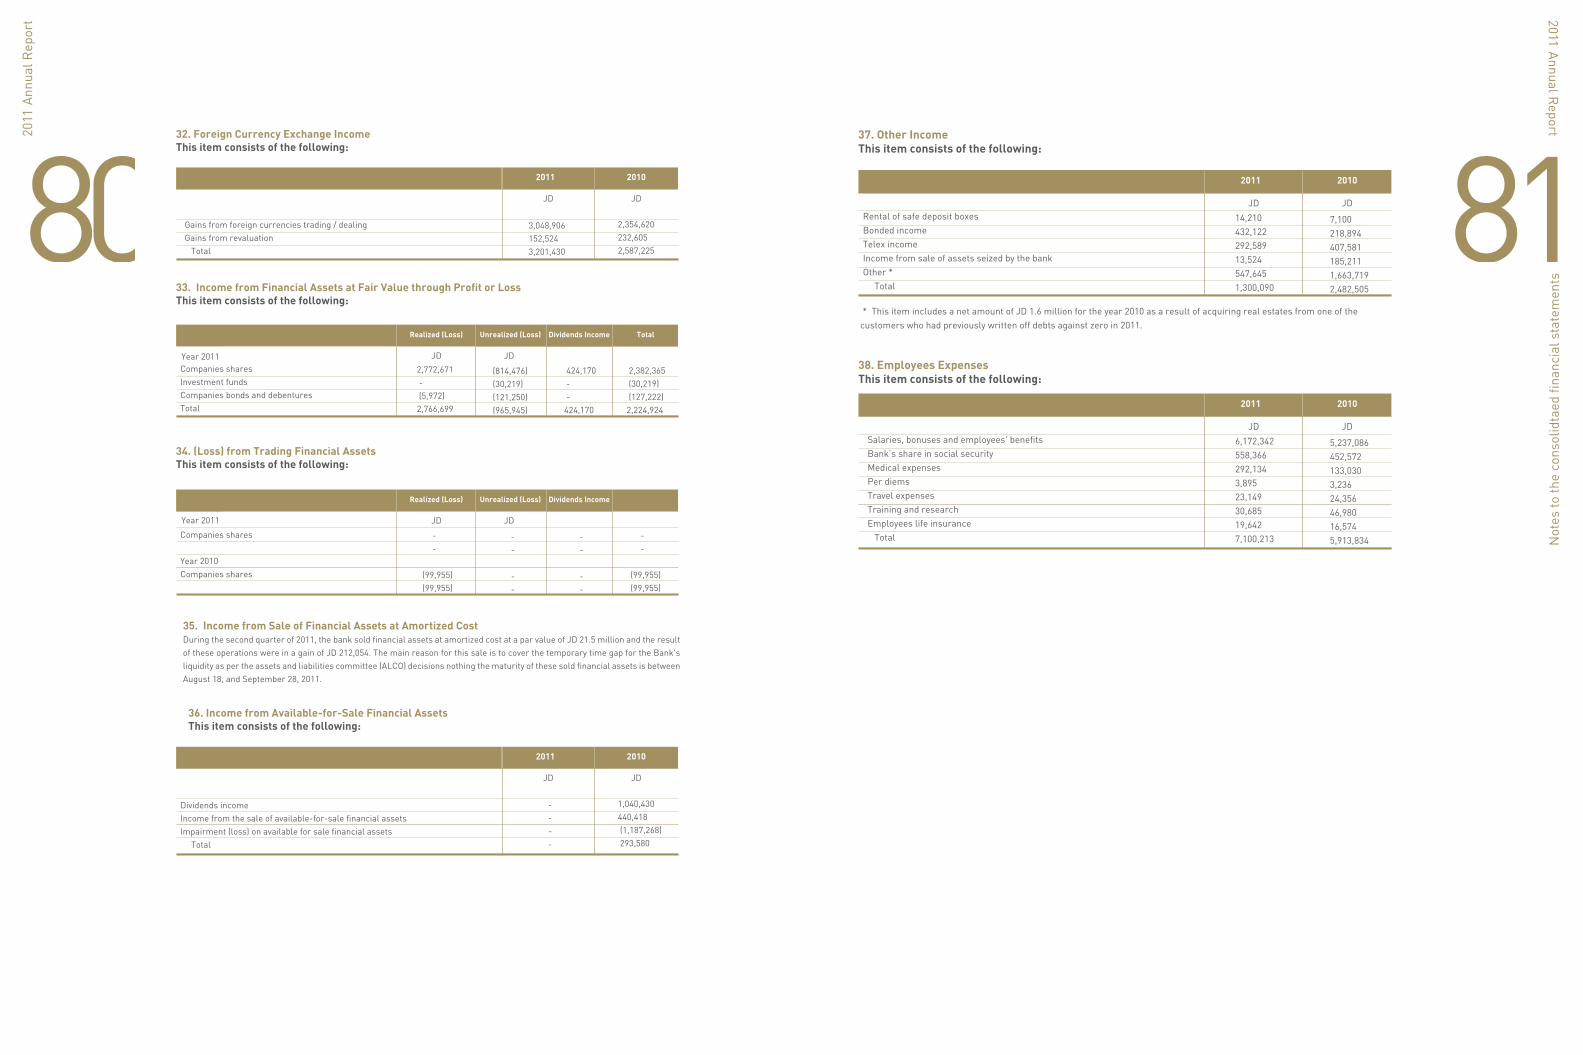
818032. Foreign Currency Exchange IncomeThis item consists of the following:
33. Income from Financial Assets at Fair Value through Profit or LossThis item consists of the following:
20102011
JD JD
Gains from foreign currencies trading / dealing Gains from revaluation Total
3,048,906 152,524 3,201,430
2,354,620 232,605 2,587,225
20102011
JD JD
Dividends incomeIncome from the sale of available-for-sale financial assets Impairment (loss) on available for sale financial assets Total
- - - -
1,040,430 440,418 (1,187,268) 293,580
Unrealized (Loss) Dividends Income TotalRealized (Loss)
JD JDCompanies sharesInvestment fundsCompanies bonds and debenturesTotal
2,772,671 - (5,972) 2,766,699
(814,476) (30,219) (121,250) (965,945)
424,170 - - 424,170
2,382,365 (30,219) (127,222)2,224,924
Year 2011
Year 2011
34. (Loss) from Trading Financial AssetsThis item consists of the following:
36. Income from Available-for-Sale Financial AssetsThis item consists of the following:
Unrealized (Loss) Dividends IncomeRealized (Loss)
JD JD
Companies shares
Year 2010Companies shares
- -
(99,955) (99,955)
- -
(99,955) (99,955)
- -
- -
- -
- -
35. Income from Sale of Financial Assets at Amortized CostDuring the second quarter of 2011, the bank sold financial assets at amortized cost at a par value of JD 21.5 million and the result of these operations were in a gain of JD 212,054. The main reason for this sale is to cover the temporary time gap for the Bank's liquidity as per the assets and liabilities committee (ALCO) decisions nothing the maturity of these sold financial assets is between August 18, and September 28, 2011.
Not
es to
the
cons
olid
taed
fina
ncia
l sta
tem
ents
37. Other IncomeThis item consists of the following:
20102011
JD JDRental of safe deposit boxesBonded income Telex incomeIncome from sale of assets seized by the bankOther * Total
14,210 432,122 292,589 13,524 547,645 1,300,090
7,100 218,894 407,581 185,211 1,663,719 2,482,505
20102011
JD JD Salaries, bonuses and employees' benefits Bank’s share in social security Medical expenses Per diems Travel expenses Training and research Employees life insurance Total
6,172,342 558,366 292,134 3,895 23,149 30,685 19,642 7,100,213
5,237,086 452,572 133,030 3,236 24,356 46,980 16,574 5,913,834
38. Employees ExpensesThis item consists of the following:
* This item includes a net amount of JD 1.6 million for the year 2010 as a result of acquiring real estates from one of the customers who had previously written off debts against zero in 2011.
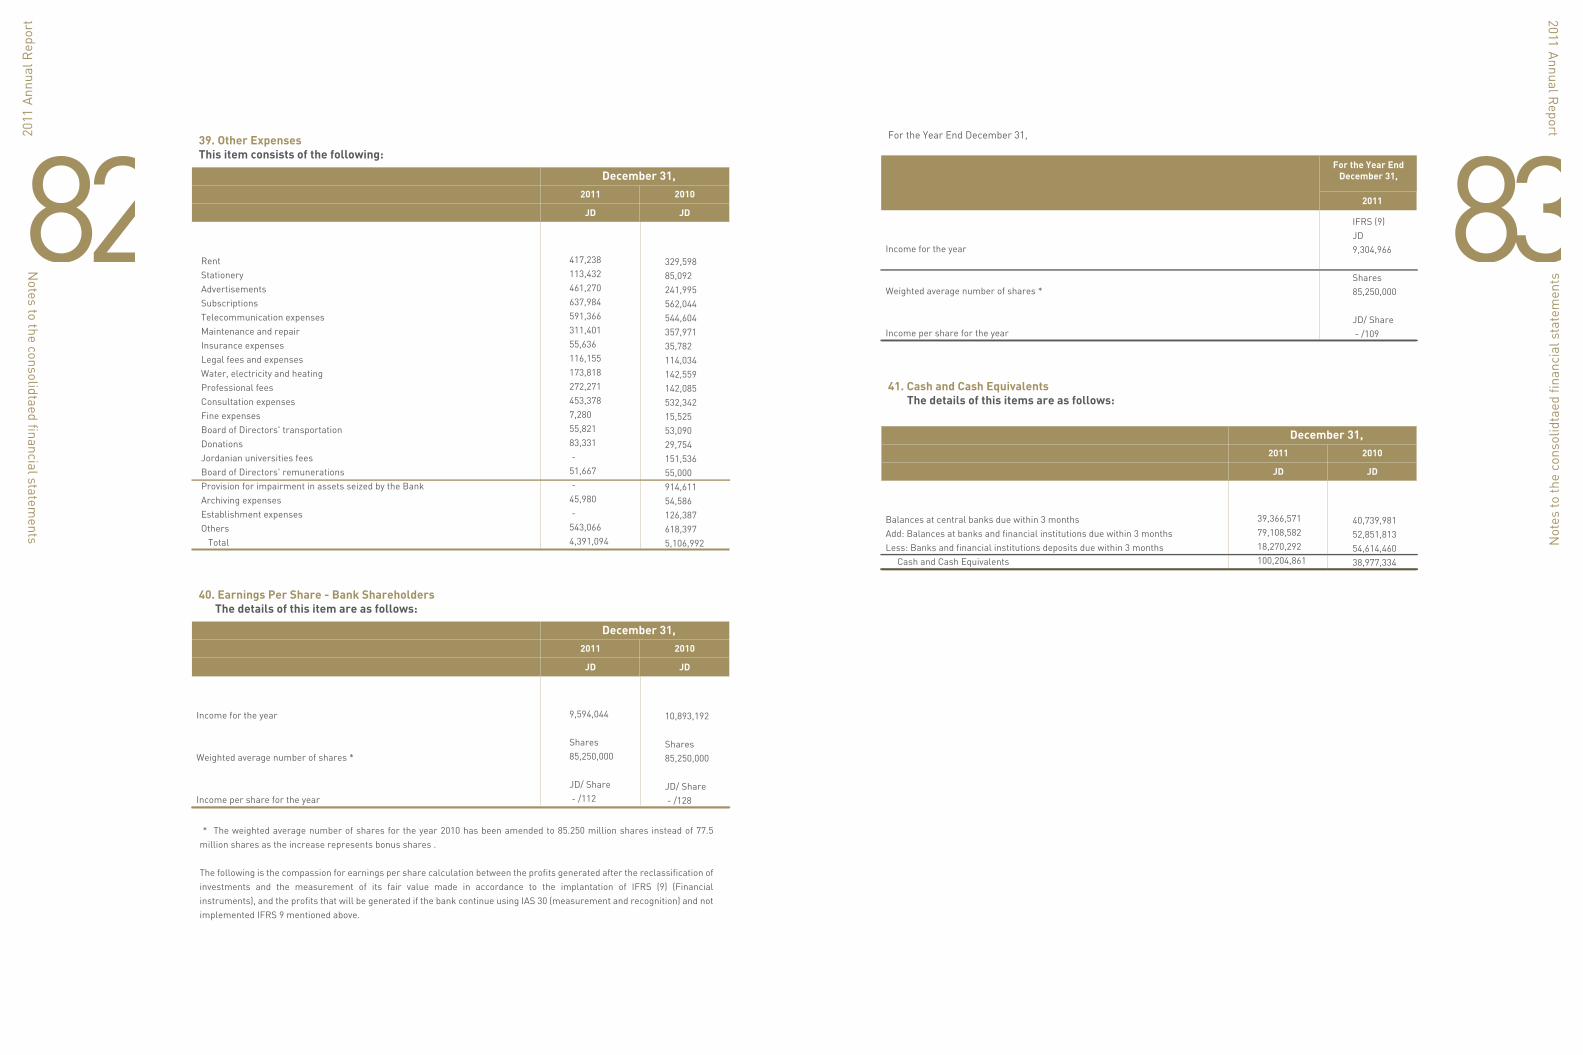
8382
Notes to the consolidtaed financial statem
ents
417,238113,432461,270637,984591,366311,40155,636116,155173,818272,271453,3787,28055,82183,331 - 51,667 - 45,980 - 543,0664,391,094
329,59885,092241,995562,044544,604357,97135,782114,034142,559142,085532,34215,52553,09029,754151,53655,000914,61154,586126,387618,3975,106,992
39. Other ExpensesThis item consists of the following:
2011 2010
JD JD
December 31,
Rent Stationery Advertisements Subscriptions Telecommunication expenses Maintenance and repair Insurance expenses Legal fees and expenses Water, electricity and heating Professional fees Consultation expenses Fine expenses Board of Directors' transportation Donations Jordanian universities fees Board of Directors' remunerations Provision for impairment in assets seized by the Bank Archiving expenses Establishment expenses Others Total
9,594,044
Shares85,250,000
JD/ Share - /112
10,893,192
Shares85,250,000
JD/ Share - /128
40. Earnings Per Share - Bank Shareholders The details of this item are as follows:
2011 2010
JD JD
December 31,
Income for the year
Weighted average number of shares *
Income per share for the year
* The weighted average number of shares for the year 2010 has been amended to 85.250 million shares instead of 77.5 million shares as the increase represents bonus shares .
The following is the compassion for earnings per share calculation between the profits generated after the reclassification of investments and the measurement of its fair value made in accordance to the implantation of IFRS (9) (Financial instruments), and the profits that will be generated if the bank continue using IAS 30 (measurement and recognition) and not implemented IFRS 9 mentioned above.
Not
es to
the
cons
olid
taed
fina
ncia
l sta
tem
ents
41. Cash and Cash Equivalents The details of this items are as follows:
39,366,57179,108,58218,270,292100,204,861
40,739,98152,851,81354,614,46038,977,334
2011 2010
JD JD
December 31,
Balances at central banks due within 3 months Add: Balances at banks and financial institutions due within 3 months Less: Banks and financial institutions deposits due within 3 months Cash and Cash Equivalents
IFRS (9)JD9,304,966
Shares85,250,000
JD/ Share - /109
2011
For the Year EndDecember 31,
Income for the year
Weighted average number of shares *
Income per share for the year
For the Year End December 31,

8584
Notes to the consolidtaed financial statem
ents
42. Financial Derivatives The details of financial derivatives outstanding at the end of 2011 is as follows :
- The nominal value represents the deals value outstanding at year-end and does not represent market risks or credit risks. The details of financial derivatives outstanding at the end of 2010 is as follows:
Total NominalAmounts
Positive FairValue
From 1 Yearup to 3 Years
More than3 Years
Negative FairValue
Within 3Months
Form 3 Monthsup to 12 Months
Trading Derivatives:
Forward sales contracts in foreign currencies
Forward purchase contracts in foreign currencies
Total
Year 2011
9,440
9,440
297,430
297,430
306,870
JD JD JD JD JDJD
(293,270)
(293,270)
(9,220)
(9,220)
(302,490)
3,364,403
3,364,403
3,366,052
3,366,052
6,730,455
158,652
158,652
158,616
158,616
317,268
3,205,751
3,205,751
3,207,436
3,207,436
6,413,187
-
-
-
-
-
-
-
-
-
-
Total NominalAmounts
Positive FairValue
From 1 Yearup to 3 Years
More than3 Years
Negative FairValue
Within 3Months
Form 3 Monthsup to 12 Months
Trading Derivatives:
Forward sales contracts in foreign currencies
Forward purchase contracts in foreign currencies
Total
Year 2010
15,624
15,624
148
148
15,772
JD JD JD JD JDJD
-
-
(7,881)
(7,881)
(7,881)
(1,174,487)
(1,174,487)
1,166,596
1,166,596
(7,891)
(474,676)
(474,676)
473,967
473,967
(709)
(699,811)
(699,811)
692,629
692,629
(7,182)
-
-
-
-
-
-
-
-
-
-
2011 2010Ownership
JD JDAl-Mawared for financial brokerageTamkeen leasing CompanyAl Istethemari Letamweel Selselat Al Imdad
1009094
10,000,000 3,000,000 3,000,000
10,000,000 1,000,000 3,000,000
43. Transactions with Related Parties The consolidated financial statements include the financial statements of the bank and the subsidiary companies as follows:
The Bank entered into transactions with companies owned by members of the Board of Directors ,major shareholders, executive management and subsidiaries within the normal banking practice according to the commercial interest rates and commissions. All credit facilities granted to related party companies represent performing credit facilities and no provision has been taken thereon (except as mentioned below). The following represents a summary of transactions with related parties during the year and previous year:
Not
es to
the
cons
olid
taed
fina
ncia
l sta
tem
ents
JD JD JD JD JD
Subsidiaries * 2011 2010
Board ofDirectors
Members andExecutive
Management
Others (Employees,
Employees Relatives,
Relatives of Members
of the Board of
Directors, Executive
Management and
Controlled Companies
On-Financial Position Items:Credit facilities Provision for impairment in direct credit facilitiesDeposits and current accounts
Off-Financial Position Items: Letters of guarantee Letters of credit
Statement of Income:Interest and commission receivedInterest and commission paidProvision for impairment in direct credit facilities Additional InformationUnderwatch credit facilitiesProvision for underwatch credit facilitiesNon-performing credit facilitiesProvision for non-performing credit facilitiesInterest in suspense
Maximum credit interest rate 15%
Minimum credit interest rate 3%
Maximum debit interest rate 4/6%
The following is a summary of the executive management salaries and benefits
Salaries and benefits
The following is a summary of the executive management salaries and benefits
" Maximum credit commission 1% "" Minimum credit commission 0.5% "" Maximum debit commission 0% "
182,712 -
1,899,783
435,446 710,000
48,674 84,038
-
- - - - -
6,978,252 -
3,279,452
- 5,300
249,580 86,428
-
- - - - -
35,901,079 1,087,856 18,304,607
854,130 12,619,545
2,465,951 733,854 811,221
14,481,609 217,125 942,851 870,731 30,652
43,062,043 1,087,856 23,483,842
1,289,576 13,334,845
2,764,205 904,320 811,221
14,481,609 217,125 942,851 870,731 30,652
3,947,639 276,635 20,592,908
722,937 14,313,452
3,337,935 861,290 91,635
16,245,396 243,635 33,000 33,000 -
* All those amounts and transactions are eliminated from the consolidated financial statements and are shown for explanatory purposes only.
20102011
JD JDSalaries and benefits 1,717,048 1,603,336
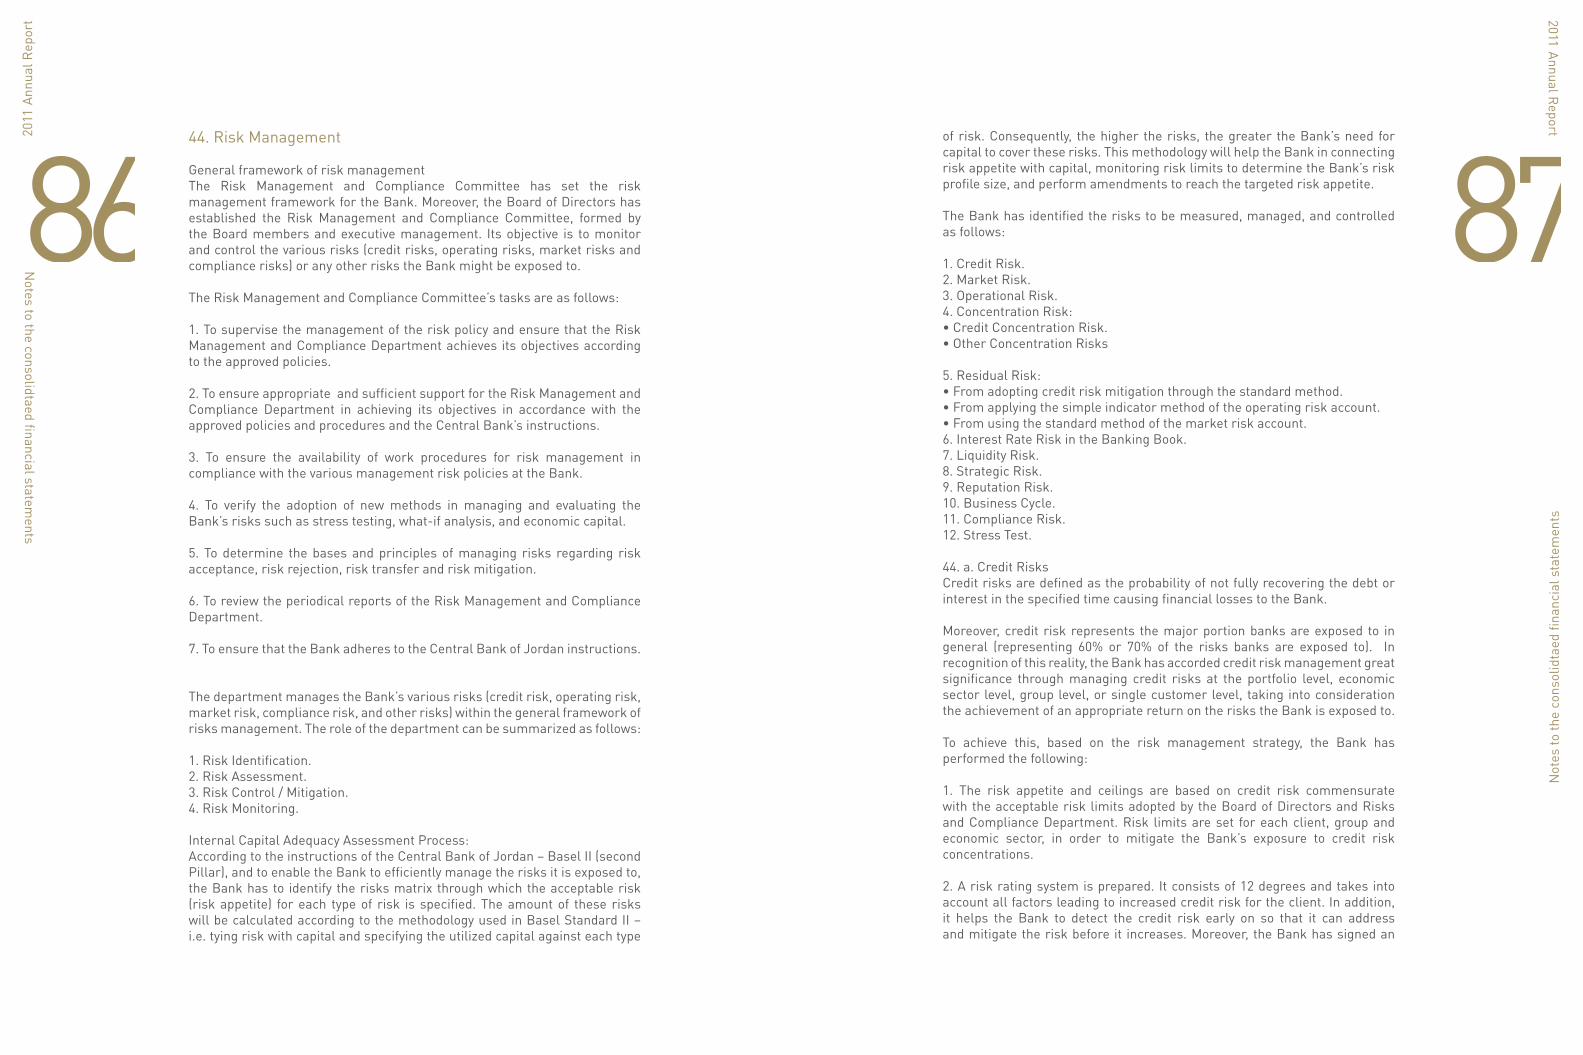
878644. Risk Management
General framework of risk managementThe Risk Management and Compliance Committee has set the risk management framework for the Bank. Moreover, the Board of Directors has established the Risk Management and Compliance Committee, formed by the Board members and executive management. Its objective is to monitor and control the various risks (credit risks, operating risks, market risks and compliance risks) or any other risks the Bank might be exposed to.
The Risk Management and Compliance Committee’s tasks are as follows:
1. To supervise the management of the risk policy and ensure that the Risk Management and Compliance Department achieves its objectives according to the approved policies.
2. To ensure appropriate and sufficient support for the Risk Management and Compliance Department in achieving its objectives in accordance with the approved policies and procedures and the Central Bank’s instructions.
3. To ensure the availability of work procedures for risk management in compliance with the various management risk policies at the Bank.
4. To verify the adoption of new methods in managing and evaluating the Bank’s risks such as stress testing, what-if analysis, and economic capital.
5. To determine the bases and principles of managing risks regarding risk acceptance, risk rejection, risk transfer and risk mitigation.
6. To review the periodical reports of the Risk Management and Compliance Department.
7. To ensure that the Bank adheres to the Central Bank of Jordan instructions.
The department manages the Bank’s various risks (credit risk, operating risk, market risk, compliance risk, and other risks) within the general framework of risks management. The role of the department can be summarized as follows:
1. Risk Identification.2. Risk Assessment.3. Risk Control / Mitigation.4. Risk Monitoring.
Internal Capital Adequacy Assessment Process:According to the instructions of the Central Bank of Jordan – Basel II (second Pillar), and to enable the Bank to efficiently manage the risks it is exposed to, the Bank has to identify the risks matrix through which the acceptable risk (risk appetite) for each type of risk is specified. The amount of these risks will be calculated according to the methodology used in Basel Standard II – i.e. tying risk with capital and specifying the utilized capital against each type
Notes to the consolidtaed financial statem
ents
of risk. Consequently, the higher the risks, the greater the Bank’s need for capital to cover these risks. This methodology will help the Bank in connecting risk appetite with capital, monitoring risk limits to determine the Bank’s risk profile size, and perform amendments to reach the targeted risk appetite.
The Bank has identified the risks to be measured, managed, and controlled as follows:
1. Credit Risk.2. Market Risk.3. Operational Risk.4. Concentration Risk:• Credit Concentration Risk.• Other Concentration Risks
5. Residual Risk:• From adopting credit risk mitigation through the standard method.• From applying the simple indicator method of the operating risk account.• From using the standard method of the market risk account.6. Interest Rate Risk in the Banking Book.7. Liquidity Risk.8. Strategic Risk.9. Reputation Risk.10. Business Cycle.11. Compliance Risk.12. Stress Test.
44. a. Credit RisksCredit risks are defined as the probability of not fully recovering the debt or interest in the specified time causing financial losses to the Bank.
Moreover, credit risk represents the major portion banks are exposed to in general (representing 60% or 70% of the risks banks are exposed to). In recognition of this reality, the Bank has accorded credit risk management great significance through managing credit risks at the portfolio level, economic sector level, group level, or single customer level, taking into consideration the achievement of an appropriate return on the risks the Bank is exposed to.
To achieve this, based on the risk management strategy, the Bank has performed the following:
1. The risk appetite and ceilings are based on credit risk commensurate with the acceptable risk limits adopted by the Board of Directors and Risks and Compliance Department. Risk limits are set for each client, group and economic sector, in order to mitigate the Bank’s exposure to credit risk concentrations.
2. A risk rating system is prepared. It consists of 12 degrees and takes into account all factors leading to increased credit risk for the client. In addition, it helps the Bank to detect the credit risk early on so that it can address and mitigate the risk before it increases. Moreover, the Bank has signed an
Not
es to
the
cons
olid
taed
fina
ncia
l sta
tem
ents

8988agreement with SUNGARD Company for the purchase of an automated system to apply this system.
3. Credit risk is mitigated through credit risk factors (collaterals such as real estate, shares or other) commensurate with the credit risk faced by the Bank to cover any unexpected subsequent events.
4. Proper legal and credit documentation is applied for all conditions associated with the credit facilities.
Notes to the consolidtaed financial statem
ents
20102011
JD JD
1. Credit risk exposure (less the impairment provision and interest in suspense and before guarantees and other risk - mitigating factors):
To cover the above credit risk exposures, the Bank uses the following risk mitigating factors within the conditions of the credit policy set by the Bank: 1. Cash collaterals. 2. Accepted bank letters of guarantee. 3. Real estate mortgages. 4. Listed shares collaterals. 5. Vehicles and equipment mortgages.
34,017,906
79,108,582
3,942,065
34,529,250
54,171,705
236,625,837
23,790,608
891,122
4,546,002
-
143,208,743
4,380
2,944,729
110,350,298
23,968,299
9,167,663
9,329,940
770,597,129
34,864,808
52,851,813
5,442,234
41,672,725
61,029,132
228,489,053
15,455,561
3,627,843
-
161,704,371
-
7,891
3,365,089
113,407,868
26,392,422
6,422,350
50,408,284
805,141,444
On Financial Position Items:
Balances at the Central Bank
Balances at banks and financial institutions
Deposits at banks and financial institutions
Direct credit facilities:
Individuals
Real estate loans
Companies
Large companies
Small and medium institutions
Government and public sector
Bonds, Bills and Debentures:
Financial assets at fair value through profit or loss
Included in available-for-sale financial assets
Financial assets at amortized cost
Financial derivatives instruments
Other assets
Off Financial Position Items:
Letters of guarantee
Letters of credit
Letters of acceptance
Unutilized facility ceilings
Total
December 31,

91902. Credit exposures according to the degree of risk are categorized according to the following table:
* The whole debt balance becomes due when one of the installments or interest is due. Moreover, the overdraft account becomes due whenever it exceeds the ceiling.
LargeCompanies
Individuals Banks
and OtherFinancial
Institutions
Total Real EstateLoans
Small andMedium
Companies
Government andPublic Sector
Low risk
Acceptable risk
Of which is due:*
within 30 days
from 31 to 60 days
Under watch
Non-performing:
Below level
Allowance provided
Bad debt
Total
Less: Impairment provision
Less: Interest in suspense
Net
December 31, 2010
December 31, 2011
1,005,963
30,969,426
102,965
74,896
2,594,929
542,185
1,370,171
6,321,236
42,803,910
7,107,452
1,167,208
34,529,250
JD JD JD JD JD JD
JD
JD
-
27,783,117
15,259
235,092
20,443,048
374,890
1,055,898
11,225,549
60,882,502
5,541,174
1,169,623
54,171,705
3,526,981
194,507,493
5,776,837
1,121,151
48,195,834
137,633
5,403,667
18,680,422
270,452,030
12,349,467
1,934,111
256,168,452
1,401,223
19,599,507
33,659
78,562
4,424,840
196,056
920,391
4,548,513
31,090,530
6,317,682
982,240
23,790,608
166,070,267
-
-
-
-
-
-
-
166,070,267
-
-
166,070,267
-
83,050,647
-
-
-
-
-
-
83,050,647
-
-
83,050,647
172,004,434
355,910,190
5,928,720
1,509,701
75,658,651
1,250,764
8,750,127
40,775,720
654,349,886
31,315,775
5,253,182
617,780,929
Low risk
Acceptable risk
Of which is due:*
within 30 days
from 31 to 60 days
Under watch
Non-performing:
Below level
Allowance provided
Bad debt
Total
Less: Impairment provision
Less: Interest in suspense
Net
715,824
34,819,669
31,451
76,134
2,227,604
3,615,747
827,759
6,233,414
48,440,017
4,759,241
786,762
42,894,014
JD JD JD JD JDJD
-
44,374,837
87,191
65,131
15,426,171
714,511
312,313
2,313,461
63,141,293
1,823,147
289,014
61,029,132
5,472,070
134,222,984
388,322
151,421
46,856,018
7,002,741
1,340,424
10,202,063
205,096,300
8,316,717
959,500
195,820,083
706,028
66,201,941
101,918
20,917
1,385,258
-
158,685
8,713,526
77,165,438
5,691,334
915,899
70,558,205
145,050,231
-
-
-
-
-
-
-
145,050,231
-
-
145,050,231
89,949,307
3,209,548
-
-
-
-
-
-
93,158,855
-
-
93,158,855
241,893,460
282,828,979
608,882
313,603
65,895,051
11,332,999
2,639,181
27,462,464
632,052,134
20,590,439
2,951,175
608,510,520
The following table breaks down the fair value of collaterals held as security for credit facilities:
LargeCompanies
Individuals 2011 Banks
and OtherFinancial
Institutions
Real EstateLoans
Small andMedium
Companies
Government andPublic Sector
Gurantees against:
Low risk
Acceptable risk
Under watch
Non-performing:
Below level
Allowance provided
Bad debt
Total
Of it:
Cash margins
Accepted letters of guarantee
Real estate
Trade stocks
Vehicles and equipment
Total
2010
Gurantees against:
Low risk
Acceptable risk
Under watch
Non-performing:
Below level
Allowance provided
Bad debt
Total
Of it:
Cash margins
Accepted letters of guarantee
Trade stocks
Real estate
Vehicles and equipment
Total
1,005,963
14,526,966
1,692,979
75,896
1,789,652
2,011,589
21,103,045
1,005,963
-
11,337,987
3,906,400
4,852,695
21,103,045
715,824
30,683,860
1,692,979
2,830,179
625,747
3,984,310
40,532,899
715,824
-
17,401,193
12,760,831
9,655,051
40,532,899
JD JD JD JD JDJD
-
41,647,111
12,649,460
489,667
853,694
1,523,647
57,163,579
-
-
57,163,579
-
-
57,163,579
-
41,647,111
12,649,460
533,689
236,094
1,714,611
56,780,965
-
-
-
56,780,965
-
56,780,965
3,526,981
86,125,368
31,596,547
516,847
2,563,964
11,027,741
135,357,448
3,526,981
-
125,768,456
4,365,425
1,696,586
135,357,448
5,472,070
96,120,882
40,703,123
5,725,400
875,427
6,856,539
155,753,441
5,472,070
-
8,039,510
128,494,732
13,747,129
155,753,441
1,401,223
5,633,258
862,547
-
633,389
8,255,636
16,786,053
1,401,223
-
14,399,469
-
985,361
16,786,053
706,028
53,318,396
1,122,059
-
119,958
6,457,988
61,724,429
706,028
-
-
53,622,395
7,396,006
61,724,429
-
-
-
-
-
-
-
-
-
-
-
-
-
-
-
-
-
-
-
-
-
-
-
-
-
-
5,934,167
147,932,703
46,801,533
1,082,410
5,840,699
22,818,613
230,410,125
5,934,167
-
208,669,491
8,271,825
7,534,642
230,410,125
6,893,922
221,770,249
56,167,621
9,089,268
1,857,226
19,013,448
314,791,734
6,893,922
-
25,440,703
251,658,923
30,798,186
314,791,734

9392Scheduled Debts:These debts are debts previously classified as non-performing credit facilities but taken out therefrom according to proper scheduling. They have been classified as “debts under control” and amounted to JD 14,895,919 as of December 31, 2011 (against JD 34,177,132 for the year 2010).
Restructured Debts: Restructuring means rearranging credit facilities installments through increasing their duration, postponing some installments, or increasing the grace period. Restructured debts amounted to JD 17,334,040 as of December 31, 2011 (against JD 28,217,873 for the year 2010).
3. Bonds, Bills, and DebenturesThe following table illustrates the classification of bonds, bills, and debentures according to external rating institutions:
BB
Unclassified
Governmental
S&P 596,921
3,949,081
-
4,546,002
-
12,047,506
131,161,237
143,208,743
596,921
15,996,587
131,161,237
147,754,745
Rating GradeRating
Institution
Within Financial Assets
at Fair Value through
Profit or Loss
Within Financial
Assets at
Amortized Cost
Total
4. Credit Risk Exposure According to Geographical Areas:
Balances at Central B
ank
Balances at banks and financial institutions
Deposits at banks and financial institutions
Credit facilities:
Individuals
Real estate loans
Companies :
Large companies
Small and m
edium institutions
Governm
ent and Public
Sector
Bonds, bills, and debentures:
Financial assets at fair value
Through profit or loss
Financial assets at amortized cost
Financial derivatives instruments
Other assets
Total for the current year
Total for the comparative figures
34,017,906
30,665,219
2,127,000
34,570,024
54,171,705
236,585,063
23,790,608
891,122
618,829
143,208,743
4,380
2,944,729
563,595,328
548,451,935
-808,504
------2,112,429
---2,920,933
4,080,051
-27,116,424
1,241,697
---------28,358,121
44,618,576
-36,298
----------36,298
214,722
-17,177,012
121,827
---------17,298,839
10,314,242
-3,305,125
451,541
-----1,814,744
---5,571,410
379,453
34,017,906
79,108,582
3,942,065
34,570,024
54,171,705
236,585,063
23,790,608
891,122
4,546,002
143,208,743
4,380
2,944,729
617,780,929
608,510,520
ItemInside Jordan
Middle East
CountriesAsia *
EuropeAm
ericaTotal
Other
Countries
* Excluding Middle East Countries
JD JD JD

9594Exposure According to Economic Sector:
Notes to the consolidtaed financial statem
ents
Balances at central banks
Balances at banks and financial
institutions
Deposits at banks and financial
institutions
Credit facilities
Bonds, bills and debentures:
Financial assets at fair value
through profit or loss
Financial assets at amortized cost
Financial derivatives instruments
Other assets
Total for the current year
Total/comparative figures
-79,108,582
3,942,065
50,678,909
4,546,002
12,047,506
4,380
2,944,729
153,272,173
122,815,093
---83,514,156
---83,514,156
55,506,081
---110,798,468
---110,798,468
73,161,009
---56,239,312
---56,239,312
61,029,132
---5,136,606
---5,136,606
6,530,127
---14,193,316
---14,193,316
40,850,333
---28,556,633
---28,556,633
68,703,706
34,017,906
--891,122
-131,161,237
--166,070,265
179,915,039
34,017,906
79,108,582
3,942,065
350,008,522
4,546,002
143,208,743
4,380
2,944,729
617,780,929
608,510,520
ItemFinancial
IndustrialR
eal EstateTrading and
Services
AgriculturalIndividuals
Governm
ent
and Public
Sector
Shares
44. b. Operational RiskOperating risk is defined as “the loss resulting from the failure or inadequacy of the internal procedures, the human factor, and systems, or from external events including legal risks.
Operational risks at banks constitute from 15% to 20% of the risks banks are exposed to. These risks directly or indirectly impact the banks net profits through either decreasing the expected profits or increasing the expected expenses. To manage these risks, the Bank has set up an automatic system for the identification of these risks, determination of the adequacy of the internal control system and procedures, and efficiency of the human element to mitigate these risks, in addition to the identification of operating risks that confronted the Bank or other banks in the past, and consequently, spotting the events causing them. This is to enable the Bank to remedy them and to benefit from the mistakes causing these risks. In this regard, the Bank has implemented the following:
•Control & Risk Self Assessment (CRSA).•Key Risk Indicator (KRI).•Key Risk Driver (KRD).
Compliance Risk This represents the risks that arise from the probability that the Bank may not comply with (violate / transgress) the prevailing laws, regulations, instructions, banks laws, and code of ethics issued by international and local regulatory authorities.
Compliance with the regulations and prevailing laws issued by the regulatory authorities represents one of the most important risks which the Bank might be exposed to, due to the major financial losses resulting from the violation of the laws and instructions that affect the Bank›s reputation. Moreover, the past few years witnessed many new regulations, instructions and laws organizing the work of the various institutions. Accordingly, the need for managing the compliance risk of the Bank is necessary. Moreover, compliance enhances the efficiency of managing risks and decreases the risk the Bank might be exposed to as a result of noncompliance with the prevailing laws and instructions.
44.c Market RiskMarket risk is the potential losses that may arise from the changes in market prices such as the change in interest rates, foreign currency exchange rates, and prices of shares and products.
The Board of Directors has set limits for the acceptable risk levels for managing the financial portfolio market risks. Moreover, the Bank periodically applies the appropriate methodology to evaluate market risks and sets estimates for the probable economic losses based on a set of assumptions and changes in market conditions. The following are the methods used by the Bank to measure market risks:
Not
es to
the
cons
olid
taed
fina
ncia
l sta
tem
ents
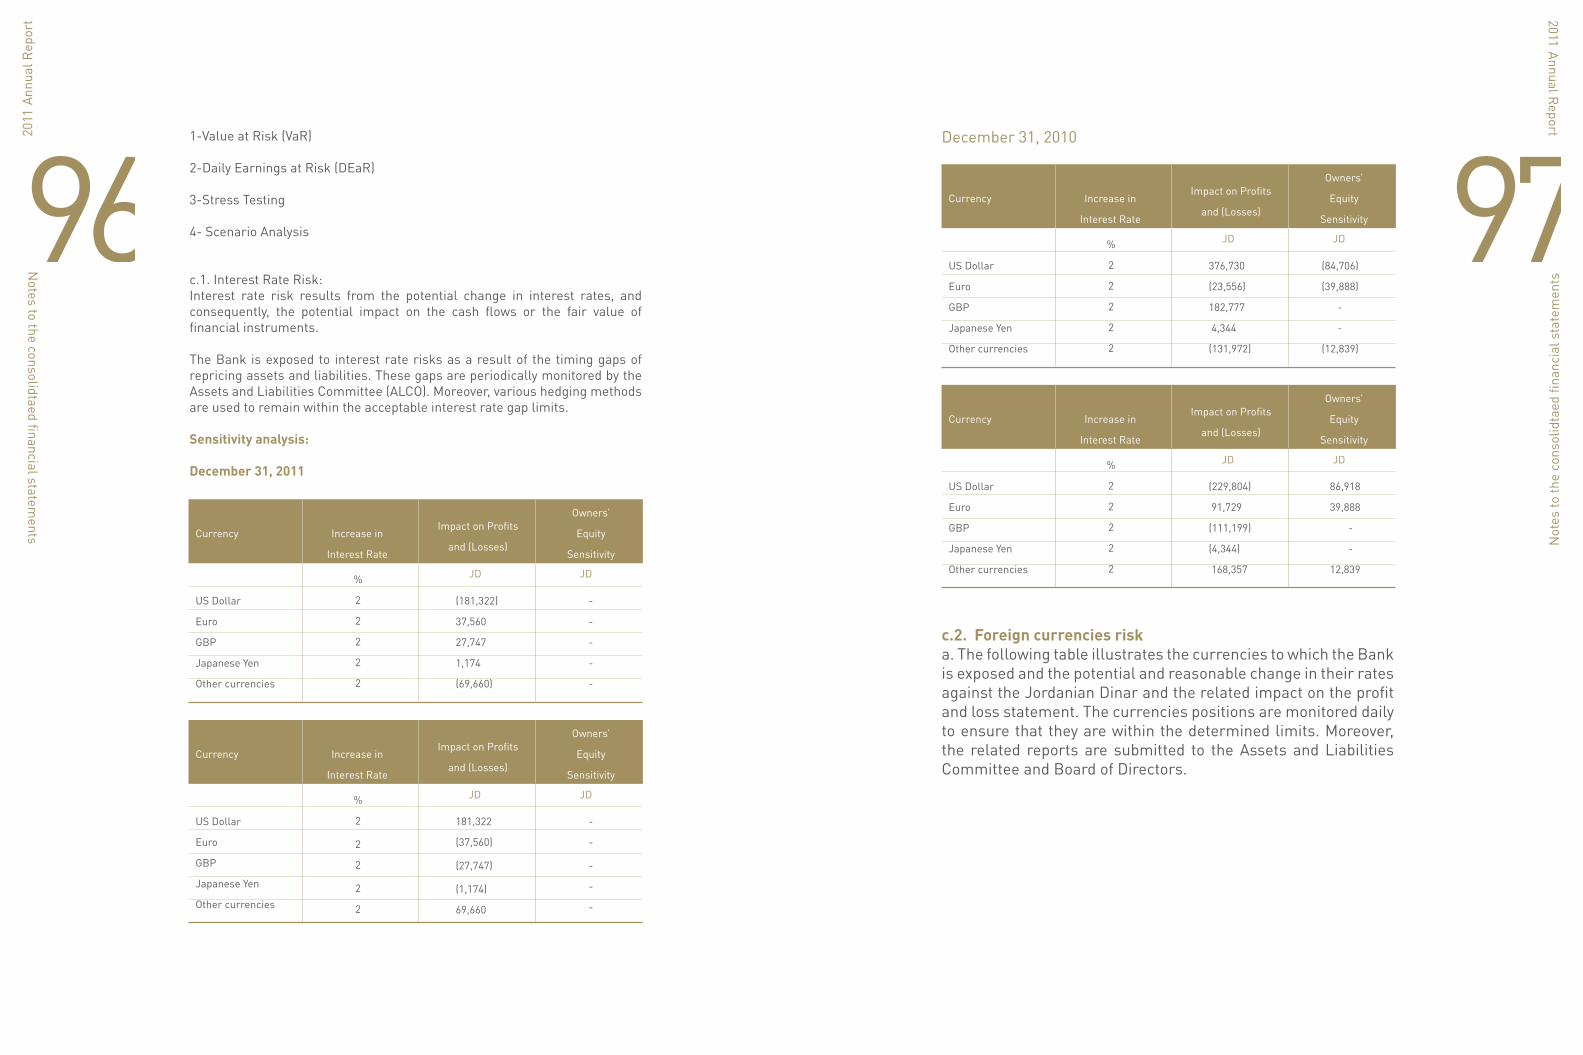
97961-Value at Risk (VaR)
2-Daily Earnings at Risk (DEaR)
3-Stress Testing
4- Scenario Analysis
c.1. Interest Rate Risk: Interest rate risk results from the potential change in interest rates, and consequently, the potential impact on the cash flows or the fair value of financial instruments.
The Bank is exposed to interest rate risks as a result of the timing gaps of repricing assets and liabilities. These gaps are periodically monitored by the Assets and Liabilities Committee (ALCO). Moreover, various hedging methods are used to remain within the acceptable interest rate gap limits.
Sensitivity analysis:
December 31, 2011
Notes to the consolidtaed financial statem
ents
US Dollar
Euro
GBP
Japanese Yen
Other currencies
US Dollar
Euro
GBP
Japanese Yen
Other currencies
%
2
2
2
2
2
%
2
2
2
2
2
(181,322)
37,560
27,747
1,174
(69,660)
181,322
(37,560)
(27,747)
(1,174)
69,660
JD JD
JDJD
-
-
-
-
-
-
-
-
-
-
Currency
Currency
Increase in
Interest Rate
Increase in
Interest Rate
Impact on Profits
and (Losses)
Impact on Profits
and (Losses)
Owners’
Equity
Sensitivity
Owners’
Equity
Sensitivity
December 31, 2010
c.2. Foreign currencies riska. The following table illustrates the currencies to which the Bank is exposed and the potential and reasonable change in their rates against the Jordanian Dinar and the related impact on the profit and loss statement. The currencies positions are monitored daily to ensure that they are within the determined limits. Moreover, the related reports are submitted to the Assets and Liabilities Committee and Board of Directors.
Not
es to
the
cons
olid
taed
fina
ncia
l sta
tem
ents
US Dollar
Euro
GBP
Japanese Yen
Other currencies
US Dollar
Euro
GBP
Japanese Yen
Other currencies
%
2
2
2
2
2
%
2
2
2
2
2
376,730
(23,556)
182,777
4,344
(131,972)
(229,804)
91,729
(111,199)
(4,344)
168,357
JD JD
JDJD
(84,706)
(39,888)
-
-
(12,839)
86,918
39,888
-
-
12,839
Currency
Currency
Increase in
Interest Rate
Increase in
Interest Rate
Impact on Profits
and (Losses)
Impact on Profits
and (Losses)
Owners’
Equity
Sensitivity
Owners’
Equity
Sensitivity
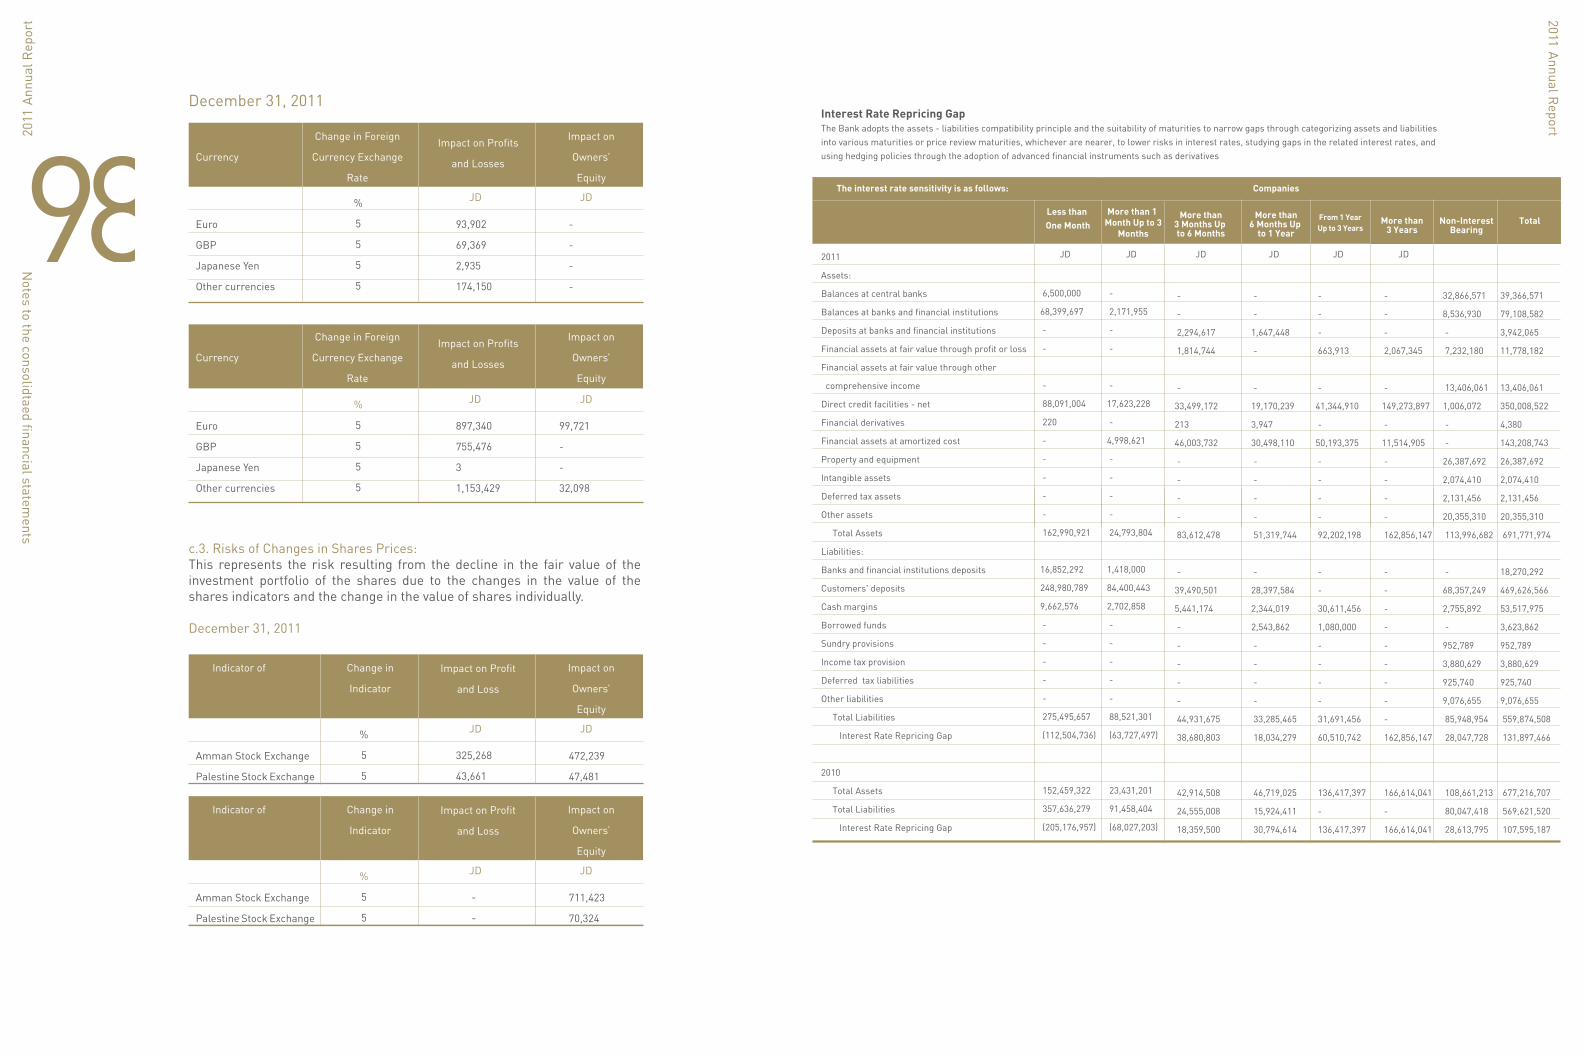
98December 31, 2011
c.3. Risks of Changes in Shares Prices:This represents the risk resulting from the decline in the fair value of the investment portfolio of the shares due to the changes in the value of the shares indicators and the change in the value of shares individually.
December 31, 2011
Notes to the consolidtaed financial statem
ents
Euro
GBP
Japanese Yen
Other currencies
Amman Stock Exchange
Palestine Stock Exchange
Amman Stock Exchange
Palestine Stock Exchange
Euro
GBP
Japanese Yen
Other currencies
%
5
5
5
5
%
5
5
%
5
5
%
5
5
5
5
93,902
69,369
2,935
174,150
325,268
43,661
-
-
897,340
755,476
3
1,153,429
JD JD
JD
JD
JD
JD
JD
JD
-
-
-
-
472,239
47,481
711,423
70,324
99,721
-
-
32,098
Currency
Indicator of
Indicator of
Currency
Change in Foreign
Currency Exchange
Rate
Change in
Indicator
Change in
Indicator
Change in Foreign
Currency Exchange
Rate
Impact on Profits
and Losses
Impact on Profit
and Loss
Impact on Profit
and Loss
Impact on Profits
and Losses
Impact on
Owners’
Equity
Impact on
Owners’
Equity
Impact on
Owners’
Equity
Impact on
Owners’
Equity
More than 3 Months Up to 6 Months
Less than One Month More than
3 Years Non-Interest
Bearing Total
More than 1 Month Up to 3
Months
More than 6 Months Up
to 1 Year
Companies
From 1 Year Up to 3 Years
2011
Assets:
Balances at central banks
Balances at banks and financial institutions
Deposits at banks and financial institutions
Financial assets at fair value through profit or loss
Financial assets at fair value through other
comprehensive income
Direct credit facilities - net
Financial derivatives
Financial assets at amortized cost
Property and equipment
Intangible assets
Deferred tax assets
Other assets
Total Assets
Liabilities:
Banks and financial institutions deposits
Customers' deposits
Cash margins
Borrowed funds
Sundry provisions
Income tax provision
Deferred tax liabilities
Other liabilities
Total Liabilities
Interest Rate Repricing Gap
2010
Total Assets
Total Liabilities
Interest Rate Repricing Gap
The interest rate sensitivity is as follows:
6,500,000
68,399,697
-
-
-
88,091,004
220
-
-
-
-
-
162,990,921
16,852,292
248,980,789
9,662,576
-
-
-
-
-
275,495,657
(112,504,736)
152,459,322
357,636,279
(205,176,957)
JD JD JD JD JDJD
-
2,171,955
-
-
-
17,623,228
-
4,998,621
-
-
-
-
24,793,804
1,418,000
84,400,443
2,702,858
-
-
-
-
-
88,521,301
(63,727,497)
23,431,201
91,458,404
(68,027,203)
-
-
2,294,617
1,814,744
-
33,499,172
213
46,003,732
-
-
-
-
83,612,478
-
39,490,501
5,441,174
-
-
-
-
-
44,931,675
38,680,803
42,914,508
24,555,008
18,359,500
-
-
1,647,448
-
-
19,170,239
3,947
30,498,110
-
-
-
-
51,319,744
-
28,397,584
2,344,019
2,543,862
-
-
-
-
33,285,465
18,034,279
46,719,025
15,924,411
30,794,614
-
-
-
663,913
-
41,344,910
-
50,193,375
-
-
-
-
92,202,198
-
-
30,611,456
1,080,000
-
-
-
-
31,691,456
60,510,742
136,417,397
-
136,417,397
-
-
-
2,067,345
-
149,273,897
-
11,514,905
-
-
-
-
162,856,147
-
-
-
-
-
-
-
-
-
162,856,147
166,614,041
-
166,614,041
32,866,571
8,536,930
-
7,232,180
13,406,061
1,006,072
-
-
26,387,692
2,074,410
2,131,456
20,355,310
113,996,682
-
68,357,249
2,755,892
-
952,789
3,880,629
925,740
9,076,655
85,948,954
28,047,728
108,661,213
80,047,418
28,613,795
39,366,571
79,108,582
3,942,065
11,778,182
13,406,061
350,008,522
4,380
143,208,743
26,387,692
2,074,410
2,131,456
20,355,310
691,771,974
18,270,292
469,626,566
53,517,975
3,623,862
952,789
3,880,629
925,740
9,076,655
559,874,508
131,897,466
677,216,707
569,621,520
107,595,187
Interest Rate Repricing GapThe Bank adopts the assets - liabilities compatibility principle and the suitability of maturities to narrow gaps through categorizing assets and liabilities into various maturities or price review maturities, whichever are nearer, to lower risks in interest rates, studying gaps in the related interest rates, and using hedging policies through the adoption of advanced financial instruments such as derivatives

101100Concentration in foreign currencies risk:
SterlingPound
US Dollar Total Euro Japanese Yen
Currency (Equivalent in Jordanian Dinars)
Others
Assets:
Cash and balances at the Central Bank
Balances at banks and financial institutions
Deposits at banks and financial institutions
Financial assets at fair value through profit or loss
Financial assets at fair value through other
comprehensive income
Direct credit facilities
Other assets
Total Assets
Liabilities:
Banks and financial institutions deposits
Customers' deposits
Cash margins
Other liabilities
Total Liabilities
Net Concentration on-Financial Position
for the Current Year
Off-Financial Position Contingent Liabilities
for the Current Year
2010
Assets:
Cash and balances at the Central Bank
Balances at banks and financial institutions
Deposits at banks and financial institutions
Direct credit facilities
Available-for-sale financial assets
Other assets
Total Assets
Liabilities:
Banks and financial institutions deposits
Customers' deposits
Cash margins
Other liabilities
Total Liabilities
Net Concentration on-Balance Sheet
for the Current Year
Off-balance Sheet Contingent Liabilities
for the Current Year
2011
8,147,385
43,353,370
3,189,570
2,874,076
1,054,044
24,382,203
735,589
83,736,237
2,717,786
63,066,803
26,994,906
22,836
92,802,331
(9,066,094)
123,783,702
9,219,313
30,855,850
5,442,234
22,501,451
4,235,286
142,486
72,396,620
8,669,664
29,385,058
9,470,184
114
47,525,020
24,871,600
24,739,685
JD JD JD JD JDJD
494,186
8,016,061
183,307
1,814,744
-
5,431,332
100,754
16,040,384
274,200
13,300,790
585,483
1,878
14,162,351
1,878,033
30,691,157
927,773
8,270,113
-
4,201,793
1,994,424
91,404
15,485,507
3,639,268
13,634,581
2,666,728
654
19,941,231
(4,455,724)
10,016,507
185,318
7,902,401
569,189
-
-
59
22,219
8,679,186
15,013
7,203,333
68,964
4,491
7,291,801
1,387,385
219,750
528,698
12,847,330
-
7,868
-
8,159
13,392,055
526,161
14,315,783
264,095
3,471
15,109,510
(1,717,455)
175,404
-
59,930
-
-
-
-
-
59,930
111
1,122
-
-
1,233
58,697
-
-
217,267
-
-
-
-
217,267
69
-
-
-
69
217,198
-
68,232
396,143
-
1,044,829
-
-
6,923
1,516,127
705,997
4,254,151
22,100
16,881
4,999,129
(3,483,002)
1,733,016
102,727
607,199
-
26
641,951
5,444
1,357,347
196,254
21,277,146
2,224,642
-
23,698,042
(22,340,695)
1,793,853
8,895,121
59,727,905
3,942,066
5,733,649
1,054,044
29,813,594
865,485
110,031,864
3,713,107
87,826,199
27,671,453
46,086
119,256,845
(9,224,981)
156,427,625
10,778,511
52,797,759
5,442,234
26,711,138
6,871,661
247,493
102,848,796
13,031,416
78,612,568
14,625,649
4,239
106,273,872
(3,425,076)
36,725,449
44. d. Liquidity Risk:
More than
6 Months up
to 1 Year
More than 1
Month up to 3 M
onths
Less thanO
ne Month
Total
More than
3 Months up
to 6 Months
From 1 Year
Up to 3 Years
More than
3 Years
2011
Liabilities:
Banks and financial institutions deposits
Customers' deposits
Cash margins
Borrow
ed funds
Sundry provisions
Income tax provision
Deferred tax liabilities
Other liabilities
Total Liabilities
Total Assets
2010
Liabilities:
Banks and financial institutions deposits
Customers' deposits
Cash margins
Borrow
ed funds
Sundry provisions
Income tax provision
Deferred tax liabilities
Other liabilities
Total Liabilities
Total Assets
16,852,292
317,338,037
4,312,982
-
-
3,880,629
-
1,895,211
344,279,151
200,051,829
50,114,460
329,415,694
3,272,553
-
-
5,430,588
-
5,091,713
393,325,008
200,971,764
JDJD
JDJD
JDJD
JDJD
1,418,000
84,400,443
5,417,148
---925,740
1,510,264
93,671,595
24,793,804
4,500,000
82,239,836
3,859,195
4,718,568
--1,556,035
2,746,393
99,620,027
23,431,201
-
39,490,502
4,352,352
-
-
-
-
1,833,867
45,676,721
83,612,478
-
24,337,743
3,100,631
217,265
-
-
-
1,344,810
29,000,449
44,448,185
-28,397,584
3,430,285
2,543,862
---3,837,313
38,209,044
51,319,744
-13,302,600
2,443,746
2,621,811
---1,316,857
19,685,014
47,780,277
-
-
36,005,208
1,080,000
-
-
-
-
37,085,208
92,202,198
-
-
25,650,233
-
-
-
-
-
25,650,233
152,075,122
---------162,856,147
---------171,885,098
-
-
-
-
952,789
-
-
-
952,789
76,935,774
-
-
-
-
2,340,789
-
-
-
2,340,789
36,625,060
18,270,292
469,626,566
53,517,975
3,623,862
952,789
3,880,629
925,740
9,076,655
559,874,508
691,771,974
54,614,460
449,295,873
38,326,358
7,557,644
2,340,789
5,430,588
1,556,035
10,499,773
569,621,520
677,216,707
Liquidity risk represents the Bank's inability to meet its obligations on their maturity dates. To ward off these risks, including the manage-ment of Assets and Liabilities, matching and analyzing their maturities, matching the maturities of short and long-term assets and liabilities, diversifying sources of funds, and maintaining an adequate fund of cash and cash equivalents and marketable securities, liquidity is managed and reviewed periodically at different levels. According to the Central Bank of Jordan instructions, the Bank maintains cash reserves to mitigate liquidity risks.
Non-Interest B
earing First : The following table illustrates the distribution of liabilities (undiscounted) on the basis of the remaining period to the contractual maturity at the date of the financial statements.

103102
Notes to the consolidtaed financial statem
ents
Second: Financial DerivativesThe following table summarizes the maturities of financial derivatives on the basis of the remaining period to the contractual maturity date from the date of the consolidated financial statements:
- The movement on deferred tax assets / liabilities was as follows:
Third: Off-statement of financial position items:
From3 Months
to one Year
Up toOne Month
From OneMonth to3 Months Total
2011
Trading derivatives:
Currency derivatives
2010
Trading derivatives:
Currency derivatives
220
709
JDJD JD
-
-
4,160
7,182
JD
4,380
7,891
From3 Months
to one Year
Up toOne Month
From OneMonth to3 Months Total
33,135,962
9,329,940
110,350,298
306,507
277,949
153,400,656
32,814,772
50,408,284
113,407,868
302,290
917,349
197,850,563
JDJD JD JD
-
-
-
-
-
-
-
-
-
-
-
-
-
-
-
-
-
-
-
-
-
-
-
-
33,135,962
9,329,940
110,350,298
306,507
277,949
153,400,656
32,814,772
50,408,284
113,407,868
302,290
917,349
197,850,563
2011
Letters of credit and acceptances
Unutilized credits
Guarantees
Operating lease contract liabilities
Capital liabilities
Total
2010
Letters of credit and acceptances
Unutilized credits
Guarantees
Operating lease contract liabilities
Capital liabilities
Total
45. Sector Analysisa.Information on the bank sectors operation- The Bank is organized, for managerial purposes, into three major sectors. Moreover, the Bank owns three subsidiaries: one conducts financial brokerage, the other financial lease, and the third bonded stores operation and management.
- Individuals accounts: include following up on individual clients accounts, and granting them loans, credit, credit cards, and other services.
- Corporate accounts: include following up on deposits, credit facilities, and other banking services related to clients.
- Treasury: includes providing dealing services and management of the Bank’s funds.

105
104Financial
Brokerage
Corporations
Individuals
Total
For the Year Ended Decem
ber 31,
2011
2010
Treasury FinancialLeasing
Bonded
Managem
ent
Gross incom
e
Provision for credit facilities
Sundry provisions
Results of B
usiness Sector
Less: Undistributed Expenditures
Income before Taxes
Less: Income tax
Income for the Year
Sector's Assets
Assets not distributed over sectors
Total Assets
Sector's Liabilities
Liabilities not distributed over sectors
Total Liabilities
Capital Expenditures
Depreciation and am
ortization
4,501,703
(1,486,055)
-
3,015,648
-
3,015,648
-
3,015,648
53,662,901
-
53,662,901
261,276,103
-
261,276,103
-
-
JDJD
JDJD
JDJD
JDJD
15,779,817
(8,956,898)
-
6,822,919
-
6,822,919
-
6,822,919
275,405,608
-
275,405,608
208,350,465
-
208,350,465
-
-
12,475,704
-
-
12,475,704
-
12,475,704
-
12,475,704
285,458,436
-
285,458,436
18,270,292
-
18,270,292
-
-
1,836,333
(726,964)
-
1,109,369
346,309
763,060
(9,797)
772,857
11,681,132
-
11,681,132
983,267
-
983,267
2,714
9,056
251,832
-
-
251,832
318,859
(67,027)
-
(67,027)
5,420,688
-
5,420,688
2,340,494
2,340,494
98,590
9,453
800,740
1,710
-
802,450
531,636
270,814
20,469
250,345
4,930,084
-
4,930,084
1,870,487
-
1,870,487
75,297
25,636
846,162
-
1,388,000
2,234,162
11,865,313
(9,631,151)
4,043,742
(13,674,893)
-
55,213,125
55,213,125
-
66,783,400
66,783,400
3,247,244
1,526,665
36,492,291
(11,168,207)
1,388,000
26,712,084
13,062,117
13,649,967
4,054,414
9,595,553
636,558,849
55,213,125
691,771,974
493,091,108
66,783,400
559,874,508
3,423,845
1,570,810
34,889,370
(6,708,420)
(152,554)
28,028,396
12,159,161
15,869,235
4,982,124
10,887,111
636,014,966
41,201,741
677,216,707
551,350,370
18,271,150
569,621,520
9,563,650
1,138,335
The following table represents inform
ation on the Bank's sectors according to activities:
b. Information on the geographical allocation:
This sector represents the geographical distribution of the Bank's operations. The B
ank performs its operations m
ainly in the Kingdom
, and these operations represent the local operations.The following is the
geographical distribution of the bank's revenues, assets and capital expenses according to geographical distribution:
Others
Inside Jordan
2011
2010
Outside Jordan
2011
2010
Total
2011
2010
Total Revenue
Total Assets
Capital Expenditures
53,896,780
691,771,974
3,423,845
JDJD
JDJD
JDJD
52,200,788
677,216,707
9,563,650
-
-
-
-
-
-
53,896,780
691,771,974
3,423,845
52,200,788
677,216,707
9,563,650
46. Capital Management
a.Description of CapitalAccording to the Central Bank of Jordan Law and in compliance with the capital adequacy requirements, capital consists of many parts:
•Primary capital made up of paid-up capital, declared reserves, (including statutory reserve, voluntary reserve, share premium (discount), treasury share premium, and other reserves), retained earnings, and non-controlling interest (if any) minus intangible assets, loss for the period, acquisition costs of treasury stock, provisions required by the Central Bank of Jordan, full amount of goodwill, and any restricted amounts.
•Supplementary capital provided that the general banking risk reserve does not exceed 1.25% of total credit risk weighted assets, subordinated debts, and the positive cumulative change in fair value at 45%, less the negative change balance provided that this part of capital does not exceed 100% of regulatory capital
•The third part consists of short-term subordinated loans to meet market risks. This part supplements capital and is utilized to face the potential losses from market risks. Additionally, the Bank complies with Article (62) of the Banks Law which requires the Bank to appropriate 10% of its net profits in the Kingdom and continue to do so until the reserve equals the Bank’s paid-up capital.
b.Regulatory Authorities Requirements Concerning Capital and Method of Fulfilling Them
The Bank considers the compatibility of the size of capital with the nature of risks it is exposed to provided that paid-up capital is not less than the minimum required by the Central Bank of Jordan and regulatory capital not less than 12% of the weighted value of credit and operating market risks. Furthermore, the minimum leverage ratio (equity to total assets) should not be less than 6%. Moreover, not less than 28.5% of market risks should be covered by regulatory capital.
c. How to Achieve the Objectives of Capital Management
The Bank’s management aims at achieving the Bank’s capital management objectives, a surplus in operating income and revenues, and the optimal utilization of the available sources of funds so as to reach the targeted growth in shareholders’ equity through the increase in the statutory reserve, recognized profits, voluntary reserve, and retained earnings.
Capital is allocated to work lines and various functions according to assets weighted by risks. Moreover, capital and its adequacy are monitored periodically, and capital adequacy is calculated by the Risk Management and Compliance Department and reviewed by the internal auditor.

107106The capital adequacy ratio for the years 2011 and 2010 has been calculated according to Basel II Standard, in addition to the instructions of the Central Bank of Jordan
d.Reasons for and sources of change in the Bank’s regulatory capital during the year: Increase in regulatory capital amounted to JD 8,215,232 from the following sources:
- Increase in capital of JD 7,500,000.- Increase in payments on capital increase of JD 14,116,574.- Increase in the statutory reserve of JD 1,378,483.- Decrease in retained earnings of JD 6,233,035.- Decrease in the general banking risks reserve of JD 31,183. - Decrease in the cumulative change in fair value for available-for- sale assets of JD 1,167,993.- Increase in the deferred tax assets and intangible assets of JD 620,468.- Increase in investments in banks and insurance companies of JD 6,977,147.
Not
es to
the
cons
olid
taed
fina
ncia
l sta
tem
ents
20102011
JD JD
e. The amount the Bank considers as capital and capital adequacy ratio are as follows:
47. Accounts Managed on Behalf of CustomersThere are no investment portfolios managed by the Bank on behalf of customers.
85,250,000
14,116,574
14,710,442
3,513,576
(4,205,866)
(7,029,539)
106,355,187
77,500,000
-
13,331,959
9,746,611
(3,585,398)
(1,849,501)
95,143,671
465,844
-
3,180,766
(3,646,610)
-
106,355,187
589,763,583
18.03%
18.03%
-
1,633,837
3,211,949
(1,849,501)
2,996,285
98,139,955
589,820,654
16.64%
16.13%
Subscribed and paid-up capital
Payments on capital increase
Statutory reserve
Retained (earnings) losses net of restricted amounts
Goodwill or any intangibles and deferred tax assets
Investments deducted from capital by 50%
Primary Capital
Fair value reserve as per IFRS (9)
The effect of application of IAS 39 and
cumulative change in fair value
General banking risks reserve
Investments deducted from capital by 50%
Additional Paid-up Capital
Total Capital Structure
Total risk weighted assets
Capital Adequacy Ratio (%)
Primary Capital Ratio (%)
December 31,
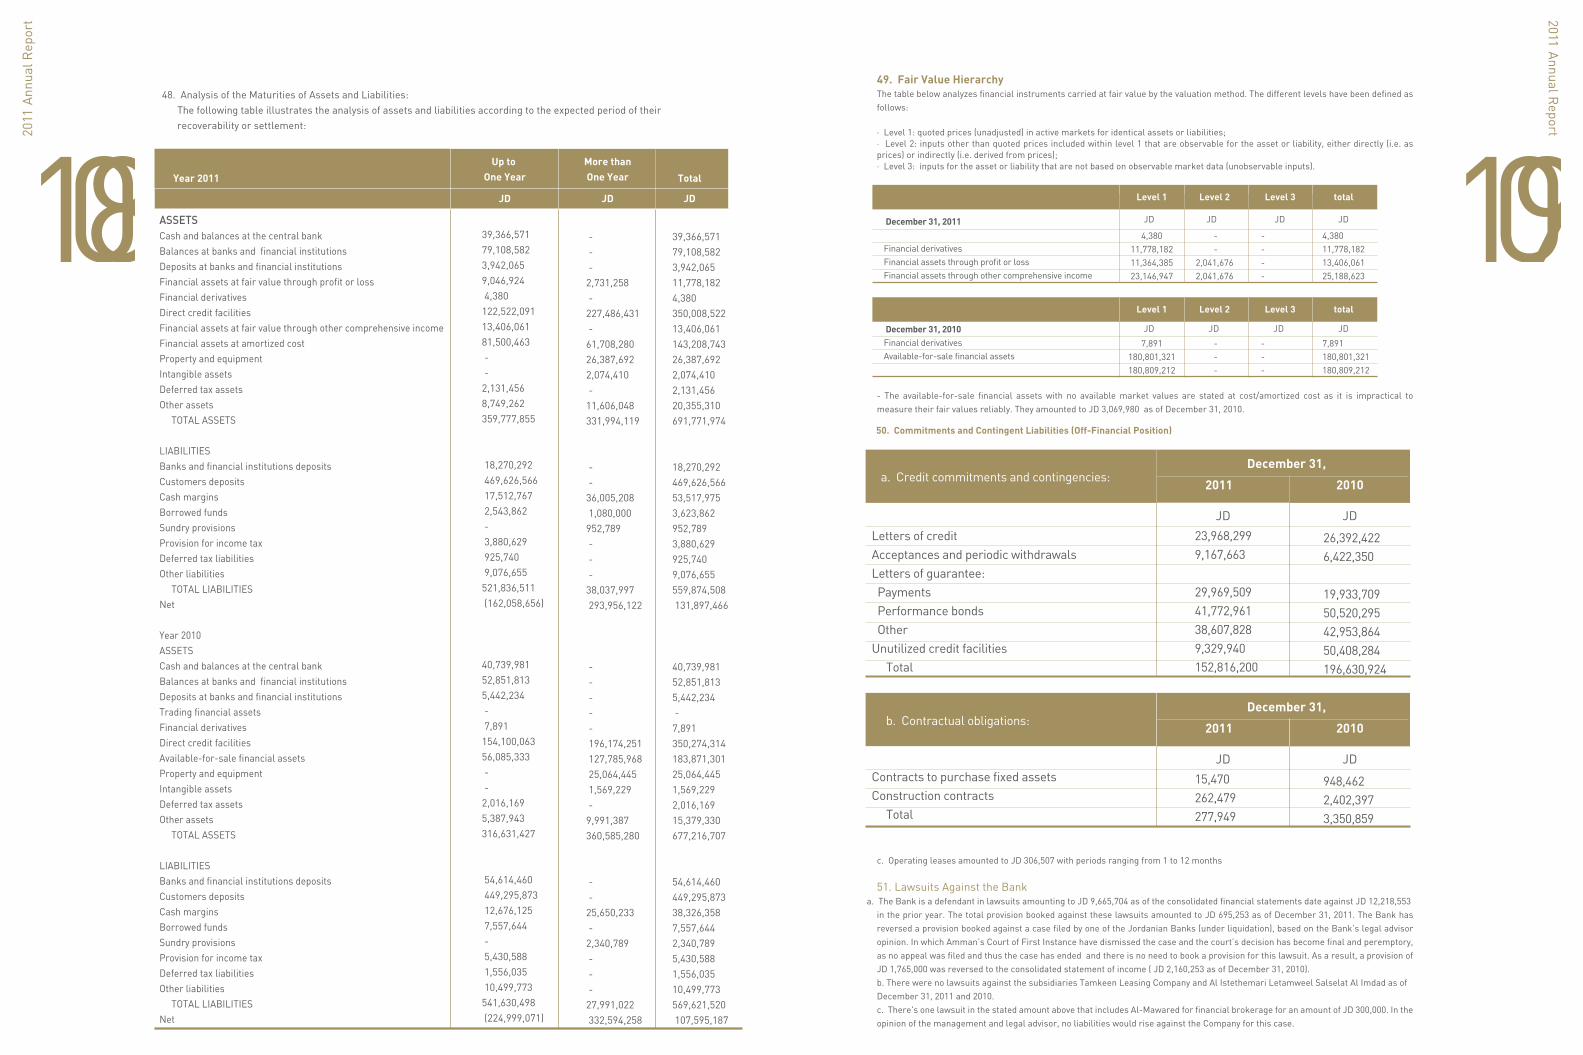
10910848. Analysis of the Maturities of Assets and Liabilities: The following table illustrates the analysis of assets and liabilities according to the expected period of their recoverability or settlement:
Up to One YearYear 2011
More than One Year Total
JD JD JD
ASSETSCash and balances at the central bankBalances at banks and financial institutionsDeposits at banks and financial institutionsFinancial assets at fair value through profit or lossFinancial derivativesDirect credit facilitiesFinancial assets at fair value through other comprehensive incomeFinancial assets at amortized costProperty and equipment Intangible assetsDeferred tax assetsOther assets TOTAL ASSETS
LIABILITIESBanks and financial institutions deposits Customers depositsCash marginsBorrowed fundsSundry provisionsProvision for income taxDeferred tax liabilitiesOther liabilities TOTAL LIABILITIESNet
Year 2010ASSETSCash and balances at the central bankBalances at banks and financial institutionsDeposits at banks and financial institutionsTrading financial assetsFinancial derivativesDirect credit facilitiesAvailable-for-sale financial assetsProperty and equipment Intangible assetsDeferred tax assetsOther assets TOTAL ASSETS
LIABILITIESBanks and financial institutions deposits Customers depositsCash marginsBorrowed fundsSundry provisionsProvision for income taxDeferred tax liabilitiesOther liabilities TOTAL LIABILITIESNet
39,366,57179,108,5823,942,0659,046,924 4,380 122,522,09113,406,06181,500,463 - - 2,131,4568,749,262359,777,855
18,270,292 469,626,566 17,512,767 2,543,862 - 3,880,629 925,740 9,076,655 521,836,511 (162,058,656)
40,739,98152,851,8135,442,234 - 7,891 154,100,06356,085,333 - - 2,016,1695,387,943316,631,427
54,614,460 449,295,873 12,676,125 7,557,644 - 5,430,588 1,556,035 10,499,773 541,630,498 (224,999,071)
- - - 2,731,258 - 227,486,431 - 61,708,28026,387,6922,074,410 - 11,606,048331,994,119
- - 36,005,208 1,080,000 952,789 - - - 38,037,997 293,956,122
- - - - - 196,174,251 127,785,968 25,064,445 1,569,229 - 9,991,387360,585,280
- - 25,650,233 - 2,340,789 - - - 27,991,022 332,594,258
39,366,57179,108,5823,942,06511,778,1824,380350,008,52213,406,061143,208,74326,387,6922,074,4102,131,45620,355,310691,771,974
18,270,292469,626,56653,517,9753,623,862952,7893,880,629925,7409,076,655559,874,508 131,897,466
40,739,98152,851,8135,442,234 - 7,891350,274,314183,871,30125,064,4451,569,2292,016,16915,379,330677,216,707
54,614,460449,295,87338,326,3587,557,6442,340,7895,430,5881,556,03510,499,773569,621,520 107,595,187
JD JD JD JD
JDJDJDJD
Level 1 totalLevel 2 Level 3
Level 1 totalLevel 2 Level 3
December 31, 2011
Financial derivativesFinancial assets through profit or lossFinancial assets through other comprehensive income
December 31, 2010Financial derivativesAvailable-for-sale financial assets
4,38011,778,18211,364,38523,146,947
7,891180,801,321180,809,212
- -
2,041,6762,041,676
- - -
- - - -
- - -
4,38011,778,18213,406,06125,188,623
7,891180,801,321180,809,212
- The available-for-sale financial assets with no available market values are stated at cost/amortized cost as it is impractical to measure their fair values reliably. They amounted to JD 3,069,980 as of December 31, 2010.
c. Operating leases amounted to JD 306,507 with periods ranging from 1 to 12 months
51. Lawsuits Against the Bank a. The Bank is a defendant in lawsuits amounting to JD 9,665,704 as of the consolidated financial statements date against JD 12,218,553
in the prior year. The total provision booked against these lawsuits amounted to JD 695,253 as of December 31, 2011. The Bank has reversed a provision booked against a case filed by one of the Jordanian Banks (under liquidation), based on the Bank’s legal advisor opinion. In which Amman’s Court of First Instance have dismissed the case and the court’s decision has become final and peremptory, as no appeal was filed and thus the case has ended and there is no need to book a provision for this lawsuit. As a result, a provision of JD 1,765,000 was reversed to the consolidated statement of income ( JD 2,160,253 as of December 31, 2010).b. There were no lawsuits against the subsidiaries Tamkeen Leasing Company and Al Istethemari Letamweel Salselat Al Imdad as ofDecember 31, 2011 and 2010. c. There's one lawsuit in the stated amount above that includes Al-Mawared for financial brokerage for an amount of JD 300,000. In the opinion of the management and legal advisor, no liabilities would rise against the Company for this case.
50. Commitments and Contingent Liabilities (Off-Financial Position)
49. Fair Value Hierarchy The table below analyzes financial instruments carried at fair value by the valuation method. The different levels have been defined as follows:
· Level 1: quoted prices (unadjusted) in active markets for identical assets or liabilities;· Level 2: inputs other than quoted prices included within level 1 that are observable for the asset or liability, either directly (i.e. as prices) or indirectly (i.e. derived from prices); · Level 3: inputs for the asset or liability that are not based on observable market data (unobservable inputs).
JD JDLetters of creditAcceptances and periodic withdrawalsLetters of guarantee: Payments Performance bonds OtherUnutilized credit facilities Total
23,968,2999,167,663
29,969,50941,772,96138,607,8289,329,940152,816,200
26,392,4226,422,350
19,933,70950,520,29542,953,86450,408,284196,630,924
2010
December 31,
2011
JD JDContracts to purchase fixed assetsConstruction contracts Total
15,470262,479277,949
948,4622,402,3973,350,859
2010
December 31,
2011
b. Contractual obligations:
a. Credit commitments and contingencies:
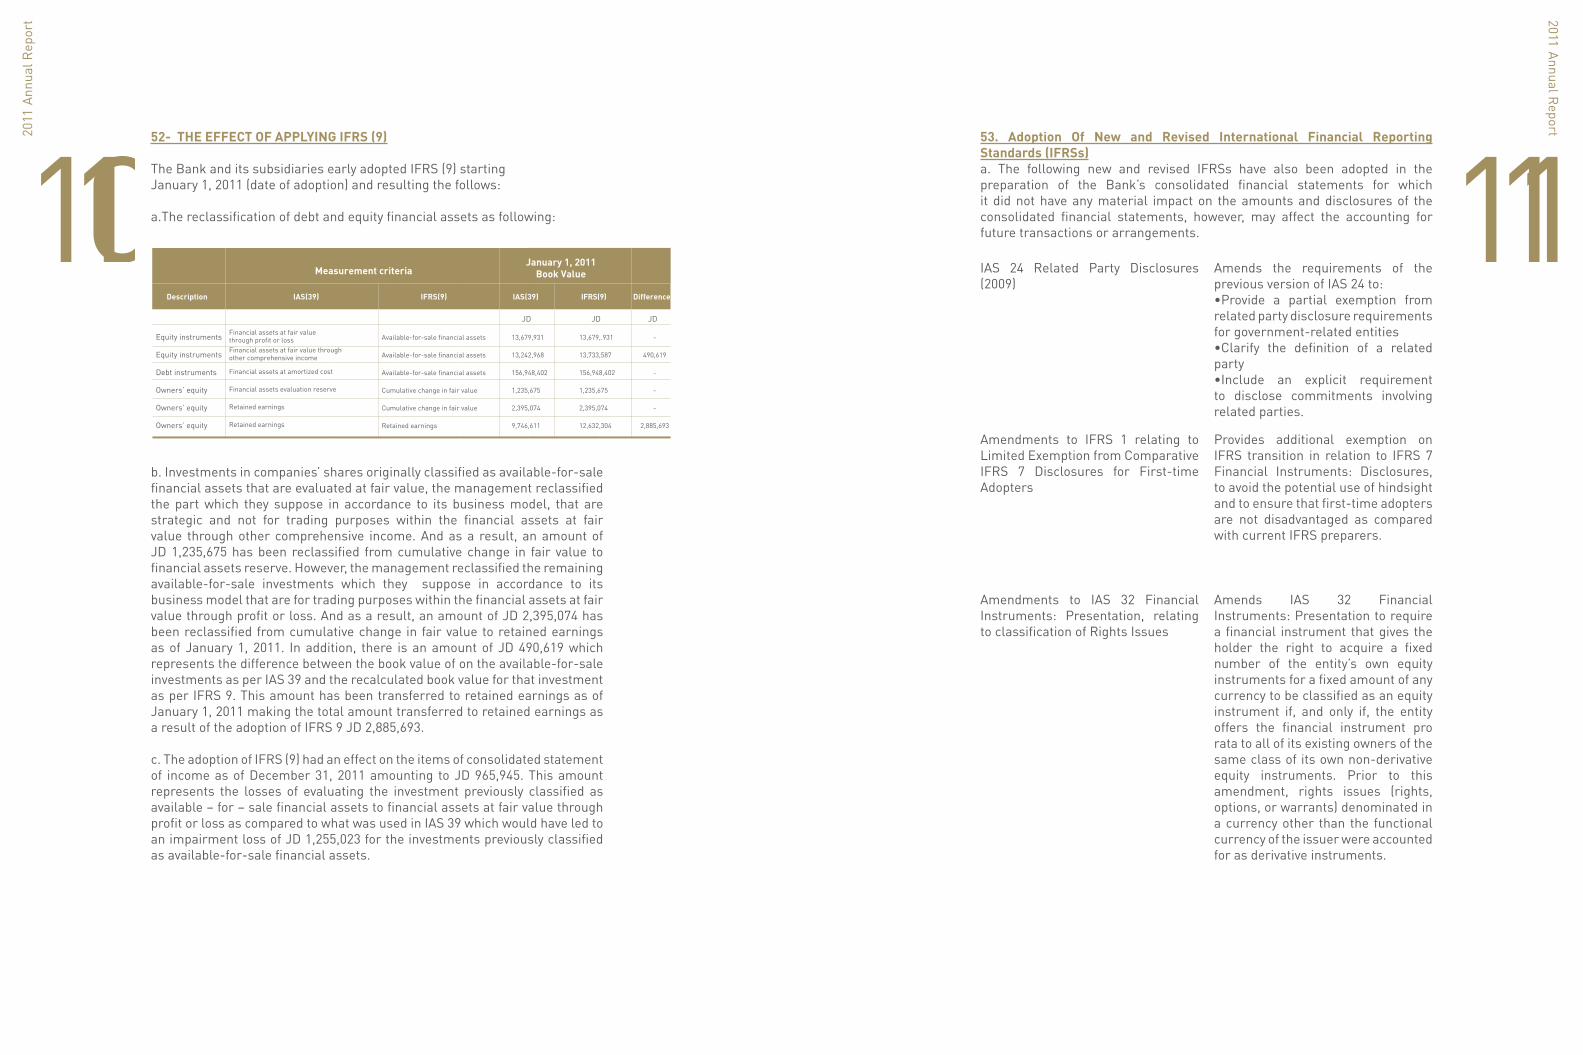
11111052- THE EFFECT OF APPLYING IFRS (9)
The Bank and its subsidiaries early adopted IFRS (9) starting January 1, 2011 (date of adoption) and resulting the follows:
a.The reclassification of debt and equity financial assets as following:
b. Investments in companies’ shares originally classified as available-for-sale financial assets that are evaluated at fair value, the management reclassified the part which they suppose in accordance to its business model, that are strategic and not for trading purposes within the financial assets at fair value through other comprehensive income. And as a result, an amount of JD 1,235,675 has been reclassified from cumulative change in fair value to financial assets reserve. However, the management reclassified the remaining available-for-sale investments which they suppose in accordance to its business model that are for trading purposes within the financial assets at fair value through profit or loss. And as a result, an amount of JD 2,395,074 has been reclassified from cumulative change in fair value to retained earnings as of January 1, 2011. In addition, there is an amount of JD 490,619 which represents the difference between the book value of on the available-for-sale investments as per IAS 39 and the recalculated book value for that investment as per IFRS 9. This amount has been transferred to retained earnings as of January 1, 2011 making the total amount transferred to retained earnings as a result of the adoption of IFRS 9 JD 2,885,693.
c. The adoption of IFRS (9) had an effect on the items of consolidated statement of income as of December 31, 2011 amounting to JD 965,945. This amount represents the losses of evaluating the investment previously classified as available – for – sale financial assets to financial assets at fair value through profit or loss as compared to what was used in IAS 39 which would have led to an impairment loss of JD 1,255,023 for the investments previously classified as available-for-sale financial assets.
Available-for-sale financial assets
Available-for-sale financial assets
Available-for-sale financial assets
Cumulative change in fair value
Cumulative change in fair value
Retained earnings
Financial assets at fair valuethrough profit or lossFinancial assets at fair value throughother comprehensive income
Financial assets at amortized cost
Financial assets evaluation reserve
Retained earnings
Retained earnings
13,679,931
13,242,968
156,948,402
1,235,675
2,395,074
9,746,611
13,679,.931
13,733,587
156,948,402
1,235,675
2,395,074
12,632,304
-
490,619
-
-
-
2,885,693
JD JD JD
IFRS(9) IAS(39) IFRS(9) DifferenceIAS(39)Description
Measurement criteriaJanuary 1, 2011
Book Value
Equity instruments
Equity instruments
Debt instruments
Owners’ equity
Owners’ equity
Owners’ equity
53. Adoption Of New and Revised International Financial Reporting Standards (IFRSs)a. The following new and revised IFRSs have also been adopted in the preparation of the Bank’s consolidated financial statements for which it did not have any material impact on the amounts and disclosures of the consolidated financial statements, however, may affect the accounting for future transactions or arrangements.
IAS 24 Related Party Disclosures (2009)
Amendments to IFRS 1 relating to Limited Exemption from Comparative IFRS 7 Disclosures for First-time Adopters
Amendments to IAS 32 Financial Instruments: Presentation, relating to classification of Rights Issues
Amends the requirements of the previous version of IAS 24 to:•Provide a partial exemption from related party disclosure requirements for government-related entities•Clarify the definition of a related party•Include an explicit requirement to disclose commitments involving related parties.
Provides additional exemption on IFRS transition in relation to IFRS 7 Financial Instruments: Disclosures, to avoid the potential use of hindsight and to ensure that first-time adopters are not disadvantaged as compared with current IFRS preparers.
Amends IAS 32 Financial Instruments: Presentation to require a financial instrument that gives the holder the right to acquire a fixed number of the entity’s own equity instruments for a fixed amount of any currency to be classified as an equity instrument if, and only if, the entity offers the financial instrument pro rata to all of its existing owners of the same class of its own non-derivative equity instruments. Prior to this amendment, rights issues (rights, options, or warrants) denominated in a currency other than the functional currency of the issuer were accounted for as derivative instruments.
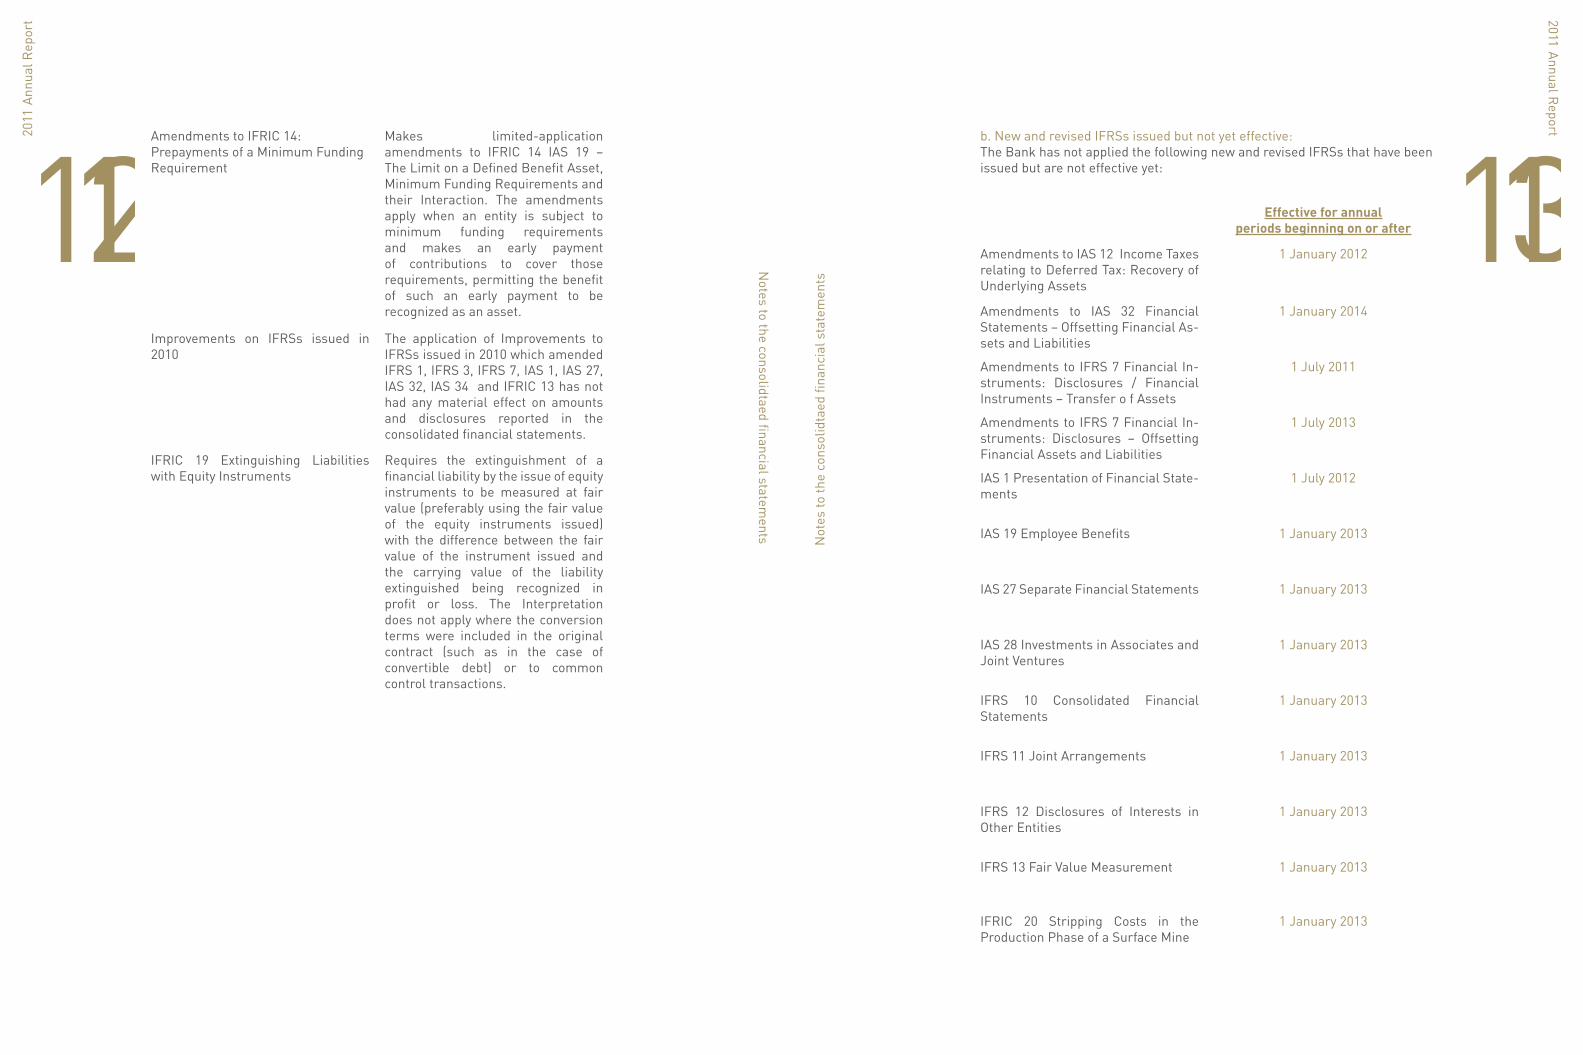
113112
Notes to the consolidtaed financial statem
ents
Amendments to IFRIC 14: Prepayments of a Minimum Funding Requirement
Improvements on IFRSs issued in 2010
IFRIC 19 Extinguishing Liabilities with Equity Instruments
Makes limited-application amendments to IFRIC 14 IAS 19 – The Limit on a Defined Benefit Asset, Minimum Funding Requirements and their Interaction. The amendments apply when an entity is subject to minimum funding requirements and makes an early payment of contributions to cover those requirements, permitting the benefit of such an early payment to be recognized as an asset.
The application of Improvements to IFRSs issued in 2010 which amended IFRS 1, IFRS 3, IFRS 7, IAS 1, IAS 27, IAS 32, IAS 34 and IFRIC 13 has not had any material effect on amounts and disclosures reported in the consolidated financial statements.
Requires the extinguishment of a financial liability by the issue of equity instruments to be measured at fair value (preferably using the fair value of the equity instruments issued) with the difference between the fair value of the instrument issued and the carrying value of the liability extinguished being recognized in profit or loss. The Interpretation does not apply where the conversion terms were included in the original contract (such as in the case of convertible debt) or to common control transactions.
Not
es to
the
cons
olid
taed
fina
ncia
l sta
tem
ents
b. New and revised IFRSs issued but not yet effective:The Bank has not applied the following new and revised IFRSs that have been issued but are not effective yet:
Amendments to IAS 12 Income Taxes relating to Deferred Tax: Recovery of Underlying Assets
Amendments to IAS 32 Financial Statements – Offsetting Financial As-sets and Liabilities
Amendments to IFRS 7 Financial In-struments: Disclosures / Financial Instruments – Transfer o f Assets
Amendments to IFRS 7 Financial In-struments: Disclosures – Offsetting Financial Assets and Liabilities
IAS 1 Presentation of Financial State-ments
IAS 28 Investments in Associates and Joint Ventures
IAS 19 Employee Benefits
IFRS 10 Consolidated Financial Statements
IAS 27 Separate Financial Statements
IFRS 11 Joint Arrangements
IFRS 12 Disclosures of Interests in Other Entities
IFRS 13 Fair Value Measurement
IFRIC 20 Stripping Costs in the Production Phase of a Surface Mine
1 January 2012
Effective for annualperiods beginning on or after
1 January 2014
1 July 2011
1 July 2013
1 July 2012
1 January 2013
1 January 2013
1 January 2013
1 January 2013
1 January 2013
1 January 2013
1 January 2013
1 January 2013

114The Bank’s management anticipate that the adoption of the above Standards and Interpretations in future years will have no material impact on the consolidated financial statements of the Bank in the period of initial application.
54. Subsequent Events- During the subsequent period, the Bank sold fixed assets represented by plots of land and buildings of the old head quarter location for an amount of JD 9.1 million which had a net book value JD 4.8 million on the date of sale to one of the Jordanian Banks.
- In addition, during the subsequent period, capital increase procedures were finalized, and subscribed shared became 11,116,574 shares out of 14,750,000 share that have been put in the private offering according to the securities Depository Center certificate. As a result the subscribed and paid-up capital became JD 99,366,574 per share.
Notes to the consolidtaed financial statem
ents