1.Which event is a direct result of Earth's revolution? C ... · PDF...
43
A) the apparent deflection of winds B) the changing of the Moon phases C) the seasonal changes in constellations viewed in the night sky D) the daily rising and setting of the Sun 1. Which event is a direct result of Earth's revolution? Base your answers to questions 2 and 3 on the diagram below, which shows the angle of the Sun’s noontime rays received at different Earth latitudes on May 1. A) The duration of insolation will decrease and the temperature will decrease. B) The duration of insolation will decrease and the temperature will increase. C) The duration of insolation will increase and the temperature will decrease. D) The duration of insolation will increase and the temperature will increase. 2. Which changes can be expected to occur at 45° N over the next 30 days? A) 0° B) 30° N C) 60° N D) 90° N 3. At which latitude can the noontime Sun be observed in the northern part of the sky? A) Earth is closer to the Sun B) the number of sunspots increases C) Earth’s northern axis is tilted toward the Sun D) the Sun gives off more energy 4. Summer days in Texas are likely to be hotter than winter days because in summer
Transcript of 1.Which event is a direct result of Earth's revolution? C ... · PDF...

A) the apparent deflection of windsB) the changing of the Moon phasesC) the seasonal changes in constellations viewed
in the night skyD) the daily rising and setting of the Sun
1. Which event is a direct result of Earth's revolution?
Base your answers to questions 2 and 3 on the diagram below, which shows the angle of the Sun’snoontime rays received at different Earth latitudes on May 1.
A) The duration of insolation will decrease and the temperature will decrease.B) The duration of insolation will decrease and the temperature will increase.C) The duration of insolation will increase and the temperature will decrease.D) The duration of insolation will increase and the temperature will increase.
2. Which changes can be expected to occur at 45° N over the next 30 days?
A) 0° B) 30° N C) 60° N D) 90° N
3. At which latitude can the noontime Sun be observed in the northern part of the sky?
A) Earth is closer to the SunB) the number of sunspots increasesC) Earth’s northern axis is tilted toward the SunD) the Sun gives off more energy
4. Summer days in Texas are likely to be hotter thanwinter days because in summer

A) March 21 B) June 21C) September 21 D) December 21
5. The shaded portion of the map below indicates areasof night and the unshaded portion indicates areas ofdaylight.
What day of the year is best represented by the map?
Base your answers to questions 6 and 7 on the world map below. Letters A through D representlocations on Earth's surface.
A) A B) B C) C D) D
6. Which location receives 12 hours of daylight and 12 hours of darkness on June 21?

A) A B) B C) C D) D
7. At which location on December 21 is the Sun directly overhead at solar noon?
A) They vary with each season in a cyclicmanner.
B) They move toward the north in the autumnmonths.
C) They move toward the south in the springmonths.
D) They remain the same during the four seasons.
8. In New York State, how do the points of sunrise andsunset change during the course of 1 year?
A) B)
C) D)
9. Which graph best represents the average monthly temperatures for one year at a location in theSouthern Hemisphere?

Base your answers to questions 10 through 13 on diagram and data table below. The diagram represents the Sun's apparent paths as viewed by anobserver located at 50° N latitude on June 21 and March 21. The data table shows the Sun's maximumaltitude for the same two dates of the year. The Sun's maximum altitude for December 21 has beenleft blank.
A) The intensity and angle of insolation are greatest on March 21.B) The intensity and angle of insolation are greatest on June 21.C) The intensity of insolation is greatest on June 21 and the angle of insolation is greatest on March
21.D) The intensity of insolation is greatest on March 21 and the angle of insolation is greatest on June
21.
10. Which statement best compares the intensity and angle of insolation at noon on March 21 and June21?
A) 16.5° B) 23.5° C) 40° D) 90º
11. Which value should be placed in the data table for the Sun's maximum altitude on December 21?

A)
B)
C)
D)
12. Which diagram represents the approximate location of the Sun at 3 p.m. on March 21?

A) B)
C) D)
13. Which graph best represents the relationship between the time of day and the length of a shadow castbythe observer on March 21?
A) Tropic of Cancer (23 º N)B) Equator (0º)C) Tropic of Capricorn (23 º S)D) South Pole (90º S)
14. Which location on the Earth would the Sun's verticalrays strike on December 21?
A) Locations on Earth's Equator receive 12 hoursof daylight every day.
B) The apparent diameter of the Sun showspredictable changes in size.
C) A Foucault pendulum shows predictable shiftsin its direction of swing.
D) Winter occurs in the Southern Hemisphereat the same time that summer occurs in theNorthern Hemisphere.
15. Which observation is a direct result of the 23½º tiltof Earth's axis as Earth orbits the Sun?

Base your answers to questions 16 through 19 on thediagram below. The diagram represents the Earth at aposition in orbit around the Sun, the Sun's rays atsolar noon, and the direction to Polaris. Letters A through D represent positions on the Earth's surface.
A) 23 ° N B) 47° NC) 66 ° N D) 90° N
16. What is the latitude of position A?
A) March 21 B) June 21C) September 23 D) December 21
17. Which date is represented by the diagram?
A) A B) B C) C D) D
18. Which position is receiving the Sun's rays fromdirectly overhead at solar noon?
A) A B) B C) C D) D
19. During one complete rotation of the Earth on itsaxis, which position receives the least number ofhours of daylight?

Base your answers to questions 20 through 22 on the diagram below, which shows a model of Earth’sorbit around the Sun. Letters A, B, C, and D represent Earth’s position at the beginning of eachseason.
A) 15° B) 23.5° C) 47° D) 365°
20. How many degrees will the Sun’s vertical rays shift on Earth’s surface as Earth travels from position C to position D?
A) A B) B C) C D) D
21. The diagram below shows how Earth is illuminated [lighted] by the Sun as viewed from above theNorth Pole.
In which orbital position would Earth be illuminated as shown?
A) A B) B C) C D) D
22. Which position of Earth represents the first day of summer in the Northern Hemisphere?

A) B)
C) D)
23. Which diagram represents the tilt of Earth's axis relative to the Sun's rays on December 15?

Base your answers to questions 24 and 25 on the graph below, which shows the duration of daylighthours throughout the year for five cities located in the Northern Hemisphere.
A) Earth’s axis is tilted 23.5° to the plane of its orbit.B) Earth’s rotation rate is 15° per day.C) The cities are located at different longitudes.D) The cities are located at different elevations.
24. What is the primary reason each city’s duration of daylight hours changes throughout the year?
A) Caracas B) Mexico City C) New Orleans D) Edmonton
25. Which city experiences the greatest variation in daylight hours during one year?

A) above position 1B) below position 3C) between position 1 and position 2D) between position 2 and position 3
26. Positions 1, 2, and 3 in the diagram below representthe noon Sun above the horizon on three differentdays during the year, as viewed from Binghamton,New York.
At which position was the noon Sun on January 21,as viewed from Binghamton?
Base your answers to questions 27 and 28 on thediagram below, which shows numbered positions ofthe Sun at four different times along the Sun’sapparent daily path, as seen by an observer in NewJersey. Numbers 1 through represent apparentpositions of the Sun.
A) 1 B) 2 C) 3 D) 4
27. The observer had the longest shadow when the Sunwas at position
A) March 1 B) July 1C) October 1 D) December 1
28. During which day of the year is the Sun most likelyto follow the apparent path shown?

Base your answers to questions 29 and 30 on the diagram below, which represents Earth in its orbitaround the Sun. The position of Earth on the first day of each season is labeled A, B, C, and D.
A) B)
C) D)
29. Which diagram correctly shows the directions of Earth's revolution and rotation?
A) 1° per day B) 1° per year C) 15° per day D) 15° per year
30. What is the approximate rate of Earth's revolution around the Sun?
A) Iceland B) HawaiiC) Easter Island D) Yellowstone
31. Which hot spot location on Earth's surface usuallyreceives the greatest intensity of insolation on June21?

Base your answers to questions 32 through 34 on the world map below. The shaded portion of themap indicates areas of night, and the unshaded portion indicates areas of daylight on a certain day ofthe year. Dashed latitude lines represent the Arctic Circle (66.5° N) and the Antarctic Circle (66.5° S).Point A is a location on Earth’s surface.
A) B)
C) D)
32. Which diagram shows the position of Earth relative to the Sun’s rays on this day?
A) 6 B) 9 C) 12 D) 15
33. Approximately how many hours of daylight would occur at position A on this day?
A) decreases, only B) increases, onlyC) decreases, then increases D) increases, then decreases
34. On this day, the duration of daylight from the equator to the Arctic Circle

A)
B)
C)
D)
35. Which diagram represents the apparent path of theSun on March 21 for an observer at the equator?

Base your answers to questions 36 and 37 on the diagram below, which represents latitude andlongitude lines on Earth. Points A through E represent locations on Earth. Arrows represent directionof rotation.
A) A B) E C) C D) D
36. At which location will the Sun reach the highest angle above the horizon at solar noon?
A) A B) B C) C D) E
37. Which location has the longest duration of insolation on December 21?
A) The Sun rises north of due east and setsnorth of due west.
B) The Sun rises south of due east and sets southof due west.
C) The Sun rises north of due east and sets southof due west.
D) The Sun rises south of due east and sets northof due west.
38. Which statement best describes the position of theSun at sunrise and sunset as seen by an observer inNew York State on June 21?
A) Earth's axis is tiltedB) Earth's distance from the Sun changesC) the Sun revolvesD) the Sun rotates
39. The apparent daily path of the Sun changes with theseasons because
A) due west B) due eastC) north of due east D) south of due east
40. On June 21, where will the Sun appear to rise for anobserver located in New Jersey?
A) B)
C) D)
41. Which diagram shows the position of the Earthrelative to the Sun's rays during a winter day in theNorthern Hemisphere?

42. Base your answer to the following question on the map and graph below. The map shows two cities,Arica and Rio de Janeiro, located on opposite coasts of South America. Both cities are near sea level.The graph shows the average monthly temperatures for the cities.
A) March 21 through June 20 B) June 21 through September 22C) September 23 through December 20 D) December 21 through March 20
The summer season at Arica and Rio de Janeiro occurs from approximately
A) 23.5° N B) 42° NC) 66.5° N D) 90° N
43. At which latitude is the Sun directly overhead oncertain days of the year?
A) north B) southC) east D) west
44. The diagram below shows the noontime shadowscast by a student and a tree.
If the time is solar noon and the student is located inNew York State, in what direction is the studentfacing?

A) A B) B C) C D) D
45. The diagram below shows Earth's orbit around theSun. Locations A, B, C, and D represent Earth on thefirst day of each season.
Which location represents March 21?
A) 15° higher in the skyB) 23.5° higher in the skyC) 42° higher in the skyD) 48° higher in the sky
46. The diagram below shows the altitude of the Sun atsolar noon on March 21, as seen by an observer at42° N latitude.
Compared to the altitude of the Sun observed atsolar noon on March 21, the altitude of the Sunobserved at solar noon on June 21 will be
A) A B) B C) C D) D
47. The diagram below, which represents a horizon inPennsylvania, shows four positions of sunrise,A, B, C, and D, on different days of the year.
At which position would sunrise occur on June 21?
A) G B) F C) E D) D
48. The diagram below represents a plastic hemisphereupon which lines have been drawn to show theapparent paths of the Sun at a location in New YorkState on the first day of each season. Letters A through I represent points on the paths.
Which point represents the sunrise location on thefirst day of winter?

A) 9 a.m. B) 11 a.m.C) 3 p.m. D) 6 p.m.
49. The diagram below represents the apparent path ofthe Sun as seen by an observer at 65° N on March21.
The Sun's position shown in the diagram wasobserved closest to which time of day?
A) uniform daylight hoursB) changing length of day and nightC) 24-hour dayD) 365 -day year
50. The tilt of the Earth on its axis is a cause of theEarth's
Base your answers to questions 51 through 53 on the diagram below, which represents a model of thesky (celestial sphere) for an observer in New York State. The curved arrow represents the Sun’sapparent path for part of one day. The altitude of Polaris is also indicated.
A) Massena B) OswegoC) Slide Mountain D) Mt. Marcy
51. Where is this observer most likely located?

A) 23.5° B) 42° C) 48° D) 90°
52. According to this diagram, what is the Sun’s altitude at solar noon?
A) March 21 B) July 21 C) October 21 D) December 21
53. On which date could this observation of the Sun’s apparent path have been made?
A) only 1 day B) only 2 daysC) 365 days D) 0 days
54. During how many days of a calendar year is the Sundirectly overhead at noon in New Jersey?
A) 0° B) 23.5° NC) 43° N D) 66.5° N
55. The diagram below shows the apparent daily path ofthe Sun, as viewed by an observer at a certainlatitude on three different days of the year.
At which latitude were these apparent Sun pathsmost likely observed?
A) winter B) springC) summer D) fall
56. The diagram below represents the orbital position ofEarth on October 21.
Which Northern Hemisphere season is occurringwhen Earth reaches position X?

A) A—June 21B—March 21C—December 21
B) A—December 21B—March 21C—June 21
C) A—March 21B—June 21C—December 21
D) A—June 21B—December 21C—March 21
57. A student in New York State looked toward theeastern horizon to observe sunrise at three differenttimes during the year. The student drew thefollowing diagram that shows the positions ofsunrise, A, B, and C, during this one-year period.
Which list correctly pairs the location of sunrise tothe time of the year?

Base your answers to questions 58 through 60 on diagram below, which represents the Sun’s apparentpaths and the solar noon positions for an observer at 42° N latitude on December 21, September 23,and June 21.
A) B)
C) D)
58. Which graph best shows the altitude of the Sun, as measured by the observer located at 42° N, atvarious times on December 21?
A) north of due west B) north of due eastC) south of due west D) south of due east
59. In which direction will sunrise occur on June 21?
A) 6 B) 8 C) 12 D) 24
60. How many hours occurred between sunrise and solar noon on September 23?

A)
B)
C)
D)
61. Which graph best represents the angle of the Sunabove the horizon as observed from 6 a.m. to 6 p.m.on September 23 at a location in New York State?
A) The Sun's orbital velocity changes as itrevolves around the Earth.
B) The Earth's orbital velocity changes as itrevolves around the Sun.
C) The Earth's axis is tilted 23 °D) The Sun's axis is tilted 23 °
62. The diagram below shows the apparent paths of theSun in relation to a house in New York State on June21 and December 21.
Which statement best explains the cause of thisapparent change in the Sun's path?
A)
B)
C)
D)
63. Which model best represents the apparent path of theSun observed at various times during the year at theEquator?

A) winter B) springC) summer D) fall
64. The diagram below represents Earth in space on thefirst day of a season.
Which season is beginning in New York State on theday represented in the diagram?

A)
B)
C)
D)
65. Which diagram best represents the tilt of Earth's axis that causes the Northern Hemisphere seasonsshown? (Diagrams are not drawn to scale.)

Base your answers to questions 66 through 68 on thediagram below, which represents Earth revolvingaround the Sun. Letters A, B, C, and D representEarth's location in its orbit on the first day of the fourseasons. NP represents the North Pole.
A) warmer, and summers would become coolerB) warmer, and summers would become warmerC) cooler, and summers would become coolerD) cooler, and summers would become warmer
66. If the tilt of Earth's axis were decreased from 23.5°to 15°, New York State's winters would become
A) A B) B C) C D) D
67. Which location in Earth's orbit represents the firstday of summer in New York State?
A)
B)
C)
D)
68. Which diagram best represents the Sun's apparentpath as seen by an observer at 43.5° N latitude onDecember 21?
A) north B) south C) east D) west
69. The cartoon characters below are watching the Sunset.
Toward which general direction are the characterslooking?

A) March 21 B) June 21C) September 23 D) December 21
70. In the diagram below, the direct rays of the Sun arestriking the Earth's surface at 23 ° N. What is thedate shown in the diagram?
Base your answers to questions 71 through 73 on the diagram below, which shows the altitude andapparent position of the noontime Sun, as seen from various latitudes on Earth on a particular day ofthe year. Letters A through D represent locations on Earth's surface.
A) summer B) fall C) winter D) spring
71. Which season will begin at 41° N latitude, three months after the date represented by this diagram?
A) 23 B) 43 C) 66 D) 90
72. What is the altitude of the noontime Sun at the Equator on this date?
A) A B) B C) C D) D
73. Which lettered location will experience the shortest period of daylight during one Earth rotation onthis day?
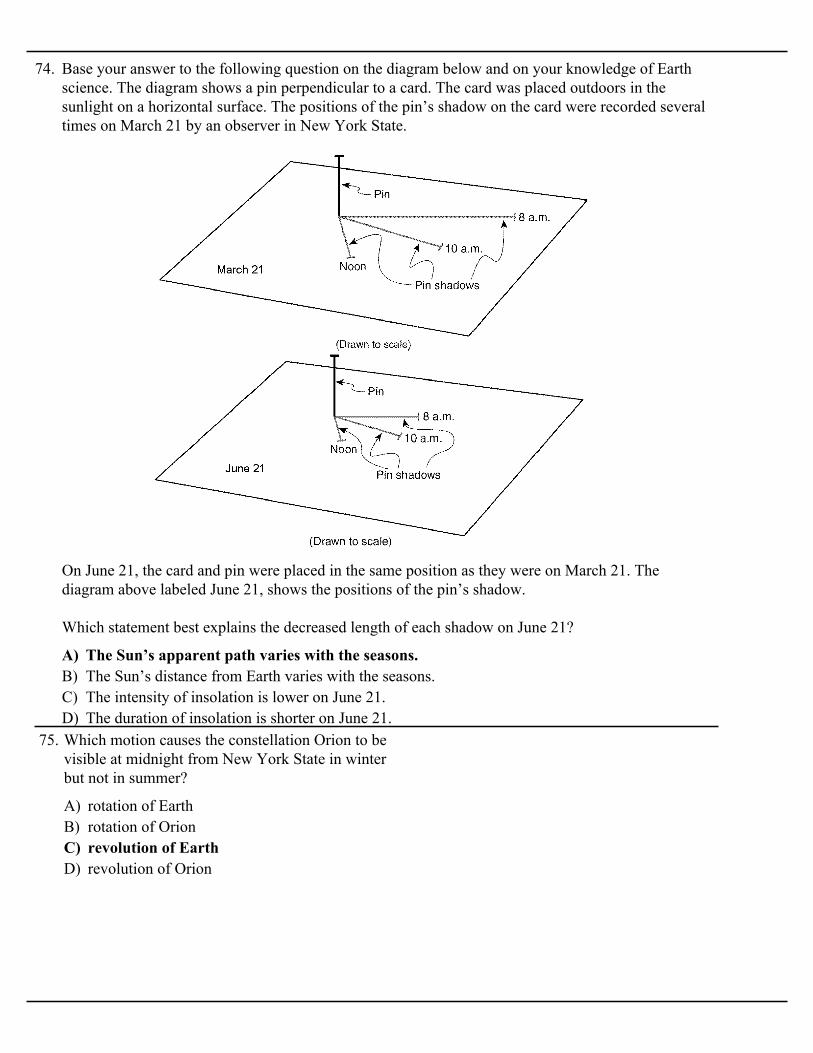
74. Base your answer to the following question on the diagram below and on your knowledge of Earthscience. The diagram shows a pin perpendicular to a card. The card was placed outdoors in thesunlight on a horizontal surface. The positions of the pin’s shadow on the card were recorded severaltimes on March 21 by an observer in New York State.
A) The Sun’s apparent path varies with the seasons.B) The Sun’s distance from Earth varies with the seasons.C) The intensity of insolation is lower on June 21.D) The duration of insolation is shorter on June 21.
On June 21, the card and pin were placed in the same position as they were on March 21. Thediagram above labeled June 21, shows the positions of the pin’s shadow.
Which statement best explains the decreased length of each shadow on June 21?
A) rotation of EarthB) rotation of OrionC) revolution of EarthD) revolution of Orion
75. Which motion causes the constellation Orion to bevisible at midnight from New York State in winterbut not in summer?

A) B)
C) D)
76. In which map does the shaded area correctly represent the part of Earth that receives direct(perpendicular) rays from the Sun sometime during the year?
Base your answers to questions 77 and 78 on the diagram of the Sun, Earth, and the constellationSagittarius shown below. Positions A through D show Earth in its orbit around the Sun on the first dayof each season. Sagittarius is represented in its position in space relative to Earth's orbit.
77. How many hours of daylight will an observer in New York State experience when Earth is at positionC?

78. The diagram below shows the yearly range of altitudes of the noontime Sun as seen by an observer inNew York State. Write the letters for each of the four Earth positions, A, B, C, and D, in the Suncircles on this diagram to identify when the observer will see the Sun at these noontime altitudes inNew York State. More than one letter may be written in a circle.
A) spring B) summerC) fall D) winter
79. During which season in the Northern Hemisphere isthe Earth closest to the Sun?
A) March 21 B) June 21C) September 21 D) December 21
80. The model below shows the Sun's apparent pathacross the sky for an observer in New York State.
On which day of the year was this path observed?

81. Base your answer to the following question on the two maps for Australia below. Map I showsAustralia's major landscape regions. Letters A through H represent locations in Australia. Map IIshows Australia's general climate regions.
A) March 21 B) June 21 C) September 23 D) December 21
On which day with the noon Sun be directly overhead at location C?

A) B)
C) D)
82. Which diagram most correctly shows the portion ofEarth that is illuminated by sunlight and the portionthat is in shadow on the first day of summer in theNorthern Hemisphere?
A) June 21 B) July 21C) August 21 D) September 21
83. On which day of the year does the Sun reach thegreatest altitude at solar noon in New York City?
A) March 21 B) June 21C) September 23 D) December 21
84. The diagram below shows Earth on a particular dayin its orbit around the Sun. The dashed linerepresents Earth's axis.
Which date is represented by the diagram?

85. Base your answer to the following question on the diagram below, which shows the apparent paths ofthe Sun at the beginning of each season for an observer at a location in Connecticut.
A) 1 day B) 1 month C) 6 months D) 12 months
What is the time interval from the Sun's apparent path A to the Sun's apparent path C?
A) apparent rising and setting of the Sun duringone day
B) apparent rising and setting of Polaris duringone day
C) seasonal changes in the apparent positions ofconstellations
D) hourly changes in the apparent direction of theswing of a Foucault pendulum
86. Evidence that Earth revolves around the Sun isprovided by the
A) A B) B C) C D) D
87. The diagram below shows Earth in its orbit aroundthe Sun. Positions A, B, C, and D represent Earth atthe beginning of each season.
At which lettered position of Earth does New YorkState experience the first day of summer?
A) April 21 B) June 21C) October 21 D) December 21
88. On which day of the year does Connecticut have thefewest hours of daylight?
A) cooler, and winters would become coolerB) cooler, and winters would become warmerC) warmer, and winters would become coolerD) warmer, and winters would become warmer
89. If the tilt of Earth's axis were increased from 23.5° to30°, summers in New York State wouldbecome

A) B)
C) D)
90. The diagram below represents the horizon and the Sun's apparent paths, A, B, and C, on threedifferent dates, as viewed from the same location in New York State.
Which table correctly shows the dates on which the apparent paths of the Sun were observed?

A) B)
C) D)
91. Which diagram best shows the Sun’s apparent path, as seen by an observer on July 21 in New Jersey?

A)
B)
C)
D)
92. Which diagram best represents the regions of Earthin sunlight on June 21 and December 21? [NPindicates the North Pole and the shading representsEarth's night side. Diagrams are not drawn to scale.]
Base your answers to questions 93 and 94 on thediagram below, which represents an exaggeratedview of Earth revolving around the Sun. Letters A, B,C, and D represent Earth's location in its orbit on thefirst day of each of the four seasons.
A) A B) B C) C D) D
93. Which location in Earth’s orbit represents the firstday of fall (autumn) for an observer inPennsylvania?
A) 1° per day B) 360° per dayC) 15° per hour D) 23.5° per hour
94. Earth’s rate of revolution around the Sun isapproximately
A) March 22 B) June 22C) September 22 D) December 22
95. A student read in a newspaper that the maximumlength of the daylight period for the year inPittsburgh, Pennsylvania, had just been reached.What was the date of this newspaper?

A) spring B) summerC) fall D) winter
96. The model below shows the apparent path of the Sunas seen by an observer in New York State on thefirst day of one of the four seasons.
This apparent path of the Sun was observed on thefirst day of
A) February B) MayC) June D) October
97. The maps below show the amount of sea icesurrounding the continent of Antarctica at twodifferent times of the year. Map A represents lateAugust when the area covered by sea ice approachesits greatest extent. Map B represents the minimumextent of sea ice.
Which month is most probably represented by map B?
A) tilt of Earth's axis and Earth's revolutionB) tilt of Earth's axis and Earth's rotationC) eccentricity of Earth's orbit and Earth's
revolutionD) eccentricity of Earth's orbit and Earth's rotation
98. Which two factors cause the perpendicular rays ofthe Sun to move between 23.5º N and 23.5º S?
A) B)
C) D)
99. The diagram below shows the shadow cast by atelephone pole on March 21 at solar noon at alocation in New York State.
Which shadow was cast by the same telephone poleon June 21 at solar noon?
A) spring B) summerC) autumn D) winter
100. During which Northern Hemisphere season is Earthclosest to the Sun?
A) January B) AprilC) July D) October
101. The lowest surface air temperatures in the SouthernHemisphere usually occur during themonth of
A) parallelism of the Sun's axis as the Sunrevolves around Earth
B) changes in distance between Earth and the SunC) elliptical shape of Earth's orbit around the SunD) tilt of Earth's axis as Earth revolves around
the Sun
102. Seasonal changes on Earth are primarily caused bythe

A) A B) B C) C D) D
103. The map below shows four locations, A, B, C, and D, on the continent of South America.
Which location is the first to experience sunset on September 23?
A) early morning in winterB) early morning in summerC) late afternoon in winterD) late afternoon in summer
104. A tree in New York State casts a shadow as shownin the diagram below.
What time of day and season are represented by thediagram?
A) Constellations revolve around Earth.B) Constellations revolve around the Sun.C) The Sun revolves around the center of our
galaxy.D) Earth revolves around the Sun.
105. In October, observers in Ohio looking due south atthe night sky would see a different group ofconstellations than they had seen in March. What isthe best explanation for this change in the nightsky?

A) A and B B) B and CC) C and D D) D and A
106. The diagram below represents Earth at fourdifferent positions, A, B, C, and D, in its orbitaround the Sun.
Between which positions would Texas beexperiencing the summer season?
A) February 1 B) June 6C) March 21 D) December 21
107. To an observer located at the Equator, on whichdate would the Sun appear to be directly overheadat noon?
Base your answers to questions 108 through 110 on the diagram below, which shows a model of theapparent path and position of the Sun in relation to an observer at four different locations, A, B, C, and D, on Earth’s surface on the dates indicated. The zenith (z) and the actual position of the Sun inthe model at the time of the observation are shown. [The zenith is the point directly over theobserver.]
A) increase, only B) decrease, onlyC) increase, then decrease D) decrease, then increase
108. From sunrise to sunset at location B, the length of the observer’s shadow will
A) at the Equator B) at the South PoleC) at the North Pole D) in Oswego, New York
109. Where on Earth’s surface is the observer at location C located?

A) A B) B C) C D) D
110. According to the Sun’s actual position shown in the diagrams, the most intense insolation is beingreceived by the observer at location
A) B)
C) D)
111. A student accurately measured the altitude of the noontime Sun from the same New Jersey locationon four days during the school year. Which sequence best shows these measurements?
Base your answers to questions 112 and 113 on the diagram below, which represents the apparentpath of the Sun observed at four locations on Earth's surface on March 21. The present positions ofthe Sun, Polaris, and the zenith (position directly overhead) are shown for an observer at eachlocation.
112. State the approximate time of day for the observer at location B when the Sun is at the positionshown in the diagram.
113. Explain why the intensity of sunlight at noon on March 21 is greater at location C than at the otherlocations.

A) spring B) summerC) fall D) winter
114. The diagram below shows Earth as viewed fromspace.
Which season is beginning in the NorthernHemisphere?
A) 1° B) 13° C) 15° D) 23.5°
115. Approximately how many degrees per day doesEarth revolve in its orbit around the Sun?
A) A B) B C) C D) D
116. The diagram below represents four positions of theEarth as it revolves around the Sun.
At which position is the Earth located on December21?

117. Base your answer to the following question on the diagram below, which shows Earth and the Moon in relation to the Sun. Positions A, B, C, and D show the Moon at specific locations in its orbit. Point X is a location on Earth's surface.
A) December 21 B) January 21 C) March 21 D) June 21
On what date does the line separating day and night pass through Earth's North Pole, as shown inthis diagram?
A) The stars orbit Earth.B) The stars orbit the Sun.C) The Moon orbits Earth.D) Earth orbits the Sun.
118. Which motion is responsible for the regularseasonal changes of the constellations visible in thenight sky?
A) December B) JanuaryC) June D) July
119. During which month does the Sun appear to risefarthest north of due east for an observer in NewYork State?

120. Base your answer to the following question on the diagram below, which shows sunlight entering aroom through the same window at three different times on the same winter day.
A) north B) south C) east D) west
This room is located in a building in Connecticut. On which side of the building is the windowlocated?

Answer KeySun and the Seasons
1. C2. D3. A4. C5. D6. C7. B8. A9. C10. B11. A12. D13. D14. C15. D16. D17. B18. B19. D20. B21. A22. C23. D24. A25. D26. D27. D28. B29. D30. A31. B32. D33. C34. A35. A
36. A37. B38. A39. A40. C41. D42. D43. A44. A45. A46. B47. A48. D49. C50. B51. C52. C53. A54. D55. C56. B57. A58. D59. B60. A61. D62. C63. B64. A65. C66. A67. B68. D69. D70. B
71. D72. C73. A74. A75. C76. D77. 12 h78.
79. D80. D81. D82. A83. A84. D85. C86. C87. C88. D89. C90. D91. A92. C93. C94. A95. B96. D97. A98. A99. B
100. D101. C102. D103. D104. C105. D106. A107. C108. D109. C110. A111. A112. 2:30 pm ( 1 hour)113. Examples: – The
Sun is highest in thesky at noon atlocation C. – Theobserver is at theEquator.
114. D115. A116. C117. C118. D119. C120. B