1st Quarter 2021 - Tweedy
15
One Station Place | Stamford, CT 06902 Tel 800.432.4789 | Fax 203.703.0726 www.tweedy.com 1 of 15 1st Quarter 2021 The roll-out of vaccines all over the world, coupled with optimism around prospects for a strong post-Covid economic rebound, fueled by unprecedented levels of fiscal and monetary stimulus, continued to trump investors’ concerns about valuation, increased speculation, rising inflationary expectations and the prospects for higher interest rates. This, in turn, has helped to propel equities around the world to record highs just after quarter end. Value-oriented equities and non-U.S. equities continued to outperform their growth and U.S. brethren in the first quarter, offering confirmation of the market’s rotation that began back in November of last year, when the efficacy of the vaccines was first announced. In this continued risk-on environment, the Tweedy, Browne Funds produced strong returns of between 4.96% and 7.72% for the quarter, with three out of our four Funds besting their benchmark indices. The Tweedy, Browne Global Value Fund, which finished the quarter up 7.14%, modestly trailed the MSCI EAFE Index (Hedged to US$), its benchmark index, by less than 50 basis points. For the last two quarters cumulatively, all four Tweedy, Browne Funds produced returns of roughly 20% or more and outpaced their benchmark indices by 25 to as much as 364 basis points. 2021 Average Annual Total Returns for Periods Ended March 31, 2021 1st Qtr 6 mos ending March 31 1 Year 5 Years 10 Years 15 Years Since Inception Global Value Fund (inception 06/15/93) 7.14% 22.63% 34.89% 7.21% 6.36% 5.31% 8.83% MSCI EAFE Index (Hedged to US$) 7.63 20.40 37.75 10.61 8.37 4.98 6.39 MSCI EAFE Index (in US$) 3.48 20.08 44.57 8.85 5.52 4.10 5.53 Total Annual Fund Operating Expense Ratios as of 03/31/2020: 1.37%† Global Value Fund II – Currency Unhedged (inception 10/26/09) 4.96% 23.72% 40.87% 6.36% 5.00% - 5.73% MSCI EAFE Index (in US$) 3.48 20.08 44.57 8.85 5.52 - 5.86 Total Annual Fund Operating Expense Ratios as of 03/31/2020: 1.39% (gross); 1.39% (net)* Value Fund (inception 12/08/93) 7.72% 22.13% 35.58% 8.27% 6.92% 5.87% 8.03% S&P 500 Index (12/8/93-12/31/06)/ MSCI World Index (Hedged to US$) (1/1/07-present) 6.16 19.46 51.26 14.07 11.19 7.63 8.97 Total Annual Fund Operating Expense Ratios as of 03/31/2020: 1.39% (gross); 1.37% (net)* Worldwide High Dividend Yield Value Fund (inception 09/05/07) 5.29% 19.82% 33.80% 7.86% 5.64% - 4.39% MSCI World Index (in US$) 4.92 19.57 54.03 13.36 9.88 - 6.58 MSCI World High Dividend Yield Index (in US$) 6.12 18.47 35.69 8.49 7.58 - 4.37 Total Annual Fund Operating Expense Ratios as of 03/31/2020: 1.44% (gross); 1.38% (net)* 30‐Day Standardized Yield as of 03/31/2021: 1.66% (Subsidized); 1.61% (Unsubsidized) The performance data shown above represents past performance and is not a guarantee of future results. Investment return and principal value of an investment will fluctuate so that an investor's shares, when redeemed, may be worth more or less than their original cost. Current performance may be higher or lower than the performance data quoted.
Transcript of 1st Quarter 2021 - Tweedy
One Station Place | Stamford, CT 06902 Tel 800.432.4789 | Fax 203.703.0726
www.tweedy.com
1 of 15
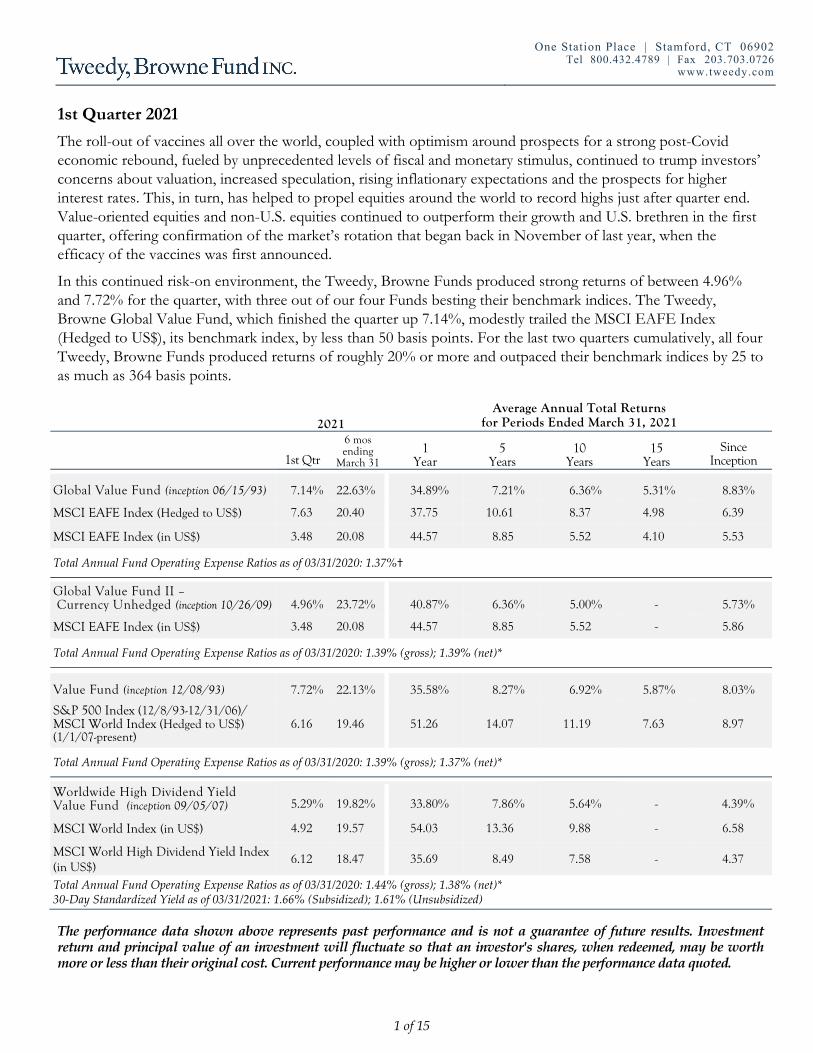
1st Quarter 2021 The roll-out of vaccines all over the world, coupled with optimism around prospects for a strong post-Covid economic rebound, fueled by unprecedented levels of fiscal and monetary stimulus, continued to trump investors’ concerns about valuation, increased speculation, rising inflationary expectations and the prospects for higher interest rates. This, in turn, has helped to propel equities around the world to record highs just after quarter end. Value-oriented equities and non-U.S. equities continued to outperform their growth and U.S. brethren in the first quarter, offering confirmation of the market’s rotation that began back in November of last year, when the efficacy of the vaccines was first announced.
In this continued risk-on environment, the Tweedy, Browne Funds produced strong returns of between 4.96% and 7.72% for the quarter, with three out of our four Funds besting their benchmark indices. The Tweedy, Browne Global Value Fund, which finished the quarter up 7.14%, modestly trailed the MSCI EAFE Index (Hedged to US$), its benchmark index, by less than 50 basis points. For the last two quarters cumulatively, all four Tweedy, Browne Funds produced returns of roughly 20% or more and outpaced their benchmark indices by 25 to as much as 364 basis points.
2021
Average Annual Total Returns for Periods Ended March 31, 2021
1st Qtr
6 mos ending
March 31 1
Year 5
Years 10
Years 15
Years Since
Inception
Global Value Fund (inception 06/15/93) 7.14% 22.63% 34.89% 7.21% 6.36% 5.31% 8.83%
MSCI EAFE Index (Hedged to US$) 7.63 20.40 37.75 10.61 8.37 4.98 6.39
MSCI EAFE Index (in US$) 3.48 20.08 44.57 8.85 5.52 4.10 5.53
Total Annual Fund Operating Expense Ratios as of 03/31/2020: 1.37%†
Global Value Fund II – Currency Unhedged (inception 10/26/09) 4.96% 23.72% 40.87% 6.36% 5.00% - 5.73%
MSCI EAFE Index (in US$) 3.48 20.08 44.57 8.85 5.52 - 5.86
Total Annual Fund Operating Expense Ratios as of 03/31/2020: 1.39% (gross); 1.39% (net)*
Value Fund (inception 12/08/93) 7.72% 22.13% 35.58% 8.27% 6.92% 5.87% 8.03%
S&P 500 Index (12/8/93-12/31/06)/ MSCI World Index (Hedged to US$) (1/1/07-present)
6.16 19.46 51.26 14.07 11.19 7.63 8.97
Total Annual Fund Operating Expense Ratios as of 03/31/2020: 1.39% (gross); 1.37% (net)*
Worldwide High Dividend Yield Value Fund (inception 09/05/07) 5.29% 19.82% 33.80% 7.86% 5.64% - 4.39%
MSCI World Index (in US$) 4.92 19.57 54.03 13.36 9.88 - 6.58
MSCI World High Dividend Yield Index (in US$)
6.12 18.47 35.69 8.49 7.58 - 4.37
Total Annual Fund Operating Expense Ratios as of 03/31/2020: 1.44% (gross); 1.38% (net)* 30‐Day Standardized Yield as of 03/31/2021: 1.66% (Subsidized); 1.61% (Unsubsidized)
The performance data shown above represents past performance and is not a guarantee of future results. Investment return and principal value of an investment will fluctuate so that an investor's shares, when redeemed, may be worth more or less than their original cost. Current performance may be higher or lower than the performance data quoted.

1st Quarter 2021
2 of 15
† Tweedy, Browne has voluntarily agreed, effective May 22, 2020 through at least July 31, 2021, to waive the Global Value Fund’s fees whenever the Fund’s average daily net assets (“ADNA”) exceed $6 billion. Under the arrangement, the advisory fee payable by the Fund is as follows: 1.25% on the first $6 billion of the Fund’s ADNA; 0.80% on the next $1 billion of the Fund’s ADNA (ADNA over $6 billion up to $7 billion); 0.70% on the next $1 billion of the Fund’s ADNA (ADNA over $7 billion up to $8 billion); and 0.60% on the remaining amount, if any, of the Fund's ADNA (ADNA over $8 billion). The Fund’s performance would have been lower had fees not been waived from May 22, 2020 to March 31, 2021.
* Tweedy, Browne has voluntarily agreed, effective December 1, 2017 through at least July 31, 2021, to waive a portion of the Global Value Fund II’s, the Value Fund’s and the Worldwide High Dividend Yield Value Fund’s investment advisory fees and/or reimburse a portion of each Fund’s expenses to the extent necessary to keep each Fund’s expense ratio in line with the expense ratio of the Global Value Fund. (For purposes of this calculation, each Fund’s acquired fund fees and expenses, brokerage costs, interest, taxes and extraordinary expenses are disregarded, and each Fund’s expense ratio is rounded to two decimal points.) The net expense ratios set forth above reflect this limitation, while the gross expense ratios do not. The Global Value Fund II’s, Value Fund’s and Worldwide High Dividend Yield Value Fund’s performance data shown above would have been lower had certain fees and expenses not been waived and/or reimbursed during certain periods.
The Funds do not impose any front-end or deferred sales charges. The expense ratios shown above reflect the inclusion of acquired fund fees and expenses (i.e., the fees and expenses attributable to investing cash balances in money market funds) and may differ from those shown in the Funds' financial statements.
Please note that the individual companies discussed herein were held in one or more of the Funds during the quarter
ended March 31, 2021, but were not necessarily held in all four of the Funds. Please refer to the footnotes on page 14 for
each Fund’s respective holdings in each of these companies as of March 31, 2021.
What would appear to be a long overdue market rotation from growth stocks back towards value stocks that began in earnest last November continued into the first quarter with more economically sensitive market sectors such as financials and industrials assuming market leadership. The Tweedy, Browne Funds have been beneficiaries of this change in market leadership.
Results during the quarter in the Tweedy, Browne Funds were in large part led by the Funds’ bank, insurance, machinery and industrial conglomerate holdings, including banks such as Bank of America, Wells Fargo, DBS, and UOB; insurance companies such as CNP Assurances, SCOR and Zurich Insurance; machinery holdings such as CNH Industrial and Trelleborg; and industrial conglomerate holdings such as Jardine Matheson, CK Hutchison, and Siemens. The financials were in part helped by the rise in inflationary expectations and in turn interest rates, which generally translates into improved net interest margins for banks, while the industrials were propelled by the prospects for a strong post-Covid economic recovery. On the interactive services and information technology side, Alphabet (Google), Intel, and Cisco also produced strong double-digit returns. In addition, AutoZone, the U.S.-based specialty auto parts retailer; Berkshire Hathaway, the U.S.-based conglomerate; BASF, the German chemical giant; and Total, one of the Funds’ few remaining energy companies, were also up nicely during the quarter.
While most stocks performed well during the quarter, there were a few disappointments, including consumer staples holdings such as Heineken, the Dutch beer company; Dali Foods, the Chinese snack food business; and Unilever, the Dutch food and personal products company. Babcock International, the UK-based defense services company, also had a challenging quarter, as did Alibaba, the Funds’ rather new Chinese internet retailing holding; Tarkett, the French industrial flooring company; and GlaxoSmthKline, the UK-based pharmaceutical company.
Despite rising valuations, which in part led to overall net security sales for the quarter, we continued to uncover pockets of undervaluation around the world. We established a number of new positions in the Fund portfolios during the quarter, including Fresenius SE, a healthcare conglomerate in Germany; Industrias Bachoco, a Mexican poultry company; Concentrix, the U.S.-based outsourcing business specializing in technical support and customer care; and Progressive, the U.S.-based auto and homeowners insurance company, among others. At purchase, these
1st Quarter 2021
3 of 15
companies were trading at significant discounts to our conservative estimates of intrinsic value, had strong competitive positions, and in our view, good prospects for future growth. We also took advantage of pricing opportunities and added to a number of positions, including more recent entrants into the Funds’ portfolios such as A-Living Smart City Services, Dali Foods, Megacable, Orange, Alibaba, Okamoto, and Rubis.
In terms of sales, we sold the Funds’ remaining shares in Ebara, Goldman Sachs, Yamaha Motor, and Zeon, all of which were trading at or near our estimates of their intrinsic values, and had produced solid returns for the portfolio.
Fresenius SE One of our new buys in all but the Worldwide High Dividend Yield Value Fund during the quarter was Fresenius SE, a global healthcare conglomerate based in Germany. Its various businesses provide dialysis services (Fresenius Medical Care), generic injectable drugs, clinical nutrition and other intravenous products (Kabi). It also owns private hospitals in Spain and Germany. The dialysis and injectables/intravenous businesses operate in somewhat consolidated markets with high barriers to entry, while the hospital business is a less differentiated asset.
All of these businesses benefit from the secular demand growth of aging demographics and increasing per capita healthcare consumption. Over the medium term, management expects the company to grow its earnings at a mid-to-high single-digit rate. The company typically generates a low teens operating margin and earns a low double-digit ROE including goodwill. Its current dividend yield is 2.3%. Fresenius also has had substantial insider buying recently.
We bought Fresenius at ~10x EV/EBITA on a look-through basis. Alternatively, it was at ~70% of our estimated intrinsic value on a sum of the parts basis.
Progressive One of our new buys in the Worldwide High Dividend Yield Value Fund during the quarter was Progressive Corporation, the third largest personal automobile insurance carrier in the U.S., with a market share of 13% as of December 31, 2020. While the Company has a successful history of expanding into new markets (like commercial auto insurance), personal auto insurance still dominates its profit and loss statement (“P&L”), representing 89% of Progressive’s pre-tax underwriting profit in 2020.
Progressive is a best-of-breed auto insurance carrier. The company has a long track record of innovation, market share gains, industry-leading profitability (lowest 10-year average combined ratio) and generating high returns (19% average operating ROE). Over the 16 years ended December 31, 2020, the value compound (defined as growth in book value per share plus cumulative dividends per share) was +13.3%. The Company seems to have clear competitive advantages: direct distribution (low expense ratio) and superior data analytics (low loss ratio).
At purchase, we paid between $85 and $87 per share, or roughly 15 times estimated 2021 operating earnings per share (excluding net after-tax gains/losses realized on securities), approximately 75% to 80% of our conservative estimates of intrinsic value. Moreover, Progressive has paid an above average dividend in the form of a regular quarterly dividend and a discretionary additional variable dividend paid annually. In 2019 and 2020, the total dividend declared per share was $2.65 and $4.90, respectively.
As we write, global equity markets have rallied aggressively, driving capitalization-weighted indexes to record levels. The Shiller CAPE Ratio (cyclically adjusted price earnings ratio) recently hit 37, its highest level in the post war era (with the exception of the tech bubble of 2000, when it hit 44). Inflationary expectations are on the rise, as are intermediate-term interest rates in the U.S., fueled by the prospects for a continued surge in aggregate demand coupled with supply disruptions. The vaccine rollout in Europe remains halting, although improving, and geopolitical tensions, while down from the Trump era, are still elevated. Speculation is also on the rise in capital

1st Quarter 2021
4 of 15
markets, fueled by continuing unprecedented levels of fiscal and monetary stimulus. The conventional wisdom, supported by recent market action, would appear to suggest that equity valuations have further to go to the upside, particularly for more cyclically-oriented equities, in light of continued low interest rates, an inflationary threat that is viewed as transitory, massive levels of stimulus around the globe, and the prospects for an explosive post-Covid economic recovery. We hope the market soothsayers are right. However, the market is a discounting mechanism, and one has to wonder how much further this game of musical chairs has to go.
Despite rising valuations, we continue to uncover attractively valued equities, as pockets of undervaluation still remain from the bifurcated markets of the last year. As value investors, we are encouraged by the rotation that began in earnest last November post the vaccine announcements, and are hopeful for what this may mean for future relative performance of value-oriented equities, and non-U.S. equities, which are less impacted by technology stocks.
Are the green shoots for so-called value stocks that have been appearing of late an indication that central bankers may finally be losing control of the bond market? Will rising inflationary expectations lead to higher interest rates that prove not to be transitory, and instead, hazardous for the value of longer-duration growth stocks? Will a vigorous vaccine-induced economic recovery supercharge the near-term earnings of “older economy” value stocks and their non-U.S. brethren? Will the COVID-19 virus ultimately prove to be a serendipitous top for technology stocks, at least in the near term? We simply cannot know the answers to these questions, but if one or more do come to pass, it could mean long-overdue redemption for value-oriented investors.
Thank you for investing with us. Stay well.
Roger R. de Bree, Frank H. Hawrylak, Jay Hill, Sean McDonald Thomas H. Shrager, John D. Spears, Robert Q. Wyckoff, Jr.
Investment Committee Tweedy, Browne Company LLC April 2021
TWEEDY, BROWNE GLOBAL VALUE FUND As of March 31, 2021
www.tweedy .com 1 -800 -432 -4789
5 of 15
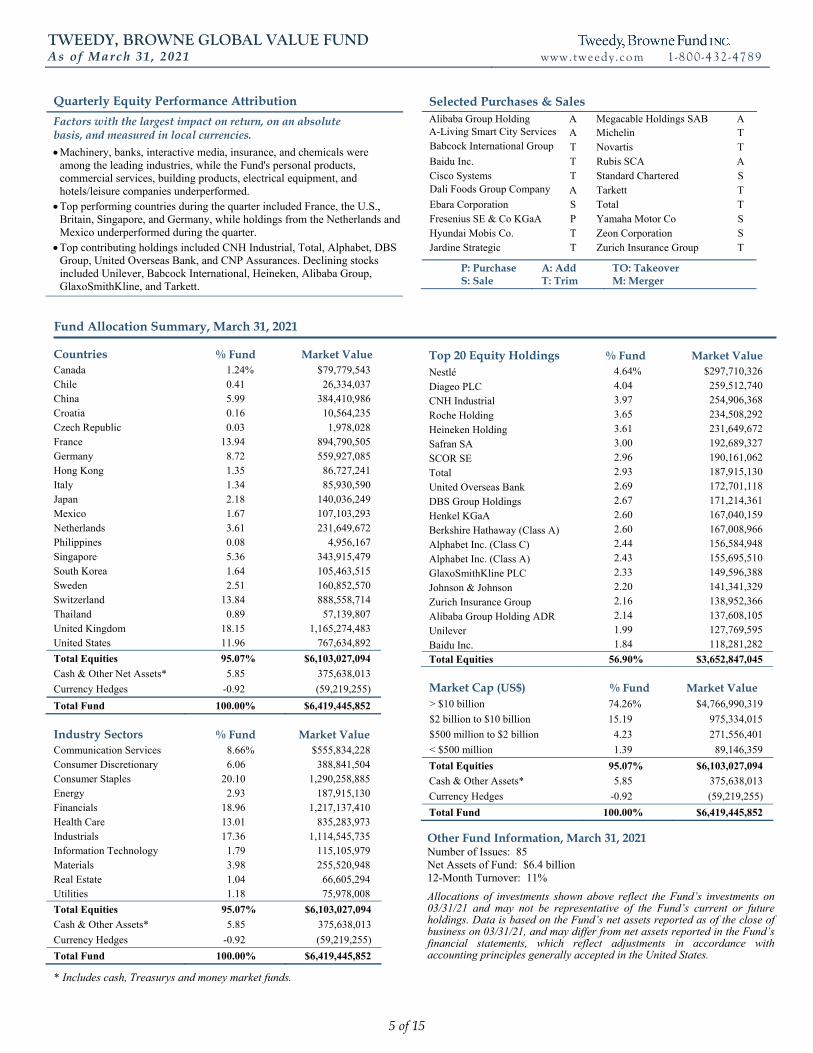
Quarterly Equity Performance Attribution
Factors with the largest impact on return, on an absolute basis, and measured in local currencies.
Machinery, banks, interactive media, insurance, and chemicals were among the leading industries, while the Fund's personal products, commercial services, building products, electrical equipment, and hotels/leisure companies underperformed.
Top performing countries during the quarter included France, the U.S., Britain, Singapore, and Germany, while holdings from the Netherlands and Mexico underperformed during the quarter.
Top contributing holdings included CNH Industrial, Total, Alphabet, DBS Group, United Overseas Bank, and CNP Assurances. Declining stocks included Unilever, Babcock International, Heineken, Alibaba Group, GlaxoSmithKline, and Tarkett.
Fund Allocation Summary, March 31, 2021
Countries % Fund Market Value Canada 1.24% $79,779,543 Chile 0.41 26,334,037 China 5.99 384,410,986 Croatia 0.16 10,564,235 Czech Republic 0.03 1,978,028 France 13.94 894,790,505 Germany 8.72 559,927,085 Hong Kong 1.35 86,727,241 Italy 1.34 85,930,590 Japan 2.18 140,036,249 Mexico 1.67 107,103,293 Netherlands 3.61 231,649,672 Philippines 0.08 4,956,167 Singapore 5.36 343,915,479 South Korea 1.64 105,463,515 Sweden 2.51 160,852,570 Switzerland 13.84 888,558,714 Thailand 0.89 57,139,807 United Kingdom 18.15 1,165,274,483 United States 11.96 767,634,892
Total Equities 95.07% $6,103,027,094
Cash & Other Net Assets* 5.85 375,638,013
Currency Hedges -0.92 (59,219,255)
Total Fund 100.00% $6,419,445,852
Industry Sectors % Fund Market Value Communication Services 8.66% $555,834,228 Consumer Discretionary 6.06 388,841,504 Consumer Staples 20.10 1,290,258,885 Energy 2.93 187,915,130 Financials 18.96 1,217,137,410 Health Care 13.01 835,283,973 Industrials 17.36 1,114,545,735 Information Technology 1.79 115,105,979 Materials 3.98 255,520,948 Real Estate 1.04 66,605,294 Utilities 1.18 75,978,008
Total Equities 95.07% $6,103,027,094
Cash & Other Assets* 5.85 375,638,013
Currency Hedges -0.92 (59,219,255)
Total Fund 100.00% $6,419,445,852
* Includes cash, Treasurys and money market funds.
Selected Purchases & Sales Alibaba Group Holding A Megacable Holdings SAB A A-Living Smart City Services A Michelin T Babcock International Group T Novartis T Baidu Inc. T Rubis SCA A Cisco Systems T Standard Chartered S Dali Foods Group Company A Tarkett T Ebara Corporation S Total T Fresenius SE & Co KGaA P Yamaha Motor Co S Hyundai Mobis Co. T Zeon Corporation S Jardine Strategic T Zurich Insurance Group T
P: Purchase S: Sale
A: Add T: Trim
TO: Takeover M: Merger
Top 20 Equity Holdings % Fund Market Value Nestlé 4.64% $297,710,326
Diageo PLC 4.04 259,512,740
CNH Industrial 3.97 254,906,368
Roche Holding 3.65 234,508,292
Heineken Holding 3.61 231,649,672
Safran SA 3.00 192,689,327
SCOR SE 2.96 190,161,062
Total 2.93 187,915,130
United Overseas Bank 2.69 172,701,118
DBS Group Holdings 2.67 171,214,361
Henkel KGaA 2.60 167,040,159
Berkshire Hathaway (Class A) 2.60 167,008,966
Alphabet Inc. (Class C) 2.44 156,584,948
Alphabet Inc. (Class A) 2.43 155,695,510
GlaxoSmithKline PLC 2.33 149,596,388
Johnson & Johnson 2.20 141,341,329
Zurich Insurance Group 2.16 138,952,366
Alibaba Group Holding ADR 2.14 137,608,105
Unilever 1.99 127,769,595
Baidu Inc. 1.84 118,281,282
Total Equities 56.90% $3,652,847,045
Market Cap (US$) % Fund Market Value > $10 billion 74.26% $4,766,990,319
$2 billion to $10 billion 15.19 975,334,015
$500 million to $2 billion 4.23 271,556,401
< $500 million 1.39 89,146,359
Total Equities 95.07% $6,103,027,094
Cash & Other Assets* 5.85 375,638,013
Currency Hedges -0.92 (59,219,255)
Total Fund 100.00% $6,419,445,852
Other Fund Information, March 31, 2021 Number of Issues: 85 Net Assets of Fund: $6.4 billion 12-Month Turnover: 11%
Allocations of investments shown above reflect the Fund’s investments on 03/31/21 and may not be representative of the Fund’s current or future holdings. Data is based on the Fund’s net assets reported as of the close of business on 03/31/21, and may differ from net assets reported in the Fund’s financial statements, which reflect adjustments in accordance with accounting principles generally accepted in the United States.

TWEEDY, BROWNE GLOBAL VALUE FUND As of March 31, 2021
www.tweedy .com 1 -800 -432 -4789
6 of 15
Calendar Year Returns
Global Value Fund
MSCI EAFE Index(1)(2) Foreign Stock
Fund Average(6) Hedged to US$ in US$ 1993 (06/15 – 12/31) 15.40% 10.33% 5.88% 18.94% 1994 4.36 -1.67 7.78 -0.33 1995 10.70 11.23 11.21 10.29 1996 20.23 13.53 6.05 13.59 1997 22.96 15.47 1.78 5.81 1998 10.99 13.70 20.00 13.26 1999 25.28 36.47 26.96 43.28 2000 12.39 -4.38 -14.17 -14.95 2001 -4.67 -15.87 -21.44 -21.42 2002 -12.14 -27.37 -15.94 -16.11 2003 24.93 19.17 38.59 36.84 2004 20.01 12.01 20.25 18.69 2005 15.42 29.67 13.54 15.55 2006 20.14 19.19 26.34 25.06 2007 7.54 5.32 11.17 12.16 2008 -38.31 -39.90 -43.38 -44.64 2009 37.85 25.67 31.78 34.30 2010 13.82 5.60 7.75 11.94 2011 -4.13 -12.10 -12.14 -13.61 2012 18.39 17.54 17.32 19.13 2013 19.62 26.67 22.78 22.75 2014 1.51 5.67 -4.90 -5.35 2015 -1.46 5.02 -0.81 1.56 2016 5.62 6.15 1.00 0.79 2017 15.43 16.84 25.03 28.90 2018 -6.67 -8.96 -13.79 -16.80 2019 14.63 24.64 22.01 22.79 2020 -1.00 2.50 7.82 13.53 2021 (through 03/31) 7.14 7.63 3.48 4.15 Cumulative Return (06/15/93 – 03/31/21)(3) 949.01% 460.35% 347.02% 496.95%
Periods Ending 03/31/2021
Average Annual Total Returns Global Value Fund
MSCI EAFE Index(1)(2) Foreign Stock Fund Average(6) Hedged to US$ in US$
1 year 34.89% 37.75% 44.57% 59.02% 3 years 5.05 9.16 6.02 6.56 5 years 7.21 10.61 8.85 9.90 10 years 6.36 8.37 5.52 6.33 15 years 5.31 4.98 4.10 4.41 20 years 6.44 4.84 5.45 7.39 Since Inception (06/15/93)(3) 8.83 6.39 5.53 6.63
Total Annual Fund Operating Expense Ratio as of 03/31/2020 ‐ 1.37%*
The performance shown above represents past performance and is not a guarantee of future results. Investment return and principal value of an investment will fluctuate so that an investor's shares, when redeemed, may be worth more or less than their original cost. Current performance may be lower or higher than the performance data quoted. Please visit www.tweedy.com to obtain performance data which is current to the most recent month end.
† Tweedy, Browne has voluntarily agreed, effective May 22, 2020 through at least July 31, 2021, to waive the Fund’s fees whenever the Fund’s average daily net assets (“ADNA”) exceed $6 billion. Under the arrangement, the advisory fee payable by the Fund is as follows: 1.25% on the first $6 billion of the Fund’s ADNA; 0.80% on the next $1 billion of the Fund’s ADNA (ADNA over $6 billion up to $7 billion); 0.70% on the next $1 billion of the Fund’s ADNA (ADNA over $7 billion up to $8 billion); and 0.60% on the remaining amount, if any, of the Fund's ADNA (ADNA over $8 billion). The Fund’s performance would have been lower had fees not been waived from May 22, 2020 to March 31, 2021.
* The Fund does not impose any front-end or deferred sales charges. The expense ratios shown above reflect the inclusion of acquired fund fees and expenses (i.e., the fees and expenses attributable to investing cash balances in money market funds) and may differ from those shown in the Fund’s financial statements.
Please refer to footnotes (1) through (7) at the end of this commentary for descriptions of the Fundʹs indexes.

TWEEDY, BROWNE GLOBAL VALUE FUND II - CURRENCY UNHEDGED As of March 31, 2021
www.tweedy .com 1 -800 -432 -4789
7 of 15
Quarterly Equity Performance Attribution
Factors with the largest impact on return, on an absolute basis, and measured in local currencies.
Machinery, insurance, chemicals, banks, and auto components companies were among the leading industries, while the Fund's commercial services, building products, personal products, electrical equipment, and hotels/leisure companies underperformed. Top performing countries during the quarter included Britain, France, the U.S., Japan, and Germany, while holdings from the Netherlands underperformed during the quarter. Top contributing holdings included CNH Industrial, Total, Trelleborg, CNP Assurances, Inchcape, and AutoZone. Declining stocks included Babcock International, Tarkett, Unilever, Alibaba Group, and GlaxoSmithKline.
Fund Allocation Summary, March 31, 2021
Countries % Fund Market Value Canada 0.79% $3,818,483 Chile 0.46 2,241,398 China 6.30 30,645,658 France 16.65 80,972,512 Germany 9.27 45,077,047 Hong Kong 0.95 4,621,607 Italy 0.27 1,308,251 Japan 3.96 19,249,025 Mexico 2.23 10,848,681 Netherlands 2.10 10,218,470 Philippines 0.32 1,533,848 Singapore 3.88 18,873,193 South Korea 2.77 13,460,669 Sweden 2.43 11,802,786 Switzerland 11.87 57,708,199 Thailand 1.01 4,919,443 United Kingdom 20.52 99,808,236 United States 9.47 46,072,606
Total Equities 95.24% $463,180,112 Cash & Other Assets* 4.76 23,157,659
Total Fund 100.00% $486,337,771
Industry Sectors % Fund Market Value Communication Services 4.74% $23,073,955 Consumer Discretionary 10.33 50,246,826 Consumer Staples 13.82 67,220,152 Energy 2.66 12,923,299 Financials 17.29 84,072,912 Health Care 13.56 65,957,100 Industrials 21.39 104,043,282 Information Technology 2.79 13,567,599 Materials 6.15 29,904,532 Real Estate 0.59 2,866,045 Utilities 1.91 9,304,410
Total Equities 95.24% $463,180,112
Cash & Other Assets* 4.76 23,157,659
Total Fund 100.00% $486,337,771
* Includes cash and money market funds.
Selected Purchases & Sales Alibaba Group Holding A Megacable Holdings SAB A Baidu Inc. T Michelin T Coltene Holding S NGK Spark Plug Co. S Dongsuh Companies S Okamoto Industries A Ebara Corporation S Rubis SCA A Fresenius SE & Co KGaA P Trelleborg AB T Great Eagle Holding S Yamaha Motor Co S Industrias Bachoco SA de CV P Zeon Corporation S Jardine Strategic S Zurich Insurance Group T Kingboard Holdings T
P: Purchase S: Sale
A: Add T: Trim
TO: Takeover M: Merger
Top 20 Equity Holdings % Fund Market Value
CNH Industrial 4.79% $23,308,029
Safran SA 3.61 17,540,485
BASF SE 3.42 16,656,230
Nestlé 3.12 15,184,563
Roche Holding 3.02 14,698,858
Diageo PLC 2.99 14,543,510
SCOR SE 2.69 13,097,703
Johnson & Johnson 2.66 12,917,910
Zurich Insurance Group 2.51 12,187,511
Total 2.41 11,724,661
Inchcape PLC 2.30 11,175,911
GlaxoSmithKline PLC 2.26 10,994,453
Cisco Systems 2.26 10,988,375
Alibaba Group Holding ADR 2.21 10,748,136
Berkshire Hathaway (Class B) 2.19 10,653,099
AutoZone, Inc. 2.12 10,314,584
Fresenius SE & Co KGaA 2.08 10,111,599
Unilever 2.06 10,028,664
DBS Group Holdings 2.06 10,008,789
Novartis 2.04 9,920,339
Total Equities 52.80% $256,803,408
Market Cap (US$) % Fund Market Value $10 billion 67.85% $329,998,823
$2 billion to $10 billion 19.81 96,334,796
$500 million to $2 billion 5.90 28,699,919
< $500 million 1.68 8,146,574
Total Equities 95.24% $463,180,112
Cash & Other Assets* 4.76 23,157,659
Total Fund 100.00% $486,337,771
Other Fund Information, March 31, 2021 Number of Issues: 81 Net Assets of Fund: $486.3 million 12-Month Turnover: 25%
Allocations of investments shown above reflect the Fund’s investments on 03/31/21 and may not be representative of the Fund’s current or future holdings. Data is based on the Fund’s net assets reported as of the close of business on 03/31/21, and may differ from net assets reported in the Fund’s financial statements, which reflect adjustments in accordance with accounting principles generally accepted in the United States.

TWEEDY, BROWNE GLOBAL VALUE FUND II - CURRENCY UNHEDGED As of March 31, 2021
www.tweedy .com 1 -800 -432 -4789
8 of 15
Calendar Year Returns
Global Value Fund II – Currency Unhedged
MSCI EAFE (in US$)(1)(2)
Foreign Stock Fund Average(6)
2009 (10/26 - 12/31) 2.04% 0.58% 5.30%
2010 9.43 7.75 11.94
2011 -1.73 -12.14 -13.61
2012 17.98 17.32 19.13
2013 19.64 22.78 22.75
2014 -4.50 -4.90 -5.35
2015 -5.39 -0.81 1.56
2016 2.34 1.00 0.79
2017 21.60 25.03 28.90
2018 -8.99 -13.79 -16.80
2019 13.66 22.01 22.79
2020 -0.02 7.82 13.53
2021 (through 03/31) 4.96 3.48 4.15 Cumulative Return (10/26/09 – 03/31/21)(3) 89.05% 91.73% 113.63%
Periods Ending 03/31/2021
Average Annual Total Returns
Global Value Fund II – Currency Unhedged MSCI EAFE (in US$)(1)(2)
Foreign Stock Fund Average(6)
1 year 40.87% 44.57% 59.02%
3 years 2.99 6.02 6.56
5 years 6.36 8.85 9.90
10 years 5.00 5.52 6.33
Since Inception (10/26/09)(3) 5.73 5.86 6.87
Total Annual Fund Operating Expense Ratios as of 03/31/2020 ‐ 1.39% (gross), 1.39% (net)†*
The performance shown above represents past performance and is not a guarantee of future results. Investment return and principal value of an investment will fluctuate so that an investor's shares, when redeemed, may be worth more or less than their original cost. Current performance may be lower or higher than the performance data quoted. Please visit www.tweedy.com to obtain performance data which is current to the most recent month end.
† Tweedy, Browne has voluntarily agreed, through at least July 31, 2021, to waive a portion of the Fund’s investment advisory fees and/or reimburse a portion of the Fund’s expenses to the extent necessary to keep the Fund’s expense ratio in line with the expense ratio of the Global Value Fund. (For purposes of this calculation, each Fund’s acquired fund fees and expenses, brokerage costs, interest, taxes and extraordinary expenses are disregarded, and each Fund’s expense ratio is rounded to two decimal points.) Please refer to the Fund’s prospectus for additional information on the Fund’s expenses. The performance data shown above would have been lower had fees and expenses not been waived and/or reimbursed during certain periods.
* The Fund does not impose any front-end or deferred sales charges. The expense ratios shown above reflect the inclusion of acquired fund fees and expenses (i.e., the fees and expenses attributable to investing cash balances in money market funds) and may differ from those shown in the Fund’s financial statements.
Please refer to footnotes (1) through (7) at the end of this commentary for descriptions of the Fundʹs indexes.

TWEEDY, BROWNE VALUE FUND As of March 31, 2021
www.tweedy .com 1 -800 -432 -4789
9 of 15
12
Quarterly Equity Performance Attribution
Factors with the largest impact on return, on an absolute basis, and measured in local currencies.
Banks, machinery, interactive media, insurance, and diversified financial services companies were among the leading industries, while the Fund's commercial services, food products, personal products, building products, and real estate management companies underperformed.
Top performing countries during the quarter included the U.S., France, Britain, Sweden, and Singapore, while holdings from the Netherlands, Switzerland, Mexico, and Canada underperformed during the quarter.
Top contributing holdings included CNH Industrial, Berkshire Hathaway, Wells Fargo, Alphabet, AutoZone, and Total. Declining stocks included Unilever, Nestle, Babcock International, Munich Re, Alibaba Group, and Heineken.
Fund Allocation Summary, March 31, 2021
Countries % Fund Market Value Canada 0.26% $1,122,855 Chile 0.27 1,173,157 China 5.44 23,227,725 France 11.12 47,494,303 Germany 6.30 26,886,601 Japan 1.94 8,273,354 Mexico 1.47 6,289,977 Netherlands 2.99 12,750,109 Philippines 0.34 1,434,282 Singapore 2.48 10,591,088 South Korea 1.06 4,536,974 Sweden 2.66 11,336,722 Switzerland 9.46 40,372,318 United Kingdom 14.33 61,171,848 United States 35.38 151,043,092
Total Equities 95.49% $407,704,405
Cash & Other Assets* 5.45 23,264,016
Currency Hedges -0.94 (4,022,020)
Total Fund 100.00% $426,946,401
Industry Sectors % Fund Market Value Communication Services 11.63% $49,662,237 Consumer Discretionary 6.41 27,360,776 Consumer Staples 15.71 67,080,319 Energy 3.14 13,418,108 Financials 22.23 94,908,862 Health Care 13.40 57,193,319 Industrials 16.92 72,235,968 Information Technology 2.16 9,224,704 Materials 2.36 10,092,272 Real Estate 0.00 - Utilities 1.53 6,527,842
Total Equities 95.49% $407,704,405
Cash & Other Assets* 5.45 23,264,016
Currency Hedges -0.94 (4,022,020)
Total Fund 100.00% $426,946,401
* Includes cash, Treasurys and money market funds.
Selected Purchases & Sales Alibaba Group Holding A Heineken Holding T A-Living Smart City Srvices P Jardine Strategic S BAE Systems PLC T Megacable Holdings SAB P Baidu Inc. T Munich Re S Bank of New York Mellon T Nestlé ADR T Concentrix Corp P Rubis SCA A Diageo PLC ADR T Tarkett T Fresenius SE & Co KGaA P Yamaha Motor Co S Goldman Sachs Group S Zeon Corporation S Hang Lung Group S Zurich Insurance Group T
P: Purchase S: Sale
A: Add T: Trim
TO: Takeover M: Merger
Top 20 Equity Holdings % Fund Market Value
Berkshire Hathaway 7.23% $30,856,160
Johnson & Johnson 3.85 16,445,354
CNH Industrial 3.38 14,411,895
Roche Holding 3.31 14,127,651
Nestlé 3.10 13,245,158
Diageo PLC 3.03 12,925,790
Heineken Holding 2.99 12,750,109
Alphabet Inc. (Class A) 2.97 12,684,498
AutoZone, Inc. 2.88 12,280,604
Unilever 2.69 11,495,397
Alphabet Inc. (Class C) 2.66 11,356,779
Total 2.59 11,050,188
United Overseas Bank 2.48 10,591,088
Wells Fargo & Company 2.41 10,281,778
National Western Life Ins 2.13 9,100,452
Alibaba Group Holding ADR 2.13 9,081,670
Safran SA 2.11 9,018,343
3M Co. 2.09 8,907,596
Fresenius SE & Co KGaA 2.05 8,734,743
Henkel KGaA 1.96 8,377,045
Total Equities 58.02% $247,722,297
Market Cap (US$) % Fund Market Value > $10 billion 78.26% $334,137,090
$2 billion to $10 billion 13.42 57,312,976
$500 million to $2 billion 3.81 16,254,339
< $500 million 0.00 -
Total Equities 95.49% $407,704,405
Cash & Other Assets* 5.45 23,264,016
Currency Hedges -0.94 (4,022,020)
Total Fund 100.00% $426,946,401
Other Fund Information, March 31, 2021 Number of Issues: 64 Net Assets of Fund: $426.9 million 12-Month Turnover: 18%
Allocations of investments shown above reflect the Fund’s investments on 03/31/21 and may not be representative of the Fund’s current or future holdings. Data is based on the Fund’s net assets reported as of the close of business on 03/31/21, and may differ from net assets reported in the Fund’s financial statements, which reflect adjustments in accordance with accounting principles generally accepted in the United States.

TWEEDY, BROWNE VALUE FUND As of March 31, 2021
www.tweedy .com 1 -800 -432 -4789
10 of 15
Calendar Year Returns
Value Fund S&P 500 (12/08/93-12/31/06)/
MSCI World Index (Hedged to US$) (01/01/07-present)(1)(4) 1993 (12/08 – 12/31) -0.60% 0.18% 1994 -0.56 1.32 1995 36.21 37.59 1996 22.45 22.97 1997 38.87 33.38 1998 9.59 28.58 1999 2.00 21.04 2000 14.45 -9.13 2001 -0.09 -11.88 2002 -14.91 -22.09 2003 23.24 28.69 2004 9.43 10.88 2005 2.30 4.91 2006 11.63 15.79 2007 0.60 5.61 2008 -24.37 -38.45 2009 27.60 26.31 2010 10.51 10.46 2011 -1.75 -5.46 2012 15.45 15.77 2013 22.68 28.69 2014 4.02 9.71 2015 -5.39 2.01 2016 9.69 9.39 2017 16.46 19.13 2018 -6.39 -6.59 2019 16.05 28.43 2020 -1.99 14.27 2021 (through 03/31) 7.72 6.16 Cumulative Return (12/08/93 – 03/31/21)(3) 725.29% 945.01%
Periods Ending 03/31/2021
Average Annual Total Returns Value Fund
S&P 500 (12/08/93-12/31/06)/ MSCI World Index (Hedged to US$) (01/01/07-present (1)(4)
1 year 35.58% 51.26% 3 years 5.66 14.08 5 years 8.27 14.07 10 years 6.92 11.19 15 years 5.87 7.63 20 years 5.42 6.70 Since Inception (12/08/93)(3) 8.03 8.97
Total Annual Fund Operating Expense Ratios as of 03/31/20 – 1.39% (gross), 1.37% (net) †*
The performance shown above represents past performance and is not a guarantee of future results. Investment return and principal value of an investment will fluctuate so that an investor's shares, when redeemed, may be worth more or less than their original cost. Current performance may be lower or higher than the performance data quoted. Please visit www.tweedy.com to obtain performance data which is current to the most recent month end. † Tweedy, Browne has voluntarily agreed, through at least July 31, 2021, to waive a portion of the Fund’s investment advisory fees and/or reimburse a portion of the Fund’s expenses to the extent necessary to keep the Fund’s expense ratio in line with the expense ratio of the Global Value Fund. (For purposes of this calculation, each Fund’s acquired fund fees and expenses, brokerage costs, interest, taxes and extraordinary expenses are disregarded, and each Fund’s expense ratio is rounded to two decimal points.) Please refer to the Fund’s prospectus for additional information on the Fund’s expenses. The performance data shown above would have been lower had fees and expenses not been waived and/or reimbursed during certain periods. * The Fund does not impose any front-end or deferred sales charges. The expense ratios shown above reflect the inclusion of acquired fund fees and expenses (i.e., the fees and expenses attributable to investing cash balances in money market funds) and may differ from those shown in the Fund’s financial statements.
Please refer to footnotes (1) through (7) at the end of this commentary for descriptions of the Fundʹs indexes.
TWEEDY, BROWNE WORLDWIDE HIGH DIVIDEND YIELD VALUE FUND As of March 31, 2021
www.tweedy .com 1 -800 -432 -4789
11 of 15
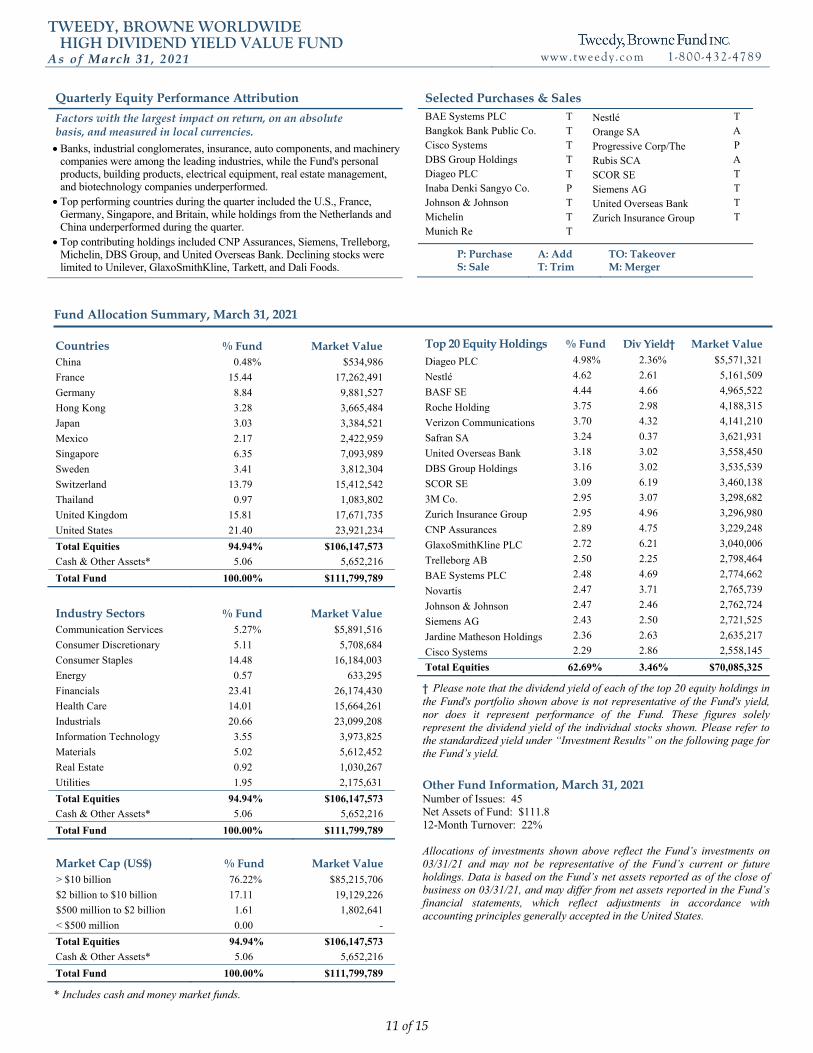
Quarterly Equity Performance Attribution
Factors with the largest impact on return, on an absolute basis, and measured in local currencies. Banks, industrial conglomerates, insurance, auto components, and machinery
companies were among the leading industries, while the Fund's personal products, building products, electrical equipment, real estate management, and biotechnology companies underperformed.
Top performing countries during the quarter included the U.S., France, Germany, Singapore, and Britain, while holdings from the Netherlands and China underperformed during the quarter.
Top contributing holdings included CNP Assurances, Siemens, Trelleborg, Michelin, DBS Group, and United Overseas Bank. Declining stocks were limited to Unilever, GlaxoSmithKline, Tarkett, and Dali Foods.
Fund Allocation Summary, March 31, 2021
Countries % Fund Market Value China 0.48% $534,986
France 15.44 17,262,491
Germany 8.84 9,881,527
Hong Kong 3.28 3,665,484
Japan 3.03 3,384,521
Mexico 2.17 2,422,959
Singapore 6.35 7,093,989
Sweden 3.41 3,812,304
Switzerland 13.79 15,412,542
Thailand 0.97 1,083,802
United Kingdom 15.81 17,671,735
United States 21.40 23,921,234
Total Equities 94.94% $106,147,573
Cash & Other Assets* 5.06 5,652,216
Total Fund 100.00% $111,799,789
Industry Sectors % Fund Market Value Communication Services 5.27% $5,891,516
Consumer Discretionary 5.11 5,708,684
Consumer Staples 14.48 16,184,003
Energy 0.57 633,295
Financials 23.41 26,174,430
Health Care 14.01 15,664,261
Industrials 20.66 23,099,208
Information Technology 3.55 3,973,825
Materials 5.02 5,612,452
Real Estate 0.92 1,030,267
Utilities 1.95 2,175,631
Total Equities 94.94% $106,147,573
Cash & Other Assets* 5.06 5,652,216
Total Fund 100.00% $111,799,789
Market Cap (US$) % Fund Market Value > $10 billion 76.22% $85,215,706
$2 billion to $10 billion 17.11 19,129,226
$500 million to $2 billion 1.61 1,802,641
< $500 million 0.00 -
Total Equities 94.94% $106,147,573
Cash & Other Assets* 5.06 5,652,216
Total Fund 100.00% $111,799,789
* Includes cash and money market funds.
Selected Purchases & Sales BAE Systems PLC T Nestlé T Bangkok Bank Public Co. T Orange SA A Cisco Systems T Progressive Corp/The P DBS Group Holdings T Rubis SCA A Diageo PLC T SCOR SE T Inaba Denki Sangyo Co. P Siemens AG T Johnson & Johnson T United Overseas Bank T Michelin T Zurich Insurance Group T Munich Re T
P: Purchase S: Sale
A: Add T: Trim
TO: Takeover M: Merger
Top 20 Equity Holdings % Fund Div Yield† Market Value
Diageo PLC 4.98% 2.36% $5,571,321
Nestlé 4.62 2.61 5,161,509
BASF SE 4.44 4.66 4,965,522
Roche Holding 3.75 2.98 4,188,315
Verizon Communications 3.70 4.32 4,141,210
Safran SA 3.24 0.37 3,621,931
United Overseas Bank 3.18 3.02 3,558,450
DBS Group Holdings 3.16 3.02 3,535,539
SCOR SE 3.09 6.19 3,460,138
3M Co. 2.95 3.07 3,298,682
Zurich Insurance Group 2.95 4.96 3,296,980
CNP Assurances 2.89 4.75 3,229,248
GlaxoSmithKline PLC 2.72 6.21 3,040,006
Trelleborg AB 2.50 2.25 2,798,464
BAE Systems PLC 2.48 4.69 2,774,662
Novartis 2.47 3.71 2,765,739
Johnson & Johnson 2.47 2.46 2,762,724
Siemens AG 2.43 2.50 2,721,525
Jardine Matheson Holdings 2.36 2.63 2,635,217
Cisco Systems 2.29 2.86 2,558,145
Total Equities 62.69% 3.46% $70,085,325
† Please note that the dividend yield of each of the top 20 equity holdings in the Fund's portfolio shown above is not representative of the Fund's yield, nor does it represent performance of the Fund. These figures solely represent the dividend yield of the individual stocks shown. Please refer to the standardized yield under “Investment Results” on the following page for the Fund’s yield.
Other Fund Information, March 31, 2021 Number of Issues: 45 Net Assets of Fund: $111.8 12-Month Turnover: 22% Allocations of investments shown above reflect the Fund’s investments on 03/31/21 and may not be representative of the Fund’s current or future holdings. Data is based on the Fund’s net assets reported as of the close of business on 03/31/21, and may differ from net assets reported in the Fund’s financial statements, which reflect adjustments in accordance with accounting principles generally accepted in the United States.
TWEEDY, BROWNE WORLDWIDE HIGH DIVIDEND YIELD VALUE FUND As of March 31, 2021
www.tweedy .com 1 -800 -432 -4789
12 of 15
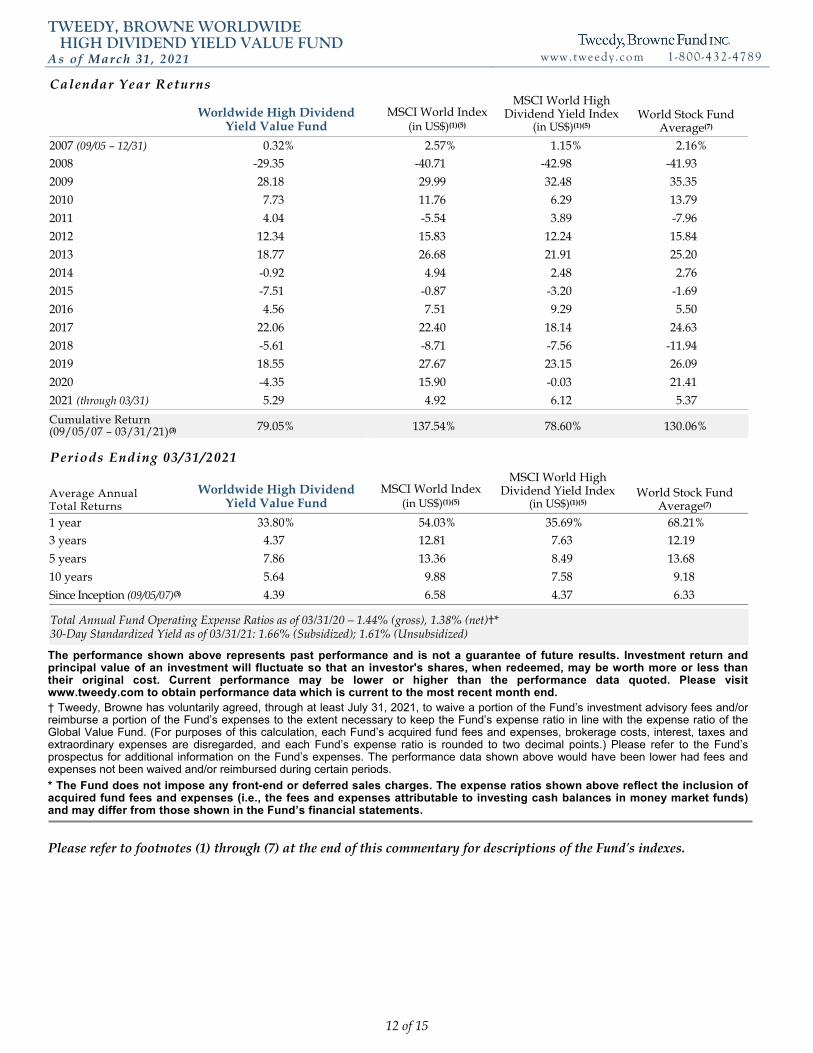
Calendar Year Returns
Worldwide High Dividend Yield Value Fund
MSCI World Index (in US$)(1)(5)
MSCI World High Dividend Yield Index
(in US$)(1)(5) World Stock Fund
Average(7) 2007 (09/05 – 12/31) 0.32% 2.57% 1.15% 2.16% 2008 -29.35 -40.71 -42.98 -41.93
2009 28.18 29.99 32.48 35.35
2010 7.73 11.76 6.29 13.79
2011 4.04 -5.54 3.89 -7.96
2012 12.34 15.83 12.24 15.84
2013 18.77 26.68 21.91 25.20
2014 -0.92 4.94 2.48 2.76
2015 -7.51 -0.87 -3.20 -1.69
2016 4.56 7.51 9.29 5.50
2017 22.06 22.40 18.14 24.63
2018 -5.61 -8.71 -7.56 -11.94
2019 18.55 27.67 23.15 26.09
2020 -4.35 15.90 -0.03 21.41
2021 (through 03/31) 5.29 4.92 6.12 5.37 Cumulative Return (09/05/07 – 03/31/21)(3) 79.05% 137.54% 78.60% 130.06%
Periods Ending 03/31/2021
Average Annual Total Returns
Worldwide High Dividend Yield Value Fund
MSCI World Index (in US$)(1)(5)
MSCI World High Dividend Yield Index
(in US$)(1)(5) World Stock Fund
Average(7) 1 year 33.80% 54.03% 35.69% 68.21% 3 years 4.37 12.81 7.63 12.19
5 years 7.86 13.36 8.49 13.68
10 years 5.64 9.88 7.58 9.18
Since Inception (09/05/07)(3) 4.39 6.58 4.37 6.33
Total Annual Fund Operating Expense Ratios as of 03/31/20 – 1.44% (gross), 1.38% (net)†* 30‐Day Standardized Yield as of 03/31/21: 1.66% (Subsidized); 1.61% (Unsubsidized)
The performance shown above represents past performance and is not a guarantee of future results. Investment return and principal value of an investment will fluctuate so that an investor's shares, when redeemed, may be worth more or less than their original cost. Current performance may be lower or higher than the performance data quoted. Please visit www.tweedy.com to obtain performance data which is current to the most recent month end. † Tweedy, Browne has voluntarily agreed, through at least July 31, 2021, to waive a portion of the Fund’s investment advisory fees and/or reimburse a portion of the Fund’s expenses to the extent necessary to keep the Fund’s expense ratio in line with the expense ratio of the Global Value Fund. (For purposes of this calculation, each Fund’s acquired fund fees and expenses, brokerage costs, interest, taxes and extraordinary expenses are disregarded, and each Fund’s expense ratio is rounded to two decimal points.) Please refer to the Fund’s prospectus for additional information on the Fund’s expenses. The performance data shown above would have been lower had fees and expenses not been waived and/or reimbursed during certain periods.
* The Fund does not impose any front-end or deferred sales charges. The expense ratios shown above reflect the inclusion of acquired fund fees and expenses (i.e., the fees and expenses attributable to investing cash balances in money market funds) and may differ from those shown in the Fund’s financial statements.
Please refer to footnotes (1) through (7) at the end of this commentary for descriptions of the Fundʹs indexes.
Notes
1st Quarter 2021
13 of 15
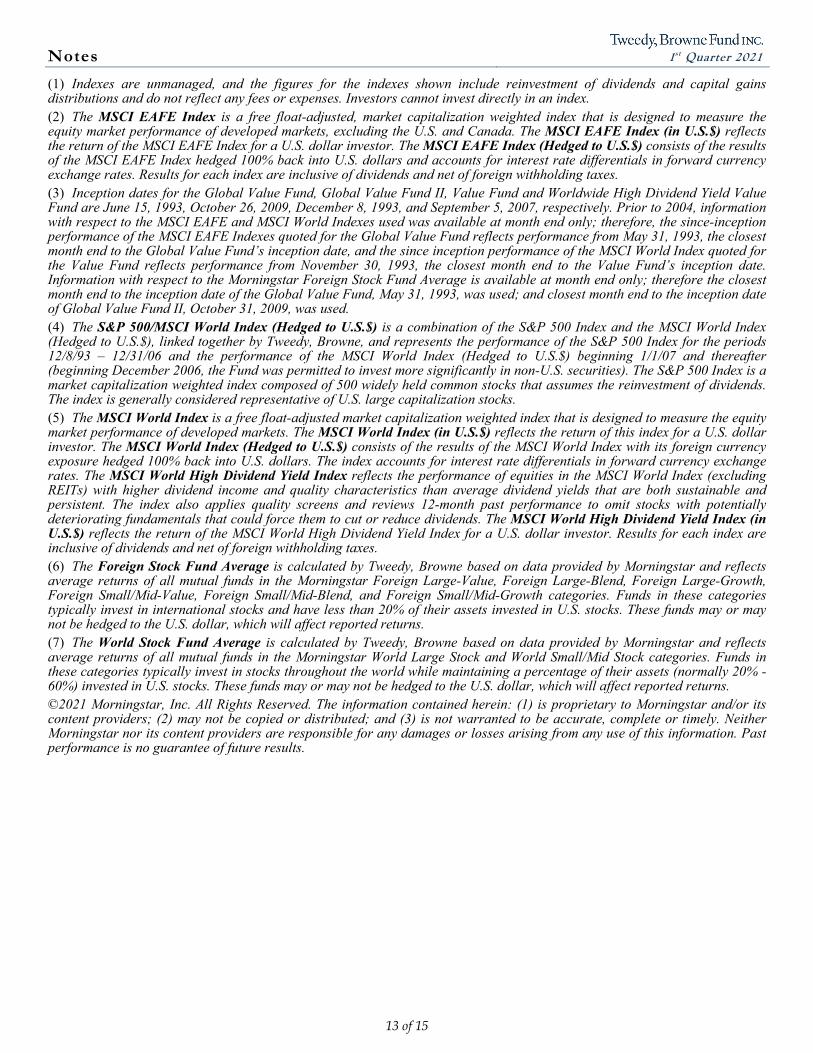
(1) Indexes are unmanaged, and the figures for the indexes shown include reinvestment of dividends and capital gains distributions and do not reflect any fees or expenses. Investors cannot invest directly in an index. (2) The MSCI EAFE Index is a free float-adjusted, market capitalization weighted index that is designed to measure the equity market performance of developed markets, excluding the U.S. and Canada. The MSCI EAFE Index (in U.S.$) reflects the return of the MSCI EAFE Index for a U.S. dollar investor. The MSCI EAFE Index (Hedged to U.S.$) consists of the results of the MSCI EAFE Index hedged 100% back into U.S. dollars and accounts for interest rate differentials in forward currency exchange rates. Results for each index are inclusive of dividends and net of foreign withholding taxes. (3) Inception dates for the Global Value Fund, Global Value Fund II, Value Fund and Worldwide High Dividend Yield Value Fund are June 15, 1993, October 26, 2009, December 8, 1993, and September 5, 2007, respectively. Prior to 2004, information with respect to the MSCI EAFE and MSCI World Indexes used was available at month end only; therefore, the since-inception performance of the MSCI EAFE Indexes quoted for the Global Value Fund reflects performance from May 31, 1993, the closest month end to the Global Value Fund’s inception date, and the since inception performance of the MSCI World Index quoted for the Value Fund reflects performance from November 30, 1993, the closest month end to the Value Fund’s inception date. Information with respect to the Morningstar Foreign Stock Fund Average is available at month end only; therefore the closest month end to the inception date of the Global Value Fund, May 31, 1993, was used; and closest month end to the inception date of Global Value Fund II, October 31, 2009, was used. (4) The S&P 500/MSCI World Index (Hedged to U.S.$) is a combination of the S&P 500 Index and the MSCI World Index (Hedged to U.S.$), linked together by Tweedy, Browne, and represents the performance of the S&P 500 Index for the periods 12/8/93 – 12/31/06 and the performance of the MSCI World Index (Hedged to U.S.$) beginning 1/1/07 and thereafter (beginning December 2006, the Fund was permitted to invest more significantly in non-U.S. securities). The S&P 500 Index is a market capitalization weighted index composed of 500 widely held common stocks that assumes the reinvestment of dividends. The index is generally considered representative of U.S. large capitalization stocks. (5) The MSCI World Index is a free float-adjusted market capitalization weighted index that is designed to measure the equity market performance of developed markets. The MSCI World Index (in U.S.$) reflects the return of this index for a U.S. dollar investor. The MSCI World Index (Hedged to U.S.$) consists of the results of the MSCI World Index with its foreign currency exposure hedged 100% back into U.S. dollars. The index accounts for interest rate differentials in forward currency exchange rates. The MSCI World High Dividend Yield Index reflects the performance of equities in the MSCI World Index (excluding REITs) with higher dividend income and quality characteristics than average dividend yields that are both sustainable and persistent. The index also applies quality screens and reviews 12-month past performance to omit stocks with potentially deteriorating fundamentals that could force them to cut or reduce dividends. The MSCI World High Dividend Yield Index (in U.S.$) reflects the return of the MSCI World High Dividend Yield Index for a U.S. dollar investor. Results for each index are inclusive of dividends and net of foreign withholding taxes. (6) The Foreign Stock Fund Average is calculated by Tweedy, Browne based on data provided by Morningstar and reflects average returns of all mutual funds in the Morningstar Foreign Large-Value, Foreign Large-Blend, Foreign Large-Growth, Foreign Small/Mid-Value, Foreign Small/Mid-Blend, and Foreign Small/Mid-Growth categories. Funds in these categories typically invest in international stocks and have less than 20% of their assets invested in U.S. stocks. These funds may or may not be hedged to the U.S. dollar, which will affect reported returns. (7) The World Stock Fund Average is calculated by Tweedy, Browne based on data provided by Morningstar and reflects average returns of all mutual funds in the Morningstar World Large Stock and World Small/Mid Stock categories. Funds in these categories typically invest in stocks throughout the world while maintaining a percentage of their assets (normally 20% - 60%) invested in U.S. stocks. These funds may or may not be hedged to the U.S. dollar, which will affect reported returns. ©2021 Morningstar, Inc. All Rights Reserved. The information contained herein: (1) is proprietary to Morningstar and/or its content providers; (2) may not be copied or distributed; and (3) is not warranted to be accurate, complete or timely. Neither Morningstar nor its content providers are responsible for any damages or losses arising from any use of this information. Past performance is no guarantee of future results.
Notes
1st Quarter 2021
14 of 15
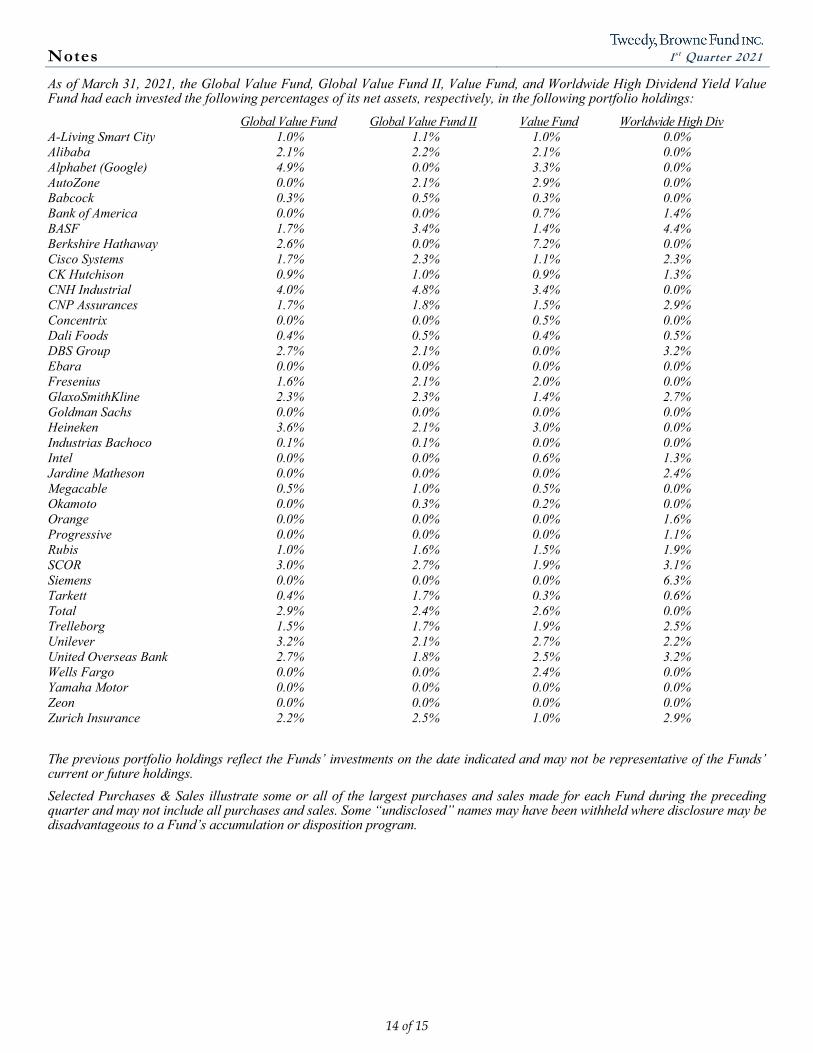
As of March 31, 2021, the Global Value Fund, Global Value Fund II, Value Fund, and Worldwide High Dividend Yield Value Fund had each invested the following percentages of its net assets, respectively, in the following portfolio holdings:
Global Value Fund Global Value Fund II Value Fund Worldwide High Div A-Living Smart City 1.0% 1.1% 1.0% 0.0% Alibaba 2.1% 2.2% 2.1% 0.0% Alphabet (Google) 4.9% 0.0% 3.3% 0.0% AutoZone 0.0% 2.1% 2.9% 0.0% Babcock 0.3% 0.5% 0.3% 0.0% Bank of America 0.0% 0.0% 0.7% 1.4% BASF 1.7% 3.4% 1.4% 4.4% Berkshire Hathaway 2.6% 0.0% 7.2% 0.0% Cisco Systems 1.7% 2.3% 1.1% 2.3% CK Hutchison 0.9% 1.0% 0.9% 1.3% CNH Industrial 4.0% 4.8% 3.4% 0.0% CNP Assurances 1.7% 1.8% 1.5% 2.9% Concentrix 0.0% 0.0% 0.5% 0.0% Dali Foods 0.4% 0.5% 0.4% 0.5% DBS Group 2.7% 2.1% 0.0% 3.2% Ebara 0.0% 0.0% 0.0% 0.0% Fresenius 1.6% 2.1% 2.0% 0.0% GlaxoSmithKline 2.3% 2.3% 1.4% 2.7% Goldman Sachs 0.0% 0.0% 0.0% 0.0% Heineken 3.6% 2.1% 3.0% 0.0% Industrias Bachoco 0.1% 0.1% 0.0% 0.0% Intel 0.0% 0.0% 0.6% 1.3% Jardine Matheson 0.0% 0.0% 0.0% 2.4% Megacable 0.5% 1.0% 0.5% 0.0% Okamoto 0.0% 0.3% 0.2% 0.0% Orange 0.0% 0.0% 0.0% 1.6% Progressive 0.0% 0.0% 0.0% 1.1% Rubis 1.0% 1.6% 1.5% 1.9% SCOR 3.0% 2.7% 1.9% 3.1% Siemens 0.0% 0.0% 0.0% 6.3% Tarkett 0.4% 1.7% 0.3% 0.6% Total 2.9% 2.4% 2.6% 0.0% Trelleborg 1.5% 1.7% 1.9% 2.5% Unilever 3.2% 2.1% 2.7% 2.2% United Overseas Bank 2.7% 1.8% 2.5% 3.2% Wells Fargo 0.0% 0.0% 2.4% 0.0% Yamaha Motor 0.0% 0.0% 0.0% 0.0% Zeon 0.0% 0.0% 0.0% 0.0% Zurich Insurance 2.2% 2.5% 1.0% 2.9%
The previous portfolio holdings reflect the Funds’ investments on the date indicated and may not be representative of the Funds’ current or future holdings.
Selected Purchases & Sales illustrate some or all of the largest purchases and sales made for each Fund during the preceding quarter and may not include all purchases and sales. Some “undisclosed” names may have been withheld where disclosure may be disadvantageous to a Fund’s accumulation or disposition program.
Notes
1st Quarter 2021
15 of 15
Enterprise Value (or EV) is a measure of a company’s total value (market value of common stock + market value of preferred equity + market value of debt + minority interest – cash and investments). Earnings before interest, taxes and amortization (or EBITA) is used to gauge a company’s operating profitability (earnings before tax + interest expense + amortization expense). Return on equity (or ROE) is a measure of financial performance calculated by dividing net income by shareholders’ equity. The Shiller Cyclically Adjusted Price Earnings (CAPE) ratio is a valuation metric that measures price divided by the average of ten years of earnings, adjusted for inflation. Current and future portfolio holdings are subject to risk. The securities of small, less well-known companies may be more volatile than those of larger companies. In addition, investing in foreign securities involves additional risks beyond the risks of investing in securities of U.S. markets. These risks include economic and political considerations not typically found in U.S. markets, including currency fluctuation, political uncertainty and different financial standards, regulatory environments, and overall market and economic factors in the countries. Force majeure events such as pandemics and natural disasters are likely to increase the risks inherent in investments and could have a broad negative impact on the world economy and business activity in general. Value investing involves the risk that the market will not recognize a security's intrinsic value for a long time, or that a security thought to be undervalued may actually be appropriately priced when purchased. Dividends are not guaranteed, and a company currently paying dividends may cease paying dividends at any time. Diversification does not guarantee a profit or protect against a loss in declining markets. Investors should refer to the prospectus for a description of risk factors associated with investments in securities held by the Funds.
Although the practice of hedging against currency exchange rate changes utilized by the Global Value Fund and Value Fund reduces the risk of loss from exchange rate movements, it also reduces the ability of the Funds to gain from favorable exchange rate movements when the U.S. dollar declines against the currencies in which the Funds’ investments are denominated and in some interest rate environments may impose out-of-pocket costs on the Funds.
Tweedy, Browne Global Value Fund, Tweedy, Browne Global Value Fund II – Currency Unhedged, Tweedy, Browne Value Fund, and Tweedy, Browne Worldwide High Dividend Yield Value Fund are distributed by AMG Distributors, Inc., Member FINRA/SIPC.
This material must be preceded or accompanied by a current prospectus for Tweedy, Browne Fund Inc. You should consider the Funds’ investment objectives, risks, charges and expenses carefully before investing. The prospectus contains this and other information about the Funds. The prospectus should be read carefully before investing.