1QFY18 Earnings Full-Time Analysis Non BFSI , NII , PAT...
12
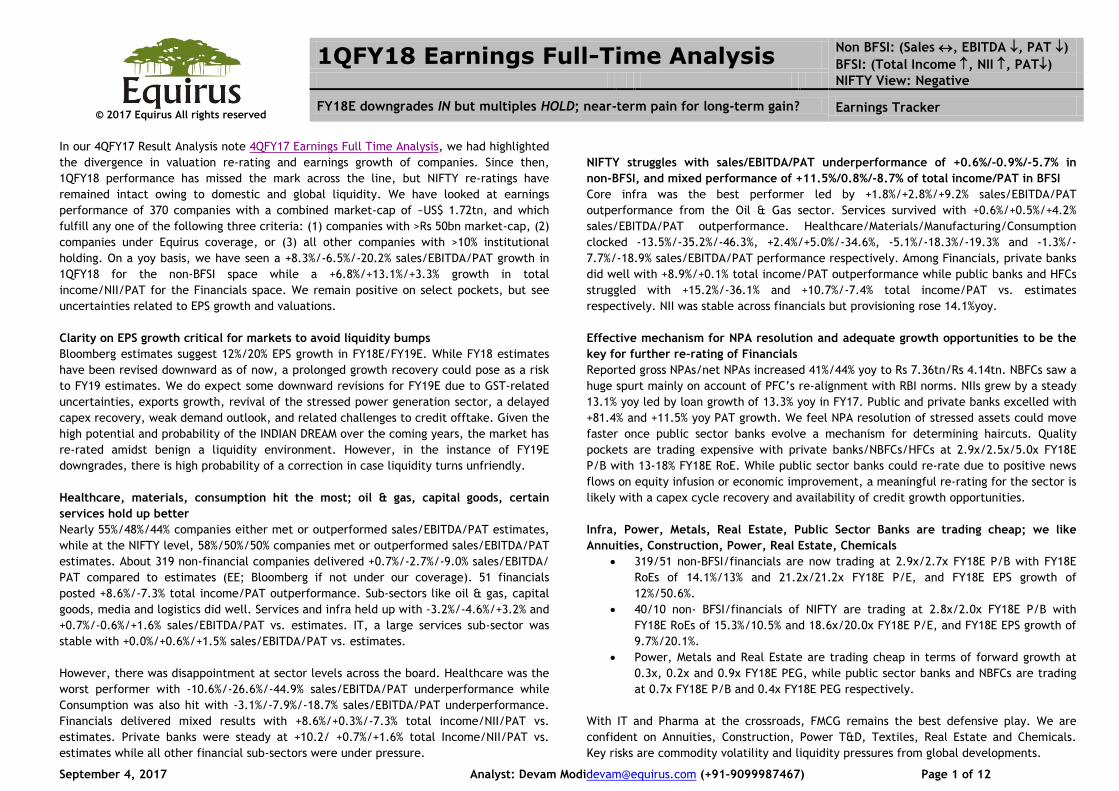
September 4, 2017 Analyst: Devam Modi[email protected] (+91-9099987467) Page 1 of 12 © 2017 Equirus All rights reserved 1QFY18 Earnings Full-Time Analysis Non BFSI: (Sales , EBITDA , PAT ) BFSI: (Total Income , NII , PAT) NIFTY View: Negative FY18E downgrades IN but multiples HOLD; near-term pain for long-term gain? Earnings Tracker In our 4QFY17 Result Analysis note 4QFY17 Earnings Full Time Analysis, we had highlighted the divergence in valuation re-rating and earnings growth of companies. Since then, 1QFY18 performance has missed the mark across the line, but NIFTY re-ratings have remained intact owing to domestic and global liquidity. We have looked at earnings performance of 370 companies with a combined market-cap of ~US$ 1.72tn, and which fulfill any one of the following three criteria: (1) companies with >Rs 50bn market-cap, (2) companies under Equirus coverage, or (3) all other companies with >10% institutional holding. On a yoy basis, we have seen a +8.3%/-6.5%/-20.2% sales/EBITDA/PAT growth in 1QFY18 for the non-BFSI space while a +6.8%/+13.1%/+3.3% growth in total income/NII/PAT for the Financials space. We remain positive on select pockets, but see uncertainties related to EPS growth and valuations. Clarity on EPS growth critical for markets to avoid liquidity bumps Bloomberg estimates suggest 12%/20% EPS growth in FY18E/FY19E. While FY18 estimates have been revised downward as of now, a prolonged growth recovery could pose as a risk to FY19 estimates. We do expect some downward revisions for FY19E due to GST-related uncertainties, exports growth, revival of the stressed power generation sector, a delayed capex recovery, weak demand outlook, and related challenges to credit offtake. Given the high potential and probability of the INDIAN DREAM over the coming years, the market has re-rated amidst benign a liquidity environment. However, in the instance of FY19E downgrades, there is high probability of a correction in case liquidity turns unfriendly. Healthcare, materials, consumption hit the most; oil & gas, capital goods, certain services hold up better Nearly 55%/48%/44% companies either met or outperformed sales/EBITDA/PAT estimates, while at the NIFTY level, 58%/50%/50% companies met or outperformed sales/EBITDA/PAT estimates. About 319 non-financial companies delivered +0.7%/-2.7%/-9.0% sales/EBITDA/ PAT compared to estimates (EE; Bloomberg if not under our coverage). 51 financials posted +8.6%/-7.3% total income/PAT outperformance. Sub-sectors like oil & gas, capital goods, media and logistics did well. Services and infra held up with -3.2%/-4.6%/+3.2% and +0.7%/-0.6%/+1.6% sales/EBITDA/PAT vs. estimates. IT, a large services sub-sector was stable with +0.0%/+0.6%/+1.5% sales/EBITDA/PAT vs. estimates. However, there was disappointment at sector levels across the board. Healthcare was the worst performer with -10.6%/-26.6%/-44.9% sales/EBITDA/PAT underperformance while Consumption was also hit with -3.1%/-7.9%/-18.7% sales/EBITDA/PAT underperformance. Financials delivered mixed results with +8.6%/+0.3%/-7.3% total income/NII/PAT vs. estimates. Private banks were steady at +10.2/ +0.7%/+1.6% total Income/NII/PAT vs. estimates while all other financial sub-sectors were under pressure. NIFTY struggles with sales/EBITDA/PAT underperformance of +0.6%/-0.9%/-5.7% in non-BFSI, and mixed performance of +11.5%/0.8%/-8.7% of total income/PAT in BFSI Core infra was the best performer led by +1.8%/+2.8%/+9.2% sales/EBITDA/PAT outperformance from the Oil & Gas sector. Services survived with +0.6%/+0.5%/+4.2% sales/EBITDA/PAT outperformance. Healthcare/Materials/Manufacturing/Consumption clocked -13.5%/-35.2%/-46.3%, +2.4%/+5.0%/-34.6%, -5.1%/-18.3%/-19.3% and -1.3%/- 7.7%/-18.9% sales/EBITDA/PAT performance respectively. Among Financials, private banks did well with +8.9%/+0.1% total income/PAT outperformance while public banks and HFCs struggled with +15.2%/-36.1% and +10.7%/-7.4% total income/PAT vs. estimates respectively. NII was stable across financials but provisioning rose 14.1%yoy. Effective mechanism for NPA resolution and adequate growth opportunities to be the key for further re-rating of Financials Reported gross NPAs/net NPAs increased 41%/44% yoy to Rs 7.36tn/Rs 4.14tn. NBFCs saw a huge spurt mainly on account of PFC’s re-alignment with RBI norms. NIIs grew by a steady 13.1% yoy led by loan growth of 13.3% yoy in FY17. Public and private banks excelled with +81.4% and +11.5% yoy PAT growth. We feel NPA resolution of stressed assets could move faster once public sector banks evolve a mechanism for determining haircuts. Quality pockets are trading expensive with private banks/NBFCs/HFCs at 2.9x/2.5x/5.0x FY18E P/B with 13-18% FY18E RoE. While public sector banks could re-rate due to positive news flows on equity infusion or economic improvement, a meaningful re-rating for the sector is likely with a capex cycle recovery and availability of credit growth opportunities. Infra, Power, Metals, Real Estate, Public Sector Banks are trading cheap; we like Annuities, Construction, Power, Real Estate, Chemicals 319/51 non-BFSI/financials are now trading at 2.9x/2.7x FY18E P/B with FY18E RoEs of 14.1%/13% and 21.2x/21.2x FY18E P/E, and FY18E EPS growth of 12%/50.6%. 40/10 non- BFSI/financials of NIFTY are trading at 2.8x/2.0x FY18E P/B with FY18E RoEs of 15.3%/10.5% and 18.6x/20.0x FY18E P/E, and FY18E EPS growth of 9.7%/20.1%. Power, Metals and Real Estate are trading cheap in terms of forward growth at 0.3x, 0.2x and 0.9x FY18E PEG, while public sector banks and NBFCs are trading at 0.7x FY18E P/B and 0.4x FY18E PEG respectively. With IT and Pharma at the crossroads, FMCG remains the best defensive play. We are confident on Annuities, Construction, Power T&D, Textiles, Real Estate and Chemicals. Key risks are commodity volatility and liquidity pressures from global developments.
Transcript of 1QFY18 Earnings Full-Time Analysis Non BFSI , NII , PAT...
September 4, 2017 Analyst: Devam [email protected] (+91-9099987467) Page 1 of 12
© 2017 Equirus All rights reserved
1QFY18 Earnings Full-Time Analysis Non BFSI: (Sales , EBITDA , PAT )
BFSI: (Total Income , NII , PAT) NIFTY View: Negative
FY18E downgrades IN but multiples HOLD; near-term pain for long-term gain? Earnings Tracker
In our 4QFY17 Result Analysis note 4QFY17 Earnings Full Time Analysis, we had highlighted
the divergence in valuation re-rating and earnings growth of companies. Since then,
1QFY18 performance has missed the mark across the line, but NIFTY re-ratings have
remained intact owing to domestic and global liquidity. We have looked at earnings
performance of 370 companies with a combined market-cap of ~US$ 1.72tn, and which
fulfill any one of the following three criteria: (1) companies with >Rs 50bn market-cap, (2)
companies under Equirus coverage, or (3) all other companies with >10% institutional
holding. On a yoy basis, we have seen a +8.3%/-6.5%/-20.2% sales/EBITDA/PAT growth in
1QFY18 for the non-BFSI space while a +6.8%/+13.1%/+3.3% growth in total
income/NII/PAT for the Financials space. We remain positive on select pockets, but see
uncertainties related to EPS growth and valuations.
Clarity on EPS growth critical for markets to avoid liquidity bumps
Bloomberg estimates suggest 12%/20% EPS growth in FY18E/FY19E. While FY18 estimates
have been revised downward as of now, a prolonged growth recovery could pose as a risk
to FY19 estimates. We do expect some downward revisions for FY19E due to GST-related
uncertainties, exports growth, revival of the stressed power generation sector, a delayed
capex recovery, weak demand outlook, and related challenges to credit offtake. Given the
high potential and probability of the INDIAN DREAM over the coming years, the market has
re-rated amidst benign a liquidity environment. However, in the instance of FY19E
downgrades, there is high probability of a correction in case liquidity turns unfriendly.
Healthcare, materials, consumption hit the most; oil & gas, capital goods, certain
services hold up better
Nearly 55%/48%/44% companies either met or outperformed sales/EBITDA/PAT estimates,
while at the NIFTY level, 58%/50%/50% companies met or outperformed sales/EBITDA/PAT
estimates. About 319 non-financial companies delivered +0.7%/-2.7%/-9.0% sales/EBITDA/
PAT compared to estimates (EE; Bloomberg if not under our coverage). 51 financials
posted +8.6%/-7.3% total income/PAT outperformance. Sub-sectors like oil & gas, capital
goods, media and logistics did well. Services and infra held up with -3.2%/-4.6%/+3.2% and
+0.7%/-0.6%/+1.6% sales/EBITDA/PAT vs. estimates. IT, a large services sub-sector was
stable with +0.0%/+0.6%/+1.5% sales/EBITDA/PAT vs. estimates.
However, there was disappointment at sector levels across the board. Healthcare was the
worst performer with -10.6%/-26.6%/-44.9% sales/EBITDA/PAT underperformance while
Consumption was also hit with -3.1%/-7.9%/-18.7% sales/EBITDA/PAT underperformance.
Financials delivered mixed results with +8.6%/+0.3%/-7.3% total income/NII/PAT vs.
estimates. Private banks were steady at +10.2/ +0.7%/+1.6% total Income/NII/PAT vs.
estimates while all other financial sub-sectors were under pressure.
NIFTY struggles with sales/EBITDA/PAT underperformance of +0.6%/-0.9%/-5.7% in
non-BFSI, and mixed performance of +11.5%/0.8%/-8.7% of total income/PAT in BFSI
Core infra was the best performer led by +1.8%/+2.8%/+9.2% sales/EBITDA/PAT
outperformance from the Oil & Gas sector. Services survived with +0.6%/+0.5%/+4.2%
sales/EBITDA/PAT outperformance. Healthcare/Materials/Manufacturing/Consumption
clocked -13.5%/-35.2%/-46.3%, +2.4%/+5.0%/-34.6%, -5.1%/-18.3%/-19.3% and -1.3%/-
7.7%/-18.9% sales/EBITDA/PAT performance respectively. Among Financials, private banks
did well with +8.9%/+0.1% total income/PAT outperformance while public banks and HFCs
struggled with +15.2%/-36.1% and +10.7%/-7.4% total income/PAT vs. estimates
respectively. NII was stable across financials but provisioning rose 14.1%yoy.
Effective mechanism for NPA resolution and adequate growth opportunities to be the
key for further re-rating of Financials
Reported gross NPAs/net NPAs increased 41%/44% yoy to Rs 7.36tn/Rs 4.14tn. NBFCs saw a
huge spurt mainly on account of PFC’s re-alignment with RBI norms. NIIs grew by a steady
13.1% yoy led by loan growth of 13.3% yoy in FY17. Public and private banks excelled with
+81.4% and +11.5% yoy PAT growth. We feel NPA resolution of stressed assets could move
faster once public sector banks evolve a mechanism for determining haircuts. Quality
pockets are trading expensive with private banks/NBFCs/HFCs at 2.9x/2.5x/5.0x FY18E
P/B with 13-18% FY18E RoE. While public sector banks could re-rate due to positive news
flows on equity infusion or economic improvement, a meaningful re-rating for the sector is
likely with a capex cycle recovery and availability of credit growth opportunities.
Infra, Power, Metals, Real Estate, Public Sector Banks are trading cheap; we like
Annuities, Construction, Power, Real Estate, Chemicals
319/51 non-BFSI/financials are now trading at 2.9x/2.7x FY18E P/B with FY18E
RoEs of 14.1%/13% and 21.2x/21.2x FY18E P/E, and FY18E EPS growth of
12%/50.6%.
40/10 non- BFSI/financials of NIFTY are trading at 2.8x/2.0x FY18E P/B with
FY18E RoEs of 15.3%/10.5% and 18.6x/20.0x FY18E P/E, and FY18E EPS growth of
9.7%/20.1%.
Power, Metals and Real Estate are trading cheap in terms of forward growth at
0.3x, 0.2x and 0.9x FY18E PEG, while public sector banks and NBFCs are trading
at 0.7x FY18E P/B and 0.4x FY18E PEG respectively.
With IT and Pharma at the crossroads, FMCG remains the best defensive play. We are
confident on Annuities, Construction, Power T&D, Textiles, Real Estate and Chemicals.
Key risks are commodity volatility and liquidity pressures from global developments.

1QFY18 Earnings Report Card Absolute – NA Relative – NA
September 4, 2017 Analyst: Devam Modi [email protected] (+91-9099987467) Page 2 of 12
Exhibit 1: Sales were affected across sectors, except Financials and Manufacturing; on the profitability front, Services and Core Infra outperformed relatively
In Rs. Bn # of companies NIFTY Market Cap Act Sales Est. Sales %age Act EBITDA Est. EBITDA %age Act PAT Est PAT %age
Services 52 6 14,521 1,274 1,317 -3.2% 246 258 -4.6% 190 185 2.8%
Healthcare 30 5 6,464 439 491 -10.6% 79 108 -26.6% 34 61 -44.9%
Consumption 75 9 24,226 2,647 2,732 -3.1% 289 313 -7.9% 138 169 -18.7%
Core Infra 52 12 23,736 5,034 5,000 0.7% 775 780 -0.6% 293 288 1.6%
Materials 32 7 10,951 1,597 1,579 1.1% 299 287 4.3% 85 108 -21.3%
Manufacturing 71 1 9,018 815 769 5.9% 112 104 8.6% 48 54 -11.3%
Real Estate 8 0 887 54 58 -7.2% 17 18 -8.5% 5 5 -2.8%
Total Non BFSI 320 40 89,803 11,859 11,946 -0.7% 1,818 1,868 -2.7% 792 871 -9.0%
Financials 51 10 24,870 1,354 1,247 8.6% 0 0 - 221 238 -7.3%
Total 371 50 114,673 13,213 13,193 0.2% 1,818 1,868 -2.7% 1,013 1,109 -8.7%
Source: Equirus Securities, Bloomberg, Company data
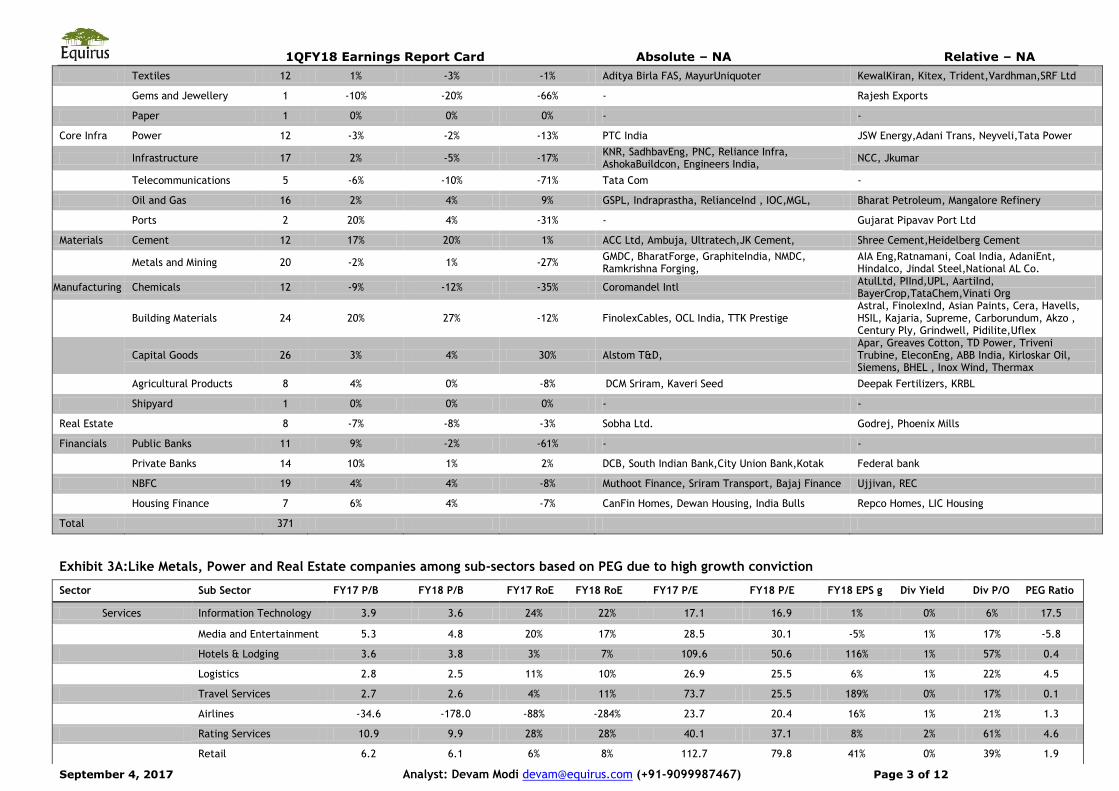
Exhibit 2: Across 32 sub-sectors, Oil & Gas, Capital Goods, Cement, and Metals did well, while Healthcare, Chemicals, and Telecom slipped
Sector Sub Sector # of Cos
Sales outperformance
EBITDA outperformance
PAT outperformance
Hits Misses
Services Information Technology 22 0% 1% 1% Tech M AccelyaKale, Cyient, Redington India
Media and Entertainment 11 0% -7% 25% Zee Ent. , Entertainment Network India Ltd Dish TV, PVR, Jagran, HMVL
Hotels & Lodging 4 -6% -16% -1% Wonderla Holidays Mahindra Holidays, Indian Hotels
Logistics 5 -8% 3% 16% Container Corp Blue Dart Express, Gateway Distripacks
Travel Services 2 33% 0% -52% - Gateway Distriparks Ltd
Airlines 3 -40% -76% 17% InterGlobe Aviation -
Rating Services 3 -6% -10% -11% - Care, Crisil
Retail 1 5% 33% 26% Trent Ltd. -
Education 1 -10% -15% -9% - Navneet Education
Healthcare Pharmaceuticals 27 -11% -27% -45% DrLalpaths Alembic,Cipla, Dr Reddy, Cadila, Lupin, Sun Pharma, Ajanta, Biocon, RPG, Divis Lab, GSK, IPCA, Jubilant Lifesciences, Piramal
Hospitals 3 -2% -15% -34% - Fortis Healthcare, Apollo Hospitals
Consumption FMCG 26 0% 1% -3% Avanti Feeds, P&G Hygiene, RadicoKhaitan,UBL CCL Products, Jyothy Labs, Emami,Godrej , VST,
Auto and Auto Ancillaries 24 -2% -14% -32% Eicher, Auto Apollo, Mahindra CIE, TVS, Bosch, JK Tyre, TAMO
Consumer Durables 11 -3% 1% 4% Voltas Ltd V Guard, Symphony
1QFY18 Earnings Report Card Absolute – NA Relative – NA
September 4, 2017 Analyst: Devam Modi [email protected] (+91-9099987467) Page 3 of 12
Textiles 12 1% -3% -1% Aditya Birla FAS, MayurUniquoter KewalKiran, Kitex, Trident,Vardhman,SRF Ltd
Gems and Jewellery 1 -10% -20% -66% - Rajesh Exports
Paper 1 0% 0% 0% - -
Core Infra Power 12 -3% -2% -13% PTC India JSW Energy,Adani Trans, Neyveli,Tata Power
Infrastructure 17 2% -5% -17% KNR, SadhbavEng, PNC, Reliance Infra, AshokaBuildcon, Engineers India,
NCC, Jkumar
Telecommunications 5 -6% -10% -71% Tata Com -
Oil and Gas 16 2% 4% 9% GSPL, Indraprastha, RelianceInd , IOC,MGL, Bharat Petroleum, Mangalore Refinery
Ports 2 20% 4% -31% - Gujarat Pipavav Port Ltd
Materials Cement 12 17% 20% 1% ACC Ltd, Ambuja, Ultratech,JK Cement, Shree Cement,Heidelberg Cement
Metals and Mining 20 -2% 1% -27% GMDC, BharatForge, GraphiteIndia, NMDC, Ramkrishna Forging,
AIA Eng,Ratnamani, Coal India, AdaniEnt, Hindalco, Jindal Steel,National AL Co.
Manufacturing Chemicals 12 -9% -12% -35% Coromandel Intl AtulLtd, PIInd,UPL, AartiInd, BayerCrop,TataChem,Vinati Org
Building Materials 24 20% 27% -12% FinolexCables, OCL India, TTK Prestige Astral, FinolexInd, Asian Paints, Cera, Havells, HSIL, Kajaria, Supreme, Carborundum, Akzo , Century Ply, Grindwell, Pidilite,Uflex
Capital Goods 26 3% 4% 30% Alstom T&D,
Apar, Greaves Cotton, TD Power, Triveni Trubine, EleconEng, ABB India, Kirloskar Oil, Siemens, BHEL , Inox Wind, Thermax
Agricultural Products 8 4% 0% -8% DCM Sriram, Kaveri Seed Deepak Fertilizers, KRBL
Shipyard 1 0% 0% 0% - -
Real Estate 8 -7% -8% -3% Sobha Ltd. Godrej, Phoenix Mills
Financials Public Banks 11 9% -2% -61% - -
Private Banks 14 10% 1% 2% DCB, South Indian Bank,City Union Bank,Kotak Federal bank
NBFC 19 4% 4% -8% Muthoot Finance, Sriram Transport, Bajaj Finance Ujjivan, REC
Housing Finance 7 6% 4% -7% CanFin Homes, Dewan Housing, India Bulls Repco Homes, LIC Housing
Total 371
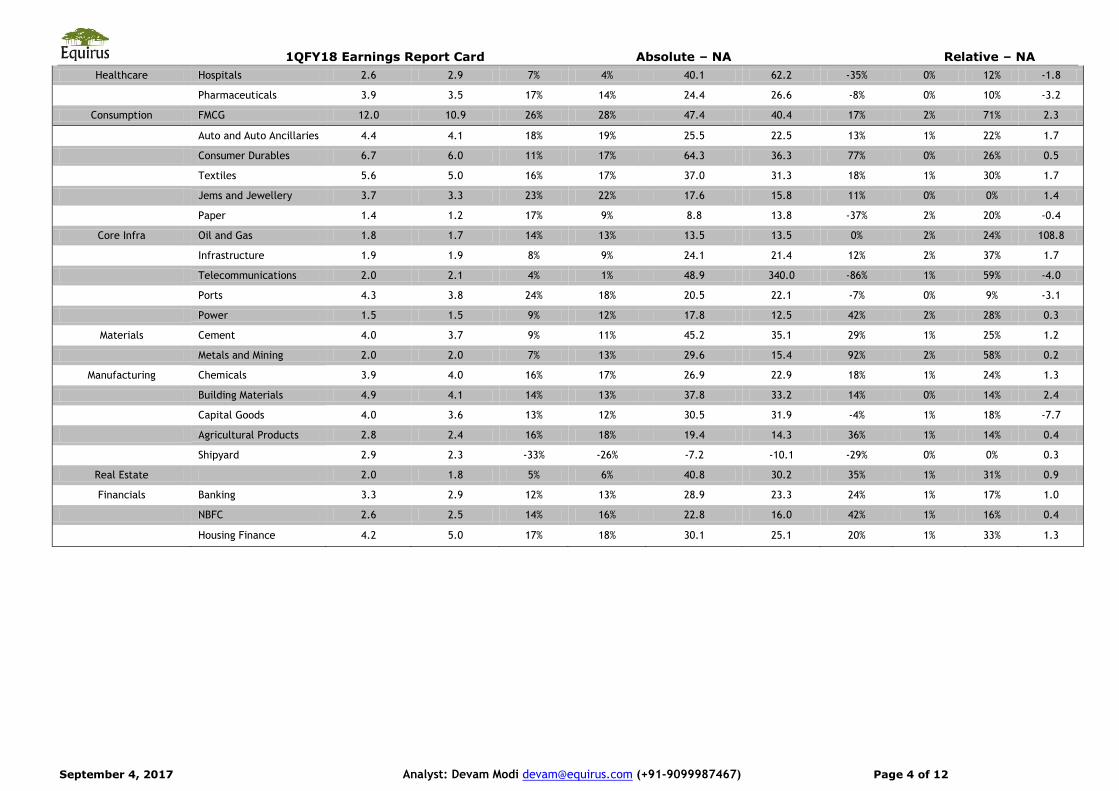
Exhibit 3A:Like Metals, Power and Real Estate companies among sub-sectors based on PEG due to high growth conviction
Sector Sub Sector FY17 P/B FY18 P/B FY17 RoE FY18 RoE FY17 P/E FY18 P/E FY18 EPS g Div Yield Div P/O PEG Ratio
Services Information Technology 3.9 3.6 24% 22% 17.1 16.9 1% 0% 6% 17.5
Media and Entertainment 5.3 4.8 20% 17% 28.5 30.1 -5% 1% 17% -5.8
Hotels & Lodging 3.6 3.8 3% 7% 109.6 50.6 116% 1% 57% 0.4
Logistics 2.8 2.5 11% 10% 26.9 25.5 6% 1% 22% 4.5
Travel Services 2.7 2.6 4% 11% 73.7 25.5 189% 0% 17% 0.1
Airlines -34.6 -178.0 -88% -284% 23.7 20.4 16% 1% 21% 1.3
Rating Services 10.9 9.9 28% 28% 40.1 37.1 8% 2% 61% 4.6
Retail 6.2 6.1 6% 8% 112.7 79.8 41% 0% 39% 1.9
1QFY18 Earnings Report Card Absolute – NA Relative – NA
September 4, 2017 Analyst: Devam Modi [email protected] (+91-9099987467) Page 4 of 12
Healthcare Hospitals 2.6 2.9 7% 4% 40.1 62.2 -35% 0% 12% -1.8
Pharmaceuticals 3.9 3.5 17% 14% 24.4 26.6 -8% 0% 10% -3.2
Consumption FMCG 12.0 10.9 26% 28% 47.4 40.4 17% 2% 71% 2.3
Auto and Auto Ancillaries 4.4 4.1 18% 19% 25.5 22.5 13% 1% 22% 1.7
Consumer Durables 6.7 6.0 11% 17% 64.3 36.3 77% 0% 26% 0.5
Textiles 5.6 5.0 16% 17% 37.0 31.3 18% 1% 30% 1.7
Jems and Jewellery 3.7 3.3 23% 22% 17.6 15.8 11% 0% 0% 1.4
Paper 1.4 1.2 17% 9% 8.8 13.8 -37% 2% 20% -0.4
Core Infra Oil and Gas 1.8 1.7 14% 13% 13.5 13.5 0% 2% 24% 108.8
Infrastructure 1.9 1.9 8% 9% 24.1 21.4 12% 2% 37% 1.7
Telecommunications 2.0 2.1 4% 1% 48.9 340.0 -86% 1% 59% -4.0
Ports 4.3 3.8 24% 18% 20.5 22.1 -7% 0% 9% -3.1
Power 1.5 1.5 9% 12% 17.8 12.5 42% 2% 28% 0.3
Materials Cement 4.0 3.7 9% 11% 45.2 35.1 29% 1% 25% 1.2
Metals and Mining 2.0 2.0 7% 13% 29.6 15.4 92% 2% 58% 0.2
Manufacturing Chemicals 3.9 4.0 16% 17% 26.9 22.9 18% 1% 24% 1.3
Building Materials 4.9 4.1 14% 13% 37.8 33.2 14% 0% 14% 2.4
Capital Goods 4.0 3.6 13% 12% 30.5 31.9 -4% 1% 18% -7.7
Agricultural Products 2.8 2.4 16% 18% 19.4 14.3 36% 1% 14% 0.4
Shipyard 2.9 2.3 -33% -26% -7.2 -10.1 -29% 0% 0% 0.3
Real Estate 2.0 1.8 5% 6% 40.8 30.2 35% 1% 31% 0.9
Financials Banking 3.3 2.9 12% 13% 28.9 23.3 24% 1% 17% 1.0
NBFC 2.6 2.5 14% 16% 22.8 16.0 42% 1% 16% 0.4
Housing Finance 4.2 5.0 17% 18% 30.1 25.1 20% 1% 33% 1.3
1QFY18 Earnings Report Card Absolute – NA Relative – NA
September 4, 2017 Analyst: Devam Modi [email protected] (+91-9099987467) Page 5 of 12
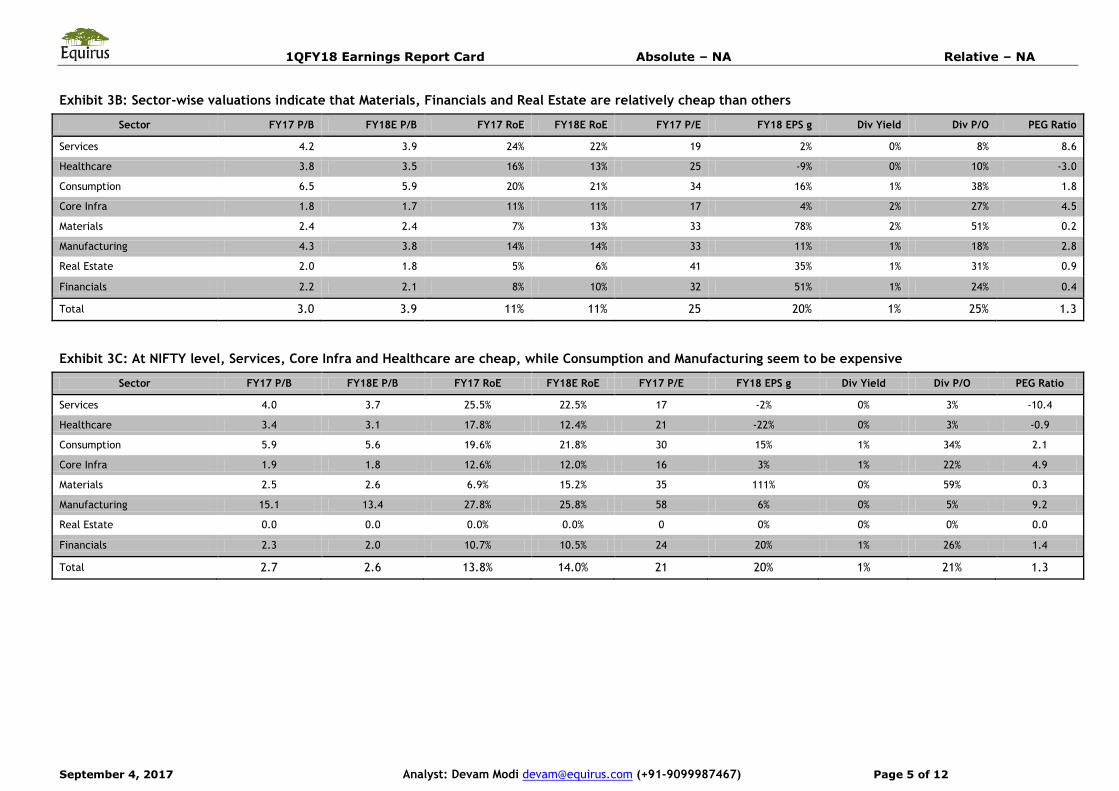
Exhibit 3B: Sector-wise valuations indicate that Materials, Financials and Real Estate are relatively cheap than others
Sector FY17 P/B FY18E P/B FY17 RoE FY18E RoE FY17 P/E FY18 EPS g Div Yield Div P/O PEG Ratio
Services 4.2 3.9 24% 22% 19 2% 0% 8% 8.6
Healthcare 3.8 3.5 16% 13% 25 -9% 0% 10% -3.0
Consumption 6.5 5.9 20% 21% 34 16% 1% 38% 1.8
Core Infra 1.8 1.7 11% 11% 17 4% 2% 27% 4.5
Materials 2.4 2.4 7% 13% 33 78% 2% 51% 0.2
Manufacturing 4.3 3.8 14% 14% 33 11% 1% 18% 2.8
Real Estate 2.0 1.8 5% 6% 41 35% 1% 31% 0.9
Financials 2.2 2.1 8% 10% 32 51% 1% 24% 0.4
Total 3.0 3.9 11% 11% 25 20% 1% 25% 1.3
Exhibit 3C: At NIFTY level, Services, Core Infra and Healthcare are cheap, while Consumption and Manufacturing seem to be expensive
Sector FY17 P/B FY18E P/B FY17 RoE FY18E RoE FY17 P/E FY18 EPS g Div Yield Div P/O PEG Ratio
Services 4.0 3.7 25.5% 22.5% 17 -2% 0% 3% -10.4
Healthcare 3.4 3.1 17.8% 12.4% 21 -22% 0% 3% -0.9
Consumption 5.9 5.6 19.6% 21.8% 30 15% 1% 34% 2.1
Core Infra 1.9 1.8 12.6% 12.0% 16 3% 1% 22% 4.9
Materials 2.5 2.6 6.9% 15.2% 35 111% 0% 59% 0.3
Manufacturing 15.1 13.4 27.8% 25.8% 58 6% 0% 5% 9.2
Real Estate 0.0 0.0 0.0% 0.0% 0 0% 0% 0% 0.0
Financials 2.3 2.0 10.7% 10.5% 24 20% 1% 26% 1.4
Total 2.7 2.6 13.8% 14.0% 21 20% 1% 21% 1.3
1QFY18 Earnings Report Card Absolute – NA Relative – NA
September 4, 2017 Analyst: Devam Modi [email protected] (+91-9099987467) Page 6 of 12
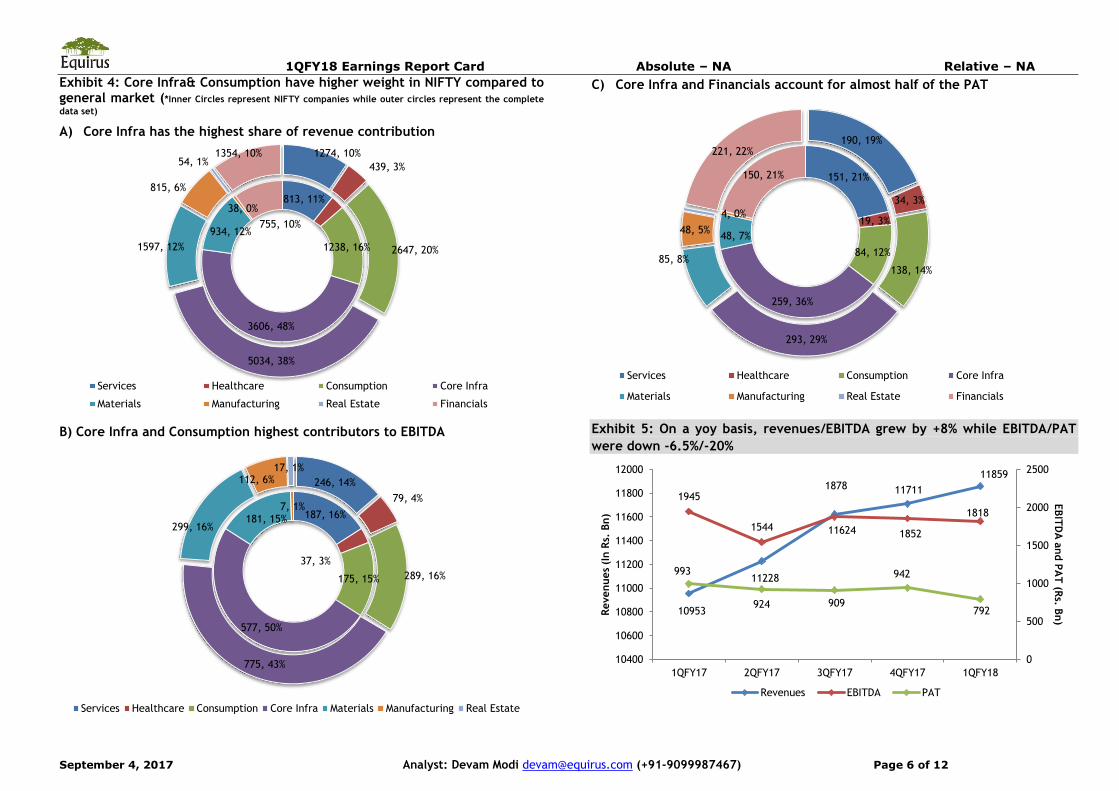
Exhibit 4: Core Infra& Consumption have higher weight in NIFTY compared to general market (*Inner Circles represent NIFTY companies while outer circles represent the complete
data set)
A) Core Infra has the highest share of revenue contribution
B) Core Infra and Consumption highest contributors to EBITDA
C) Core Infra and Financials account for almost half of the PAT
Exhibit 5: On a yoy basis, revenues/EBITDA grew by +8% while EBITDA/PAT
were down -6.5%/-20%
813, 11%
1238, 16%
3606, 48%
934, 12%
38, 0%
755, 10%
1274, 10%
439, 3%
2647, 20%
5034, 38%
1597, 12%
815, 6%
54, 1% 1354, 10%
Services Healthcare Consumption Core Infra
Materials Manufacturing Real Estate Financials
187, 16%
37, 3%
175, 15%
577, 50%
181, 15% 7, 1%
246, 14%
79, 4%
289, 16%
775, 43%
299, 16%
112, 6% 17, 1%
Services Healthcare Consumption Core Infra Materials Manufacturing Real Estate
151, 21%
19, 3%
84, 12%
259, 36%
48, 7%
4, 0%
150, 21%
190, 19%
34, 3%
138, 14%
293, 29%
85, 8%
48, 5%
221, 22%
Services Healthcare Consumption Core Infra
Materials Manufacturing Real Estate Financials
10953
11228
11624
11711
11859
1945
1544
1878
1852
1818
993
924 909
942
792
0
500
1000
1500
2000
2500
10400
10600
10800
11000
11200
11400
11600
11800
12000
1QFY17 2QFY17 3QFY17 4QFY17 1QFY18
EBIT
DA
and P
AT
(Rs. B
n)
Revenues
(In R
s. B
n)
Revenues EBITDA PAT

1QFY18 Earnings Report Card Absolute – NA Relative – NA
September 4, 2017 Analyst: Devam Modi [email protected] (+91-9099987467) Page 7 of 12
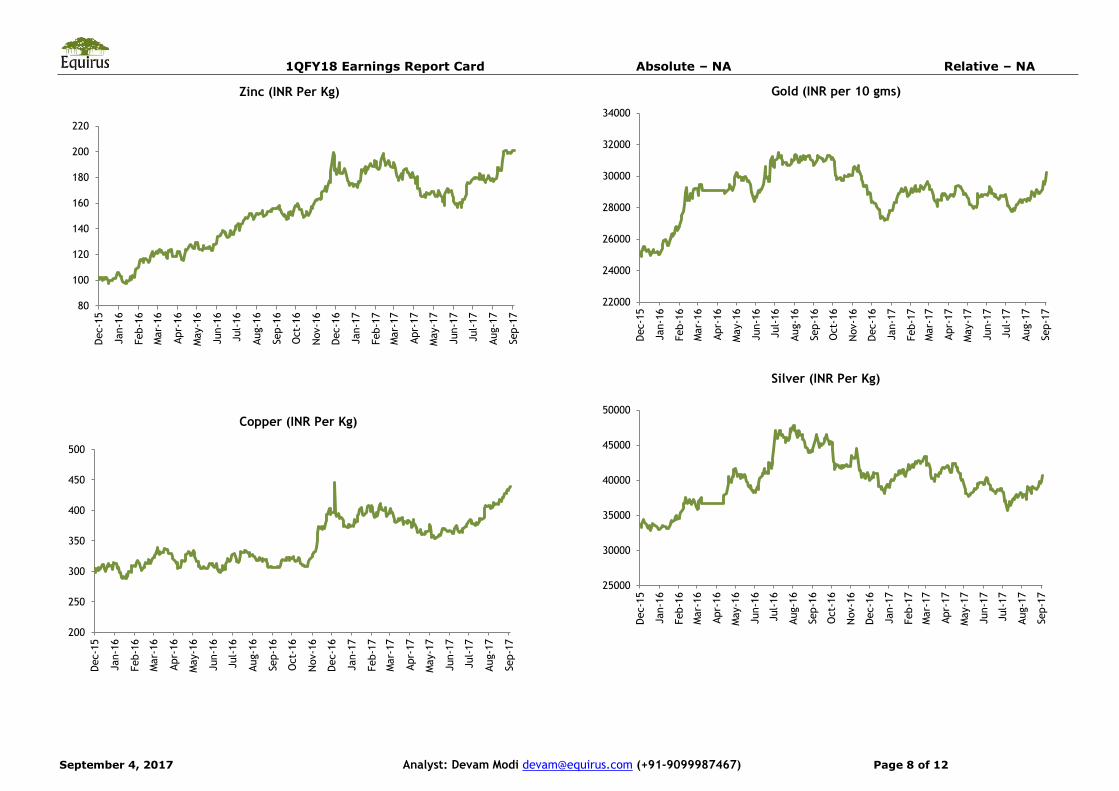
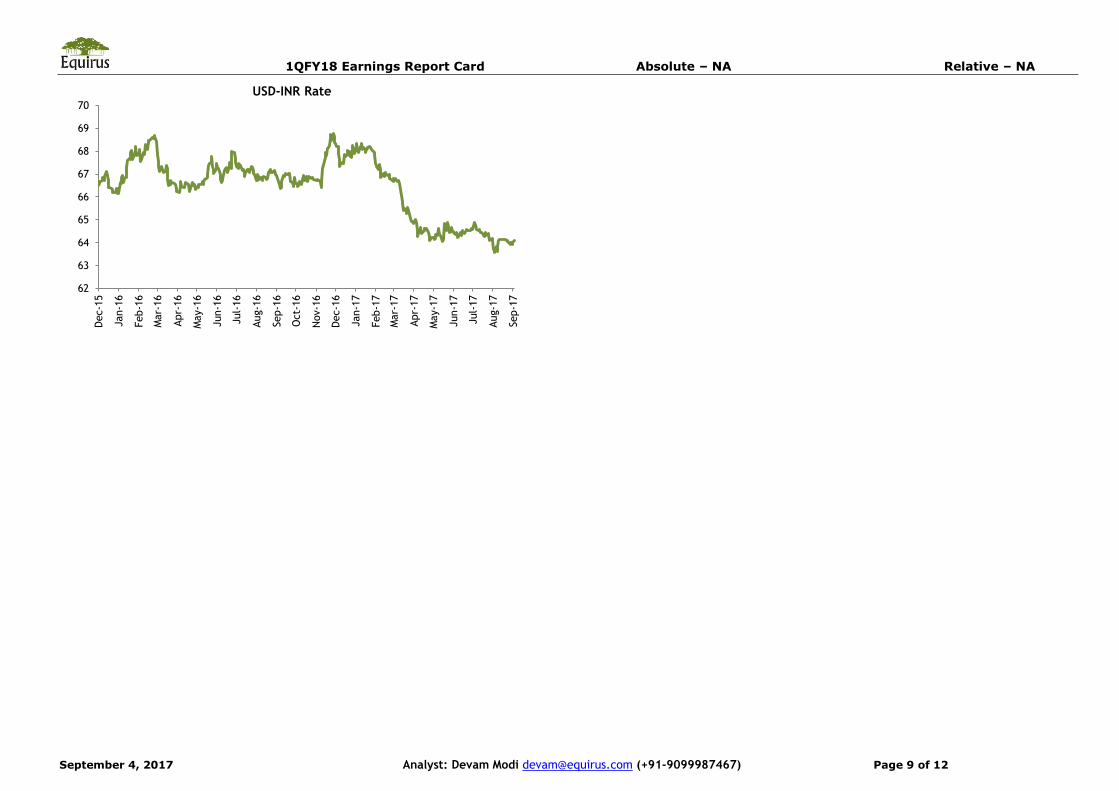
Exhibit 6: USD/INR has seen low volatility while among commodities, Zinc,
Lead and Copper have been the most volatile in the past year
Commodity Crude Lead Alum Zinc Copper Gold Silver USD INR
Unit USD/brl INR/kg INR/kg INR/kg INR/kg INR/10gm INR/kg INR/USD
Current 52 152 135 201 440 30,259 40,672 64.1
1 m(%) 0% 1% 12% 13% 9% 6% 7% 1%
3 m (%) 6% 14% 10% 26% 20% 4% 1% 0%
6 m (%) -7% 2% 8% 10% 11% 4% -4% -4%
12 m (%) 11% 17% 27% 28% 44% -2% -8% -4%
Max 57 169 129 200 446 31,529 47,833 69
Min 42 113 93 128 299 27,208 37,744 66
Average 51 139 110 166 354 29,533 42,147 67
Median 51 139 108 166 362 29,300 41,752 67
Coefficient of Variation
7.3% 9.5% 8.6% 10.3% 9.7% 3.8% 6.0% 1.9%
20
25
30
35
40
45
50
55
60
65
Dec-1
5
Jan-1
6
Feb-1
6
Mar-
16
Apr-
16
May-1
6
Jun-1
6
Jul-
16
Aug-1
6
Sep-1
6
Oct-
16
Nov-1
6
Dec-1
6
Jan-1
7
Feb-1
7
Mar-
17
Apr-
17
May-1
7
Jun-1
7
Jul-
17
Aug-1
7
Sep-1
7
Brent Crude (USD Per Barrel)
90
100
110
120
130
140
150
160
170
180
Dec-1
5
Jan-1
6
Feb-1
6
Mar-
16
Apr-
16
May-1
6
Jun-1
6
Jul-
16
Aug-1
6
Sep-1
6
Oct-
16
Nov-1
6
Dec-1
6
Jan-1
7
Feb-1
7
Mar-
17
Apr-
17
May-1
7
Jun-1
7
Jul-
17
Aug-1
7
Sep-1
7
Lead (INR Per Kg)
80
90
100
110
120
130
140
Dec-1
5
Jan-1
6
Feb-1
6
Mar-
16
Apr-
16
May-1
6
Jun-1
6
Jul-
16
Aug-1
6
Sep-1
6
Oct-
16
Nov-1
6
Dec-1
6
Jan-1
7
Feb-1
7
Mar-
17
Apr-
17
May-1
7
Jun-1
7
Jul-
17
Aug-1
7
Sep-1
7
Aluminum (INR Per Kg)
1QFY18 Earnings Report Card Absolute – NA Relative – NA
September 4, 2017 Analyst: Devam Modi [email protected] (+91-9099987467) Page 8 of 12
80
100
120
140
160
180
200
220
Dec-1
5
Jan-1
6
Feb-1
6
Mar-
16
Apr-
16
May-1
6
Jun-1
6
Jul-
16
Aug-1
6
Sep-1
6
Oct-
16
Nov-1
6
Dec-1
6
Jan-1
7
Feb-1
7
Mar-
17
Apr-
17
May-1
7
Jun-1
7
Jul-
17
Aug-1
7
Sep-1
7
Zinc (INR Per Kg)
200
250
300
350
400
450
500
Dec-1
5
Jan-1
6
Feb-1
6
Mar-
16
Apr-
16
May-1
6
Jun-1
6
Jul-
16
Aug-1
6
Sep-1
6
Oct-
16
Nov-1
6
Dec-1
6
Jan-1
7
Feb-1
7
Mar-
17
Apr-
17
May-1
7
Jun-1
7
Jul-
17
Aug-1
7
Sep-1
7
Copper (INR Per Kg)
22000
24000
26000
28000
30000
32000
34000
Dec-1
5
Jan-1
6
Feb-1
6
Mar-
16
Apr-
16
May-1
6
Jun-1
6
Jul-
16
Aug-1
6
Sep-1
6
Oct-
16
Nov-1
6
Dec-1
6
Jan-1
7
Feb-1
7
Mar-
17
Apr-
17
May-1
7
Jun-1
7
Jul-
17
Aug-1
7
Sep-1
7
Gold (INR per 10 gms)
25000
30000
35000
40000
45000
50000
Dec-1
5
Jan-1
6
Feb-1
6
Mar-
16
Apr-
16
May-1
6
Jun-1
6
Jul-
16
Aug-1
6
Sep-1
6
Oct-
16
Nov-1
6
Dec-1
6
Jan-1
7
Feb-1
7
Mar-
17
Apr-
17
May-1
7
Jun-1
7
Jul-
17
Aug-1
7
Sep-1
7
Silver (INR Per Kg)
1QFY18 Earnings Report Card Absolute – NA Relative – NA
September 4, 2017 Analyst: Devam Modi [email protected] (+91-9099987467) Page 9 of 12
62
63
64
65
66
67
68
69
70D
ec-1
5
Jan-1
6
Feb-1
6
Mar-
16
Apr-
16
May-1
6
Jun-1
6
Jul-
16
Aug-1
6
Sep-1
6
Oct-
16
Nov-1
6
Dec-1
6
Jan-1
7
Feb-1
7
Mar-
17
Apr-
17
May-1
7
Jun-1
7
Jul-
17
Aug-1
7
Sep-1
7
USD-INR Rate
1QFY18 Earnings Report Card Absolute – NA Relative – NA
September 4, 2017 Analyst: Devam Modi [email protected] (+91-9099987467) Page 10 of 12
Equirus Securities
Research Analysts Sector/Industry Email
Equity Sales E-mail
AbhishekShindadkar IT Services [email protected] 91-22-43320643 VishadTurakhia [email protected] 91-22-43320633
AshutoshTiwari Auto, Metals & Mining [email protected] 91-79-61909517 SubhamSinha [email protected] 91-22-43320631
DepeshKashyap Mid-Caps [email protected] 91-79-61909528 SwetaSheth [email protected] 91-22-43320634
Devam Modi Power & Infrastructure [email protected] 91-79-61909516 Viral Desai [email protected] 91-22-43320635
DhavalDama FMCG, Mid-Caps [email protected] 91-79-61909518
Manoj Gori Consumer Durables [email protected] 91-79-61909523 Dealing Room E-mail
Maulik Patel Oil and Gas [email protected] 91-79-61909519 Ashish Shah [email protected] 91-22-43320662
Praful Bohra Pharmaceuticals [email protected] 91-79-61909532 IleshSavla [email protected] 91-22-43320666
RohanMandora Banking & Financial Services [email protected] 91-79-61909529 Manoj Kejriwal [email protected] 91-22-43320663
Associates E-mail Dharmesh Mehta [email protected] 91-22-43320661
Ankit Choudhary [email protected] 91-79-61909533 SandipAmrutiya [email protected] 91-22-43320660
Bharat Celly [email protected] 91-79-61909524 Compliance Officer E-mail
Harshit Patel [email protected] 91-79-61909522 Jay Soni [email protected] 91-79-61909561
Meet Chande [email protected] 91-79-61909513
ParvaSoni [email protected] 91-79-61909521
Pranav Mehta [email protected] 91-79-61909514
RonakSoni [email protected] 91-79-61909525
Samkit Shah [email protected] 91-79-61909520
ShreepalDoshi [email protected] 91-79-61909541
Vikas Jain [email protected] 91-79-61909531
Rating & Coverage Definitions: Absolute Rating • LONG : Over the investment horizon, ATR >= Ke for companies with Free Float market cap > Rs 5 billion and ATR >= 20% for rest of the companies • ADD: ATR >= 5% but less than Ke over investment horizon • REDUCE: ATR >= negative 10% but <5% over investment horizon • SHORT: ATR < negative 10% over investment horizon Relative Rating • OVERWEIGHT: Likely to outperform the benchmark by at least 5% over investment horizon • BENCHMARK: likely to perform in line with the benchmark
Registered Office:
Equirus Securities Private Limited
Unit No. 1201, 12th Floor, C Wing, Marathon Futurex,
N M Joshi Marg, Lower Parel,
Mumbai-400013.
Tel. No: +91 – (0)22 – 4332 0600
Fax No: +91- (0)22 – 4332 0601

1QFY18 Earnings Report Card Absolute – NA Relative – NA
September 4, 2017 Analyst: Devam Modi [email protected] (+91-9099987467) Page 11 of 12
• UNDERWEIGHT: likely to under-perform the benchmark by at least 5% over investment horizon Investment Horizon Investment Horizon is set at a minimum 3 months to maximum 18 months with target date falling on last day of a calendar quarter. Lite vs. Regular Coverage vs. Spot Coverage We aim to keep our rating and estimates updated at least once a quarter for Regular Coverage stocks. Generally, we would have access to the company and we would maintain detailed financial model for Regular coverage companies. We intend to publish updates on Lite coverage stocks only an opportunistic basis and subject to our ability to contact the management. Our rating and estimates for Lite coverage stocks may not be current. Spot coverage is meant for one-off coverage of a specific company and in such cases, earnings forecast and target price are optional. Spot coverage is meant to stimulate discussion rather than provide a research opinion.
Corporate Office:
3rd floor, House No. 9,
Magnet Corporate Park, Near Zydus Hospital, B/H Intas Sola Bridge,
S.G. Highway Ahmedabad-380054
Gujarat
Tel. No: +91 (0)79 - 6190 9550
Fax No: +91 (0)79 – 6190 9560
© 2017 Equirus Securities Private Limited. All rights reserved. For Private Circulation only. This report or any portion hereof may not
be reprinted, sold or redistributed without the written consent of Equirus Securities Private Limited
Analyst Certification
I, Devam Modi, author to this report, hereby certify that all of the views expressed in this report accurately reflect my personal views about the subject company or companies and its or their securities. I also
certify that no part of my compensation was, is or will be, directly or indirectly, related to the specific recommendations or views expressed in this report.
Disclosures
Equirus Securities Private Limited (ESPL) having Corporate Identification Number U65993MH2007PTC176044 is registered in India with Securities and Exchange Board of India (SEBI) as a trading member on the
Capital Market (Reg. No. INB231301731), Futures & Options Segment (Reg. No.INF231301731) of the National Stock Exchange of India Ltd. (NSE) and on Cash Segment (Reg. No.INB011301737) of Bombay Stock
Exchange Limited (BSE).ESPL is also registered with SEBI as Research Analyst under SEBI (Research Analyst) Regulations, 2014 (Reg. No. INH000001154), as a Portfolio Manager under SEBI (Portfolio Managers
Regulations, 1993 (Reg. No.INP000005216) and as a Depository Participant of the Central Depository Services (India) Limited (Reg. No.IN-DP-324-2017). There are no disciplinary actions taken by any regulatory
authority against ESPL. ESPL is a subsidiary of Equirus Capital Pvt. Ltd. (ECPL) which is registered with SEBI as Category I Merchant Banker and provides investment banking services including but not limited to
merchant banking services, private equity, mergers & acquisitions and structured finance.
As ESPL and its associates are engaged in various financial services business, it might have: - (a) received compensation (except in connection with the preparation of this report) from the subject company for
investment banking or merchant banking or brokerage services in the past twelve months;(b) managed or co-managed public offering of securities for the subject company in the past twelve months; or (c) have
received a mandate from the subject company; or (d) might have other financial, business or other interests in entities including the subject company (ies) mentioned in this Report. ESPL & its associates, their
directors and employees may from time to time have positions or options in the company and buy or sell the securities of the company (ies) mentioned herein. ESPL and its associates collectively do not own (in
their proprietary position) 1% or more of the equity securities of the subject company mentioned in the report as the last day of the month preceding the publication of the research report. ESPL or its Analyst or
Associates did not receive any compensation or other benefits from the companies mentioned in the report or third party in connection with preparation of the research report. Accordingly, neither ESPL nor
Research Analysts have any material conflict of interest at the time of publication of this report. Compensation of our Research Analysts is not based on any specific merchant banking, investment banking or
brokerage service transactions. ESPL has not been engaged in market making activity for the subject company.
The Research Analyst engaged in preparation of this Report:-
(a) has not received any compensation from the subject company in the past twelve months; (b) has not managed or co-managed public offering of securities for the subject company in the past twelve months;
(c) has not received any compensation for investment banking or merchant banking or brokerage services from the subject company in the past twelve months; (d) has not received any compensation for products
or services other than investment banking or merchant banking or brokerage services from the subject company in the past twelve months; (e) has not received any compensation or other benefits from the
subject company or third party in connection with the research report; (f) might have served as an officer, director or employee of the subject company; (g) is not engaged in market making activity for the
subject company.
This document is not directed or intended for distribution to, or use by, any person or entity who is a citizen or resident of or located in any locality, state, country or other jurisdiction, where such distribution,
publication, availability or use would be contrary to law, regulation or which would subject ESPL and affiliates to any registration or licensing requirement within such jurisdiction. The securities described herein
may or may not be eligible for sale in all jurisdictions or to a certain category of investors. Persons in whose possession of this document are required to inform themselves of, and to observe, such applicable
restrictions. Please delete this document if you are not authorized to view the same. By reading this document you represent and warrant that you have full authority and all rights necessary to view and read this
document without subjecting ESPL and affiliates to any registration or licensing requirement within such jurisdiction.
1QFY18 Earnings Report Card Absolute – NA Relative – NA
September 4, 2017 Analyst: Devam Modi [email protected] (+91-9099987467) Page 12 of 12
This document has been prepared solely for information purpose and does not constitute a solicitation to any person to buy, sell or subscribe any security. ESPL or its affiliates are not soliciting any action based
on this report. The information and opinions contained herein is from publicly available data or based on information obtained in good faith from sources believed to be reliable but ESPL provides no guarantee as
to its accuracy or completeness. The information contained herein is as on date of this report, and is subject to change or modification and any such changes could impact our interpretation of relevant
information contained herein. While we would endeavour to update the information herein on reasonable basis, ESPL and its affiliates, their directors and employees are under no obligation to update or keep the
information current. Also there may be regulatory, compliance, or other reasons that may prevent ESPL and its group companies from doing so. This document is prepared for assistance only and is not intended
to be and must not alone be taken as the basis for an investment decision. Each recipient of this document should make such investigations as it deems necessary to arrive at an independent evaluation of an
investment in the securities of companies referred to in this document including the merits and risks involved. This document is intended for general circulation and does not take into account the specific
investment objectives, financial situation or particular needs of any particular person. ESPL and its group companies, employees, directors and agents accept no liability, and disclaim all responsibility, for the
consequences of you or anyone else acting, or refraining to act, in reliance on the information contained in this publication or for any decision based on it. ESPL/its affiliates do and seek to do business with
companies covered in its research report. Thus, investors should be aware that the firm may have conflict of interest.
A graph of daily closing prices of securities is available at http://www.nseindia.com/ChartApp/install/charts/mainpage.jsp and www.bseindia.com (Choose a company from the list on the browser and select the
“three years” period in the price chart).
Disclosure of Interest statement for the subject Company Yes/No If Yes, nature of such interest
Research Analyst’ or Relatives’ financial interest No
Research Analyst’ or Relatives’ actual/beneficial ownership of 1% or more No
Research Analyst’ or Relatives’ material conflict of interest No
Disclaimer for U.S. Persons
ESPL/its affiliates are not a registered broker–dealer under the U.S. Securities Exchange Act of 1934, as amended (the“1934 act”) and under applicable state laws in the United States. In addition Equirus is not a
registered investment adviser under the U.S. Investment Advisers Act of 1940, as amended (the "Advisers Act" and together with the 1934 Act, the “Acts”), and under applicable state laws in the United States.
Accordingly, in the absence of specific exemption under the Acts, any brokerage and investment services provided by Equirus, including the products and services described herein are not available to or intended
for U.S. persons. The information contained in this Report is not intended for any person who is a resident of the United States of America or a resident of any jurisdiction, the laws of which imposes prohibition
on soliciting the securities business in that jurisdiction without going through the registration requirements and/ or prohibit the use of any information contained in this report. This Report and its respective
contents do not constitute an offer or invitation to purchase or subscribe for any securities or solicitation of any investments or investment services and/or shall not be considered as an advertisement tool. "U.S.
Persons" are generally defined as a natural person, residing in the United States or any entity organized or incorporated under the laws of the United States. US Citizens living abroad may also be deemed "US
Persons" under certain rules.