1Q15 Results - INFOinvestjbss.infoinvest.com.br/fck_temp/mala_direta/file/Release 1Q15_FINAL... ·...
20
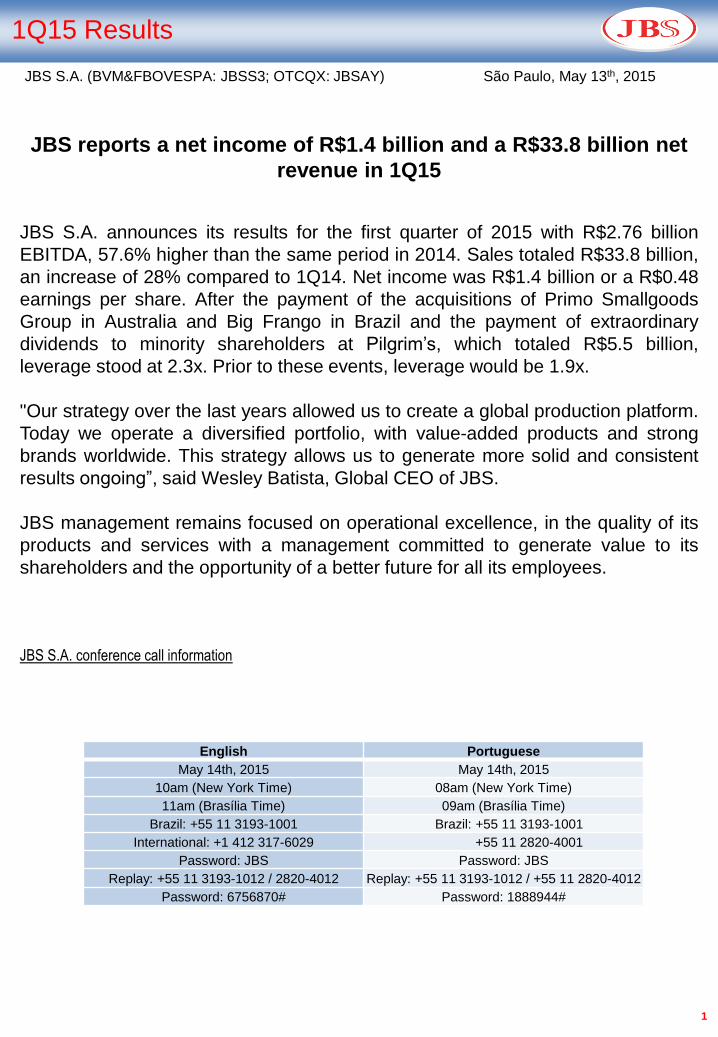
1 1Q15 Results JBS S.A. (BVM&FBOVESPA: JBSS3; OTCQX: JBSAY) São Paulo, May 13 th , 2015 JBS reports a net income of R$1.4 billion and a R$33.8 billion net revenue in 1Q15 JBS S.A. announces its results for the first quarter of 2015 with R$2.76 billion EBITDA, 57.6% higher than the same period in 2014. Sales totaled R$33.8 billion, an increase of 28% compared to 1Q14. Net income was R$1.4 billion or a R$0.48 earnings per share. After the payment of the acquisitions of Primo Smallgoods Group in Australia and Big Frango in Brazil and the payment of extraordinary dividends to minority shareholders at Pilgrim’s, which totaled R$5.5 billion, leverage stood at 2.3x. Prior to these events, leverage would be 1.9x. "Our strategy over the last years allowed us to create a global production platform. Today we operate a diversified portfolio, with value-added products and strong brands worldwide. This strategy allows us to generate more solid and consistent results ongoing”, said Wesley Batista, Global CEO of JBS. JBS management remains focused on operational excellence, in the quality of its products and services with a management committed to generate value to its shareholders and the opportunity of a better future for all its employees. JBS S.A. conference call information English Portuguese May 14th, 2015 May 14th, 2015 10am (New York Time) 08am (New York Time) 11am (Brasília Time) 09am (Brasília Time) Brazil: +55 11 3193-1001 Brazil: +55 11 3193-1001 International: +1 412 317-6029 +55 11 2820-4001 Password: JBS Password: JBS Replay: +55 11 3193-1012 / 2820-4012 Replay: +55 11 3193-1012 / +55 11 2820-4012 Password: 6756870# Password: 1888944#
Transcript of 1Q15 Results - INFOinvestjbss.infoinvest.com.br/fck_temp/mala_direta/file/Release 1Q15_FINAL... ·...
1
1Q15 Results
JBS S.A. (BVM&FBOVESPA: JBSS3; OTCQX: JBSAY) São Paulo, May 13th, 2015
JBS reports a net income of R$1.4 billion and a R$33.8 billion net
revenue in 1Q15
JBS S.A. announces its results for the first quarter of 2015 with R$2.76 billion
EBITDA, 57.6% higher than the same period in 2014. Sales totaled R$33.8 billion,
an increase of 28% compared to 1Q14. Net income was R$1.4 billion or a R$0.48
earnings per share. After the payment of the acquisitions of Primo Smallgoods
Group in Australia and Big Frango in Brazil and the payment of extraordinary
dividends to minority shareholders at Pilgrim’s, which totaled R$5.5 billion,
leverage stood at 2.3x. Prior to these events, leverage would be 1.9x.
"Our strategy over the last years allowed us to create a global production platform.
Today we operate a diversified portfolio, with value-added products and strong
brands worldwide. This strategy allows us to generate more solid and consistent
results ongoing”, said Wesley Batista, Global CEO of JBS.
JBS management remains focused on operational excellence, in the quality of its
products and services with a management committed to generate value to its
shareholders and the opportunity of a better future for all its employees.
JBS S.A. conference call information
English Portuguese
May 14th, 2015 May 14th, 2015
10am (New York Time) 08am (New York Time)
11am (Brasília Time) 09am (Brasília Time)
Brazil: +55 11 3193-1001 Brazil: +55 11 3193-1001
International: +1 412 317-6029 +55 11 2820-4001
Password: JBS Password: JBS
Replay: +55 11 3193-1012 / 2820-4012 Replay: +55 11 3193-1012 / +55 11 2820-4012
Password: 6756870# Password: 1888944#

2
26,419
33,819
1Q14 1Q15
1,750
2,758
6.6%
8.2%
1Q14 1Q15
1Q15 Results
Consolidated EBITDA (R$ Million)
Consolidated Net Revenue (R$ Million) Consolidated Gross Profit (R$ Million)
Consolidated Net Income (R$ Million)
EBITDA margin (%) Earnings per share (R$)
Gross margin (%)
28.0%
JBS S.A. (BVM&FBOVESPA: JBSS3; OTCQX: JBSAY) São Paulo, May 13th, 2015
1Q15 Highlights
Net revenue in the period was R$33.8 billion, which
represents an increase of 28% compared with 1Q14.
Gross profit in 1Q15 was R$4.8 billion, 39.6% higher than
the same period in the previous year.
EBITDA in 1Q15 was R$2.8 billion, an increase of 57.6%
over 1Q14. EBITDA margin was 8.2%.
JBS recorded net income of R$1.39 billion in 1Q15, equivalent to R$0.482 per share.
3,421
4,778
13.0%14.1%
1Q14 1Q15
70
1,394
0.024
0.482
1Q14 1Q15

3
1.9x
23,679
27,721
5,500
3.3x
2.3x
1Q14 1Q15Net debt Leverage
10,464
8,641
1,714
1Q14 1Q15
1Q15 Results
Net Debt (US$ Million)
Net Operating Cash Generation (R$ Million) Net Debt (R$ Million) / Leverage
Adjusted Net Debt (US$ Million)
JBS S.A. (BVM&FBOVESPA: JBSS3; OTCQX: JBSAY) São Paulo, May 13th, 2015
1Q15 Highlights
In 1Q15, net operating cash generation was R$4.5 billion and
free cash generation before acquisitions was R$3.8 billion. JBS ended 1Q15 with net debt of R$33.2 billion, after the acquisitions
of Primo Group and Big Frango, in addition to the payment of
extraordinary dividends at PPC, which totaled R$5.5 billion,
approximately.
Leverage at the end of this quarter was 2.3x. Leverage would have
been 1.9x when analyzed before the acquisitions and payment
of extraordinary dividends.
Primo Group acquisition was concluded in the end of 1Q15.
(With annual revenues of US$1.4 billion and EBITDA of US$110
million, approximately, Primo’s results are not contemplated into JBS
results).
Net debt in
US$ before
acquisitions &
dividends
33,221
10,356
505
4,538
1Q14 1Q15
799.2%
Net debt and
leverage
before
acquisitions &
dividends
-17.4%
10,464 10,356
1Q14 1Q15

4
1Q15 Results
JBS S.A. (BVM&FBOVESPA: JBSS3; OTCQX: JBSAY) São Paulo, May 13th, 2015
1Q15 Highlights
Net Revenue and EBITDA Evolution (R$ billion)
4.3% 3.8% 3.7%
5.5%5.0%
5.8%6.6%
9.2% 9.5%
0.6 1.2 1.3 3.5 3.1 4.4 6.111.1 12.1
14.130.3 34.3
54.7 61.875.7
92.9
120.5 127.9
2007 2008 2009 2010 2011 2012 2013 2014 LTM1T15
Revenue Breakdown by Location and Currency
JBS USA68%
JBS Mercosul
20%
JBS Foods 12%
US$51%
R$49%
US$43%
R$57%US$
100%
Revenue in US$83%
Revenue in R$
17%
83% of JBS net revenue is in US$
LTM, JBS reached R$127.9 billion in net revenue, EBITDA of R$12.1 billion,
equivalent to an EBITDA margin of 9.5%, and net income of R$3.36 billion. Updating the results using FX at the end of 1Q15, EBITDA LTM was R$14.5 billion
and net revenue reached R$153.9 billion.JBS, with its internationalization strategy and geographical diversification, combined
with a relevant presence in several proteins and a growing share in value added
products with strong brands, created an operation that generates consistent and
sustainable results, with stability and balance over the years.
EBITDA margin (%)EBITDA (R$ bi)Net Revenue (R$ bi)

5
5,725.3
6,782.3
1Q14 1Q15
4,520.7
5,190.5
1Q14 1Q15
2,780.0
3,874.5
1Q14 1Q15
JBS USA Beef (Including Canada and Australia)
JBS Mercosul
JBS USA Chicken – Pilgrim’s Pride “PPC”
JBS USA Pork
In 1Q15, JBS Mercosul net revenue was R$6.8
billion, 18.5% greater than 1Q14.
EBITDA in 1Q15 was R$376.4 million, a decrease of
36.8% over 1Q14. EBITDA margin was 5.6%.
JBS Foods
Net Revenue (R$ million) EBITDA (R$ million) and Margin(%)
Business Units 1Q15 Highlights
1Q15 Results
In 1Q15, JBS Foods net revenue was R$3.9 billion,
39.4% greater than 1Q14.
EBITDA in 1Q15 was R$616 million, an increase of
62.2% over 1Q14. EBITDA margin was 15.9%.
Net Revenue (R$ million) EBITDA (R$ million) and Margin(%)
Net Revenue (US$ million) EBITDA (US$ million) and Margin(%)
Net Revenue (US$ million) EBITDA (US$ million) and Margin(%)
Net Revenue (US$ million) EBITDA (US$ million) and Margin(%)
18.5%
-15.0%
1.7%
39.4%
In 1Q15, JBS USA Beef net revenue was US$5.2
billion, 14.8% greater than 1Q14.
EBITDA was US$186.6 million, reverting 1Q14 result.
EBITDA margin was 3.6%.
In 1Q15, JBS USA Pork net revenue was US$762.3
million, a decrease of 15.0% over 1Q14.
EBITDA was US$93.2 million, 12.4% higher than
1Q14. EBITDA margin was 12.2%.
In 1Q15, PPC net revenue was US$2.1 billion, a
1.7% increase over 1Q14.
EBITDA was US$363.5 million, 77.2% higher than
1Q14. EBITDA margin was 17.7%.
14.8%
379.8616.0
13.7%15.9%
1Q14 1Q15
596.1376.4
10.4%
5.6%
1Q14 1Q15
-22.5186.6
-0.5%3.6%
1Q14 1Q15
896.9
762.3
1Q14 1Q15
82.9 93.2
9.2%12.2%
1Q14 1Q15
2,018.12,052.9
1,500.0
1,600.0
1,700.0
1,800.0
1,900.0
2,000.0
2,100.0
1Q14 1Q15
205.2363.5
10.2%
17.7%
1Q14 1Q15
-15.0%
1.7%

6
Analysis of Consolidated Results
Analysis of the main financial indicators of JBS by Business Unit (in local currency)
Performance by Business Unit
1Q15 Results
Million 1Q15 4Q14 ∆% 1Q14 ∆%
Net Revenue
JBS Foods R$ 3,874.5 3,649.0 6.2% 2,780.0 39.4%
JBS Mercosul R$ 6,782.3 7,545.7 -10.1% 5,725.3 18.5%
JBS USA Beef US$ 5,190.5 5,923.7 -12.4% 4,520.7 14.8%
JBS USA Pork US$ 762.3 964.0 -20.9% 896.9 -15.0%
JBS USA Chicken US$ 2,052.9 2,110.4 -2.7% 2,018.1 1.7%
EBITDA
JBS Foods R$ 616.0 656.1 -6.1% 379.8 62.2%
JBS Mercosul R$ 376.4 534.1 -29.5% 596.1 -36.8%
JBS USA Beef US$ 186.6 325.1 -42.6% -22.5 -
JBS USA Pork US$ 93.2 95.7 -2.6% 82.9 12.4%
JBS USA Chicken US$ 363.5 367.8 -1.2% 205.2 77.2%
EBITDA Margin
JBS Foods % 15.9% 18.0% -2.08 p.p. 13.7% 2.24 p.p.
JBS Mercosul % 5.6% 7.1% -1.53 p.p. 10.4% -4.86 p.p.
JBS USA Beef % 3.6% 5.5% -1.89 p.p. -0.5% 4.09 p.p.
JBS USA Pork % 12.2% 9.9% 2.30 p.p. 9.2% 2.98 p.p.
JBS USA Chicken % 17.7% 17.4% 0.28 p.p. 10.2% 7.54 p.p.
EBITDA margin (%)
Net sales (R$ billion) Net sales (US$ billion) Net sales (US$ million) Net sales (US$ billion)
EBITDA (R$ million) EBITDA (US$ million) EBITDA (US$ million) EBITDA (US$ million)
JBS Mercosul JBS USA Beef
(Including Australia & Canada)
JBS USA Pork JBS USA (PPC)
Net sales (R$ billion)
EBITDA (R$ million)
JBS Foods
2.83.1
3.43.6 3.9
1Q14 2Q14 3Q14 4Q14 1Q15
379.8440.4
576.0656.1 616.0
13.7% 14.3%17.1% 18.0%
15.9%
1Q14 2Q14 3Q14 4Q14 1Q15
5.76.3 6.5
7.56.8
1Q14 2Q14 3Q14 4Q14 1Q15
596.1 634.3554.6 534.1
376.4
10.4% 10.1%8.6%
7.1%5.6%
1Q14 2Q14 3Q14 4Q14 1Q15
4.55.3
5.8 5.95.2
1Q14 2Q14 3Q14 4Q14 1Q15
-22.5108.6
504.9
325.1186.6
-0.5%
2.0%
8.6%
5.5%3.6%
1Q14 2Q14 3Q14 4Q14 1Q15
896.91,028.3
937.8 964.0
762.3
1Q14 2Q14 3Q14 4Q14 1Q15
82.9113.8 113.2
95.7 93.2
9.2%11.1% 12.1%
9.9%12.2%
1Q14 2Q14 3Q14 4Q14 1Q15
2.02.2 2.3
2.1 2.1
1Q14 2Q14 3Q14 4Q14 1Q15
205.2
338.6435.4
367.8 363.5
10.2%
15.5%19.2%
17.4% 17.7%
1Q14 2Q14 3Q14 4Q14 1Q15

7
1Q15 Results
Consolidated Results
Consolidated analysis of the main operational indicators of JBS
Net Revenue
JBS consolidated net revenue in 1Q15 totaled R$33,819.0 million, an expansion of R$7,399.9 million, or 28.0%
higher than 1Q14.
The main highlights were JBS Foods, which recorded a 39.4% increase in revenue, JBS Mercosul, with a 18.5%
increase and JBS USA Beef, whose revenues increased 14.8% compared to the same period last year.
In 1Q15, approximately 71% of JBS global revenue were derived from domestic sales and 29% came from exports.
∆% ∆%
R$ million R$ MM % NR R$ MM % NR 1Q15 vs 4Q14 R$ MM % NR 1Q15 vs 1Q14
Net Revenue 33,819.0 100.0% 34,303.2 100.0% -1.4% 26,419.1 100.0% 28.0%
Cost of Goods Sold (29,041.2) -85.9% (28,867.1) -84.2% 0.6% (22,997.8) -87.0% 26.3%
Gross Income 4,777.8 14.1% 5,436.2 15.8% -12.1% 3,421.3 13.0% 39.6%
Selling Expenses (1,955.2) -5.8% (2,083.8) -6.1% -6.2% (1,604.4) -6.1% 21.9%
General and Adm. Expenses (843.3) -2.5% (1,146.2) -3.3% -26.4% (688.0) -2.6% 22.6%
Net Financial Income (expense) 83.9 0.2% (702.0) -2.0% - (869.3) -3.3% -
Equity in earnings of subsidiaries 24.1 0.1% 6.3 0.0% 283.6% 4.7 0.0% 414.2%
Other Income (expense) 2.1 0.0% (142.1) -0.4% - (4.5) 0.0% -
Operating Income 2,089.4 6.2% 1,368.3 4.0% 52.7% 259.7 1.0% 704.5%
Income and social contribution taxes (561.3) -1.7% (661.4) -1.9% -15.1% (139.7) -0.5% 301.8%
Participation of non-controlling shareholders (134.4) -0.4% (88.1) -0.3% 52.5% (50.0) -0.2% 168.6%
Net Income (Loss) 1,393.7 4.1% 618.8 1.8% 125.2% 70.0 0.3% 1891.6%
Adjusted EBITDA 2,757.8 8.2% 3,289.7 9.6% -16.2% 1,749.7 6.6% 57.6%
Net Income per share (R$) 0.48 0.21 125.4% 0.02 1877.7%
1Q15 4Q14 1Q14

8
EBITDA
JBS’s EBITDA in 1Q15 was R$ 2,757.8 million, a 57.6% increase over 1Q14, with an EBITDA margin of 8.2%. This
result reflects significant improvement at JBS Foods and PPC, which registered an increase of 62.2% and 77.2%,
respectively, compared to 1Q14, combined with the continuous improvement at JBS USA Beef operations which
turned from a negative US$22.5 million EBITDA in 1Q14 to US$ 186.6 million in 1Q15.
Net Financial Results
In 1Q15, JBS registered net financial results of R$83.9 million. Impact from exchange rate variation was R$ 3,757.0
million, compensated by R$ 4,489.0 million on derivative results. Interest expense was R$825.6 million, whilst
interest revenue was R$229.4 million. Taxes, contributions, tariffs and others resulted in a expense of R$52.8 million.
Income Tax and Social Contribution
In 1Q15, Income tax and social contribution (IT/SC) was R$561.3 million, equivalent to an effective tax rate of 26.9%.
The reduction over 1Q14 rate is due to the accounting effect of deferred IT/SC over accumulated losses in
subsidiaries acquired in recent years that until 2014 did not meet the accounting criteria.
Net Income
Net income in 1Q15, was R$1,393.7 million, an increase of 1,891,6% over 1Q14 and 125,5% over 4Q14. Earnings
per share was R$0.482.
CAPEX
In 1Q15, total capital expenditure (CAPEX) was R$4,610.3 million, of which R$3,905.2 due to the equity effect of
acquired companies, specifically to the acquisitions of Primo Smallgoods in Australia and Big Frango in Brazil, both
concluded in 1Q15. Additions to property, plant and equipment and intangible assets totaled R$705.2 million.
Approximately 42% was related to acquisitions, expansion and facility modernization and 58% to maintenance.
1Q15 Results
Consolidated Results
R$ million 1Q15 4Q14 ∆% 1Q14 ∆%
Net income for the period 1,528.1 706.9 116.2% 120.0 1173.3%
Financial income (expense), net -83.9 702.0 - 869.3 -
Current and diferred income taxes 561.3 661.4 -15.1% 139.7 301.8%
Depreciation and amortization 776.4 715.3 8.5% 614.1 26.4%
Equity in subsidiaries -24.1 -6.3 283.6% -4.7 414.2%
Restructuring, reorganization, donation and indemnity 0.0 510.4 - 11.3 -
(=) EBITDA 2,757.8 3,289.7 -16.2% 1,749.7 57.6%

9
10,46411,221
10,5469,475
10,356
1,714
1Q14 2Q14 3Q14 4Q14 1Q15
1Q15 Results
Consolidated Results
Cash Generation
In 1Q15 , the Company generated net cash flow from operations of R$4,538.0 million. Current and non-current financial
charges, which totaled R$4,451.6 million in 1Q15, refer to the elimination of the exchange rate variation and accrued interests,
since both do not have cash effect.
Free cash flow generation, after Capex and prior to acquisitions, was R$ 3,832.8 million. The cash generation in 1Q15 allowed
the Company to pay for the acquisitions of Primo Samllgoods in Australia and Big Frango without compromising its leverage,
financing JBS growth with resources from its own operational activities.
Indebtedness
JBS ended 1Q15 with a net debt of R$33.2 billion, after the acquisition of Primo Group, Big Frango and the payment of
extraordinary dividends at PPC, which totaled approximately R$5.5 billion.
JBS ended 1Q15 with leverage of 2.3x compared to 2.1x in 4Q14. The increase in leverage is due to the payment for the
acquisition of Primo Smallgoods, Big Frango, and payment of extraordinary dividends at Pilgrim’s, compensated by the cash
generation in the period. The leverage would have been 1.9x if adjusted prior to acquisitions and dividends.
Net Debt (R$ million) and Leverage Adjusted Net Debt in US$ (million)
1,9x
27.721
*
*
*Net debt and leverage net of acquisitions and extraordinary dividend payments effect, which totaled R$5.5 billion.
*
R$ million 03/31/15 12/31/14 Var.%
Gross debt 47,341.9 40,079.1 18.1%
(+) Short Term Debt 13,547.5 13,687.0 -1.0%
(+) Long Term Debt 33,794.4 26,392.2 28.0%
(-) Cash and Equivalents 14,120.8 14,910.4 -5.3%
Net debt 33,221.1 25,168.7 32.0%
Net debt/EBITDA 2.3x 2.1x
23,679 24,714 25,848 25,169
27,721
5,500
3.3x 3.2x2.5x
2.1x 2.3x
1Q14 2Q14 3Q14 4Q14 1Q15
Net debt Leverage
-8,8%

10
Indebtedness (cont.)
The Company ended the quarter with R$14,120.8 million in cash, equivalent to approximately 104% of its
short-term debt. In addition, JBS USA has US$1.5 billion fully available under revolving credit facilities that, if
added to the current cash position, represents 140% of short term debt.
The percentage of short-term debt (ST) in relation to total debt was 29% in 1Q15.
At the end of the period, 88% of JBS consolidated debt was denominated in U.S. dollars, with an average
cost of 5.23% per annum. The proportion of debt denominated in Reais, 12% of consolidated debt, has an
average cost of 11.45% per year.
29%
28%
30%
34%
29%
71%
72%
70%
66%
71%
1Q14
2Q14
3Q14
4Q14
1Q15
Short Term Long Term
Debt profile ST / LT
JBS S.A.50%
JBS Foods14%
JBS USA Holdings
36%
1Q15 Results
Consolidated Results
US$88%
R$12%
Breakdown by Currency &
Average Cost Breakdown by Company
11.45% per
annum
5.23% per
annum
Breakdown by Source
Capital Markets55,1%
Commercial Banks44,8%
BNDES0,1%

11
1Q15 Results
Analysis of Results by Business Unit
Highlights
JBS Foods
∆% ∆%
R$ % NR R$ % NR QoQ R$ % NR YoY
Net Revenue 3,874.5 100.0% 3,649.0 100.0% 6.2% 2,780.0 100.0% 39.4%
COGS (2,881.1) -74.4% (2,574.0) -70.5% 11.9% (2,076.5) -74.7% 38.7%
Gross Profit 993.4 25.6% 1,075.0 29.5% -7.6% 703.5 25.3% 41.2%
EBITDA 616.0 15.9% 656.1 18.0% -6.1% 379.8 13.7% 62.2%
1Q15 4Q14 1Q14
JBS Foods 1Q15 4Q14 ∆% 1Q14 ∆%
Birds Processed (thousand) 253,086.4 255,166.3 -0.8% 227,446.4 11.3%
Hogs processed (thousand) 1,113.4 1,185.8 -6.1% 1,033.3 7.8%
JBS Foods posted net revenues of R$3,874.5 million, a 39.4% growth compared to 1Q14. Such performance comes
from acquisitions made during the recent quarters, as well as from operational efficiency gains and organic growth,
aligned with the continuing successful execution strategy implemented throughout the last quarters.
The company ended the quarter with a total of 253.1 million birds and 1.1 million hogs processed. Bird processing
grew 11.3% in 1Q15 when compared to the same period of last year, while hog processing went up by 7.8%,
positively impacted by acquisitions and asset purchases that occurred in 2014.
In Brazil, sales volume grew expressively in all three categories. Fresh poultry grew by 127.2%, partially offset by a
11.3% decrease in sales prices due to higher volumes of fresh poultry within the quarter’s sales mix. Prepared and
processed products grew by 24.0% in volume, combined with a 7.6% increase in average sales prices.
On the export market, fresh poultry sales volumes increased by 19.1%, coupled with an average price increase of
14.7%, driven by sales to the Middle East, China and South Korea. Pork volumes decreased by 29.9% on the back
of lower demand from Russia, partially offset by a 16.7% growth in sales price in comparison to the 1Q14.
Gross margin was slightly better than in 1Q14, while sales, general and administrative expenses decreased
significantly when compared to the same period of last year. EBITDA amounted to R$616.0 million, 62.2% higher
year on year, with an EBITDA margin of 15.9%.
JBS Foods continues to generate synergies and increased efficiencies at the acquired companies, while constantly
improving product quality, service level, and execution at the points of sale, all of which are reflected in successive
market share gains posted by the company.

12
1Q15 Results
Analysis of Results by Business Unit
Breakdown of Net Revenue
JBS Foods
Domestic Market 1Q15 4Q14 ∆% 1Q14 ∆%
Net Revenue (million R$)
Fresh Poultry 665.8 608.1 9.5% 330.4 101.5%
Fresh Pork 129.7 131.1 -1.1% 102.2 26.9%
Processed / Prepared Products 1,024.1 1,064.6 -3.8% 767.1 33.5%
Others 135.3 119.4 13.3% 79.9 69.3%
TOTAL 1,954.9 1,923.3 1.6% 1,279.7 52.8%
Volume (thousand tons)
Fresh Poultry 146.1 113.3 28.9% 64.3 127.2%
Fresh Pork 25.2 23.1 9.0% 18.5 35.7%
Processed / Prepared Products 169.6 172.4 -1.6% 136.8 24.0%
Others - - - - -
TOTAL 340.9 308.8 10.4% 219.6 55.2%
Average Price (R$/Kg)
Fresh Poultry 4.56 5.37 -15.1% 5.14 -11.3%
Fresh Pork 5.15 5.68 -9.3% 5.52 -6.6%
Processed / Prepared Products 6.04 6.18 -2.3% 5.61 7.6%
Others - - - - -
Exports 1Q15 4Q14 ∆% 1Q14 ∆%
Net Revenue (million R$)
Fresh Poultry 1,704.9 1,423.9 19.7% 1,248.8 36.5%
Fresh Pork 128.2 209.3 -38.8% 156.6 -18.2%
Processed / Prepared Products 86.5 92.5 -6.4% 94.9 -8.8%
Others - - - - -
TOTAL 1,919.5 1,725.7 11.2% 1,500.3 27.9%
Volume (thousand tons)
Fresh Poultry 304.5 278.0 9.5% 255.8 19.1%
Fresh Pork 16.8 23.5 -28.5% 24.0 -29.9%
Processed / Prepared Products 9.4 13.2 -28.8% 13.3 -29.2%
Others - - - - -
TOTAL 330.8 314.7 5.1% 293.0 12.9%
Average Price (R$/Kg)
Fresh Poultry 5.60 5.12 9.3% 4.88 14.7%
Fresh Pork 7.62 8.91 -14.4% 6.54 16.7%
Processed / Prepared Products 9.18 6.99 31.4% 7.13 28.7%
Others - - - - -

13
JBS Mercosul net revenue was R$6,782.3 million, an improvement of 18.5% compared to 1Q14. In the domestic
market, fresh beef sales volume grew 15.9%, combined with price increases of 7.0%. Prices of prepared products
increased by 20.4% and volumes remained practically stable in comparison to 1Q14. In the international market,
fresh beef sales volume declined by 15.3%, compensated by sales prices, which were 25.3% higher in the period in
local currency. Exports were impacted by lower demand in the main importing countries, such as Russia, Venezuela
and Egypt.
Higher cattle prices impacted gross margins, which deteriorated from 24.4% in 1Q14 to 19.6% in the quarter. Sales,
general and administrative expenses remained stable. EBITDA was R$376.4 million, a decline of 29.5% regarding
1Q14, with an EBITDA margin of 5.6%.
The management team at JBS Mercosul adopted initiatives to increase productivity during 2014, benchmarking
against JBS global facilities, leading to significant results. In Brazil, productivity gains in slaughter and deboning were
6.1% and 9.2%, respectively, in comparison with 1Q14. In Paraguay and Uruguay, increase in productivity in the
plants surpassed 30%, combined with deboning productivity gains in both countries. In the leather business, there
were gains above10% in the Wet Blue and semi-finished segments.
The JBS Mercosul operation has a strategic geographic position, combining low cost operations and expanding
customer bases. The company has benefited from investments in brands and value added products, which
translated into better pricing and stronger fidelity links with strategic customers.
1Q15 Results
Analysis of Results by Business Unit
JBS Mercosul
Highlights
∆% ∆%
R$ % NR R$ % NR QoQ R$ % NR YoY
Net Revenue 6,782.3 100.0% 7,545.7 100.0% -10.1% 5,725.3 100.0% 18.5%
COGS (5,455.2) -80.4% (5,956.2) -78.9% -8.4% (4,326.1) -75.6% 26.1%
Gross Profit 1,327.1 19.6% 1,589.5 21.1% -16.5% 1,399.2 24.4% -5.2%
EBITDA 376.4 5.6% 534.1 7.1% -29.5% 596.1 10.4% -36.8%
1Q15 4Q14 1Q14
JBS Mercosul 1Q15 4Q14 ∆% 1Q14 ∆%
Bovine processed (thousand) 2,287.6 2,471.4 -7.4% 2,244.7 1.9%

14
1Q15 Results
Analysis of Results by Business Unit
JBS Mercosul
Breakdown of Net Revenue
Domestic Market 1Q15 4Q14 ∆% 1Q14 ∆%
Net Revenue (million R$)
Fresh and Chilled Products 3,240.0 3,436.3 -5.7% 2,612.7 24.0%
Processed Products 371.1 330.7 12.2% 311.2 19.2%
Others 482.9 474.9 1.7% 398.5 21.2%
TOTAL 4,094.0 4,242.0 -3.5% 3,322.5 23.2%
Volume (thousand tons)
Fresh and Chilled Products 347.6 369.4 -5.9% 299.9 15.9%
Processed Products 43.6 40.3 8.2% 44.0 -1.0%
Others 155.7 181.3 -14.1% 163.1 -4.5%
TOTAL 547.0 590.9 -7.4% 507.0 7.9%
Average Price (R$/Kg)
Fresh and Chilled Product 9.32 9.30 0.2% 8.71 7.0%
Processed Items 8.51 8.21 3.7% 7.07 20.4%
Others 3.10 2.62 18.3% 2.44 27.0%
Exports 1Q15 4Q14 ∆% 1Q14 ∆%
Net Revenue (million R$)
Fresh and Chilled Products 1,626.2 2,174.6 -25.2% 1,532.8 6.1%
Processed Products 259.8 237.9 9.2% 207.4 25.3%
Others 802.3 891.2 -10.0% 662.6 21.1%
TOTAL 2,688.3 3,303.7 -18.6% 2,402.8 11.9%
Volume (thousand tons)
Fresh and Chilled Products 146.8 191.2 -23.2% 173.4 -15.3%
Processed Products 18.7 18.3 2.2% 13.3 40.7%
Others 44.6 68.8 -35.2% 45.9 -2.7%
TOTAL 210.1 278.3 -24.5% 232.5 -9.6%
Average Price (R$/Kg)
Fresh and Chilled Beef 11.08 11.37 -2.6% 8.84 25.3%
Processed Beef 13.91 13.02 6.8% 15.63 -11.0%
Others 17.98 12.95 38.9% 14.44 24.5%

15
This business unit posted net revenues of US$5.19 billion, expanding 14.8% compared to 1Q14, supported by the
increase in sales prices of 16.7% in domestic and 6.4% in export markets. Volumes sold in the international market
increased 4.2% over 1Q14, while volumes in the domestic market remained stable. The number of animals
processed decreased 1.1% in comparison to the same period last year.
EBITDA was US$186.6 million in the quarter, compared to a negative US$22.5 million in 1Q14. EBITDA margin was
3.6%. The company was successful in its cattle procurement strategy, aligned with better pricing of its products,
which contributed to expanding the gross margin in the period.
Independent management of the fed cattle and regional businesses allowed the company more flexibility and agility
in the decision-making process and faster adjustments to market conditions.
In Australia, the weakening of the local currency partially compensated the increase in raw material costs and
operations, preserving the good performance presented in the last few quarters. Australia has unique sanitary
conditions and has benefited from free trade agreements signed with the major beef importers in Asia.
Highlights (US GAAP)
Breakdown of Net Revenue
JBS USA Beef (including Australia and Canada)
1Q15 Results
Analysis of Results by Business Unit
∆% ∆%
US$ % NR US$ % NR QoQ US$ % NR YoY
Net Revenue 5,190.5 100.0% 5,923.7 100.0% -12.4% 4,520.7 100.0% 14.8%
COGS (5,005.7) -96.4% (5,594.8) -94.4% -10.5% (4,556.5) -100.8% 9.9%
Gross Profit 184.8 3.6% 328.9 5.6% -43.8% (35.8) -0.8% -
EBITDA 186.6 3.6% 325.1 5.5% -42.6% -22.5 -0.5% -
1Q15 4Q14 1Q14
JBS USA Beef (including AUS and CAN) 1Q15 4Q14 ∆% 1Q14 ∆%
Bovine processed (thousand) 2,206.4 2,338.6 -5.7% 2,230.1 -1.1%
Domestic Market 1Q15 4Q14 ∆% 1Q14 ∆%
Net Revenue (US$ million) 3,818.3 4,163.4 -8.3% 3,283.4 16.3%
Volume (tons) 849.4 876.2 -3.1% 852.2 -0.3%
Average Price (US$/Kg) 4.50 4.75 -5.4% 3.85 16.7%
Exports 1Q15 4Q14 ∆% 1Q14 ∆%
Net Revenue (US$ million) 1,372.2 1,760.3 -22.0% 1,237.3 10.9%
Volume (tons) 294.9 317.6 -7.1% 282.9 4.2%
Average Price (US$/Kg) 4.65 5.54 -16.1% 4.37 6.4%

16
Net revenue in the pork business was US$762.3 million, a reduction of 15.0% compared to 1Q14. Sales were
impacted by the pork prices decline of 20.3% in domestic and 6.3% in international markets, partially compensated
by higher volumes sold in both markets.
The reduction in pork prices reflects an oversupply of hogs, which on the other hand enabled better volumes. In
1Q15, the number of animals processed increased by 5.1% in comparison to 1Q14, allowing the company to dilute
operational fixed costs.
The pork business unit posted EBITDA of US$93.2 million, an expansion of 12.4% compared to the same period last
year, with an EBITDA margin of 12.2%. Cheaper raw material costs contributed to the expansion of 3.2pp in gross
margin relative to 1Q14 and explains the improvement in EBITDA in the quarter.
1Q15 Results
Analysis of Results by Business Unit
JBS USA Pork
Highlights (US GAAP)
Breakdown of Net Revenue
∆% ∆%
US$ % NR US$ % NR QoQ US$ % NR YoY
Net Revenue 762.3 100.0% 964.0 100.0% -20.9% 896.9 100.0% -15.0%
COGS (668.2) -87.7% (863.2) -89.5% -22.6% (815.4) -90.9% -18.1%
Gross Profit 94.1 12.3% 100.8 10.5% -6.6% 81.5 9.1% 15.6%
EBITDA 93.2 12.2% 95.7 9.9% -2.6% 82.9 9.2% 12.4%
1Q15 4Q14 1Q14
JBS US Pork 1Q15 4Q14 ∆% 1Q14 ∆%
Hogs Processed (thousand) 3,436.4 3,328.8 3.2% 3,270.6 5.1%
Domestic Market 1Q15 4Q14 ∆% 1Q14 ∆%
Net Revenue (US$ million) 613.9 799.8 -23.2% 741.3 -17.2%
Volume (thousand tons) 301.2 294.9 2.1% 289.7 4.0%
Average Price (US$/Kg) 2.04 2.71 -24.8% 2.56 -20.3%
Exports 1Q15 4Q14 ∆% 1Q14 ∆%
Net Revenue (US$ million) 148.5 164.2 -9.6% 155.6 -4.6%
Volume (thousand tons) 63.6 62.7 1.3% 62.5 1.8%
Average Price (US$/Kg) 2.34 2.62 -10.8% 2.49 -6.3%

17
Pilgrim’s Pride reported US$2.05 billion in 1Q15, an increase of 1.7% compared to the same period last year. In the
US, overall cutout pricing has remained strong, supported by the increase in consumption and more competitiveness
of chicken. Demand in international markets has softened over 1Q14, because of the closure of some markets
related to sanitary conditions, while importing demand from Mexico continued robust. Sales from PPC Mexican
operations increased 4% in volume in relation to 1Q14.
EBITDA totaled US$363.5 million, a 77.2% growth compared to 1Q14, and reflects the Company’s strategy to focus
on diversifying its products portfolio and management of its sales channels. The company has chosen to maintain its
exposure to small birds, which has strengthened PPC leadership in this segment, and increased overall profitability
of the business. Pilgrim’s also have leading positions in the big bird deboning and case-ready retail chicken and
approximately 20% of its total sales in prepared foods.
PPC net income in the quarter was US$204.2 million, an improvement of 108% compared to 1Q14. Free cash flow
generation was US$264.4 million after taxes and after US$32 million in capital investments. Management is
confident that its unique strategy is essential to lower overall volatility and a more consistent performance over an
extended period.
Highlights (US GAAP)
1Q15 Results
Analysis of Results by Business Unit
JBS USA Chicken (Pilgrim’s Pride Corporation - “PPC”)
∆% ∆%
US$ % NR US$ % NR QoQ US$ % NR YoY
Net Revenue 2,052.9 100.0% 2,110.4 100.0% -2.7% 2,018.1 100.0% 1.7%
COGS (1,675.8) -81.6% (1,731.3) -82.0% -3.2% (1,803.0) -89.3% -7.1%
Gross Profit 377.1 18.4% 379.1 18.0% -0.5% 215.1 10.7% 75.3%
EBITDA 363.5 17.7% 367.8 17.4% -1.2% 205.2 10.2% 77.2%
4Q14 1Q141Q15US$ Million

18
Table I – 1Q15 Breakdown of Production Costs by Business Unit (%)
Nota 1. Considera China e Hong Kong
1Q15 Results
Graph I - JBS Consolidated Exports Breakdown in 1Q14 and 1Q15
Tables and Charts
Africa and Middle East14,7%
Mexico 12,4%
South America 12,1%
Greater China¹ 11,5%
Japan 9,5%
USA 7,1%
E.U. 7,1%
Russia 6,4%
South Korea 5,4%
Canada 2,5%
Others 11,3%
1Q14
US$3,145.5
million
South America14,2%
Africa and Middle East13,4%
Greater China¹11,9%
Mexico11,9%USA
11,0%
Japan9,9%
E.U.6,7%
South Korea6,2%
Russia3,7%
Canada2,3%
Others8,7%
1Q15
US$ 3,547.3
million
Growth of 13% in 1QT15 exports
compared to 1Q14
1Q15 (%) Consolidated JBS Mercosul JBS Foods USA Beef USA Pork USA Chicken
Raw material (livestock) 82.0% 88.3% 62.6% 87.6% 78.9% 52.5%
Processing (including
ingredients and packaging)9.3% 6.4% 24.8% 5.3% 9.2% 29.3%
Labor Cost 8.7% 5.3% 12.6% 7.2% 11.9% 18.2%
Note 1: Includes China and Hong Kong

19
Head Office
Avenida Marginal Direita do Tietê, 500
CEP: 05118-100 – São Paulo – SP
Brasil
Phone: (55 11) 3144-4000
www.jbs.com.br
Investor Relations
Phone: (55 11) 3144-4224
email: [email protected]
www.jbs.com.br/ir
Indexes
Contact
1Q15 Results

20
This release contains forward-looking statements relating to the prospects of the business, estimates for
operating and financial results, and those related to growth prospects of JBS. These are merely projections
and, as such, are based exclusively on the expectations of JBS’ management concerning the future of the
business and its continued access to capital to fund the Company’s business plan. Such forward-looking
statements depend, substantially, on changes in market conditions, government regulations, competitive
pressures, the performance of the Brazilian economy and the industry, among other factors and risks
disclosed in JBS’ filed disclosure documents and are, therefore, subject to change without prior notice.
Disclaimer
1Q15 Results