#1NLab16 - Fortifying Big Data & Making Insights Count
25
NOV 2-4, 2016 Fortifying Big Data and Making Insights Count
-
Upload
one-north-interactive -
Category
Data & Analytics
-
view
309 -
download
0
Transcript of #1NLab16 - Fortifying Big Data & Making Insights Count
NOV 2-4, 2016
Fortifying Big Data and Making Insights Count

NOV 2-4, 2016
Ben Magnuson@1N_Ben
NOV 2-4, 2016
The Data Driven Organization
NOV 2-4, 2016
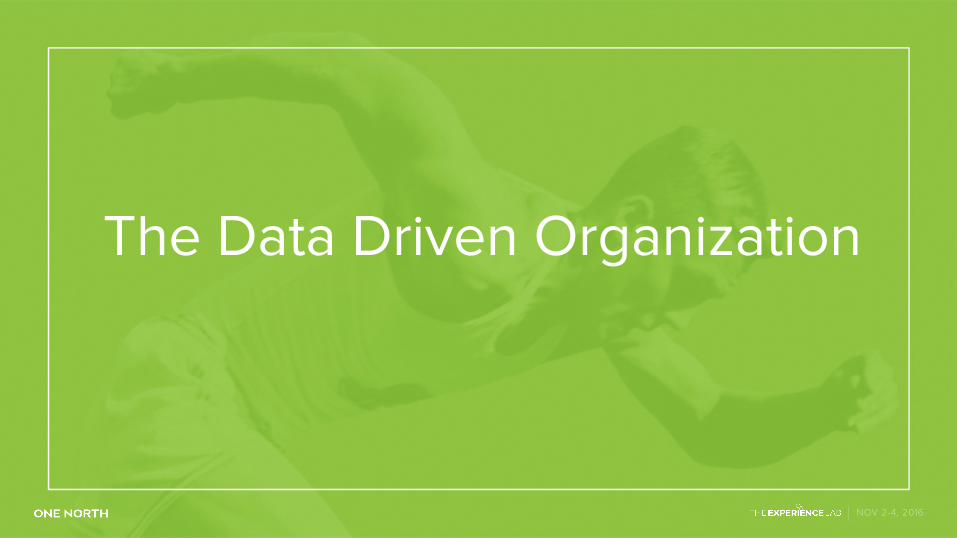
Decision Making is Changing
§ B2B seeing substantial growth in marketing technology and data
§ Companies more likely than ever to state their decision making is data-driven
§ Leaders in companies “substantially outperforming their competitors” are 166% more likely to make decisions based on data*
*Source: IBM’s Analytics: A Blueprint for Value

There Is More to Data Than Numbers
§ Big Data – extremely large sets of data, often unstructured, used to find patterns
§ Thick Data – ethnographic and qualitative measurements that introduce stories of value

NOV 2-4, 2016
What is measurable isn’t the same as what is valuable.
– Tricia Wang, Ethnography Matters
“
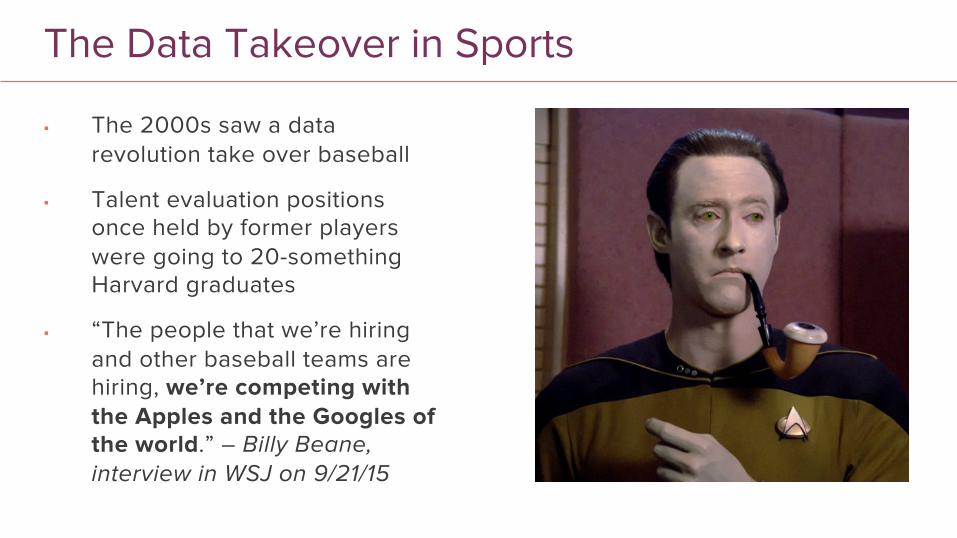
The Data Takeover in Sports
§ The 2000s saw a data revolution take over baseball
§ Talent evaluation positions once held by former players were going to 20-something Harvard graduates
§ “The people that we’re hiring and other baseball teams are hiring, we’re competing with the Apples and the Googles of the world.” – Billy Beane, interview in WSJ on 9/21/15
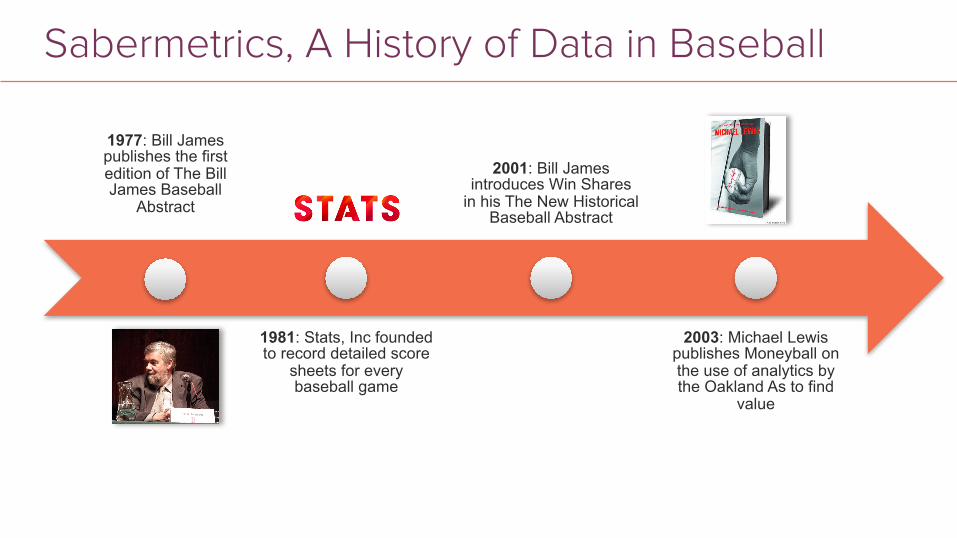
Sabermetrics, A History of Data in Baseball
1977: Bill James publishes the first edition of The Bill James Baseball
Abstract
1981: Stats, Inc founded to record detailed score
sheets for every baseball game
2001: Bill James introduces Win Shares
in his The New Historical Baseball Abstract
2003: Michael Lewis publishes Moneyball on the use of analytics by the Oakland As to find
value
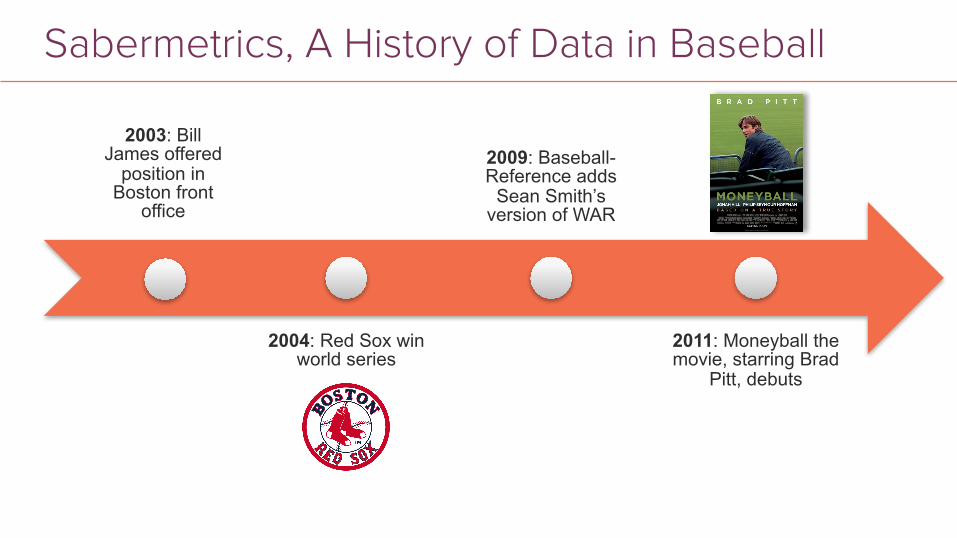
Sabermetrics, A History of Data in Baseball
2003: Bill James offered
position in Boston front
office
2004: Red Sox win world series
2009: Baseball-Reference adds
Sean Smith’s version of WAR
2011: Moneyball the movie, starring Brad
Pitt, debuts
NOV 2-4, 2016
Interesting ColorFull Image

NOV 2-4, 2016
Mike Trout – 10.3 WAR Miguel Cabrera - Triple Crown Winner
2012 MVP Race
NOV 2-4, 2016
When Spreadsheets Aren’t Enough
§ The success of baseball analytics led to similar movements in other major sports
§ While this introduced great new insights into game strategies and team performances, there was a struggle to introduce similar player valuations like WAR

Two Advanced Approaches§ Football Outsiders
§ DVOA – A method of evaluating teams, units or players. It takes every single play during the NFL season and compares each one to a league-average baseline based on situation.
§ When we say, "In 2014, Marshawn Lynch had a DVOA of 23.1%,” what we are really saying is “In 2014, Marshawn Lynch, playing in Darrell Bevell’s offensive system with the Seattle offensive line blocking for him and Russell Wilson selling the keeper when necessary, had a DVOA of 23.1%.“
§ Pro Football Focus
§ Grades – PFF takes a different approach and tries to assess value by observing every individual play and assigning a grade from -2 to +2
§ Tries to address the variability of different schemes and teammates by judging their execution in each individual play

NOV 2-4, 2016
PFF Grading Process
Step 1: Every player in every play is given a grade from -2 to 2
Step 2: A second scout grades the
same play
Step 3: Reconcile the differences
Step 4: We verify by sending tape to the Pro Coach Network

NOV 2-4, 2016
Providing Context

NOV 2-4, 2016
Comparing Big and Thick Data
§ Relies on machine learning
§ Reveals insights with a particular range of quantified data points
§ Loses resolution
§ Relies on human learning
§ Reveals the social context of connections between data points
§ Loses scale
*Source – Tricia Wang, Ethnography Matters
Big Data Thick Data

NOV 2-4, 2016
Measuring Value - Review
§ Identify goals
§ Establish key metrics
§ Measure results
§ Optimize performance
Complementing Big Data: Case Studies
§ Target has been at forefront of big data analysis and particularly predictive analytics
§ Earlier in 2016, the Minnesota Star-Tribune reported that Target CEO Brian Cornell was visiting customers homes “hoping to understand such things as consumers’ food choices, fashion trends and shopping habits”
Case Study: Grocer
§ Harvard Business Review published a story on the CEO of a high-end grocery chain in Europe that was seeing it’s sales decline
§ Customers were no longer shopping there as frequently or buying as much
§ Conducted a survey, where customers said they were willing to pay more for quality
§ If that was case, why weren’t they going to the high end store?

NOV 2-4, 2016
Case Study: Grocer
§ They ran an anthropological study where they embedded recorders with their customers for 2 months
§ Found that the idea of the family dinner was frayed
§ Customers were shopping less because often on the go, and shopping at smaller stores that offered quicker meals
§ Revamped stores to have “mini-stores” within. Sales improved.
NOV 2-4, 2016
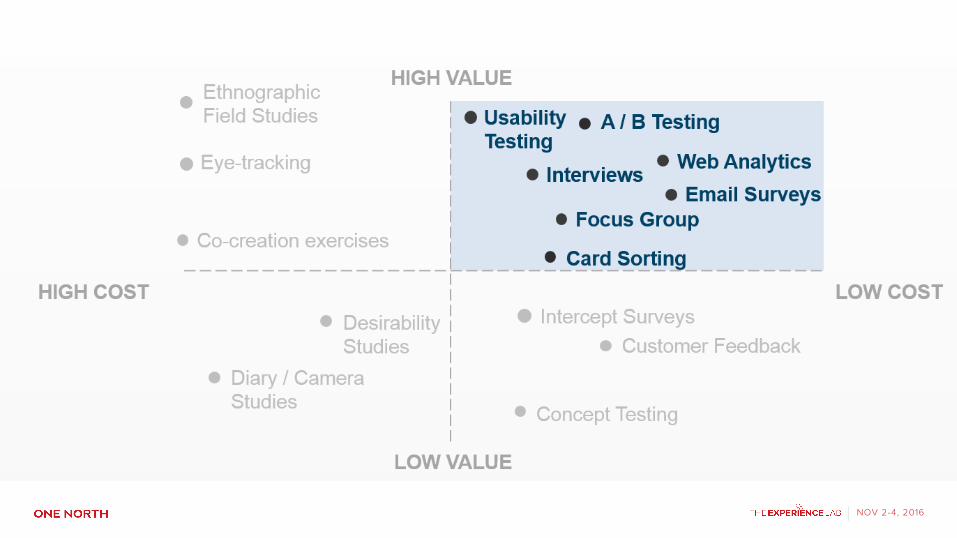
Practical Applications of Thick Data
NOV 2-4, 2016
Classic MonochromaticFull Image

NOV 2-4, 2016
Takeaways
§ Digital data insights is an active experience
§ Find your KPIs and organize your analytics to measure the success of your goals
§ If the measurements are telling you the what, but not the why, use thick data techniques such as interviewing and usability testing

NOV 2-4, 2016
Questions?

NOV 2-4, 2016
Fortifying Big Data and Making Insights Count