1.INTRODUCTION LOW PRESSURE VERIFICATION OF GAS ULTRASONIC ... · PDF fileLow pressure...
4
Science is but a perversion of itself unless it has as its ultimate goal the betterment of humanity. Nikola Tesla Scientific activity is addressed to sa- tisfy curiosity and solve hesitations about how natural laws are arran- ged and which ones they are. We are confident that national and international scientific communi- ty will use MET&FLU Journal as a tool to share the highest and most relevant discoveries, readers will find every semester a pleasing topic which will allow transferring knowledge at the step that our so- ciety demands. Abstract The metrological confirmation process, applied to gas ultra- sonic flow meters inside the terms given by the technical stan- dard ISO 10012, represents a high challenge for the natural gas transmission companies who as TGI are interested in to establish a Measurement Management System based in this standard.. In this paper a metrological control proposal is described for exclusive application to ultrasonic flow meters (USMs) able to operate at low (atmospheric) pressures. It is based on the tests performed on 2 new flow meters DN150 (6”) which were calibrated at first in PIGSAR (Germany) using natural gas at high pressure as test fluid and later characterized with air at atmospheric pressure in CDT de GAS (Colombia). Juan Manuel Ortíz ([email protected]) John Fredy Velosa ([email protected]) Transportadora de Gas Internacional S.A. ESP Cra 34 No. 41-51 Bucaramanga - Colombia Henry Abril ([email protected]) Jose A. Fuentes ([email protected]) Jorge Reyes ([email protected]) Corporación CDT de GAS km 2 Via Refugio PTG, Piedecuesta - Colombia LOW PRESSURE VERIFICATION OF GAS ULTRASONIC FLOW METERS AS AN EFFICIENT SOLUTION TO THE METROLOGICAL CONFIRMATION PROCESS SUGGESTED IN ISO 10012 1. INTRODUCTION Measurements carried out in each custody trans- fer point (reception or delivery), are one of the key processes for fulfilling the social purpose of natural gas transport companies, because such measurements allow controlling gas balances and invoicing transport services. In Colombia, the regulations [1] dealing with measurement processes do not conform to OIML R140 [2] in matters of the performance speci- fications require by the elements making up a measurement system, however, such regulation do state an overall performance applied to measurement systems as well as a control limit for gas balances of transport network. Taking into account these aspects the metrological assurance for correlated magnitude, such as pres- sure, temperature, volume and energy, is defined. Carrying out such metrological assurance, according to standards established at worldwide, implies making an investment at a different le- vel of the process which cover both installed elements and results obtained by measurement processes. In Colombia, since 2007, Transportadora de Gas Internacional (TGI) S.A., along with the tech- nological support of CDT de GAS Corporation, has gradually used a measurement management system based on international standard ISO 10012, which allows improving gas balances and keeping it under control (328 measurement system of transfer custody in a 3957-kilometer pipeline system), in order to obtain the best cost/benefit ratio from a world perspective. 2. METROLOGICAL CONFIRMATION The use of a metrological confirmation program is technically and economically feasible in a local background for magnitudes such as pressure, temperature and energy, considering both metrological infrastructure and mecha- nisms for its implementation. Nevertheless, in the particular case of measurement of gas volume, using a metrological confirmation program is constrained due to factors such as: a. Scarce availability of calibration labora- tories for ranges of flow rate and pressure such as those used in transport pipeline systems. In Colombia, calibration laboratories operate using air at atmospheric pressure and just one laboratory uses natural gas, at approximately 17 Bar. b. Logistics aspects required for moving a meter from its location to a laboratory. c. Need for appealing to reconciliation methods due to absence of a back meter during a calibration process. d. Investments required and maintenance costs of the model once implemented. 2.1. Usual practice for metrological confirmation of volume meters In the case of some measurement technologies used in custody transfer, such as rotary, turbine and Coriolis meters, the troubles described above may be overcome relatively easily, consi- dering the laboratories structure allowing each element’s performance evaluation in a proper way, according to standard applicable to each measurement technology. Nonetheless, in the case of ultrasonic meters (USM), there is no agreement related to a methodology applied to its metrological confirmation. This can be evidenced for the absence of guidelines or recommendations that allow setting such calibration intervals. Experimental works presented by C. Coull and E. Spearman [3] for example, attempted to determine USM performance with time through periodical calibrations. Those studies, however, were not conclusive as for the sources genera- ting the deviations found and the possibility to predict other meters’ performance. On the other hand, some works have achieved to generate metrological confirmation strategies for USMs widely used in some sectors of indus- try, such as Peterson’s strategy - Lightbody [5], which is mainly applied in the United Kingdom. Such strategy considers that a new USM must be calibrated six months after being placed in operation, then, six more months later, a second calibration must be carried out. In that time, if the difference FWME were less than 0,3% (between two subsequent calibrations), such USM would be qualified for a yearly calibration. Additionally to Peterson’s strategy, the possibi- lity of using USM diagnostic tools as a means of extending its calibration intervals is posed. Ciencia Low pressure verification of Gas Ultrasonic Flow Meters as an efficient solution to the Metrological confirmation process suggested in ISO 10012
Transcript of 1.INTRODUCTION LOW PRESSURE VERIFICATION OF GAS ULTRASONIC ... · PDF fileLow pressure...
Science is but a perversion of itself unless it has as its ultimate goal the betterment of humanity. Nikola Tesla
Scientific activity is addressed to sa-tisfy curiosity and solve hesitations about how natural laws are arran-ged and which ones they are.
We are confident that national and international scientific communi-ty will use MET&FLU Journal as a tool to share the highest and most relevant discoveries, readers will find every semester a pleasing topic which will allow transferring knowledge at the step that our so-ciety demands.
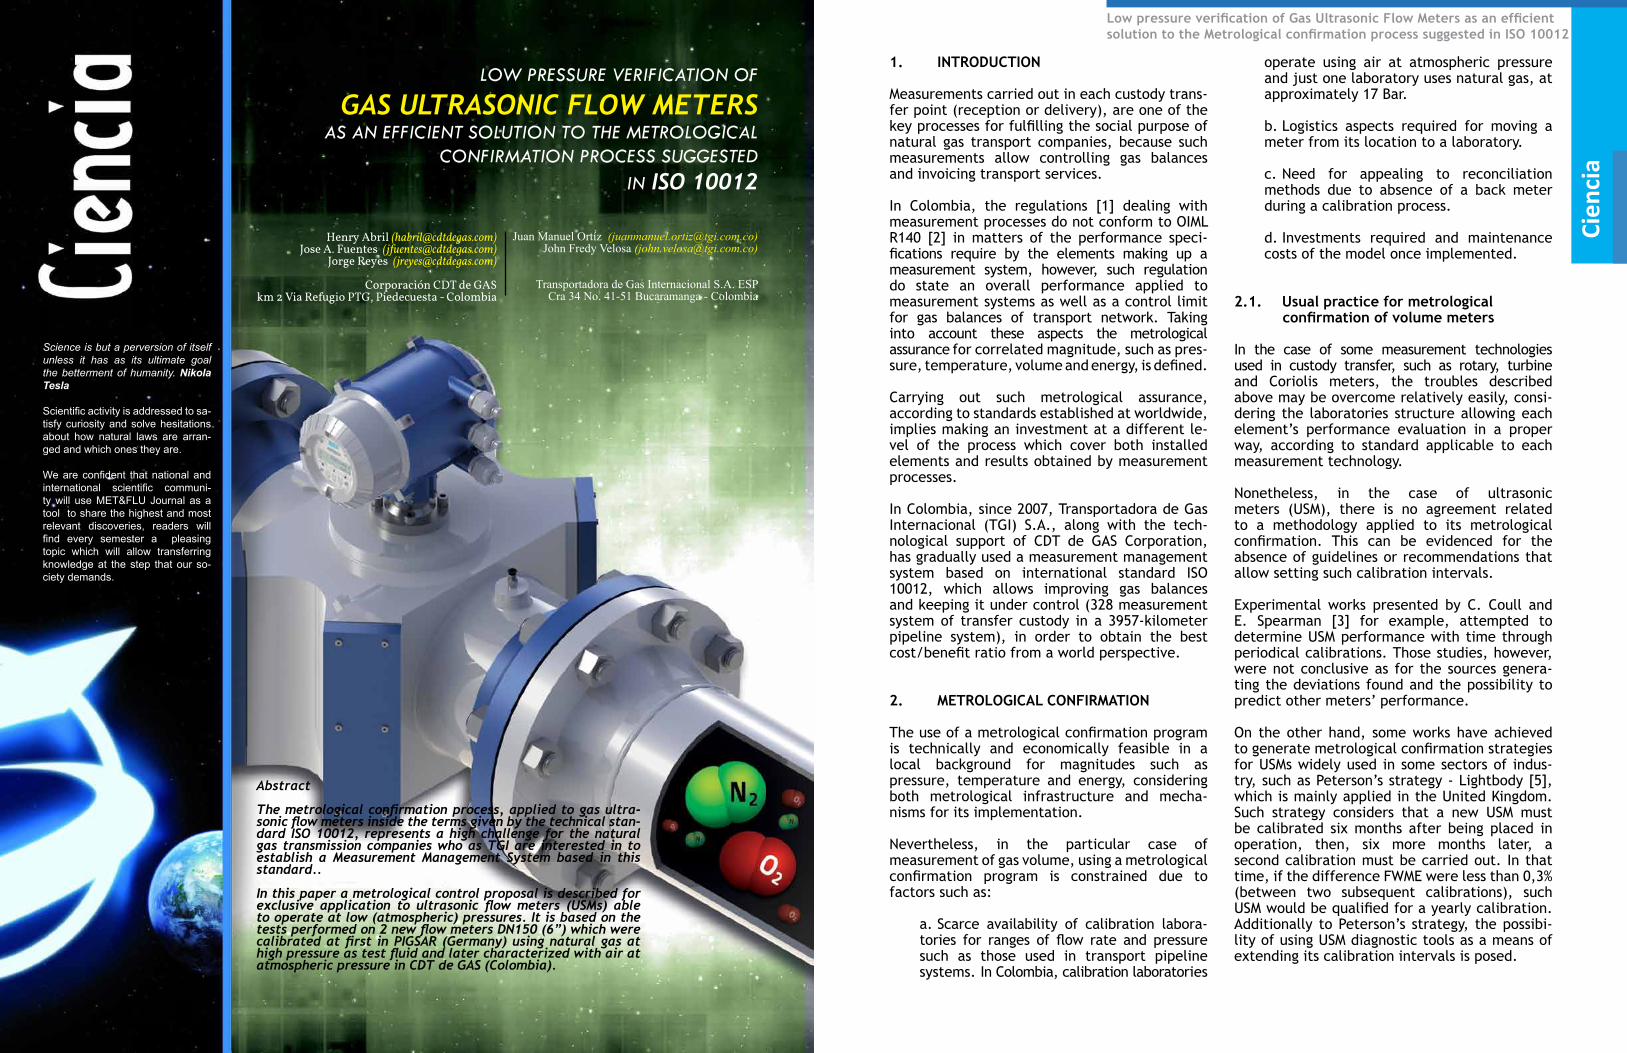
Abstract The metrological confirmation process, applied to gas ultra-sonic flow meters inside the terms given by the technical stan-dard ISO 10012, represents a high challenge for the natural gas transmission companies who as TGI are interested in to establish a Measurement Management System based in this standard..
In this paper a metrological control proposal is described for exclusive application to ultrasonic flow meters (USMs) able to operate at low (atmospheric) pressures. It is based on the tests performed on 2 new flow meters DN150 (6”) which were calibrated at first in PIGSAR (Germany) using natural gas at high pressure as test fluid and later characterized with air at atmospheric pressure in CDT de GAS (Colombia).
Juan Manuel Ortíz ([email protected])John Fredy Velosa ([email protected])
Transportadora de Gas Internacional S.A. ESPCra 34 No. 41-51 Bucaramanga - Colombia
Henry Abril ([email protected])Jose A. Fuentes ([email protected])
Jorge Reyes ([email protected])
Corporación CDT de GASkm 2 Via Refugio PTG, Piedecuesta - Colombia
LOW PRESSURE VERIFICATION OF
GAS ULTRASONIC FLOW METERS AS AN EFFICIENT SOLUTION TO THE METROLOGICAL
CONFIRMATION PROCESS SUGGESTEDIN ISO 10012
1. INTRODUCTION
Measurements carried out in each custody trans-fer point (reception or delivery), are one of the key processes for fulfilling the social purpose of natural gas transport companies, because such measurements allow controlling gas balances and invoicing transport services.
In Colombia, the regulations [1] dealing with measurement processes do not conform to OIML R140 [2] in matters of the performance speci-fications require by the elements making up a measurement system, however, such regulation do state an overall performance applied to measurement systems as well as a control limit for gas balances of transport network. Taking into account these aspects the metrological assurance for correlated magnitude, such as pres-sure, temperature, volume and energy, is defined.
Carrying out such metrological assurance, according to standards established at worldwide, implies making an investment at a different le-vel of the process which cover both installed elements and results obtained by measurement processes.
In Colombia, since 2007, Transportadora de Gas Internacional (TGI) S.A., along with the tech-nological support of CDT de GAS Corporation, has gradually used a measurement management system based on international standard ISO 10012, which allows improving gas balances and keeping it under control (328 measurement system of transfer custody in a 3957-kilometer pipeline system), in order to obtain the best cost/benefit ratio from a world perspective.
2. METROLOGICAL CONFIRMATION
The use of a metrological confirmation program is technically and economically feasible in a local background for magnitudes such as pressure, temperature and energy, considering both metrological infrastructure and mecha-nisms for its implementation.
Nevertheless, in the particular case of measurement of gas volume, using a metrological confirmation program is constrained due to factors such as:
a. Scarce availability of calibration labora-tories for ranges of flow rate and pressure such as those used in transport pipeline systems. In Colombia, calibration laboratories
operate using air at atmospheric pressure and just one laboratory uses natural gas, at approximately 17 Bar.
b. Logistics aspects required for moving a meter from its location to a laboratory.
c. Need for appealing to reconciliation methods due to absence of a back meter during a calibration process.
d. Investments required and maintenance costs of the model once implemented.
2.1. Usual practice for metrological confirmation of volume meters
In the case of some measurement technologies used in custody transfer, such as rotary, turbine and Coriolis meters, the troubles described above may be overcome relatively easily, consi-dering the laboratories structure allowing each element’s performance evaluation in a proper way, according to standard applicable to each measurement technology.
Nonetheless, in the case of ultrasonic meters (USM), there is no agreement related to a methodology applied to its metrological confirmation. This can be evidenced for the absence of guidelines or recommendations that allow setting such calibration intervals.
Experimental works presented by C. Coull and E. Spearman [3] for example, attempted to determine USM performance with time through periodical calibrations. Those studies, however, were not conclusive as for the sources genera-ting the deviations found and the possibility to predict other meters’ performance. On the other hand, some works have achieved to generate metrological confirmation strategies for USMs widely used in some sectors of indus-try, such as Peterson’s strategy - Lightbody [5], which is mainly applied in the United Kingdom. Such strategy considers that a new USM must be calibrated six months after being placed in operation, then, six more months later, a second calibration must be carried out. In that time, if the difference FWME were less than 0,3% (between two subsequent calibrations), such USM would be qualified for a yearly calibration. Additionally to Peterson’s strategy, the possibi-lity of using USM diagnostic tools as a means of extending its calibration intervals is posed.
Cien
cia
Low pressure verification of Gas Ultrasonic Flow Meters as an efficient solution to the Metrological confirmation process suggested in ISO 10012
T. Kegel and S. English [3] developed an interes-ting predictive mathematical model to estimate the possible meter’s deviation with time, which would ease the estimation of USMs recalibra-tion periods using as inputs: meter size, working fluid mean velocity and the current recalibration period. This was done since they found no specification of such intervals in any AGA 9 edition.
Finally, it is important to mention that develo-pments on ultrasonic measurement, such as the usage of transductors for coupling low pressure wave, have opened the possibility of carrying out USM metrological confirmations, using air at atmospheric pressure as stated by [6]. This could lead to estimate that meter calibrations at low pressure may substitute high pressure calibrations, at least partially, particularly for recalibration processes, taking into account, of course, comparability between results at high and low pressure; and the economic advantages implied.
2.2. TGI’s Strategy for ISO 10012 implementation, associated to measurement of gas volume:
Taking into account the wide range of measu-rement systems in the TGI’s transport network, defining a unified strategy, applicable to its entire infrastructure, is not possible. This can be observed by means of a Pareto analysis from measured volume by each meter in relation to the total volume transported by TGI.
A-type Systems: 26 measurement systems quantifying 80% out of the total transported gas. Such meters are mainly ultrasonic meters and at a smaller extent, turbine flow meters.
B-type and C-type Systems: 302 measure-ment systems quantify 20% out of the total transported gas. These meters are mainly rotary meters and turbine flow meters and some Coriolis meters.
From the metrological confirmation practice previously described and the distribution of measurement systems according to their capacity, two scenarios for using of metrological confirmation were defined, each of them has its own particular strategy.
A-type Systems This strategy consists of taking advantage of technological updating process of measure-ment systems in order to implement USM whose technology allows verifications at atmospheric pressure. This allows taking good profit of the calibration facilities available locally.
B-type and C-type Systems
This strategy consisted in developing a mobile calibration facility able to carry out metrolo-gical calibration processes in-situ. Such facili-ty named M3Tlab [7] was developed by TGI in conjunction with CDT de GAS and is currently in a pre-operative stage in order to validate its performance and obtain accreditation ISO 17025.
3. METROLOGICAL CONFIRMATION STRATEGY FOR HIGH IMPACT SYSTEMS
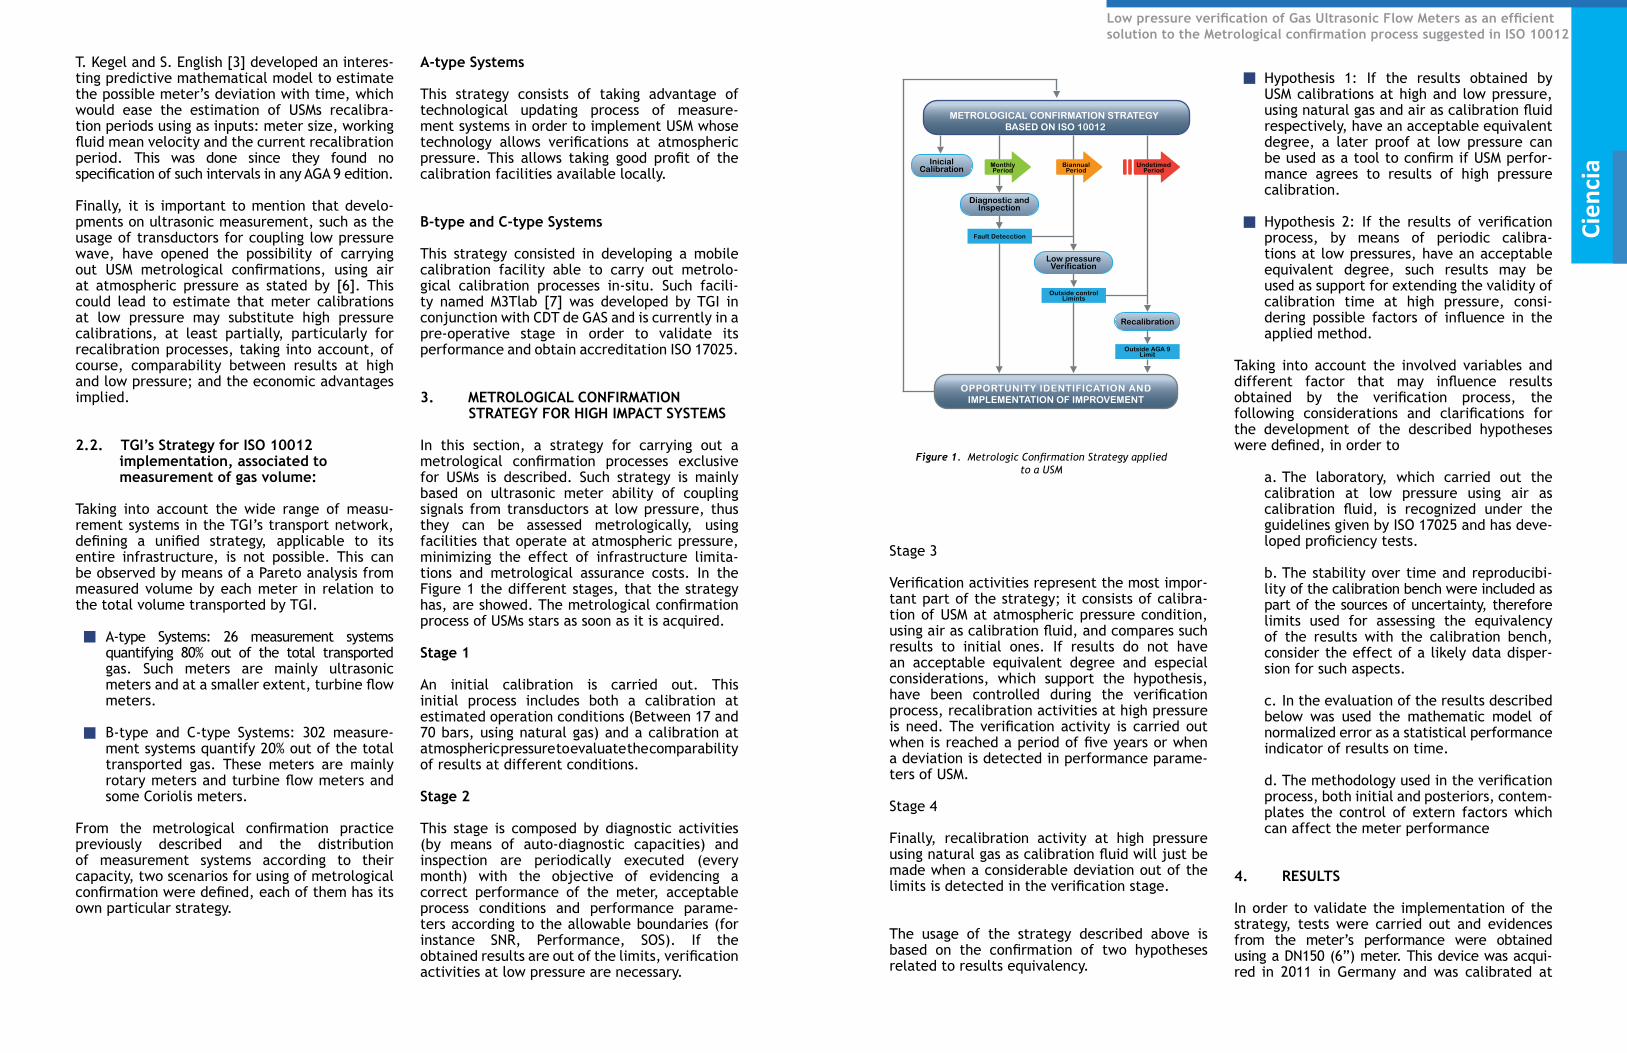
In this section, a strategy for carrying out a metrological confirmation processes exclusive for USMs is described. Such strategy is mainly based on ultrasonic meter ability of coupling signals from transductors at low pressure, thus they can be assessed metrologically, using facilities that operate at atmospheric pressure, minimizing the effect of infrastructure limita-tions and metrological assurance costs. In the Figure 1 the different stages, that the strategy has, are showed. The metrological confirmation process of USMs stars as soon as it is acquired.
Stage 1
An initial calibration is carried out. This initial process includes both a calibration at estimated operation conditions (Between 17 and 70 bars, using natural gas) and a calibration at atmospheric pressure to evaluate the comparability of results at different conditions.
Stage 2
This stage is composed by diagnostic activities (by means of auto-diagnostic capacities) and inspection are periodically executed (every month) with the objective of evidencing a correct performance of the meter, acceptable process conditions and performance parame-ters according to the allowable boundaries (for instance SNR, Performance, SOS). If the obtained results are out of the limits, verification activities at low pressure are necessary.
METROLOGICAL CONFIRMATION STRATEGY BASED ON ISO 10012
OPPORTUNITY IDENTIFICATION ANDIMPLEMENTATION OF IMPROVEMENT
InicialCalibration
Diagnostic andInspection
Low pressureVerification
Recalibration
Fault Detecction
Outside controlLimints
Outside AGA 9Limit
MonthlyPeriod
BiannualPeriod
UndetimedPeriod
Figure 1. Metrologic Confirmation Strategy applied to a USM
Stage 3
Verification activities represent the most impor-tant part of the strategy; it consists of calibra-tion of USM at atmospheric pressure condition, using air as calibration fluid, and compares such results to initial ones. If results do not have an acceptable equivalent degree and especial considerations, which support the hypothesis, have been controlled during the verification process, recalibration activities at high pressure is need. The verification activity is carried out when is reached a period of five years or when a deviation is detected in performance parame-ters of USM.
Stage 4
Finally, recalibration activity at high pressure using natural gas as calibration fluid will just be made when a considerable deviation out of the limits is detected in the verification stage.
The usage of the strategy described above is based on the confirmation of two hypotheses related to results equivalency.
Hypothesis 1: If the results obtained by USM calibrations at high and low pressure, using natural gas and air as calibration fluid respectively, have an acceptable equivalent degree, a later proof at low pressure can be used as a tool to confirm if USM perfor-mance agrees to results of high pressure calibration.
Hypothesis 2: If the results of verification process, by means of periodic calibra-tions at low pressures, have an acceptable equivalent degree, such results may be used as support for extending the validity of calibration time at high pressure, consi-dering possible factors of influence in the applied method.
Taking into account the involved variables and different factor that may influence results obtained by the verification process, the following considerations and clarifications for the development of the described hypotheses were defined, in order to
a. The laboratory, which carried out the calibration at low pressure using air as calibration fluid, is recognized under the guidelines given by ISO 17025 and has deve-loped proficiency tests.
b. The stability over time and reproducibi-lity of the calibration bench were included as part of the sources of uncertainty, therefore limits used for assessing the equivalency of the results with the calibration bench, consider the effect of a likely data disper-sion for such aspects.
c. In the evaluation of the results described below was used the mathematic model of normalized error as a statistical performance indicator of results on time.
d. The methodology used in the verification process, both initial and posteriors, contem-plates the control of extern factors which can affect the meter performance
4. RESULTS
In order to validate the implementation of the strategy, tests were carried out and evidences from the meter’s performance were obtained using a DN150 (6”) meter. This device was acqui-red in 2011 in Germany and was calibrated at
Cien
cia
Low pressure verification of Gas Ultrasonic Flow Meters as an efficient solution to the Metrological confirmation process suggested in ISO 10012
high pressure in PIGSAR and, as soon as it arrived in CDT de GAS facilities, before commissioning, it was calibrated at atmospheric pressure using air as the working fluid. In February 2013 the meter was tested again, running at atmospheric pressure.
4.1. Equivalence of results at high and low pressure: initial calibrations in laboratories
The initial calibration was carried out at operating conditions (high pressure 13, 79 bar -200 psig) in PIGSAR Germany. Both the calibra-tion and atmospheric pressure characterization were performed using upstream and downs-tream pipelines in order to mitigate the effects of “different installation conditions” and the possible misalignment effects described in [4]. During the calibration and characterization processes the self-diagnosis reports necessary for its use as base line were issued as well as the results of calibration and characterization at low pressu-re, which allow showing further deviations. The results of the calibrations of the meter under evaluation at natural gas pressure and the calibration with air at atmospheric pressure (acquired in 2011), are shown below (figure 2).
In order to evaluate the equivalence of the results obtained with a meter at different opera-ting conditions, a comparative analysis between calibration results obtained by PIGSAR and CDT de GAS was performed
Figure 2. PIGSAR calibration curves (high pressure) and CDT de GAS (atmospheric pressure)
-2,00
-1,50
-1,00
-0,50
0,00
0,50
1,00
1,50
2,00
0 200 400 600 800 1000 1200 1400 1600
Erro
r Pro
med
io [%
]
Caudal Promedio [m3/h]
CDT de GAS 2011 CDT de GAS 2013
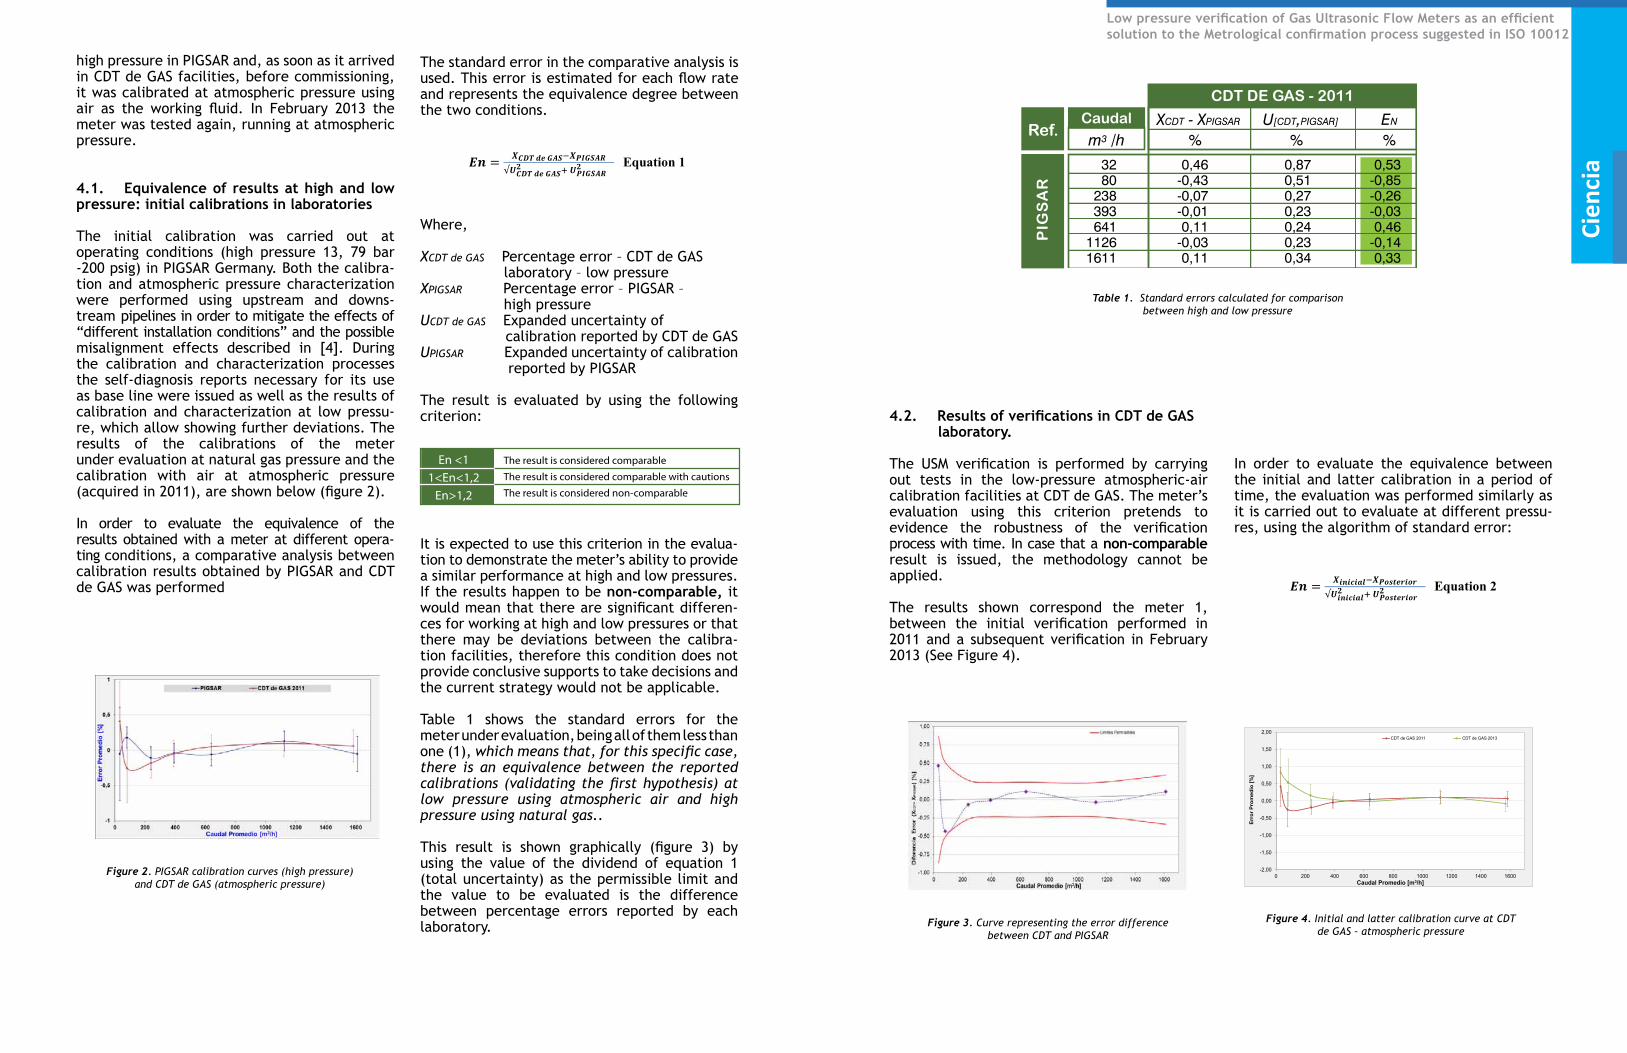
The standard error in the comparative analysis is used. This error is estimated for each flow rate and represents the equivalence degree between the two conditions.
Where,
XCDT de GAS Percentage error – CDT de GAS laboratory – low pressureXPIGSAR Percentage error – PIGSAR – high pressureUCDT de GAS Expanded uncertainty of calibration reported by CDT de GASUPIGSAR Expanded uncertainty of calibration reported by PIGSAR
The result is evaluated by using the following criterion:
It is expected to use this criterion in the evalua-tion to demonstrate the meter’s ability to provide a similar performance at high and low pressures. If the results happen to be non-comparable, it would mean that there are significant differen-ces for working at high and low pressures or that there may be deviations between the calibra-tion facilities, therefore this condition does not provide conclusive supports to take decisions and the current strategy would not be applicable.
Table 1 shows the standard errors for the meter under evaluation, being all of them less than one (1), which means that, for this specific case, there is an equivalence between the reported calibrations (validating the first hypothesis) at low pressure using atmospheric air and high pressure using natural gas..
This result is shown graphically (figure 3) by using the value of the dividend of equation 1 (total uncertainty) as the permissible limit and the value to be evaluated is the difference between percentage errors reported by each laboratory.
Both the calibration and atmospheric pressure characterization were performed using upstream and downstream pipelines in order to mitigate the effects of “different installation conditions” and the possible misalignment effects described in [4]. During the calibration and characterization processes the self-diagnosis reports necessary for its use as base line were issued as well as the results of calibration and characterization at low pressure, which allow showing further deviations. The results of the calibrations of the meter under evaluation at natural gas pressure and the calibration with air at atmospheric pressure (acquired in 2011), are shown below (figure 2). . Figure 2. PIGSAR calibration curves (high pressure) and CDT de GAS (atmospheric pressure)
In order to evaluate the equivalence of the results obtained with a meter at different operating conditions, a comparative analysis between calibration results obtained by PIGSAR and CDT de GAS was performed The standard error in the comparative analysis is used. This error is estimated for each flow rate and represents the equivalence degree between the two conditions.
Equation 1
Where,
XCDT de GAS Percentage error – CDT de GAS laboratory – low pressure
XPIGSAR Percentage error – PIGSAR – high pressure
UCDT de GAS Expanded uncertainty of calibration reported by CDT de GAS
UPIGSAR Expanded uncertainty of calibration reported by PIGSAR
The result is evaluated by using the following criterion:
En <1 The result is considered comparable 1<En<1,2 The result is considered comparable
with cautions En>1,2 The result is considered non-
comparable
It is expected to use this criterion in the evaluation to demonstrate the meter’s ability to provide a similar performance at high and low pressures. If the results happen to be non-comparable, it would mean that there are significant differences for working at high and low pressures or that there may be deviations between the calibration facilities, therefore this condition does not provide conclusive supports to take decisions and the current strategy would not be applicable. Table 1. Standard errors calculated for comparison between high and low pressure
Table 1 shows the standard errors for the meter under evaluation, being all of them less than one (1), which means that, for this specific case, there is an equivalence between the reported calibrations (validating the first hypothesis) at low pressure using atmospheric air and high pressure using natural gas.. This result is shown graphically (figure 3) by using the value of the dividend of equation 1 (total uncertainty) as the permissible limit and the value to be evaluated is the difference between percentage errors reported by each laboratory. Figure 3. Curve representing the error difference between CDT and PIGSAR
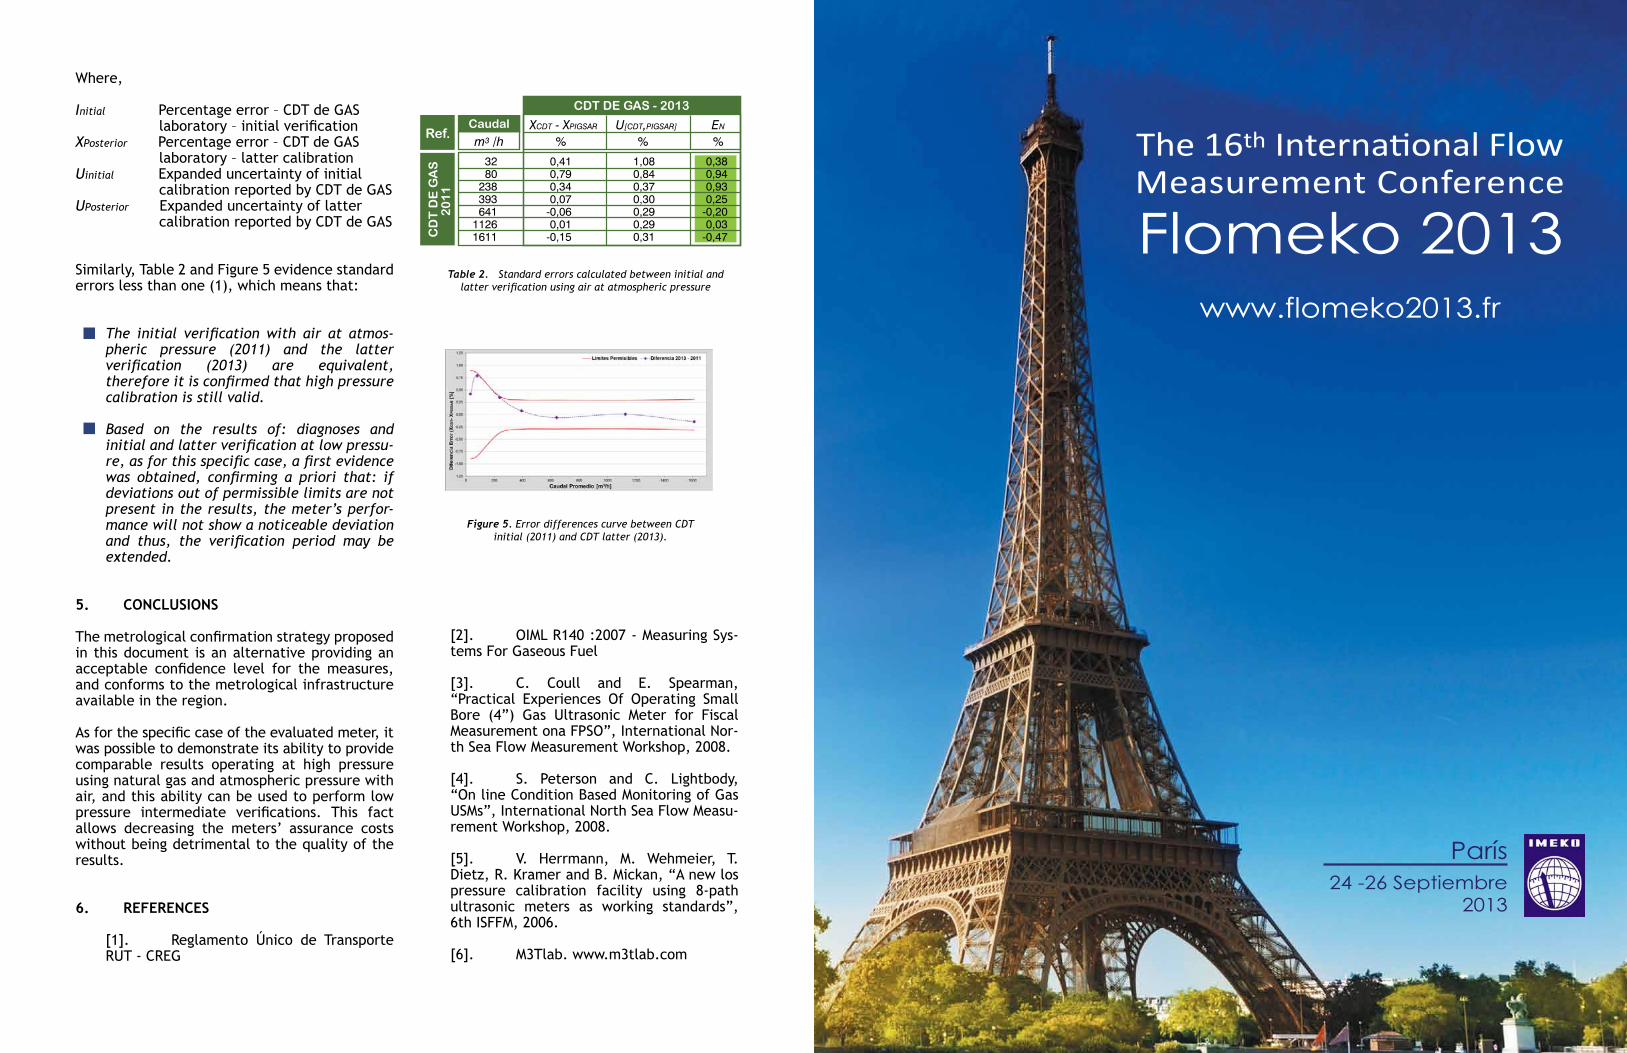
4.2. Results of verifications in CDT de GAS laboratory.
The USM verification is performed by carrying out tests in the low-pressure atmospheric-air calibration facilities at
Caudal XCDT - XPIGSAR U[CDT,PIGSAR] EN
m3/h % % %32 0,46 0,87 0,5380 -0,43 0,51 -0,85
238 -0,07 0,27 -0,26393 -0,01 0,23 -0,03641 0,11 0,24 0,461126 -0,03 0,23 -0,141611 0,11 0,34 0,33
CDT DE GAS - 2011
Ref.
PIGS
AR
En <11<En<1,2
En>1,2
The result is considered comparable
The result is considered comparable with cautions
The result is considered non-comparable
En <11<En<1,2
En>1,2
El resultado se considera comparable
El resultado se considera comparable con reserva
El resultado se considera no comparable
CDT DE GAS - 2011
PIG
SA
R
Ref.Caudal
m3 /h
3280
238393641
11261611
0,46-0,43-0,07-0,010,11
-0,030,11
0,870,510,270,230,240,230,34
0,53-0,85-0,26-0,030,46
-0,140,33
% % %XCDT - XPIGSAR U[CDT,PIGSAR] EN
CDT de GAS. The meter’s evaluation using this criterion pretends to evidence the robustness of the verification process with time. In case that a non-comparable result is issued, the methodology cannot be applied.
Figure 4. Initial and latter calibration curve at CDT de GAS – atmospheric pressure
The results shown correspond the meter 1, between the initial verification performed in 2011 and a subsequent verification in February 2013 (See Figure 4). In order to evaluate the equivalence between the initial and latter calibration in a period of time, the evaluation was performed similarly as it is carried out to evaluate at different pressures, using the algorithm of standard error:
Equation 2
Where,
Initial Percentage error – CDT de GAS laboratory – initial verification
XPosterior Percentage error – CDT de GAS laboratory – latter calibration
Uinitial Expanded uncertainty of initial calibration reported by CDT de GAS
UPosterior Expanded uncertainty of latter calibration reported by CDT de GAS
Table 2. Standard errors calculated between initial and latter verification using air at atmospheric pressure
Figure 5. Error differences curve between CDT initial (2011) and CDT latter (2013).
Similarly, Table 2 and Figure 5evidence standard errors less than one (1), which means that: The initial verification with air at atmospheric pressure
(2011) and the latter verification (2013) are equivalent, therefore it is confirmed that high pressure calibration is still valid.
Based on the results of: diagnoses and initial and latter verification at low pressure, as for this specific case, a first evidence was obtained, confirming a priori that: if deviations out of permissible limits are not present in the results, the meter’s performance will not show a noticeable deviation and thus, the verification period may be extended.
5. Conclusions
The metrological confirmation strategy proposed in this document is an alternative providing an acceptable confidence level for the measures, and conforms to the metrological infrastructure available in the region.
As for the specific case of the evaluated meter, it was possible to demonstrate its ability to provide comparable results operating at high pressure using natural gas and atmospheric pressure with air, and this ability can be used to perform low pressure intermediate verifications. This fact allows decreasing the meters’ assurance costs without being detrimental to the quality of the results.
6. References
[1]. Reglamento Único de Transporte RUT - CREG [2]. OIML R140 :2007 - Measuring Systems For Gaseous
Fuel [3]. C. Coull and E. Spearman, “Practical Experiences Of
Operating Small Bore (4”) Gas Ultrasonic Meter for Fiscal Measurement ona FPSO”, International North Sea Flow Measurement Workshop, 2008.
[4]. S. Peterson and C. Lightbody, “On line Condition Based Monitoring of Gas USMs”, International North Sea Flow Measurement Workshop, 2008.
[5]. V. Herrmann, M. Wehmeier, T. Dietz, R. Kramer and B. Mickan, “A new los pressure calibration facility using 8-path ultrasonic meters as working standards”, 6th ISFFM, 2006.
[6]. M3Tlab. www.m3tlab.com
Caudal X2013 - X2011 U[2013,2011] EN
m3/h % % %32 0,41 1,08 0,3880 0,79 0,84 0,94
238 0,34 0,37 0,93393 0,07 0,30 0,25641 -0,06 0,29 -0,201126 0,01 0,29 0,031611 -0,15 0,31 -0,47
CDT DE GAS - 2013
Ref.
CDT
DE
GA
S 20
11
Table 1. Standard errors calculated for comparison between high and low pressure
Figure 3. Curve representing the error difference between CDT and PIGSAR
Figure 4. Initial and latter calibration curve at CDT de GAS – atmospheric pressure
-2,00
-1,50
-1,00
-0,50
0,00
0,50
1,00
1,50
2,00
0 200 400 600 800 1000 1200 1400 1600
Erro
r Pro
med
io [%
]
Caudal Promedio [m3/h]
CDT de GAS 2011 CDT de GAS 2013
4.2. Results of verifications in CDT de GAS laboratory.
The USM verification is performed by carrying out tests in the low-pressure atmospheric-air calibration facilities at CDT de GAS. The meter’s evaluation using this criterion pretends to evidence the robustness of the verification process with time. In case that a non-comparable result is issued, the methodology cannot be applied.
The results shown correspond the meter 1, between the initial verification performed in 2011 and a subsequent verification in February 2013 (See Figure 4).
-2,00
-1,50
-1,00
-0,50
0,00
0,50
1,00
1,50
2,00
0 200 400 600 800 1000 1200 1400 1600
Erro
r Pro
med
io [%
]
Caudal Promedio [m3/h]
CDT de GAS 2011 CDT de GAS 2013
In order to evaluate the equivalence between the initial and latter calibration in a period of time, the evaluation was performed similarly as it is carried out to evaluate at different pressu-res, using the algorithm of standard error:
Cien
cia
Low pressure verification of Gas Ultrasonic Flow Meters as an efficient solution to the Metrological confirmation process suggested in ISO 10012
Where,
Initial Percentage error – CDT de GAS laboratory – initial verificationXPosterior Percentage error – CDT de GAS laboratory – latter calibrationUinitial Expanded uncertainty of initial calibration reported by CDT de GASUPosterior Expanded uncertainty of latter calibration reported by CDT de GAS
Similarly, Table 2 and Figure 5 evidence standard errors less than one (1), which means that:
The initial verification with air at atmos-pheric pressure (2011) and the latter verification (2013) are equivalent, therefore it is confirmed that high pressure calibration is still valid.
Based on the results of: diagnoses and initial and latter verification at low pressu-re, as for this specific case, a first evidence was obtained, confirming a priori that: if deviations out of permissible limits are not present in the results, the meter’s perfor-mance will not show a noticeable deviation and thus, the verification period may be extended.
5. CONCLUSIONS
The metrological confirmation strategy proposed in this document is an alternative providing an acceptable confidence level for the measures, and conforms to the metrological infrastructure available in the region.
As for the specific case of the evaluated meter, it was possible to demonstrate its ability to provide comparable results operating at high pressure using natural gas and atmospheric pressure with air, and this ability can be used to perform low pressure intermediate verifications. This fact allows decreasing the meters’ assurance costs without being detrimental to the quality of the results.
6. REFERENCES
[1]. Reglamento Único de Transporte RUT - CREG
Table 2. Standard errors calculated between initial and latter verification using air at atmospheric pressure
CDT DE GAS - 2013
CD
T D
E G
AS
20
11
Ref.Caudal
m3 /h
3280
238393641
11261611
0,410,790,340,07
-0,060,01
-0,15
1,080,840,370,300,290,290,31
0,380,940,930,25
-0,200,03
-0,47
% % %XCDT - XPIGSAR U[CDT,PIGSAR] EN
-2,00
-1,50
-1,00
-0,50
0,00
0,50
1,00
1,50
2,00
0 200 400 600 800 1000 1200 1400 1600
Erro
r Pro
med
io [%
]
Caudal Promedio [m3/h]
CDT de GAS 2011 CDT de GAS 2013
Figure 5. Error differences curve between CDT initial (2011) and CDT latter (2013).
[2]. OIML R140 :2007 - Measuring Sys-tems For Gaseous Fuel
[3]. C. Coull and E. Spearman, “Practical Experiences Of Operating Small Bore (4”) Gas Ultrasonic Meter for Fiscal Measurement ona FPSO”, International Nor-th Sea Flow Measurement Workshop, 2008.
[4]. S. Peterson and C. Lightbody, “On line Condition Based Monitoring of Gas USMs”, International North Sea Flow Measu-rement Workshop, 2008.
[5]. V. Herrmann, M. Wehmeier, T. Dietz, R. Kramer and B. Mickan, “A new los pressure calibration facility using 8-path ultrasonic meters as working standards”, 6th ISFFM, 2006.
[6]. M3Tlab. www.m3tlab.com
www.flomeko2013.fr
Flomeko 2013
The 16th International FlowMeasurement Conference
París24 -26 Septiembre
2013