1H, 2D AND ALKALI NMR STUDIES OF ALKALI ... 2D AND ALKALI NMR STUDIES OF ALKALI NAPHTHALENE ION PAWS...
17
1H, 2D AND ALKALI NMR STUDIES OF ALKALI NAPHTHALENE ION PAWS E. DE BOER and B. M. P. HENDRIKS* Department of Physical Chemistry, University of Nmegen, Nijmegen, The Netherlands ABSTRACT 'H, 'D and alkali resonances have been performed on alkali naphthalene ion pairs in ethereal solution. Special attention is devoted to the electron spin relaxation time re. It proved to be proportional to the inverse of the ion pair concentration, but not to the viscosity divided by the absolute temperature, as is predicted by the Pake-Tuttle relationship. An explanation for this behaviour is given in terms of polymolecular collision processes. The alkali resonances provided information on the sign of the alkali hyperfine splitting constants and on the contribution of the various relaxation mechanisms to the line widths. A line width analysis demonstrated that the ion pairs can be considered as static ion pairs, except for sodium naphthalene, where ion pair equilibria play an essential role. 1. INTRODUCTION Alkali radical ion pairs have been studied in the past mainly by electron spin resonance (e.s.r.) techniques'. From this useful information has been obtained about the electronic structure of the ion pairs and about ion pair equilibria. During the last few years nuclear magnetic resonance (n.m.r.) experiments also have been performed on alkali radical solutions2. This technique offers some advantages over the e.s.r. method; the most outstand- ing features are the possibility of measuring the sign of the hyperfine coupling constants (h.f.s.c.s) and the more easily interpretative spectra. A drawback of the method is the necessity of large concentrations, which can, however, to some extent be circumvented by use of spin relaxers3. A few detailed n.m.r. studies have been carried out on alkali radical ion pairs. The system alkali biphenyl has been investigated extensively by Canters and co-workers34 and the system alkali naphthalene by Takeshita and Hirota5 and by Hendriks and co-workers6. In this paper we present further experimental results on the alkali naphtha lene system, which shed new light on the behaviour of these concentrated solutions and made possible a more detailed analysis of the spectra. In Section 3 the relevant equations needed for the interpretation of the spectra are given. In Section 4 the experimental results are discussed. * This paper is based on the PhD thesis presented by Dr B. M. P. Hendriks at the Umversity of Nijmegen. 259
Transcript of 1H, 2D AND ALKALI NMR STUDIES OF ALKALI ... 2D AND ALKALI NMR STUDIES OF ALKALI NAPHTHALENE ION PAWS...
1H, 2D AND ALKALI NMR STUDIES OF ALKALINAPHTHALENE ION PAWS
E. DE BOER and B. M. P. HENDRIKS*
Department of Physical Chemistry, University of Nmegen,Nijmegen, The Netherlands
ABSTRACT'H, 'D and alkali resonances have been performed on alkali naphthalene ionpairs in ethereal solution. Special attention is devoted to the electron spinrelaxation time re. It proved to be proportional to the inverse of the ion pairconcentration, but not to the viscosity divided by the absolute temperature,as is predicted by the Pake-Tuttle relationship. An explanation for thisbehaviour is given in terms of polymolecular collision processes. The alkaliresonances provided information on the sign of the alkali hyperfine splittingconstants and on the contribution of the various relaxation mechanisms tothe line widths. A line width analysis demonstrated that the ion pairs can beconsidered as static ion pairs, except for sodium naphthalene, where ion pair
equilibria play an essential role.
1. INTRODUCTIONAlkali radical ion pairs have been studied in the past mainly by electron
spin resonance (e.s.r.) techniques'. From this useful information has beenobtained about the electronic structure of the ion pairs and about ion pairequilibria. During the last few years nuclear magnetic resonance (n.m.r.)experiments also have been performed on alkali radical solutions2. Thistechnique offers some advantages over the e.s.r. method; the most outstand-ing features are the possibility of measuring the sign of the hyperfine couplingconstants (h.f.s.c.s) and the more easily interpretative spectra. A drawbackof the method is the necessity of large concentrations, which can, however,to some extent be circumvented by use of spin relaxers3.
A few detailed n.m.r. studies have been carried out on alkali radical ionpairs. The system alkali biphenyl has been investigated extensively byCanters and co-workers34 and the system alkali naphthalene by Takeshitaand Hirota5 and by Hendriks and co-workers6.
In this paper we present further experimental results on the alkali naphthalene system, which shed new light on the behaviour of these concentratedsolutions and made possible a more detailed analysis of the spectra. InSection 3 the relevant equations needed for the interpretation of the spectraare given. In Section 4 the experimental results are discussed.
* This paper is based on the PhD thesis presented by Dr B. M. P. Hendriks at the Umversityof Nijmegen.
259

E. DE BOER AND B. M. P. HENDRIKS
It is shown that at high concentrations polymolecular collision processesplay an essential role in the electron spin relaxation, so that the Pake—Tuttle relation7 is no longer valid. Fortunately the proton and deuteriumline widths and the electron spin correlation times remain proportional tothe inverse concentration of the radicals.
The usefulness of spin relaxers is pointed out in Section 4.2. A semi-quantitative analysis is given for the alkali line widths in Section 4.3. Theanalysis is based on a so-called static picture of the ion pair, except for sodiumnaphthalene, for which evidence is found that a dynamic model applies.
2. EXPERIMENTALThe n.imr. experiments were performed on a Varian DP-60-EL spectro-
meter. For instrumental and experimental details and for details concerningthe analysis of the spectra, see refs 4 and 6. All reported line widths arecorrected for modulation effects and for intermolecular broadening.
The viscosity of the sodium naphthalene (NaNI) solution in 1,2-dimethoxy-ethane (DME) at 25°C has been measured with Ubbelohde viscometersaccording to the method outlined in ref. 8 and by utilizing a glove-box(VAC HE-43-6 with drytrain VAC HE-193-1). The results are presented inTable 1. The viscosities are well described by the relation of Vand9. If notstated otherwise, all uncertainty ranges indicate a 99 per cent confidenceinterval.
Table 1. Viscosity of NaNI in DME at 25°C in centipoise (cP). Accuracy is 2 per cent
C(M) 0.00 0.25 0.49 0.98 1.42 1.96
9(cP) 0.443 0.528 0.697 1.17 2.13 4.93
3. THEORETICAL ASPECTS
NMR spectra of paramagnetic particles in solution are modified in twoways with respect to the spectra of the corresponding diamagnetic species.First, the resonance lines are broadened by paramagnetic relaxationmechanisms; second, the lines are shifted by the Fermi contact interaction10.
3.1 Contact shiftFor ion pairs in the doublet ground state the Fermi contact shift ,
expressed in gauss, is given by' 1
t5° _BBpY 4kT
where g is the isotropic g value of the radical, a is the hyperfine splitting con-stant, B is the fiCid at which resonance occurs and the other symbols havetheir usual meanings.
Since8t
a—3yNpNh (2)
260

'H, 2D AND ALKALI NMR STUDIES
where oN is the spin density at nucleus N, the contact shift 5 is independentof the magnetic moment of the nucleus. From the direction of the shift thesign of the spin density can be inferred; a high field shift indicates a negative
a low field shift indicates a positive PN
3.2 Line width equations for rigid ion pairsThe line widths of the absorption peaks in the n.m.r. spectrum of an ion
pair are completely determined by intramolecular interactions. In general,the line width parameter 77 can be written as a sum of three terms
T' = TC + + T (3)
the three terms representing the contributions due to the Fermi contactinteraction, the anisotropic electron—nucleus dipolar interaction, and thequadrupolar interaction, respectively. For a rigid radical ion pair undergoinga rapid isotropic Brownian motion in solution, the following expressionshold for the three relaxation times12:
TC =)2{te + (4a)
1(B)2 {+
T=()t (4c)
where re is the electron spin correlation time and td is the dipolar correlationtime, defined by
= c' + ç' (5)
in which tr is the rotational correlation time. A, B and C are defined by
A
B [1(T)2] (7)
C = [f(I)(eQ)2{ (v)}] (8)
where are the components of the anisotropic dipolar tensor andthe components of the electric field gradient tensor. The factor f(1) is givenby (21 + 3)/12(21 — 1) and eQ is the nuclear quadrupole moment. The othersymbols have their usual meanings.
The correlation times for the alkali radical ion pair are within the range10b0 to 10_i 's, whereas the e.s.r. frequency co is about 3 x lOll rad/s.Consequently the line widths will be proportional to a particular correlationtime. The correlation times depend on the radical concentration c, the abso-lute temperature T and the viscosity . According to the Debye—Einstein'3model the dependence of rr on and T is given by
(9)
261

E. DE BOER AND B. M. P. HENDRIKS
while according to the model of Pake and Tuttle7 the dependence of te onc, T and ij is given by
r TcFrom these relations it follows that the total line width will be proportionalto/T.3.3 Line width equations for dynamic ion pairs
Configurational changes of the ion pair will modulate the intramolecularinteractions described above and will therefore have an influence on theline width of the absorption peaks. Line width equations have been developedfor a situation in which the alkali ion switches between only two positions,say 1 and 2. Assuming again isotropic Brownian motion, the equationsread46
TC =[(A)2{. +
1 + 12(AA)2 {+
1 +
(11 a)
— [T:Tc 13t 1 AT:ATI ________T21 =[it7d +-j + T1P2 6h217 + 1 + (WT)2
TjQ = f(I) (eQ)2 + AVAV(1 lc)
where
XpX +pX)1 1 2 2X—A TorYLX=X1—X2
—
The interaction parameters for the two sites are indicated by the subscriptsI and 2, Ce is given by
1 1 1 1 1 1-=+---+-- =—+t 'ç 'r1 2 'Ce 'C
and similar equations hold for r and r. 'r1 and 'C2 are the residence times ofthe ion pair in sites 1 and 2, respectively, and are related to the occupationprobabilities p1 and p2 by the relation p = r/(r1 + 'r2). The notation X:Xstands for the trace of the matrix product of X and X (X :X =
For practical purposes it is useful to distinguish two limiting cases:(a) 'r 'ç, 'Cd In this case the equations reduce to
/A\2c ___=(—I r + —\\hJ 1+wr
262
'H, 2D AND ALKALI NMR STUDIES
/B2 f 13r l= + 1+ (13b)
T=i5()tr (13c)
where B and are defined by replacing T in equation (7) and V in equation(8) by T and V, respectively.
These equations are formally identical with equations (4) holding for therigid ion pair, the only difference being that now the average values of theinteraction parameters occur.
Since the relevant correlation times are of the order of 10 10 to 10the configurational life times 'r1 and 'r2 are so short that the motion of thealkali ion cannot be distinguished from a vibration of the alkali ion in thepotential energy well of the ion pair. In the literature this case has been calledthe static case, although of course the alkali ion is still vibrating around anequilibrium position.
(b) 'r > ç, r. In this case the equations reduce to
T (14a)2.Fc — + i + wtPFTI 13t )1
+ I + W] (14b)
T =f(I)(eQ)2[Yr] (14c)
with
X:X = p1(X1:X1) + p2(X2:X2)
and
A2 = p1A + p2AThe configurational life times are now so long that two different ion pairscan be discerned, often called contact, or tight, and solvent-separated, orloose, ion pairs. The equations mean that the line widths are the weightedsums of the line widths of these two ion pair species. Usually this limitingcase is called the dynamic case.
4. ALKALI NAPHTHALENE ION PAiRSThorough n.m.r. investigations of the alkali naphthalene ion pairs were
reported by Hendriks and co-workers6. Both proton and alkali resonanceswere studied with DME as solvent, although the NaN1 system was alsostudied in tetrahydrofuran (THF), Besides proton resonance, deuteriumresonance studies were carried out on completely deuterated samples.In the following sections we will focus our attention mainly on the effectextremely high concentrations have on the spin exchange process, and wewill give a thorough line width analysis of the alkali resonances.
263

4.1 'H and 2D resonance
E. DE BOER AND B. M. P. HENDRIKS
In order to obtain an impression of the type of spectra measured we havereproduced in Figure 1 the n.m.r. spectra resulting from 1H and 2D n.m.r.performed on a sample containing both normal naphthalene and perdeutero-naphthalene. The peaks have been shifted to high field pointing to a negative
2D-n.m.rat 9.1/. MHz
9.1/. MHz
100 ppm.
Figure 1. High-resolution and wide-line deuterium and wide-line proton spectra of a solutioncontaining 1.63 M naphthalene and 0.62 M perdeutero-naphthalene in DME, which was com-
pletely reduced with Na. THF-d8 was used as reference signal
264
THF-d8
D2
OME H1 1H-n.micit 60.0MHz

1H, D AND ALKALI NMR STUDIES
Table 2. 'H and 2D line widths (in rad/s) for the NaN1—DME mixedsample (2.25 M)
H1,D1 H2,D2
T4TDTQ
33.000 ± 1 800850 ± 60
—
4800 ± 300160 ± 1050 ± 15
spin density at the proton nuclei. The absolute values of the h.f.s.c.s are inagreement with e.s.r. data6. Also, it is clear that the shifts are independent ofthe magnetic moment of the nucleus and that the resolution in the 2D spectrais much better than in the 'H spectra. In Table 2 we have listed the experi-mental T2 values. From the 1H and the 2D line width the quadrupolarcontribution to the 2D line width (T& has been calculated, by use of theformula
TQ = T - ()2 TUsing equation (4c) and setting the quadrupole coupling constant (q.c.c.)of the deuteron equal to 0.19 MHzoa and the asymmetry parameter (Ic —J',)/J'i equal to zero, one derives that (90 ± 30) x 10—12 s at 30°C.
The line widths proved to be proportional to the square of the h.f.s.c.,which points to the predominance of the Fermi contact relaxation mechanism.In accordance with this, the line widths were also proportional to the inverseof the concentration of radical ion pairs. 13y use of equation (4a) can becalculated, and in Figure 2 te has been plotted against 1/c for solutions ofNaN1-h8 and of NaN1-d8 in DME. It appears that Te is proportional to
(15)
150
100
a
C0Ua)"10U0.
50
. a
2.51/C,M
-1
Figure 2. The electron spin correlation times measured at 30CC in solutions of NaNI-h8(Q)and of NaNI-d8 )in DME versus the reciprocal of the radical concentration
265
0.5 1.0 1.5 2.0
E. DE BOER AND B. M. P. HENDRIKS
150
100
50
C
225M
I
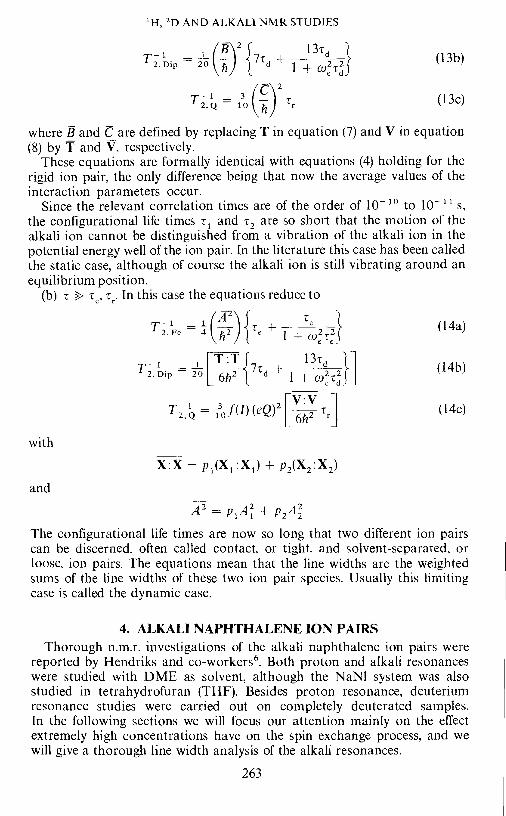
1/c and that the relaxation is more efficient in the proton sample. In Figure 3r has been plotted against rj/c. According to the model of Pake and Tuttle7,a linear relationship should exist between these quantities, which is clearlynot the case. At high concentrations r is much smaller than expected. Intheir derivation of equation (10) Pake and Tuttle only considered bimolecularcollision processes and furthermore assumed a constant concentration ofsolvent molecules. Our experiments indicate that at high concentrationspolymolecular collisions are important, which shorten ç much faster than1/c and even dominate the exponential increase of the viscosity with increas-ing radical concentration. Fortuitously, the over-all effect is an almostlinear relationship between re and 1/c. In view of these results, it is not sur-prising that plots Of re or T' versus 1/c do not go through the origin5 6
At low concentrations the viscosity is almost constant and the effect ofpolymolecular collisions negligible. If the Pake—Tuttle model applies forthese dilute solutions, we calculate for the rate constant ke of the spinexchange process in the NaN1-d8—DME sample at 30°C a value of 13 x iOl/mol.s. This rate constant has been calculated from
= k[Nl] (16)
and the plot shown in Figure 2. This value is in good agreement with thee.s.r. result of Danner'4: k = 14 x iO l/mol.s. for KN1—DME.
4.2 Electron spin relaxationIn order for high resolution to be attained in the n.m.r. spectra of the
radical ion pairs, re must be small. This is accomplished by the spin—spininteraction, which increases with increasing radical concentration. Sometimesthe high concentration needed for obtaining small teS cannot be realized.A way out of this dilemma is to measure a sparingly soluble radical in the
266
.50M
C0Ua)vi0U
a)
1 2 3 4
q/C, CP/M
Figure3. The electron spin correlation times at 30°C in solutions of NaNI-h8 (0) and of NaNI-d8() in DME versus ti/c, t obtained for the 2.25 M mixed sample (U has been presented also

'H 2 AND ALKALI NMR STUDIES
Table 3. 'H and 'D line widths (in rad/s) of the 1.2 M Bp/0.5 M Nl-c18 solution in DME com-pared with the line widths of some single-component samples
SampleBiphe
T2nylT NaphtT'
halene
T21.2 M NaBp -DME + 0.5 M NaNI-d8--DME 9800 420 1 200 200
1.2MNaBp-DME 17200 700l.5MNaBp DME 9900 360
0.5 MNaNI-d8-DME 7200 14001.7 M NaNI-d8--DME 1 700 280
presence of a highly soluble radical, which then may act as a spin relaxer3.As an example, we will discuss our results obtained on a sample containing0.5M Nl-d8 and l.2M biphenyl (Bp) in DME with Na as counter ion.The line widths measured at 30°C are presented in Table 3.
The small line width of the resonances of the Nl-d8/Bp sample withrespect to the line widths measured for samples containing only one of thehydrocarbons at equal concentration demonstrates the mutually relaxingeffects of the biphenylide and naphthalenide radicals. The deuteron linewidths of the Nl-d8/Bp sample are smaller than the line widths of a 1.7 MNl-d8 sample; hence, the Bp ÷—Nl interaction causes a more efficientelectron spin relaxation than the NI - —* Nl interaction. However, the protonline widths of a 1.5 M Bp solution are already equal to the 'H line widthsof the biphenyl protons in the N1-d8/Bp sample, which is 1.7 M in total radicalconcentration. Therefore the Bp +- N1 interaction relaxes the electronspin less efficiently than the Bp Bp interaction.
For a system of n different kinds of spin radicals (R1) we can describe thespin exchange process by:
R(ct) + R3(fl) R(/3) + R(o) (17)
where is the rate constant of spin exchange between the radicals R1 andR. From simple reaction kinetic arguments4' one can derive6 for theelectron spin correlation time of radical i
= k1[R] (18)
With this notation the experimental data for our two radical system can beexplained by
kBP Bp > N1 > kNi NiFrom our results we may conclude that both Nl and Bp can be used
as a spin relaxer. The Bp anion is more efficient, but the solubility of thisanion and the reduction potential of neutral Bp will limit its applicabilityto THF and stronger solvating ethers. The use of the Nl anion in MTHFand even weaker solvating ethers seems promising.
267
E. DE BOER AND B. M. P. HENDRIKS
4.2 Alkali resonanceAlkali resonance has been carried out on 6Li, 7Li, 23Na, 39K,
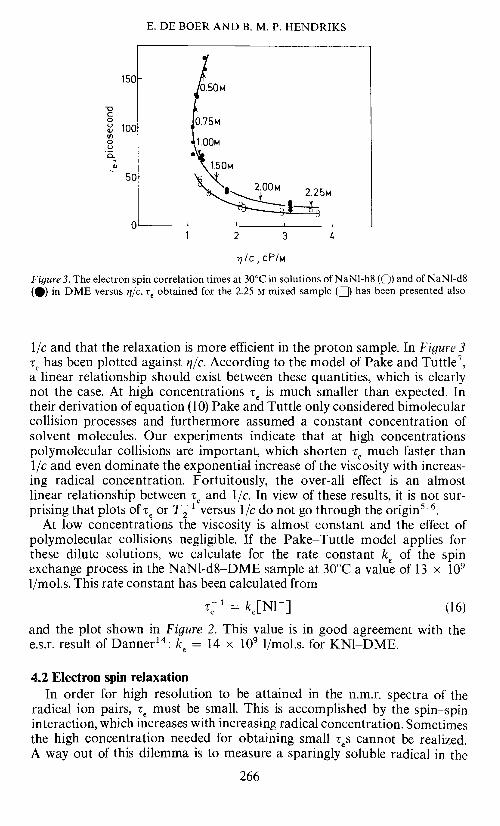
85Rb, 7Rb and '33Cs. In ref. 6 graphs have been given of the alkalih.f.s.c. versus the temperature and of the alkali line width as a function of theviscosity of the solvent divided by the absolute temperature (r/0/T)*. frigeneral, the h.f.s.c.s increase with the temperature and the line widthsincrease with 0/T, except for the cations of 6Li, 7Li and 23Na. In Table 4
Table4. Survey of h.f.s.c.s, line widths and correlation times of 1.0 M Ni ion pair solutions inDME. The accuracy of the h.f.s.c.s is 3 per cent and of the line widths 10 per cent unless stated
otherwise
Sample T(CC)
Isotope aM(G)
T(rad/s)
te(ps)
t(ps)
LiNI 30
40
50
6Li7Li6Li7Li6Li7Li
0.00330.0100.0060.0170.0100.031
102913371962
85 ± 15
75 ± 15
65 ± 15
10—50
10—45
10—40
NaNI 3060
23Na23Na
0.20
0.42
1 200 ± 1002600 ± 200
70 ± 10
50 ± 10
10-50
10-35
KN1 30 39K 0.016 800 ± 60 62 ± 6 10—SO
RbNI 30 85Rb
87Rb—0.175—0.527
7800 ± 2008700 ± 400
47 ± 7 10—SO
CsN1 30 133Cs —1.43 10500 ± 500 52 ± 4 10—SO
we have given a survey of the observed h.f.s.c.s, line widths and correlationtimes, all for solutions containing 1.0 M naphthalenide. The electron correla-tion times 'ç have been derived from the proton spectra of the anion. Thelower limit of has been deduced from Tj the upper limit from theDebye—Einstein relation, tr = 4rtr3i/3kT, where r is the molecular radius.We will use the data in Table 4 for an evaluation of the systems studied.Unless indicated otherwise, we will utilize equation (13), valid for theso-called static case of a dynamic ion pair, for the analysis of the line widths.A general remark here concerns the sign of the h.f.s.c. It is positive for Liand Na, negative for Rb and Cs and, depending on the temperature, positiveor negative for K. From the observed alkali h.f.s.c. the spin densities in thens-AO of the alkali cations can be calculated by dividing the observedh.f.s.c. by the known h.f.s.c. of the alkali atoms15. The results are listed inTable 5. The spin density decreases continuously going from Na to Csonly Li is an exception, owing to the strong solvation of this small cation.Recently the observed trend has been explained theoretically by Canters,Corvaja and de Boer'5, who pointed out that the zero-order contribution
* The concentrations of 1.OM for the NaNI ion pair in THF and CsNI ion pair in DMEmentioned in ref. 6a are erroneous. The correct values are 0.45 M for NaNI in THF' and 0.5 Mfor CsN1 in DME.
268

tH, 2D AND ALKALI NMR STUDIES
Table 5. The variation of the spin density in the metal ns-orbital with the counter ion for thealkali Ni ion pairs in DME. In the second colunm the values of PN are given corresponding to the
limits of the investigated temperature range
Metal PN at 30CC
Li (00—0.7) x lO 0.05 x lONa (0.0—2.4) x lO 0.6 x lOK (—0.1—0.5) x iO 0.2 x lORb {—0.5—(—0.3)} x lO —0.4 x iOCs { — 1.8-(—1.5)} x l0 { — l.8—(— I.6)} x 10—3*
* Dependent on the rad cal concentration.
to the spin density, p0, at the metal decreases more rapidly with increasingdistance between the ions than the first-order contribution, p1. Because p0is always positive and p1 is usually negative, the spin density will becomemore negative with increasing distance, which explains the observed trendin the metal spin density going from Li to Cs. The usually positive temperaturegradient of the alkali metal h.f.s.c. can be explained by the decreasing distancebetween the ions due to the decreasing solvation of the cation at elevatedtemperature.
Before we discuss the individual systems the trend in te should be noted.It decreases gradually going from the solvent-separated LiN1 ion pair tothe contact ion pair CsNl. Since the distance of closest approach between theanions of two radical ion pairs is smaller for contact ion pairs than forsolvated ion pairs, the exchange interaction of the unpaired electrons in thecontact ion pairs is larger than in the solvent-separated ion pairs14.
LiN1. The coincidence of the plots of T 1(7Li) and of
(2 x T2'(6Li)
versus 0/T (see ref. 6, Figure 8) proves that the contribution of the quadru-pole interaction to the relaxation of the Li nuclei will be negligible. TheFermi contact relaxation can be calculated by use of the h.f.s.c.s and the
listed in Table 4 and equation (1 3a). The data are summarized in Table 6.It turned out that the Fermi contact relaxation is negligible. From thedipolar relaxation the distance between the Li nucleus and the aromaticplane has been calculated by comparing the experimentally determined
Table 6. Line width analysis for 7LiN1 in DME(1.0 M)
T(CC)
T'(rad/s)
T(rad/s)
T(rad/s
28
(ps)
10_85*
Distance(A)
2.5—4.530 29 0.740 37 1.7 35 10_75* 2.3—4.150 62 4.9 57 10_65* 1.9—3.4
The upper limit corresponds with
269

E. DE BOER AND B. M. P. HENDRIKS
Figure 4. Contour curves of BArIfrYN (in gauss) at 2 A and 3 A distance from the molecular planeof the Nl anion
270
'H 2D AND ALKALI NMR STUDIES
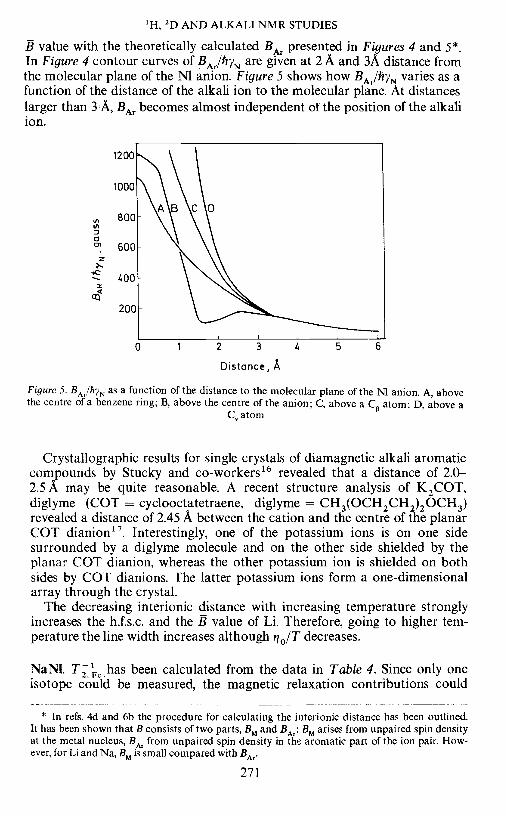
B value with the theoretically calculated BAf presented in Figures 4 and 5*•In Figure 4 contour curves of BAr/hYN are given at 2 A and 3A distance fromthe molecular plane of the NI anion. Figure 5 shows how BAr/hYN varies as afunction of the distance of the alkali ion to the molecular plane. At distanceslarger than 3 A, BAT becomes almost independent of the position of the alkaliion.
U,U'
z
Figure 5. BAr/hYN as a function of the distance to the molecular plane of the N anion. A, abovethe centre of a benzene ring; B, above the centre of the anion; C, above a C atom; D, above a
C atom
Crystallographic results for single crystals of diamagnetic alkali aromaticcompounds by Stucky and co-workers'6 revealed that a distance of 2.0—2.5 A may be quite reasonable. A recent structure analysis of K2COT,diglyme (COT = cyclooctatetraene, diglyme = CH3(OCH2CH2)20CH3)revealed a distance of 2.45 A between the cation and the centre of the planarCOT dianion'7. Interestingly, one of the potassium ions is on one sidesurrounded by a diglyme molecule and on the other side shielded by theplanar COT dianion, whereas the other potassium ion is shielded on bothsides by COT dianions. The latter potassium ions form a one-dimensionalarray through the crystal.
The decreasing interionic distance with increasing temperature stronglyincreases the h.f.s.c. and the B value of Li. Therefore, going to higher tem-perature the line width increases although 0/T decreases.
NaN1. Thas been calculated from the data in Table 4. Since only oneisotope could be measured, the magnetic relaxation contributions could
* In refs. 4d and 6b the procedure for calculating the interionic distance has been outlined.It has been shown that B consists of two parts, BM and BAr; BM arises from unpaired spin densityat the metal nucleus, BAI from unpaired spin density in the aromatic part of the ion pair. How-ever, for Li and Na, BM is small compared with BAr
271
Distance, A
E. DE BOER AND B. M. P. HENDRIKS
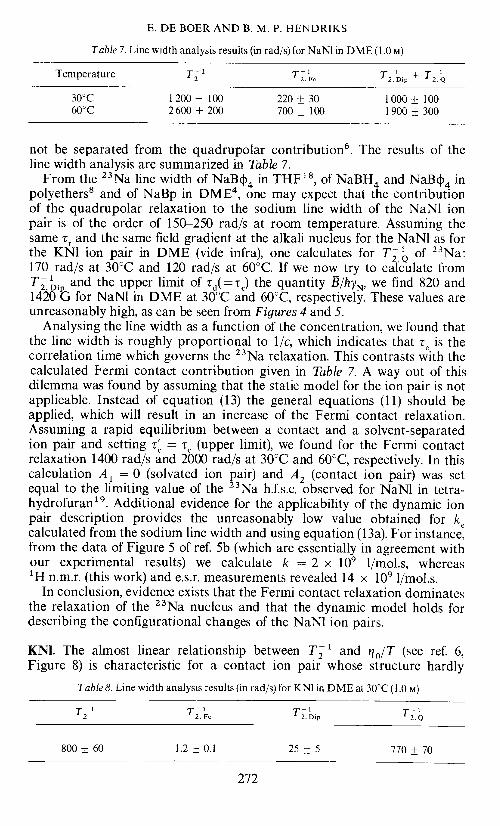
Table 7. Line width analysis results (in rad/s) for NaN1 in DME (1.0 M)
Temperature 1 T'C + T30°C 1200± 100 220± 30 1000± 10060°C 2600 ± 200 700 ± 100 1900 ± 300
not be separated from the quadrupolar contribution6. The results of theline width analysis are summarized in Table 7.
From the 23Na line width of NaB4 in THF'8, of NaBH4 and NaB4i4 inpolyethers8 and of NaBp in DME4, one may expect that the contributionof the quadrupolar relaxation to the sodium line width of the NaN1 ionpair is of the order of 150—250 rad/s at room temperature. Assuming thesame Er and the same field gradient at the alkali nucleus for the NaNI as forthe KN1 ion pair in DME (vide infra), one calculates for T1Q of 23Na:170 rad/s at 30°C and 120 rad/s at 60°C. If we now try to calculate fromT and the upper limit of rd( =Te) the quantity B/hyN, we find 820 and1420 G for NaN1 in DME at 30°C and 60°C, respectively. These values areunreasonably high, as can be seen from Figures 4 and 5.
Analysing the line width as a function of the concentration, we found thatthe line width is roughly proportional to 1/c, which indicates that Ee is thecorrelation time which governs the 23Na relaxation. This contrasts with thecalculated Fermi contact contribution given in Table 7. A way out of thisdilemma was found by assuming that the static model for the ion pair is notapplicable. Instead of equation (13) the general equations (11) should beapplied, which will result in an increase of the Fermi contact relaxation.Assuming a rapid equilibrium between a contact and a solvent-separatedion pair and setting 'r = re (upper limit), we found for the Fermi contactrelaxation 1400 rad/s and 2000 rad/s at 30°C and 60°C, respectively. In thiscalculation A1 = 0 (solvated ion pair) and A2 (contact ion pair) was setequal to the limiting value of the 23Na h.f.s.c. observed for NaNl in tetra-hydrofuran19. Additional evidence for the applicability of the dynamic ionpair description provides the unreasonably low value obtained for kecalculated from the sodium line width and using equation (1 3a). For instance,from the data of Figure 5 of ref. 5b (which are essentially in agreement withour experimental results) we calculate k = 2 x l0 l/mol.s, whereas
n.m.r. (this work) and e.s.r. measurements revealed 14 x 1O l/mol.s.In conclusion, evidence exists that the Fermi contact relaxation dominates
the relaxation of the 23Na nucleus and that the dynamic model holds fordescribing the configurational changes of the NaNI ion pairs.
KNL The almost linear relationship between T 1 and ij0/T (see ref. 6,Figure 8) is characteristic for a contact ion pair whose structure hardly
Table 8. Line width analysis results (in rad/s) for KNI in DME at 30°C (1.0 M)
T1 T T800±60 1,2±0.1 25±5 770±70
272
1H 2D AND ALKALI NMR STUDIES
changes with the temperature. In Table 8 the various contributions to theline width have been tabulated. The Fermi contact contribution has beencalculated by use of the data of Table 4; the dipolar contribution has beencalculated with Ic as an upper limit for td and 1000 G as an upper limit forB/hyN. The remaining part of the line width is ascribed to the quadrupolarrelaxation.
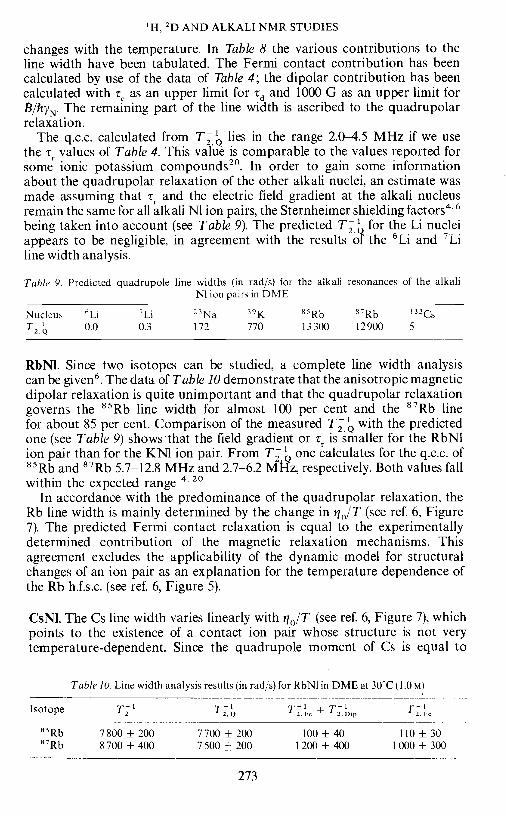
The q.c.c. calculated from T1Q lies in the range 2.0—4.5 MHz if we usethe Ir values of Table 4. This value is comparable to the values reported forsome ionic potassium compounds20. In order to gain some informationabout the quadrupolar relaxation of the other alkali nuclei, an estimate wasmade assuming that Ir and the electric field gradient at the alkali nucleusremain the same for all alkali Nl ion pairs, the Sternheimer shielding factors46being taken into account (see Table 9). The predicted TjJ for the Li nucleiappears to be negligible, in agreement with the results oF the 6Li and 7Liline width analysis.
Table 9. Predicted quadrupole line widths (in rad/s) for the alkali resonances of the alkaliNI ion pairs in DME
Nucleus Li 7Li 23Na 39K 85Rb 87Rb 33Cs
TJ 0.0 0.3 172 770 13300 12900 5
RbN1. Since two isotopes can be studied, a complete line width analysiscan be given6. The data of Table 10 demonstrate that the anisotropic magneticdipolar relaxation is quite unimportant and that the quadrupolar relaxationgoverns the 85Rb line width for almost 100 per cent and the 87Rb linefor about 85 per cent. Comparison of the measured T with the predictedone (see Table 9) showsthat the field gradient or is smaller for the RbNlion pair than for the KN1 ion pair. From T1 one calculates for the q.c.c. of85Rb and 87Rb 5.7—12.8 MHz and 2.7—6.2 MI-?z, respectively. Both values fallwithin the expected range 20
In accordance with the predominance of the quadrupolar relaxation, theRb line width is mainly determined by the change in 0/T (see ref. 6, Figure7). The predicted Fermi contact relaxation is equal to the experimentallydetermined contribution of the magnetic relaxation mechanisms. Thisagreement excludes the applicability of the dynamic model for structuralchanges of an ion pair as an explanation for the temperature dependence ofthe Rb h.f.s.c. (see ref. 6, Figure 5).
CsNI. The Cs line width varies linearly with ?70/T (see ref. 6, Figure 7), whichpoints to the existence of a contact ion pair whose structure is not verytemperature-dependent. Since the quadrupole moment of Cs is equal to
Table 10. Line width analysis results (in rad/s) for RbN1 in DME at 309C (1.0 M)
Isotope T' T - T+T. T;85Rb 7800 ± 200 7700 ± 200 100 ± 40 110 ± 3087Rb 8700 ± 400 7500 ± 200 1200 ± 400 1000 ± 300
273

E. DE BOER AND B. M. P. HENDRIKS
—0.004 barns21, the quadrupole contribution to the line width can beneglected (see Table 9). From the data in Table 4 one calculates for T =9100 ± 300 rad/s, so that the line width is mainly determined by this inter-action.
5. CONCLUSIONThe available results of n.m.r. studies of ion pairs are promising. The
method proves to be applicable for studies of alkali radical salts in concen-trated solutions (0.1 — 2.5 M). The spectra provide information on magnitudeand sign of the h.f.s.c. Correlation times can be deduced from the spectra.From studying the solutions as a function of concentration spin exchangerates can be inferred, which are in agreement with the rates obtained by e.s.r.In particular the alkali resonance experiments provide information aboutthe structure of the ion pairs.
ACKNOWLEDGEMENTSThe authors wish to thank Dr G. W. Canters for valuable discussions.This investigation was supported in part by the Netherlands Foundation
for Chemical Research (SON), with financial aid from the NetherlandsOrganization for the Advancement of Pure Research (ZWO).
REFERENCES1 For references to earlier work see Ions and Ion Pairs in Organic Reactions, Ed. M. Szwarc,
Vol. 1, Chapters 5 and 8. Wiley—Interscience; New York (1972).2 SeeChapter7ofref. 1.
(a) R. W. Kreilick, J. Amer. Chem. Soc. 90, 2711 (1968);(b) G. W. Canters, B. M. P. Hendriks, J. W. M. de Boer and E. de Boer, Mo!. Phys. 25,
1135(1973).(a) G. W. Canters and E. de Boer. Mo!. Phys. 13, 395 (1967);(b) G. W. Canters, Thesis, University of Nijmegen, Nijmegen, The Netherlands (1969);(c) G. W. Canters and E. de Boer, Mo!. Phys. 26, 1185 (1973);(d) (i. W. Canters and E. de Boer, Mo!. Phys., 27, 665 (1974).(a) T. Takeshita and N. Hirota, Chem. Phys. Letters, 4, 369 (1969);(b) T. Takeshita and N. Hirota, J. Chem. Phys. 58, 745 (1973).
6(a) B. M. P. Hendriks, G. W. Canters, C. Corvaja, J. W. M. de Boer and E. de Boer, Mo!.
Phys. 20, 193 (1971);(b) B. M. P. Hendriks, Thesis, University of Nijmegen, Nijmegen, The Netherlands (1973).G. E. Pake and T. R. Tuttle Jr, Phys. Rev. Letters, 3, 423 (1959).
8 G. W. Canters, J. Amer. Chem. Soc. 94, 5230 (1972).° V. Vand. J. Phvs. Chem. 52, 277 (1948).10 E. de Boer and H. van Willigen, Progress in Nuclear Magnetic Resonance Spectroscopy,
Vol. 2, Chapter 3. Eds. J. W. Emsley, J. Feeney and L. M. Sutcliffe. Pergamon: Oxford (1967).11 H. M. McConnell and D. B. Chesnut, J. Chem. Phys. 28, 107 (1958).12 (a) A. Abragam, The Principles of Nuclear Magnetism Chapter VIII. Oxford University
Press: London (1961);(b) J. A. M. van Broekhoven, B.. M. P. Hendriks and E. de Boer, J. Chem. Phys. 54,1988
(1971).13 P. Debye, PolarMolecules, Dover, New York (1945).14 J C. Danner, Thesis, Brandeis University, Waltham, Mass. (1966).
G. W. Canters, C. Corvaja and E. de Boer, J. Chem. Phys. 54, 3026 (1971).
274

'H, 2D AND ALKALI NMR STUDIES' (a) J. J. Brooks and G. D. Stucky, J. Amer. Chem. Soc. 94, 7333 (1972);(b) J. J. Brooks, W. Rhine and G. D. Stucky, J. Amer. Chem. Soc. 94, 7339 (1972);(c) J. J. Brooks, W. Rhine and C. D. Stucky, J. Amer. Chem. Soc. 94, 7346 (1972).' J. H. Noordik, Tb. E. M. van den Hark, J. J. Mooij and A. A. K. Klaassen, Acto Cryst.,1330, 833 (1974).A. M. Grotens, J. Smid and E. de Boer, Chem. Commun. 759 (1971).' N. Hirota, .1. Amer. Chem. Soc. 90, 3603 (1968).
20 (a) M. H. Cohen and F. Reif, 'Quadrupole Effects in NMR Studies of Solids', in SolidState Effects, Eds F. Seitz and D. Turnbull, Vol. 5. Academic Press: New York (1957);
(b) T. P. Das and E. L. Hahn, 'Nuclear Quadrupoic Spectroscopy', in Solid State Effects,Eds F. Seitz and D. Turnbull, Vol. 5. Academic Press: New York (1957), supplement 1,(1958).
21 (a) P. Buck, I. 1. Rabi and B. Senitzky, Phys. Rev. 104, 513 (1956);(b) H. Bucka, H. Kopferman and E. W. Otten, Ann. Phys. 4, 39 (1959).
275