1Genesee & Wyoming Inc. Association of Car Accounting and Car Service Officers Austin, Texas...
40
1 Genesee & Wyoming Inc. Association of Car Accounting and Car Service Officers Austin, Texas November 12, 2014
-
Upload
grant-cooper -
Category
Documents
-
view
219 -
download
3
Transcript of 1Genesee & Wyoming Inc. Association of Car Accounting and Car Service Officers Austin, Texas...

1Genesee & Wyoming Inc.
Association of Car Accounting and Car Service OfficersAustin, Texas
November 12, 2014

2Genesee & Wyoming Inc.
Genesee & Wyoming Inc. 1899
The originalGenesee & Wyoming Railroad;
14-miles in upstate NYserving one customer
that we still serve today

3Genesee & Wyoming Inc.
G&W Board of Directors 1899

4Genesee & Wyoming Inc.
Early G&W Power

5Genesee & Wyoming Inc.
Origin of G&W Logo
Milton Glaser: “America’s most celebrated designer.”November, 1977

6Genesee & Wyoming Inc.
Genesee & WyomingG&W (2014) – U.S., Canada, Australia, The Netherlands and BelgiumGenesee & Wyoming Inc. 2014

7Genesee & Wyoming Inc.
• Listed on NYSE (“GWR”)with $1.6 billion of revenues
• Own 112 railroads and employ 5,000 people serving 2,000 customers
• Operate over 15,000 track miles with ~1,000 locomotives
• 11 operating regions worldwide
Today

8Genesee & Wyoming Inc.
43,000 U.S. Short Line Track Miles
23%
Rest of Industry 77%
Total Class II & III miles per ASLRRA

9Genesee & Wyoming Inc.
Broadest Geographic Coverage in North America with Significant International Diversity
Region G&W UP BNSF CN CP KCS NS CSX
Northwest
Southwest
Midwest
Southeast
Northeast
Canada
Mexico
International

10Genesee & Wyoming Inc.
1978 1996 1997 1998 1999 2000 2001 2002 2003 2004 2005 2006 2007 2008 2009 2010 2011 2012 2013 2014E0
100
200
300
400
500
600
700
800
900
1,000
1,100
1,200
1,300
1,400
1,500
1,600
1,700
$3 77.795103.643
147.472175.586206.53173.576209.54244.827270.5350.4
450.7516.2
602544.9
630.2
829.1875
1569$1,650
Consistent Long-Term Growth($ millions)
Revenue CAGR ~19% from IPO thru 2013≈
11Genesee & Wyoming Inc.
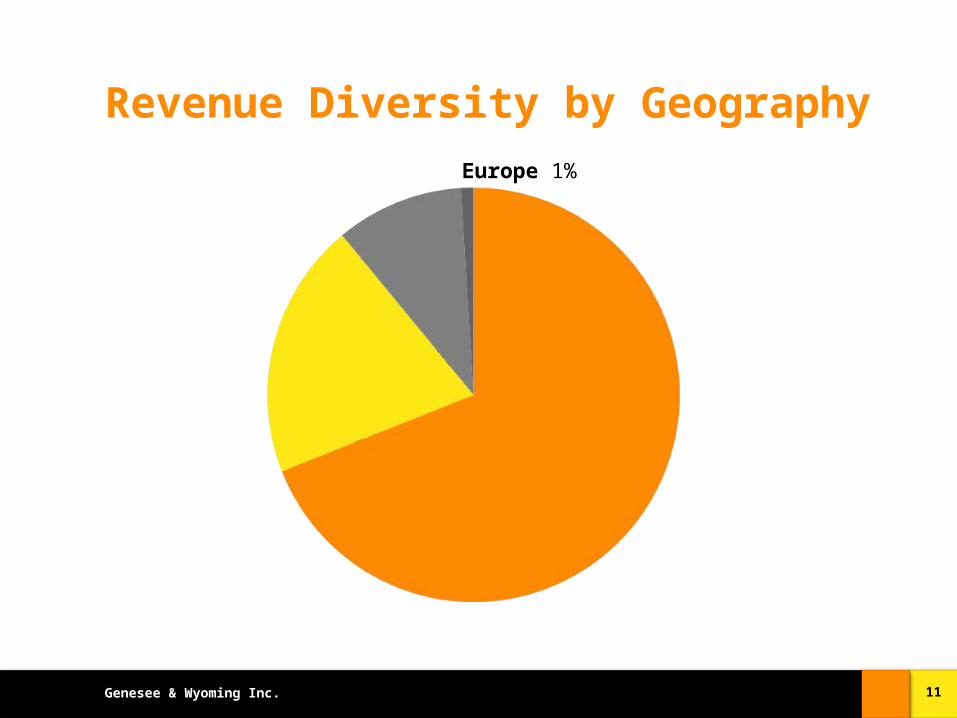
Revenue Diversity by Geography
U.S. 70%(8 Regions)
Australia 20%
Canada
9%
Europe 1%

12Genesee & Wyoming Inc.
Revenue Diversity by Commodity
Coal & Coke; 10.0%Minerals & Stone;
10.0%
Agricultural Products; 12.0%
Metals; 11.0%
Pulp & Paper; 9.0%Chemicals & Plas-
tics; 11.0%
Lumber & Forest Products; 7.0%
Petroleum Products; 5.0%
Metallic Ores; 10.0%
Intermodal; 7.0%
Food or Kindred Products; 3.0%
Waste; 1.0% Autos & Auto Parts; 2.0%Other; 2.0%
2014 Freight Revenue* by Commodity (Q3 Run Rate)
*Freight revenue is 75% of total revenues

13Genesee & Wyoming Inc.
G&W’s Decentralized Operating Philosophy
Eleven regions with strong local management backed by centralized corporate staff support
•Continuous Safety Improvement
•Focused Regional Marketing
•Lower Operating Costs
•Efficient Use of Capital
Our local focus is key to G&W’s strong safety and customer-satisfaction results

14Genesee & Wyoming Inc.
G&W Revenue By Region
• In 1999, G&W had 21 railroads and $175 million in revenues
• Today, an average G&W region has 10 railroads and $150 million in revenues
Australia
Central
Ohio Valley
SouthernCoastal
Pacific
Canada
Northeast
Midwest
MtnWest

15Genesee & Wyoming Inc.
Mountain West Region
Safety Finance HR ITMarketi
ng/Sales
Transportation
Mechanical
Engineering
Regional Operating Structure:Designed to be Close to Customers
Customers15

16Genesee & Wyoming Inc.
Our Core Purpose
To be the safest and most respected rail service provider in the world.

17Genesee & Wyoming Inc.
Industry-Leading Safety Performance2014 Injury-Frequency Rate per 200,000 man-hoursG&W through September; others through July
FRA Group
3
FRA Group
2
KCS NS Class I Avg
UP BNSF CSX G&W RRs
3.31 3.24
1.63
1.17 1.12 1.04 0.98 0.97
0.49

18Genesee & Wyoming Inc.
G&W Railroad Injury Frequency Rate and Number of Employees
20022003200420052006200720082009201020112012201320140
0.5
1
1.5
2
2.5
0
1000
2000
3000
4000
5000
6000Injury Frequency Rate per 200,000 Man-Hours
Employees

19Genesee & Wyoming Inc.
Respected by Our Customers:Industry-Leading Customer Satisfaction

20Genesee & Wyoming Inc.
Respected by Our Customers:Gross Capital Investment
2010 2011 2012 2013 2014B$0
$50
$100
$150
$200
$250
$300
$350
$120
$179
$232
$268
$325
($ m
illio
ns)

21Genesee & Wyoming Inc.
Respected by Class I Partners2014: 1.7MM* G&W Carloads Interchanged
404,000
328,000
155,000
70,000
279,000
408,000
59,000
*Q3 Run Rate

22Genesee & Wyoming Inc.
In recent years, our employees made 1,000 Operation Lifesaver presentations to more than 50,000 schoolchildren, school bus drivers and others on the importance of rail-crossing safety.
Respected by Our Communities: G&WCommunity

23Genesee & Wyoming Inc.
20002000
20012002
20022003
20042004
20052006
20062007
20082008
20092010
20102011
20122012
20132014
2014$0
$500
$1,000
$1,500
$2,000
$2,500
$3,000
$3,500
$4,000
$4,500
Class 1 Rails
S&P 500
Respected by Our Shareholders: Consistent Share Price Appreciation$100 Invested January 2000

24Genesee & Wyoming Inc.
Components of Growth
1.Traditional Class I spinoffs after Staggers Act

25Genesee & Wyoming Inc.
1. Traditional Class I spinoffs “First & Last Mile” to the Customer

26Genesee & Wyoming Inc.
Components of Growth
2.Railroads embedded in industrial facilities

27Genesee & Wyoming Inc.
2. Embedded Industrial Railroads Non-Core Competence for Owners

28Genesee & Wyoming Inc.
2. Embedded Industrial Railroads Non-Core Competence for Owners

29Genesee & Wyoming Inc.
Components of Growth
3.Contiguous railroads as building blocks of regional rail systems

30Genesee & Wyoming Inc.
3. Contiguous RailroadsBuilding Regional Rail Systems
1977 Genesee & Wyoming Railroad (GNWR)
1985 Dansville & Mount Morris Railroad (DMM)
1986 Rochester & Southern Railroad (RSR)
1988 Buffalo & Pittsburgh Railroad (BPRR)
1992 Allegheny & Eastern Railroad (ALY)
1996 Pittsburg & Shawmut Railroad (PS)
2001 South Buffalo Railway (SB)
2008 Ohio Lines

31Genesee & Wyoming Inc.
3. Contiguous RailroadsBuilding Regional Rail Systems
1977 Genesee & Wyoming Railroad (GNWR)
1985 Dansville & Mount Morris Railroad (DMM)
1986 Rochester & Southern Railroad (RSR)
1988 Buffalo & Pittsburgh Railroad (BPRR)
1992 Allegheny & Eastern Railroad (ALY)
1996 Pittsburg & Shawmut Railroad (PS)
2001 South Buffalo Railway (SB)
2008 Ohio Central railroads
2012 RailAmerica railroads

32Genesee & Wyoming Inc.
Components of Growth
4.Internationalprivatizations

33Genesee & Wyoming Inc.
4. International Privatizations G&W in Australia: de facto Class I Railroad

34Genesee & Wyoming Inc.
Components of Growth
5.Mining-focused railroads serving Asian industrialization

35Genesee & Wyoming Inc.
5. Mining-Focused Railroads Serving Asian Industrialization
Iron Ore Mines in Canada

36Genesee & Wyoming Inc.
Components of Growth
6.Consolidation of short line industry with G&W acquisition of RailAmerica

37Genesee & Wyoming Inc.
G&W acquisition of RailAmerica:Natural progression in the evolution of the rail industry since deregulation
Step 1: rationalization and dramatic improvements by Class I railroads; industry now capable of earning its cost of capital and reinvesting in its network for decades to come

38Genesee & Wyoming Inc.
G&W acquisition of RailAmerica:Natural progression in the evolution of the rail industry since deregulation
Step 2: consolidation of lower-density short lines, creating the ability to invest in long-term infrastructure and provide customers world-class service from door to door

39Genesee & Wyoming Inc.
Beyond the First and Last Mile
• Short line industry has matured greatly since its birth in 1980
• Successful business model of being close to customers with entrepreneurial decision-making unchanged
• Transformation from “Mom & Pop” railroads to professional, well capitalized partners to support customer growth in the U.S. and abroad

40Genesee & Wyoming Inc.