1.Benchmarking 2.Benefits 3.Eco System 4.Examples 5.Conclusions.
19
-
Upload
loraine-shelton -
Category
Documents
-
view
214 -
download
0
Transcript of 1.Benchmarking 2.Benefits 3.Eco System 4.Examples 5.Conclusions.

1. Benchmarking
2. Benefits
3. Eco System
4. Examples
5. Conclusions
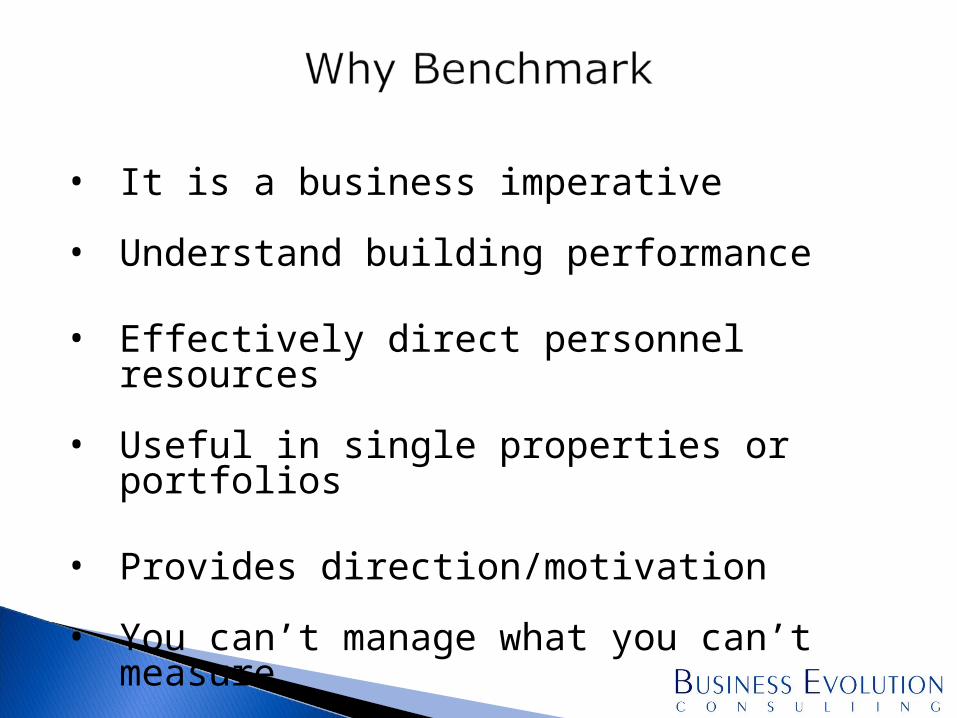
• It is a business imperative
• Understand building performance
• Effectively direct personnel resources
• Useful in single properties or portfolios
• Provides direction/motivation
• You can’t manage what you can’t measure
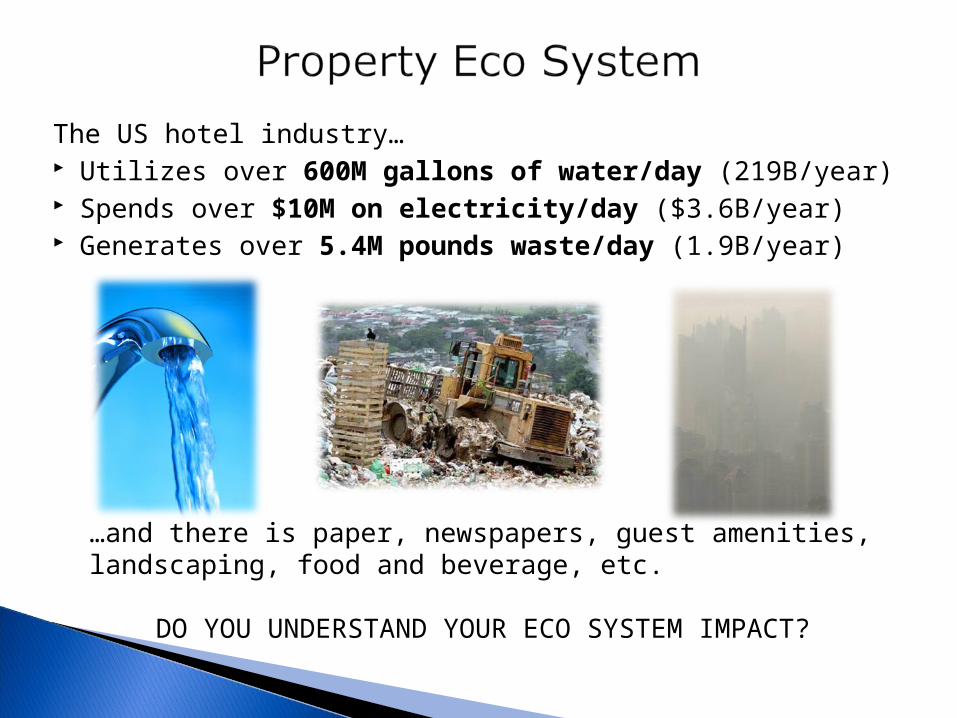
The US hotel industry… Utilizes over 600M gallons of water/day (219B/year) Spends over $10M on electricity/day ($3.6B/year) Generates over 5.4M pounds waste/day (1.9B/year)
…and there is paper, newspapers, guest amenities, landscaping, food and beverage, etc.
DO YOU UNDERSTAND YOUR ECO SYSTEM IMPACT?
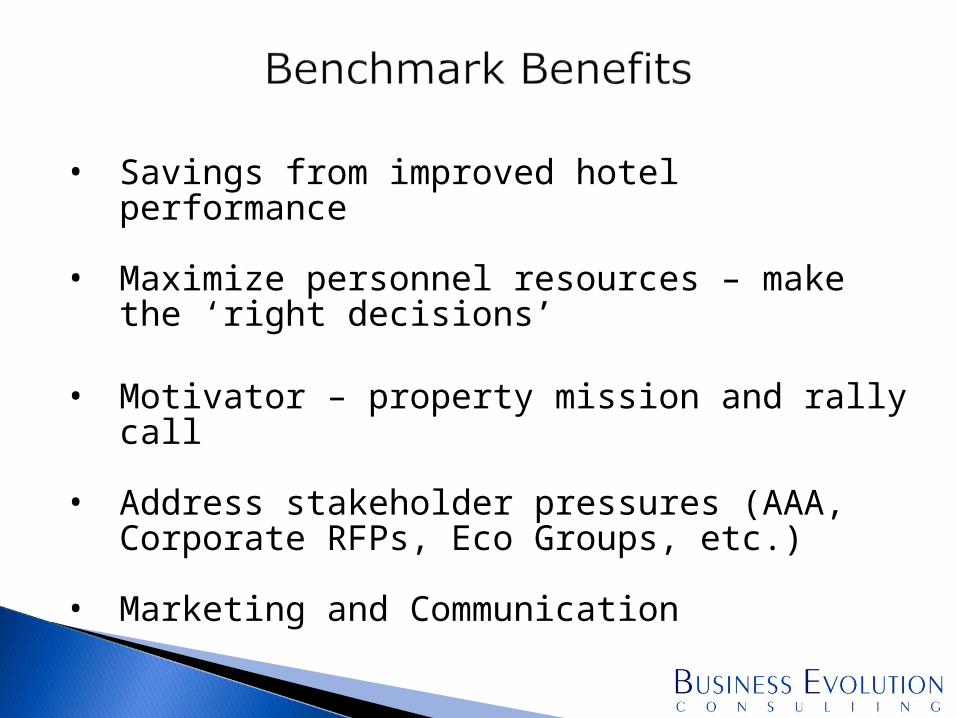
• Savings from improved hotel performance
• Maximize personnel resources – make the ‘right decisions’
• Motivator – property mission and rally call
• Address stakeholder pressures (AAA, Corporate RFPs, Eco Groups, etc.)
• Marketing and Communication
There is value in benchmarking anything that can be measured.
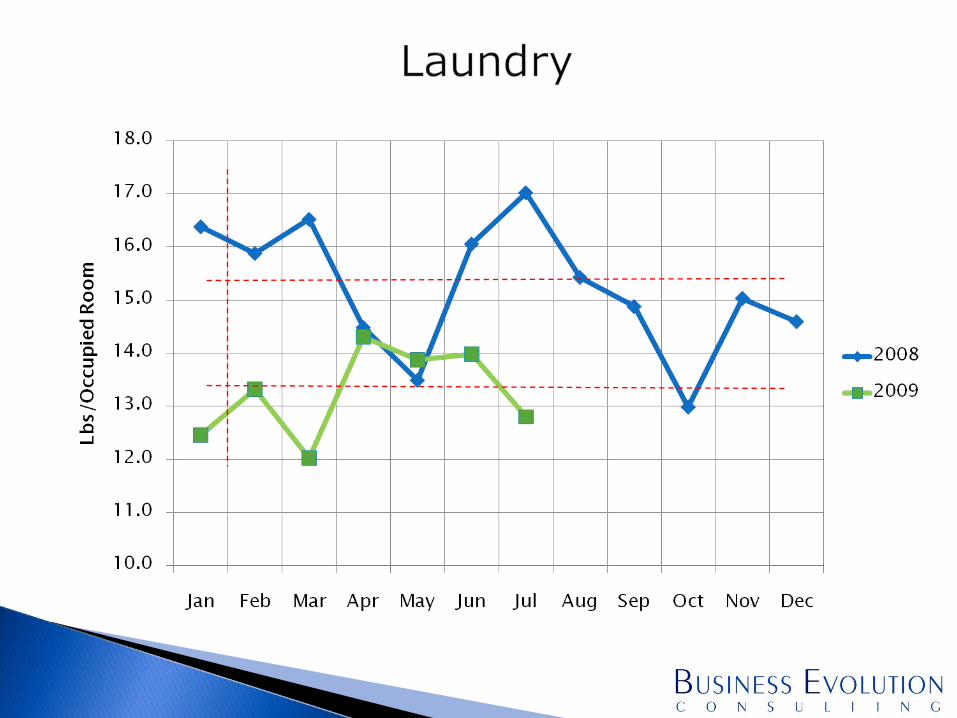
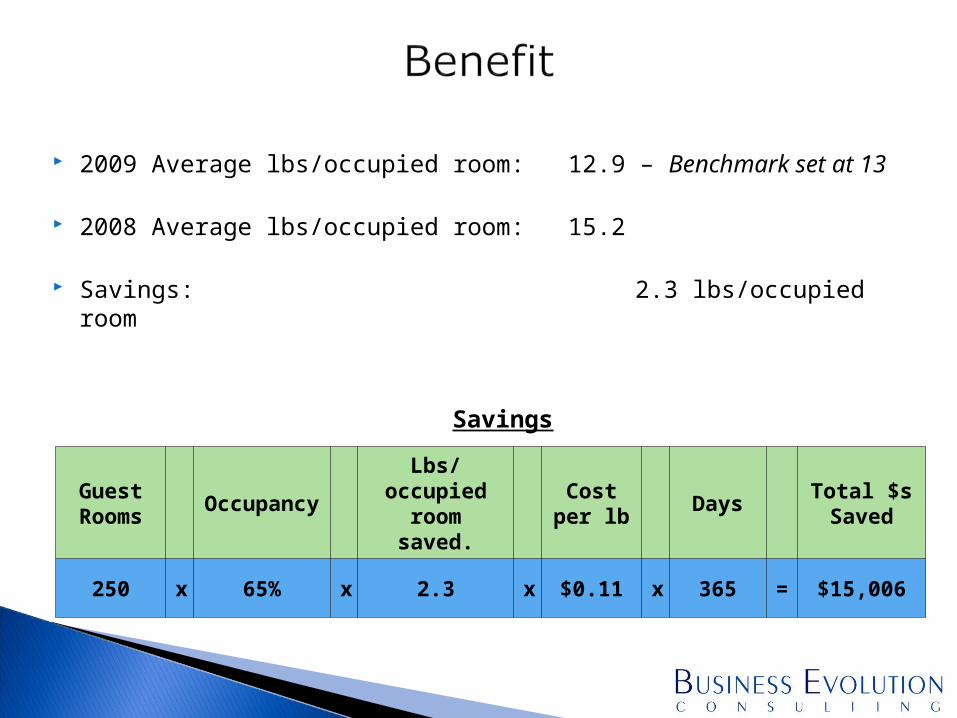
2009 Average lbs/occupied room: 12.9 – Benchmark set at 13
2008 Average lbs/occupied room: 15.2
Savings: 2.3 lbs/occupied room
Guest Rooms
OccupancyLbs/
occupied room saved.
Cost per lb
DaysTotal $s Saved
250 x 65% x 2.3 x $0.11 x 365 = $15,006
Savings
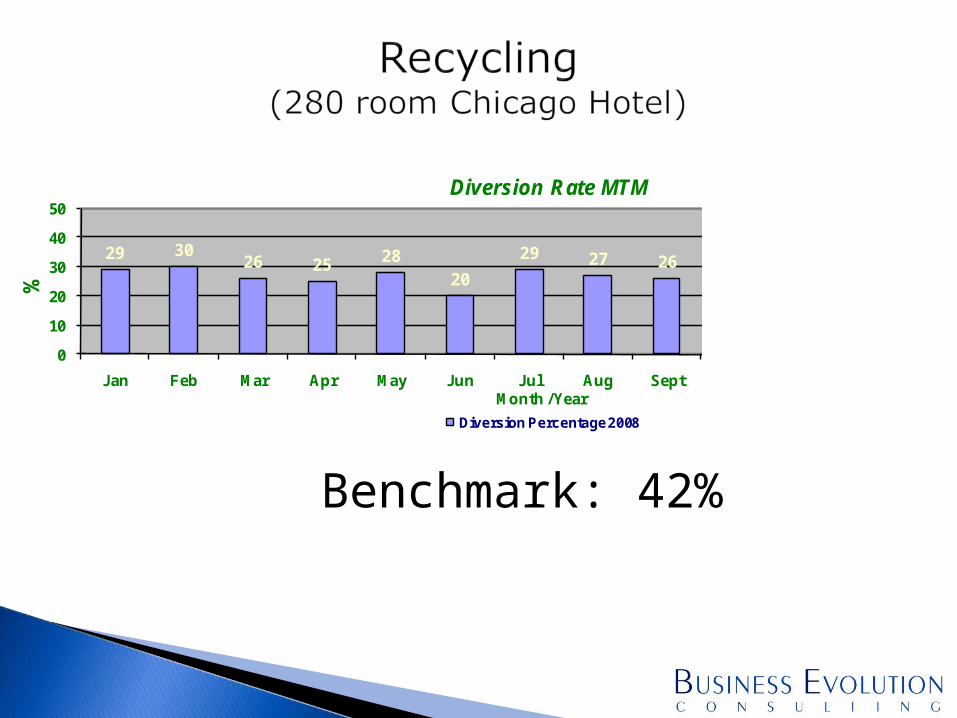
29 3026 25 28
20
29 27 26
4437 46
0
10
20
30
40
50
Jan Feb Mar Apr May Jun Jul Aug Sept Oct Nov Dec
%
Month / Year
Diversion Rate MTM
Diversion Percentage 2008
Benchmark: 42%
Over $2,700 saved in Q4 2008 on reduced waste and hauling costs.
Estimated total 2009 savings: > $10,900