1999 Monitoring Reporttaylors/g407/restoration... · the CCMP's management actions. This study was...
136
1999 Monitoring Report TILLAMOOK BAY FISH USE OF THE ESTUARY Prepared for The Tillamook Bay National Estuary Project And Tillamook County Cooperative Partnership Garibaldi, Oregon Prepared by Robert H. Ellis, Ph. D. Ellis Ecological Services, Inc 20988 S. Springwater Rd. Estacada, Oregon 97023 October 22, 1999
Transcript of 1999 Monitoring Reporttaylors/g407/restoration... · the CCMP's management actions. This study was...

1999 Monitoring Report
TILLAMOOK BAYFISH USE OF THE ESTUARY
Prepared for
The Tillamook Bay National Estuary ProjectAnd
Tillamook County Cooperative PartnershipGaribaldi, Oregon
Prepared by
Robert H. Ellis, Ph. D.Ellis Ecological Services, Inc
20988 S. Springwater Rd.Estacada, Oregon 97023
October 22, 1999
vi
SUMMARY
In 1999, a Comprehensive Conservation and Management Plan (CCMP) was completedfor the Tillamook Bay watershed. The CCMP lays out a variety of management actionsdesigned, in part, to achieve the goal of protecting and restoring estuarine habitat forimprovement of the fishery resources of Tillamook Bay and its watershed. Baselineinformation on the present status of the estuary's fish community and periodic updating ofthe baseline information through monitoring were identified as essential for evaluation ofthe CCMP's management actions. This study was conducted to describe the presentstatus of the fish community in Tillamook Bay and to design and test a long-termmonitoring strategy for fish.
The study was conducted during the summer and autumn of 1998 and the spring andsummer of 1999. The fish sampling done in 1998 was used to provide an estuary-wideoverview of the fish species composition and relative abundance during the mid-summerperiod and to test sampling gear and sampling strategies for development of a long-termmonitoring program. The sampling conducted in 1999 built upon the information gainedin 1998 and provided an initial test of a sampling design for long-term monitoring of theBay's fish community.
Current fish use of the estuary was described by updating the comprehensive fish surveydata collected by Oregon Department of Fish and Wildlife (ODFW) during the mid-1970s. The objective was to obtain sufficient information on present conditions so thatcomparisons could be drawn between the two studies in terms of species richness,relative abundance of common species, distribution of common species, frequency ofcapture by similar sampling gear, and monthly trends in catch per effort.
Sampling of the fish community in 1998 was conducted using beach seine, bottom trawl,fyke net and round-haul net. During 1999, initial testing of the proposed long-termmonitoring program was conducted using beach seine, trawl and fyke nets. Samplingwas conducted during daylight hours throughout the saline portions of the estuary,including the salt marsh habitat at the southern end of the Bay.
Species Composition: A total of 40 fish species were collected during this studywhereas a total of 59 species were captured during ODFW's surveys during the mid-1970s. Of the 40 species captured in this study, all but four were present in the mid-1970s. Seven families and 23 species found in the mid-1970s were not captured in thisstudy. All of the missing species were relatively rare in ODFW's catch with nonecomprising more than 0.1 percent of the total catch. It is considered likely that thedifferences in species composition can be explained in terms of sampling effort ratherthan intrinsic changes in the fish community. ODFW sampled monthly at 28 samplinglocations over a 2.5-year period and conducted 1,239 trawl and 465 beach seine sets. Inthis study, sampling was limited to five months in 1998 and four months in 1999. A totalof 30 trawl, 120 beach seine sets and 17 round-haul net sets were made.

vii
Relative Abundance: Eight of the ten most abundant species present in the mid-1970swere among the ten most abundant species captured in this study. In both studies the tenmost abundant species comprised over 95 percent of the total catch. The ten mostabundant species in this study in order of abundance were Pacific staghorn sculpin, surfsmelt, shiner perch, English sole, Pacific herring, chum salmon, chinook salmon, Pacificsanddab and starry flounder. The abundant species present in ODFW's mid-1970s catchbut in relatively low abundance in this study were Northern anchovy and rockfish spp.Differences between the studies in the abundance of Northern anchovy can probably beexplained by normal wide fluctuations in their use of the estuary. The differences seenbetween the studies in juvenile rockfish abundance are not as easily explained. Duringtheir 2.5-year study in the mid-1970s ODFW, collected 1,267 juvenile rockfsh. Only onejuvenile rockfish was collected in this study. Since sampling was conducted in the sameareas and during the same season as in the ODFW study, we conclude there is reason tobe concerned that juvenile rockfish use of the estuary has substantially declined since themid-1970s.
General Pattern of Distribution and Abundance: All but one of the abundant speciesin the beach seine catch were found throughout the estuary. The exception was Pacificsandlance, which occurred only in the mid- and lower regions of the Bay. Total beachseine catch per effort was about the same during 1999 in the upper (100.8 fish per seine)and lower (106.4 fish per seine) regions of the estuary. The mid-region of the estuary hadthe lowest (65.1 fish per seine) beach seine catch per effort. This distribution in catchper effort reflects conditions in the spring and summer months and is probably notindicative of the annual pattern of abundance in the estuary. Pacific staghorn sculpin wasthe most frequently caught species throughout the estuary. Schooling species such as surfsmelt, shiner perch, Pacific herring and Pacific sandlance occurred relatively infrequentlyin the catch but numbers were relatively high when they were caught. Trawling in thesubtidal channel habitat in the lower bay yielded a number of marine species that werenot captured in the beach seine. For example, cabezon, eel pout, tom cod, sand sole androck prickleback were only captured in the trawl. Overall, the general distribution of fishspecies found in this study was very similar to that found in the mid-1970s.
Use of the Estuary by Anadromous Salmonids : All five species of anadromoussalmonids known to occur in the Tillamook Bay watershed were collected during thisstudy. However, only juvenile chum and chinook salmon were caught in any abundance.Chum salmon fry were present in the catch from late March through June 1999, withpeak abundance in the beach seine in late April. Growth of chum fry was rapid withincreases in length from about 45 mm to 90 mm by the end of June. Juvenile chinooksalmon entered the beach seine catch in mid-June 1999 and were most abundant in thelate July samples. Relatively small numbers of coho salmon fry and smolt were found inthe estuary from May through mid June, primarily near the mouths of the Kilchis, Miamiand Trask Rivers. Sea-run cutthroat trout, ranging in length 140 to 400 mm,werecaptured primarily in the lower bay at Hobsonville Point and in the upper bay near themouth of the Kilchis River. Only six steelhead trout were caught. They were relativelylarge juveniles, ranging in size from 281 to 378 mm in length.

viii
In late April, we collected 462 chum salmon fry in beach seine samples. Five of the fryhad caudal fin clips, indicating that they had been captured at ODFW's downstreammonitoring site on the Little North Fork Wilson River in March or April 1999. Using theratio of fin clipped fish in our sample and in ODFW's estimate of total fry outmigrants bylate April along with assumptions regarding rates of downstream movement, it wasestimated that as many as one-half of the fry present in our samples may have origninatedfrom the Little North Fork Wilson River. This result was surprising in that the LittleNorth Fork Wilson River represents only a small percentage of the total chum salmonspawning habitat in the watershed.
Overall, the relative abundance of salmonids in this study was similar to that found in themid-1970s. Chum and chinook salmon were the only abundant salmonids in the mid-1970s catch. Abundance comparisons between the studies could not be made due todifferences in sampling gear.
Use of the Estuary by Non-Salmonid Species: The most abundant non-salmonidspecies in the estuary were euryhaline marine species. Temporal cycles in thecomposition, abundance and distribution of these species are largely influenced byseasonal spawning migrations, reproductive cycles and the recruitment of large numbersof juvenile fishes that use the estuary as a nursery ground. Information on beach seinecatch per effort and on length frequency distribution of Pacific staghorn sculpin, surfsmelt, shiner perch, English sole, Pacific herring and starry flounder indicates thatjuvenile rearing is the primary use of the estuary. However, some species such as shinerperch, starry flounder, and Pacific staghorn sculpin also use the estuary for spawning.Both similarities and difference in the seasonal pattern of beach seine catch per effortwere found between this study and ODFW's mid-1970s study. Most of the differencecould be explained in terms of differences in sampling gear efficiency for smallindividuals.
Environmental Relationships : Catch per effort for eight of the most abundant speciesin the 1999 beach seine catch was plotted against salinity measured at time of capture.Salinity appeared to influence the distribution of several species. Pacific herring, Englishsole and surf smelt were found primarily in relatively high salinities. Juvenile chinooksalmon, although found throughout the estuary, also appeared to prefer the highersalinities of the lower estuary. Starry flounder were most abundant in lower salinitywater. Pacific staghorn sculpin and shiner perch distribution indicated a broad salinitytolerance.
A 2-way analysis of variance (ANOVA) was used to compare mean number of species onrocky shoreline habitat with fine grained (sand and fine silty/sand) habitat. There weresignificantly more (P <0.05) species on the rocky substrate (3.5 per sample) than on thefine grained substrate (2.6 per sample). No significant difference in total beach seinecatch per effort was found between the rocky substrate and the fine grained substrate.Species that were most abundant on the fine grained substrate included English sole,Pacific sanddab, and starry flounder. Those that were more abundant on the rocky

ix
shoreline habitat included chinook salmon, cutthroat trout, coho salmon, and shinerperch.
Fish Use of Salt Marsh Habitat: The extensive salt marsh at the sourthern end ofTillamook Bay was sampled in 1998 and 1999 using stationary fyke nets to capture fishfrom tidal channels in the marsh. The nets were set at high tide and the fish leaving thetidal channels as the tide went out were captured in the nets. Three nets were fished in1998 and six nets were fished in 1999. Sampling during 1998 occurred periodically frommid June through mid October. Sampling in 1999 occurred at approximately bi-weeklyintervals rom late March through July. During the 1998 sampling period, only threespecies were captured---threespine stickleback, Pacific staghorn sculpin and shiner perch.Threespine stickleback comprised 94 percent of the total catch. During 1999, thefollowing six species were collected: threespine stickleback, Pacific staghorn sculpin,chum salmon fry, shiner perch, prickley sculpin and one coho salmon fry. Threespinestickleback and Pacific staghorn sculpin were the most abundant components of thecatch. Chum salmon fry were most abundant in late March and were not collected afterthe end of April. Threespine stickleback appear to use the marsh for spawning andrearing of young. Adult abundance peakedin mid June. Pacific staghorn sculpin caughtin the marsh were primarily juveniles. All of the shiner perch captured were juveniles.No juvenile chinook salmon were captured in the marsh even though they werecommonly found on the adjacent sand flat habitat.
Quantitative estimates of fish use of the marsh were calculated in 1998. Estimates ofgear sampling efficiency, and surface areas of the drainage basins sampled were usedwith the catch results to calculate the number of fish per unit area of salt marsh. Valuesranged from an average of 6909 fish per hectare (most of which were threespinestickleback) during the summer to 994 fish per hectare during the autumn.
Invertebrates Collected Incidental to Fish Collections: Juvenile and adult Dungenesscrabs were caught in beach seine, round-haul net and trawl sets the study period.Juvenile Dungeness crab were most abundant in the upper and mid-regions of the Bay.Adult crabs were found primarily in the lower region of the Bay but a few were capturedin the mid-region. Several European green crabs were taken in both years. This exoticspecies was found at several sites in the lower and mid-regions of the Bay on gravelsubstrate. European green crabs are voracious predators on juvenile oysters and othersmall invertebrates.
Recommendations for Long-term Monitoring: A primary objective of this study wasto design and test a long-term monitoring program for fish. The monitoring programtested in 1999 was developed through a step-wise process. We first identified the goalsand objectives of the sampling program and then conducted a number of studies during1998 to identify appropriate sampling gear and level of effort. A draft monitoringprogram was developed in early 1999 and tested during the period late March throughJuly 1999. The sampling strategy that has evolved through this process represents anattempt to get as much information as possible with proven, cost-effective samplingtechniques. The proposed sampling strategy has been designed to allow statistical

x
analysis of the data. Where possible quantitative rather than qualitative samplingtechniques have been recommended. A combination of beach seining, trawling and fykenetting are recommended for sampling techniques. A total of 18 beach seine sites, twotrawl sites and six fyke net sites have been established and appear suitable for continuedmonitoring. Appendix C to this report contains details of the proposed monitoringprogram for Tillamook Bay fish.
Coordination with ODFW's monitoring of juvenile salmonid out-migrants is consideredan important part of the monitoring program. Through coordination there is a highprobability that important new information can be developed regarding estuarinecarrying capacity, estuarine survival, residence time and differential use of habitats byjuvenile chum salmon.

TABLE OF CONTENTS
SUMMARY .......................................................................................................vi
INTRODUCTION..................................................................................................1
STUDY AREA........................................................................................................2
METHODS ........................................................................................................4Study Design..................................................................................................4Habitat Characterization..............................................................................12Sampling Gear .............................................................................................12Fish Handling Procedures............................................................................16Coordination with Other Programs..............................................................17
RESULTS AND DISCUSSION ..........................................................................17Temperature and Salinity.............................................................................17Species Composition...................................................................................25Relative Abundance.....................................................................................29Distribution and Abundance ........................................................................33Use of the Estuary by Anadromous Salmonids ...........................................36Use of the Estuary by Non-Salmonid Species.............................................47Environmental Relationships.......................................................................65Fish Use of Salt Marsh Habitat....................................................................67Invertebrates Collected Incidenta to Fish Collections .................................75Recommendations for Long-term Monitoring.............................................75
ACKNOWLEDGEMENTS.................................................................................83
LITERATURE CITED........................................................................................83
APPENDICES
APPENDIX A. Water quality data collected concurrently with 1998 and 1999fish sampling in Tillamook Bay.
APPENDIX B. Habitat descriptions and GPS coordinates for each beach seine,trawl and fyke net site sampled in 1999.

ii
APPENDIX C. Total beach seine, trawl, fyke net and round-haul net catch bystation and sampling date.
APPENDEX D. Long-term monitoring plan for fish in Tillamook Bay
LIST OF TABLES
Table 1. Comparison of 1999 spring and summer salinity ranges for the lower, mid andupper bay regions with ODFW's mean salinity ranges for spring and summer 1974-76 ........ 22
Table 2. Comparison of 1999 spring and summer water temperature ranges in the lower,mid and upper bay regions with ODFW's mean water temperature ranges for springand summer 1974-76....................................................................................................... 22
Table 3. Mean (in bold type), minimum and maximum water temperatures measuredduring beach seine sampling in the lower, mid and upper regions of Tillamook Bay in1999. ............................................................................................................................... 24
Table 4. Mean, minimum and maximum salinities measured at the water surface duringbeach seine sampling in the lower, mid, and upper regions of Tillamook Bay in 1999........... 24
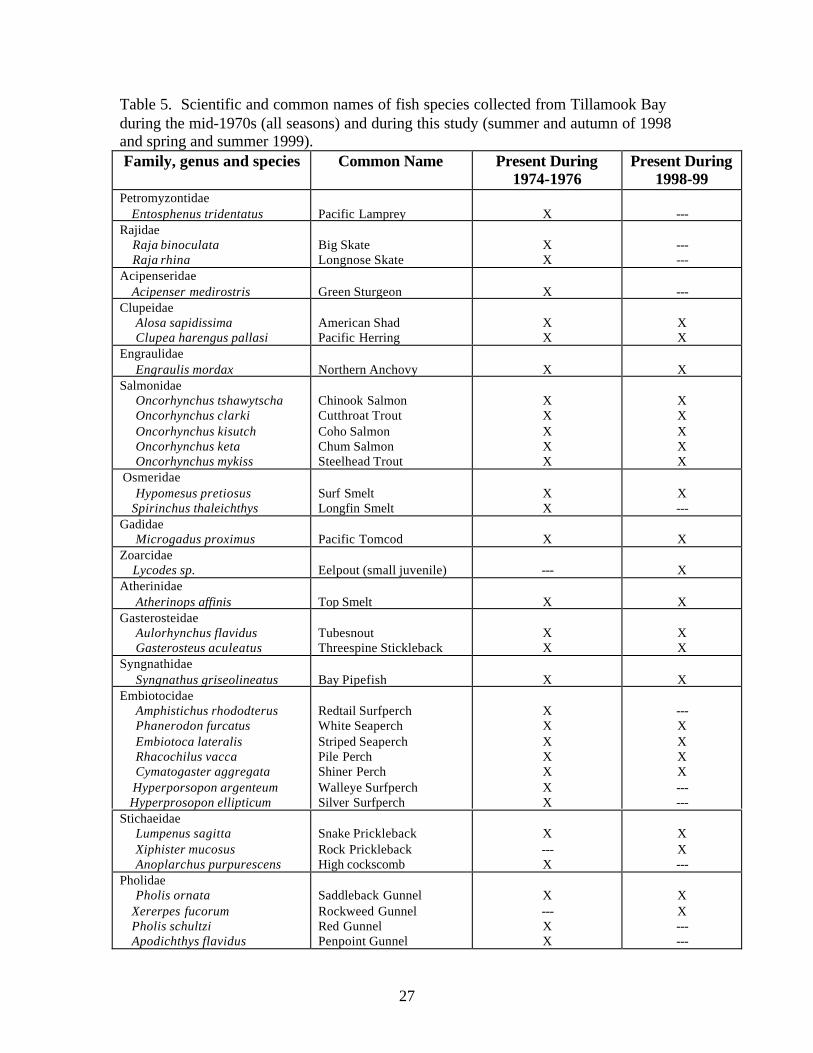
Table 5. Scientific and common names of fish species collected from Tillamook Bayduring the mid-1970s (all seasons) and during this study (summer and autumn of 1998and spring and summer 1999). .......................................................................................... 27-28
Table 6. Relative abundance of fish species captured during the spring and summer1998-99 by beach seine, round-haul net and trawl compared with relative abundance offish species captured during May through July 1974-76 by beach seine and otter trawl......... 30-31
Table 7. Location of capture of the nine most abundant fish in 1999 beach seine samplesranked according to catch-per-unit-effort and frequency of capture.......................................... 35
Table 8. Catch-per-unit-effort of the ten most abundant species caught in the lower Bayby beach seine compared with catch-per-unit-effort of the ten most abundant species inthe trawl during 1999............................................................................................................ 35
Table 9. Food organisms consumed by juvenile chinook salmon collected fromHoquarton Slough, July 14, 1998........................................................................................... 45
Table 10. Numbers of threespine stickleback, staghorn sculpin and shiner perch caughtin fyke nets on each of the 1998 sampling dates...................................................................... 68
Table 11. Comparison of species and numbers of fish collected on sand flat habitatadjacent to the salt marsh (round-haul net) with species and numbers of fish collected insalt marsh habitat (fyke net) .................................................................................................. 70
Table 12. Estimates of mean numbers of fish per hectare of marsh sampled duringsummer (June-July) and fall (September-October), 1998. ................................................. 72
iii
Table 13. Relative abundance of fish species collected by fyke net during 1999 in saltmarsh habitat.................................................................................................................. 72
Table 14. Species and numbers of fish collected from Tillamook Bay by beach seine,round-haul net and trawl during the 1998 mid-summer survey. .......................................... 77
LIST OF FIGURES
Figure 1. Multispectral photograph of Tillamook Bay showing location of tidalchannels and eelgrass beds...................................................................................................3
Figure 2. Areas of Tillamook Bay sampled by ODFW in the mid-1970s. ..........................6
Figure 3. Location of 1998 sampling sites for beach seine, round-haul net andtrawl......................................................................................................................................8
Figure 4. Location of sampling sites for 1999 monitoring program..................................11
Figure 5. Average seasonal temperatures (C) in Tillamook Bay during periodMay 1974-November 1976 from samples taken near the bottom at high tide...................18
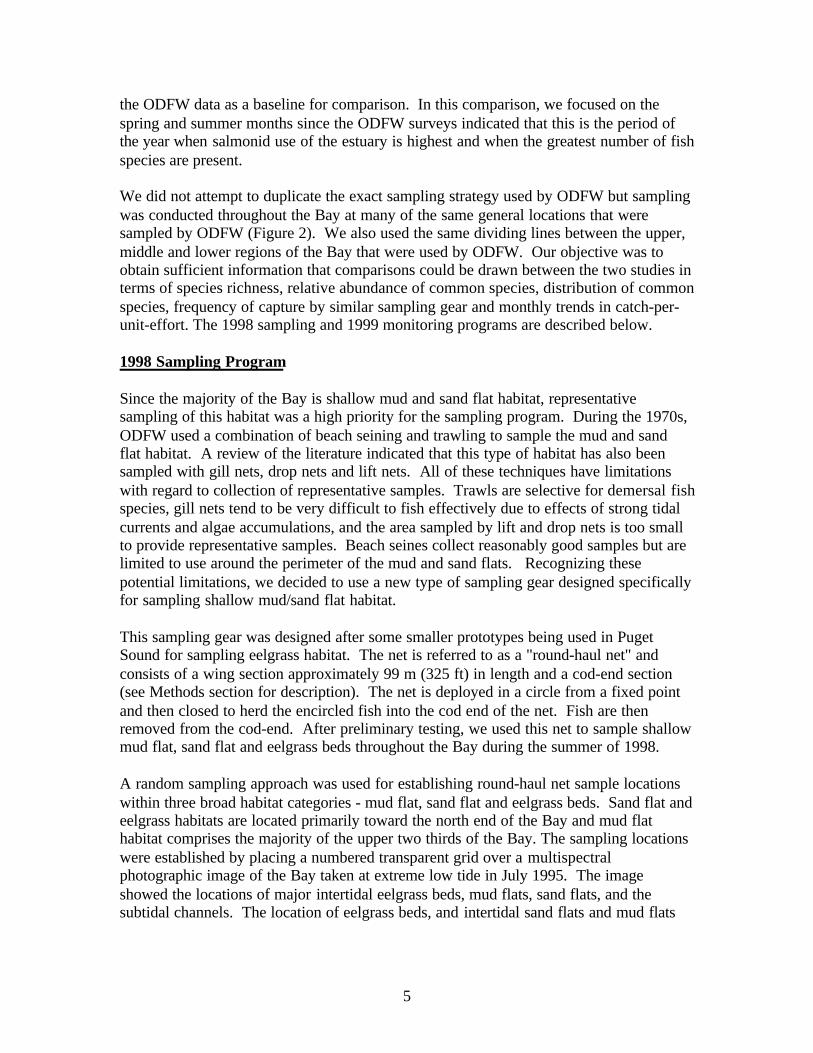
Figure 6. Average seasonal salinities (ppt) in Tillamook Bay during period May1974-November 1976 from samples taken near the bottom at high tide. ..........................19
Figure 7. Mean stream flow in the Wilson River for the period April-July 1975through 1976 and Wilson River stream flow for the period April-July 1999....................21
Figure 8. Mean monthly precipitation at Tillamook, Oregon for the periods April-July 1974 through 1976 and April-July 1999.....................................................................21
Figure 9. Mean salinity (ppt) at six fyke net sites in marsh habitat at the south endof Tillamook Bay for the period late April through late July 1999....................................25
Figure 10. Mean water temperature (C) at six fyke net sites in marsh habitat atthe south end of Tillamook Bay for the period late April through late July 1999. ............26
Figure 11. Chum salmon fry catch-per-unit-effort for beach seine in 1999compared with ODFW's mean chum salmon catch-per-unit-effort for beach seineduring the same time interval in 1974-76. .........................................................................37
Figure 12. Length frequency histograms for chum salmon fry by month..........................38
Figure 13. Mean lengths (horizontal bar in box) of chum salmon fry collected inbeach seine samples between March 28 and June 30, 1999...............................................39

iv
Figure 14. Juvenile chinook catch-per-unit-effort for beach seine in 1999compared with ODFW's mean chinook salmon catch-per-unit-effort for beachseine during the same time interval in 1974-76. ................................................................42
Figure 15. Length frequency histograms for juvenile chinook salmon captured inbeach seine during June and July 1999. .............................................................................43
Figure 16. Length frequency histogram for coho salmon juveniles caught bybeach seine in 1999. ...........................................................................................................45
Figure 17. Length frequency histogram for sea-run cutthroat trout caught inbeach seine in 1999. ...........................................................................................................48
Figure 18. Beach seine catch-per-unit-effort for Pacific staghorn sculpin caughtfrom April through July 1999 compared with mean beach seine catch-per-unit-effort for the same time interval in ODFW's 1974-76 study..............................................50
Figure 19. Length frequency histograms for Pacific staghorn sculpin caught inbeach seine April through July 1999..................................................................................51
Figure 20. Beach seine catch-per-unit-effort for surf smelt caught from Aprilthrough July 1999 compared with mean beach seine catch-per-unit-effort for thesame time interval in ODFW's 1974-76 study. ..................................................................52
Figure 21. Length frequency histograms for surf smelt collected by beach seineApril through July 1999. . ..................................................................................................54
Figure 22. Beach seine catch-per-unit-effort for shiner perch caught from Aprilthrough July 1999 compared with mean beach seine catch-per-unit-effort for thesame time interval in ODFW's 1974-76 study...................................................................55
Figure 23. Length frequency histograms for shiner perch caught in beach seineduring May, June and July 1999. .......................................................................................56
Figure 24. Beach seine catch-per-unit-effort for Pacific herring caught from Aprilthrough July 1999 compared with mean beach seine catch-per-unit-effort for thesame time interval in ODFW's 1974-76 study ..................................................................58
Figure 25. Length frequency histograms for Pacific herring caught in beach seinein May, June and July 1999................................................................................................59
Figure 26. Beach seine catch-per-unit-effort for English sole caught from Aprilthrough July 1999 compared with mean beach seine catch-per-unit-effort for thesame time interval in ODFW's 1974-76 study...................................................................60
v
Figure 27. Length frequency histograms for English sole caught in beach seineduring the period April through July 1999.........................................................................61
Figure 28. Beach seine catch-per-unit-effort for starry flounder caught from Aprilthrough July 1999 compared with mean beach seine catch-per-unit-effort for thesame time interval in ODFW's 1974-76 study...................................................................63
Figure 29. Length frequency histograms for starry flounder caught by beach seinein June and July 1999.........................................................................................................64
Figure 30. Beach seine catch-per-unit-effort of abundant species by salinity. .................66
Figure 31. Fyke net catch-per-unit-effort for Pacific staghorn sculpin andthreespine stickleback caught during the interval April through July 1999.......................73

INTRODUCTION
Tillamook Bay on the northern Oregon coast was recently designated as an estuary ofnational significance and included as one of 27 estuaries in the National Estuary Program(NEP). Tillamook Bay is the third largest estuary in Oregon and exemplifies conditionsfound in most estuaries in the Pacific Coast Range Ecoregion. Before European contact,the Bay and its watershed provided highly productive habitat for five salmonid speciesand a wide range of other fish species and aquatic organisms. The lower watershedincluded a mosaic of forest, wetlands, and prairies interwoven with rivers and sloughs(Coulton et al 1996). The five rivers that entered the estuary met an estuary consisting ofextensive mud and sand flats traversed by deep channels. Large woody debris (LWD)was abundant in the lower reaches of the rivers and in the upper estuary. Extensive areasof salt marsh and tidal wetlands with backwater sloughs and complex networks of tidalchannels were present (Coulton et al. 1996).
Today, much of the historic habitat diversity and abundance has been lost. Over 86% offloodplain and lowland wetlands and marshes have been altered by agriculturaldevelopment (diking and filling) and secondarily by urbanization and road construction.Research showing positive correlation between wetland productivity and increasedjuvenile salmonid growth rates (Parker 1962, 1968; Peterman 1978) suggests that thesewetland losses could be linked to size-related early ocean mortality. LWD thathistorically was abundant in the lower river sections and the upper estuary was removedbetween the late 1800s and 1920 and has remained in low abundance since that time.LWD in the estuarine environment is thought to provide cover and refuge for fish,particularly during low tide conditions. In addition, log jams on the lower sections ofrivers entering the Bay contributed to winter flooding of adjacent flood plains, therebyexpanding the area available for use by rearing juvenile salmonids. Excessivesedimentation, due to fires and logging in the upper watershed and agricultural practicesin the lower watershed has shallowed the Bay and tidal river channels thus furtherreducing habitat complexity. The combined effects of these changes, is an estuary thatdiffers structurally and probably functionally from historic conditions. To varyingdegrees, other estuaries in the ecoregion have experienced similar changes (Sadro, 1999;Boule and Bierly 1986; Simenstad and Thom 1992). Although the effects of thesechanges on fish populations is only beginning to be understood, there is growingrecognition that estuarine habitat protection and restoration will be important in aidingthe recovery of depleted salmonid stocks and other estuary-dependent fish populations.
A primary goal of the Tillamook Bay National Estuary Program (TBNEP) was to developa Comprehensive Conservation and Management Plan (CCMP) "to protect and restoreestuarine habitat for important fishery resources, particularly anadromous salmonids".The initial CCMP was completed in June 1999 and lays out a variety of managementactions designed to achieve the goal of protecting and restoring habitat for fish. TheCCMP employs an adaptive management strategy that allows for change as informationon the effects of the CCMP are evaluated. Baseline information on the present status ofthe estuary's fish community and periodic updating of the baseline information throughmonitoring are essential components of the evaluation process. This report describes the

2
present status of the fish community in Tillamook Bay and presents a long-termmonitoring strategy for evaluating changes in the fish community through time.
STUDY AREA
Tillamook Bay is a drowned river estuary. It averages only about 6.6 ft (2.0 m) over atotal surface area of 13 square miles (33.7 square kilometers). Several deep channelswind through the intertidal mud and sand flats that rise above the water surface at lowtide (Figure 1). The Bay receives freshwater input from the Miami, Kilchis, Wilson,Trask and Tillamook Rivers and exchanges ocean water through a single channel in thenorthwest corner. Despite large freshwater inflow, especially during the rainy wintermonths, heavy tidal fluxes dominate the system; extreme diurnal tides can reach 13.5 ft(4.1 m), with a mean tidal range of 5.6 ft (1.7 m) and diurnal range of 7.5 ft (2.3 m). TheBay experiences the full range of estuarine circulation patterns, from well-stratified towell-mixed, depending on the season and variations in discharge. During heavy rainwinter months, November through March, the system is periodically stratified, but duringlow precipitation summer months the Bay shifts to a well-mixed estuarine system(Camber 1997). Salinity ranges from around 32 ppt near the ocean entrance to about 15ppt at the upper (southern end) of the Bay at high tide during the summer. The estuarytypically maintains relatively high levels of dissolved oxygen (DO) throughout the yearand ranges from about 6.0 ppm to 12.0 ppm.
The Estuary provides habitat for numerous fish, shellfish, crabs, birds, seals, and seagrasses. An Oregon Department of Fish and Wildlife (ODFW) fish survey conducted inthe mid 1970s identified 56 species of fish in the Bay at various times of the year(Bottom and Forsberg 1978). The following five species of anadromous salmonidsspawn in the watershed and use the estuary at some point in their life cycle:
Chinook salmon (Oncorhynchus tshawytscha)Coho salmon (Oncorhynchus kisutch)Chum salmon (Oncorhynchus keta)Steelhead Trout (Oncorhynchus mykiss)Cutthroat Trout (Oncorhynchus clarki)
Coho salmon was recently listed as a federal threatened species under the EndangeredSpecies Act and with the exception of fall chinook salmon, most of the other salmonidspecies have exhibited substantial declines in abundance over the past two decades.
The major habitat categories in the Estuary include the following:
• Intertidal and Subtidal Mud/Sand flats• Eelgrass Beds (primarily Zostera marina)• Salt Marsh• Rocky Intertidal

3
Figure 1. Multispectral photograph of Tillamook Bay showing location of tidal channelsand vegetation categories on intertidal flats and marshlands.
4
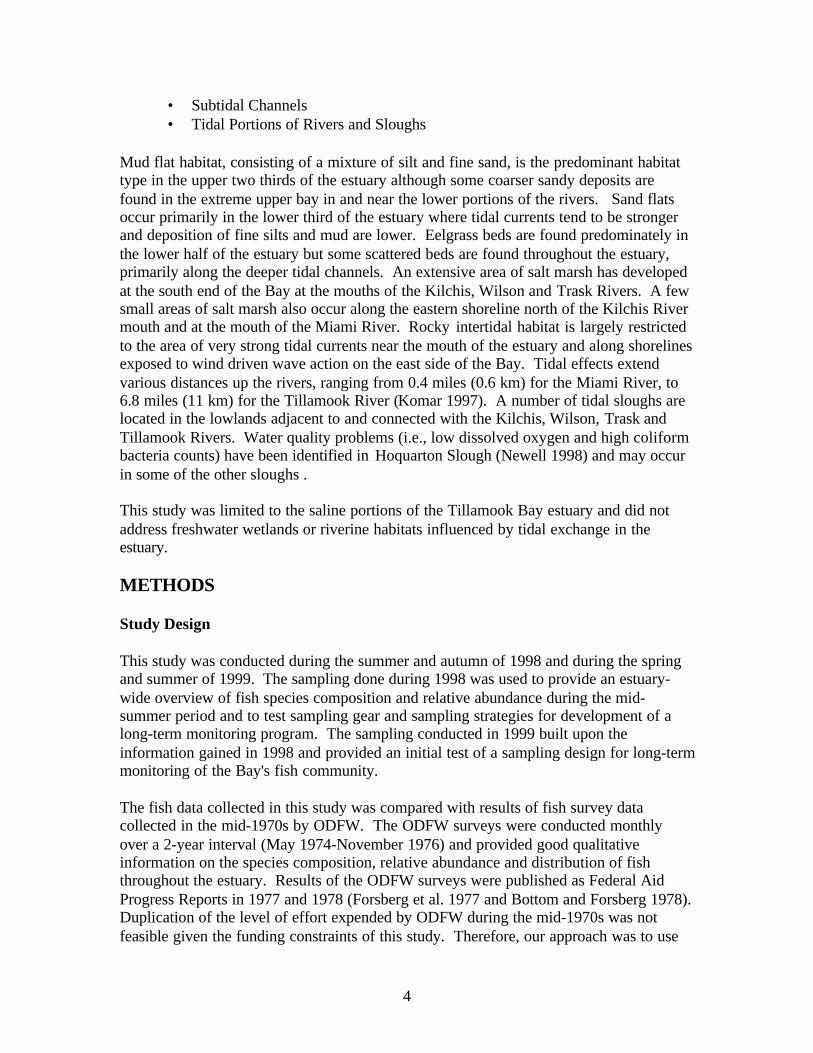
• Subtidal Channels• Tidal Portions of Rivers and Sloughs
Mud flat habitat, consisting of a mixture of silt and fine sand, is the predominant habitattype in the upper two thirds of the estuary although some coarser sandy deposits arefound in the extreme upper bay in and near the lower portions of the rivers. Sand flatsoccur primarily in the lower third of the estuary where tidal currents tend to be strongerand deposition of fine silts and mud are lower. Eelgrass beds are found predominately inthe lower half of the estuary but some scattered beds are found throughout the estuary,primarily along the deeper tidal channels. An extensive area of salt marsh has developedat the south end of the Bay at the mouths of the Kilchis, Wilson and Trask Rivers. A fewsmall areas of salt marsh also occur along the eastern shoreline north of the Kilchis Rivermouth and at the mouth of the Miami River. Rocky intertidal habitat is largely restrictedto the area of very strong tidal currents near the mouth of the estuary and along shorelinesexposed to wind driven wave action on the east side of the Bay. Tidal effects extendvarious distances up the rivers, ranging from 0.4 miles (0.6 km) for the Miami River, to6.8 miles (11 km) for the Tillamook River (Komar 1997). A number of tidal sloughs arelocated in the lowlands adjacent to and connected with the Kilchis, Wilson, Trask andTillamook Rivers. Water quality problems (i.e., low dissolved oxygen and high coliformbacteria counts) have been identified in Hoquarton Slough (Newell 1998) and may occurin some of the other sloughs .
This study was limited to the saline portions of the Tillamook Bay estuary and did notaddress freshwater wetlands or riverine habitats influenced by tidal exchange in theestuary.
METHODS
Study Design
This study was conducted during the summer and autumn of 1998 and during the springand summer of 1999. The sampling done during 1998 was used to provide an estuary-wide overview of fish species composition and relative abundance during the mid-summer period and to test sampling gear and sampling strategies for development of along-term monitoring program. The sampling conducted in 1999 built upon theinformation gained in 1998 and provided an initial test of a sampling design for long-termmonitoring of the Bay's fish community.
The fish data collected in this study was compared with results of fish survey datacollected in the mid-1970s by ODFW. The ODFW surveys were conducted monthlyover a 2-year interval (May 1974-November 1976) and provided good qualitativeinformation on the species composition, relative abundance and distribution of fishthroughout the estuary. Results of the ODFW surveys were published as Federal AidProgress Reports in 1977 and 1978 (Forsberg et al. 1977 and Bottom and Forsberg 1978).Duplication of the level of effort expended by ODFW during the mid-1970s was notfeasible given the funding constraints of this study. Therefore, our approach was to use
5
the ODFW data as a baseline for comparison. In this comparison, we focused on thespring and summer months since the ODFW surveys indicated that this is the period ofthe year when salmonid use of the estuary is highest and when the greatest number of fishspecies are present.
We did not attempt to duplicate the exact sampling strategy used by ODFW but samplingwas conducted throughout the Bay at many of the same general locations that weresampled by ODFW (Figure 2). We also used the same dividing lines between the upper,middle and lower regions of the Bay that were used by ODFW. Our objective was toobtain sufficient information that comparisons could be drawn between the two studies interms of species richness, relative abundance of common species, distribution of commonspecies, frequency of capture by similar sampling gear and monthly trends in catch-per-unit-effort. The 1998 sampling and 1999 monitoring programs are described below.
1998 Sampling Program
Since the majority of the Bay is shallow mud and sand flat habitat, representativesampling of this habitat was a high priority for the sampling program. During the 1970s,ODFW used a combination of beach seining and trawling to sample the mud and sandflat habitat. A review of the literature indicated that this type of habitat has also beensampled with gill nets, drop nets and lift nets. All of these techniques have limitationswith regard to collection of representative samples. Trawls are selective for demersal fishspecies, gill nets tend to be very difficult to fish effectively due to effects of strong tidalcurrents and algae accumulations, and the area sampled by lift and drop nets is too smallto provide representative samples. Beach seines collect reasonably good samples but arelimited to use around the perimeter of the mud and sand flats. Recognizing thesepotential limitations, we decided to use a new type of sampling gear designed specificallyfor sampling shallow mud/sand flat habitat.
This sampling gear was designed after some smaller prototypes being used in PugetSound for sampling eelgrass habitat. The net is referred to as a "round-haul net" andconsists of a wing section approximately 99 m (325 ft) in length and a cod-end section(see Methods section for description). The net is deployed in a circle from a fixed pointand then closed to herd the encircled fish into the cod end of the net. Fish are thenremoved from the cod-end. After preliminary testing, we used this net to sample shallowmud flat, sand flat and eelgrass beds throughout the Bay during the summer of 1998.
A random sampling approach was used for establishing round-haul net sample locationswithin three broad habitat categories - mud flat, sand flat and eelgrass beds. Sand flat andeelgrass habitats are located primarily toward the north end of the Bay and mud flathabitat comprises the majority of the upper two thirds of the Bay. The sampling locationswere established by placing a numbered transparent grid over a multispectralphotographic image of the Bay taken at extreme low tide in July 1995. The imageshowed the locations of major intertidal eelgrass beds, mud flats, sand flats, and thesubtidal channels. The location of eelgrass beds, and intertidal sand flats and mud flats


7
were identified and traced onto the transparent grid. The Bay was then divided into threeareas (i.e., upper (south end), middle and lower) and sampling sites within each thirdwere selected using a random numbers generator. Allocations of sampling sites to thethree habitat types were made in approximate proportion to areas represented by eachhabitat type. Therefore, more mud flat habitat sites were established than eelgrass or sandflat sites. Each grid unit represented approximately 5.4 hectares (13. 4 acres). A total of13 sample sites were selected for sampling (Figure 3). Nine were in mud flat habitat, 2were in sand flat habitat and two were in eelgrass beds.
In addition to the round-haul net sampling, sampling with beach seine and bottom trawlwas conducted during the same time period. Beach seining was conducted at 10 sitesalong the shoreline from near the mouth of the Bay to lower Hoquarton Slough at theupper end of the Bay (Figure 3). Habitat sampled by beach seine included sandy beach,rocky beach, mud flat and rocky beach/eelgrass. Subtidal channel habitat in the lowerBay was sampled with a semi-balloon bottom trawl. Five trawl sites were sampled(Figure 3). All five sites were located in close proximity to subtidal trawl sites sampledby ODFW in the mid 1970s.
Sampling of salt marsh habitat also was a priority for this study. Salt marsh habitatprotection and restoration is one of the action items in the CCMP and salt marsh habitatin other estuaries has been identified as important rearing habitat for juveniles of severalanadromous salmonid species (Healey 1982). The ODFW surveys of the mid-1970s didnot sample salt marsh habitat and we are unaware of any previous fish sampling inTillamook Bay salt marshes.
Our approach to designing a monitoring program for salt marsh habitat was to identify aquantitative sampling technique for natural salt marsh habitat and to conduct testsampling to answer the following questions:
1. Where in the marsh should sampling be conducted?2. What times of the year and at what frequency should sampling be conducted?3. What level of sample replication is needed.4. What parameters should be measured in addition to species composition and
numbers of fish?, and5. Can the sampling be done economically?
Reconnaissance surveys of the salt marsh habitat around the periphery of the estuarywere conducted during the spring of 1998. With the exception of a few small areas, themajority of salt marsh is located at the south end of the Bay on the delta formed by theKilchis, Wilson and Trask Rivers. We found that approximately one half of the marsh isdissected with a network of narrow tidal channels that are filled and drained with eachtidal cycle. Other areas of the marsh are drained by relatively large channels formed bythe Kilchis and Wilson Rivers. The narrow tidal channels offered an opportunity to usestationary fyke nets to collect fish leaving the marsh on the out-going tide (see Methodssection). No other feasible sampling techniques were identified.

8

9
We used three fyke nets for test sampling. Several criteria were used in selecting sites forinstallation of the fyke nets in the marsh. First, we wanted to locate the sites at differentelevations in the salt marsh to see if distance from the edge of the Bay influenced thecatch. The salt marsh gradually increases in elevation from the western edge toward theeastern edge. Second, channel drainage characteristics were examined. We wantedchannels that drained completely at low tide and did not have much residual water wherefish could hold over during the tidal cycle. And finally, channel size was considered.Channels needed to be small enough that they could be effectively sampled with the fykenets but large enough to provide a representative sample of the marsh drainage. Severalcandidate sites were identified in each of the lower, mid and higher elevation sections ofthe marsh. Final site selection within each of the three regions of the marsh was madeusing a random selection procedure (coin toss). One fourth-order and two third-orderchannels were selected for sampling. All of the channels selected drained a discrete areaof the marsh and were not interconnected with other sub-drainages where fish couldpotentially escape capture.
An approximate map of the drainage area upstream of each sampling site was preparedbased on visual delineation of the drainage area boundary and on-ground measurementswith a field tape. The mapping was done during early spring before the marsh vegetationhad started to grow. The maps were used to calculate the surface area of marsh sampledby each fyke net.
Fyke net sampling was conducted periodically between mid June and October. Duringmost of the sampling periods, a round-haul net collection was made on the mud flatadjacent to the salt marsh to compare species composition of the catch on the mud flatwith catch in the salt marsh. In addition, an efficiency test was conducted to estimate theefficiency of the fyke nets in collecting fish moving out of the channels.
Water quality sampling was conducted concurrently with the collection of each fishsample. Water quality parameters measured during the 1998 surveys included dissolvedoxygen, pH, salinity, conductivity, water temperature and turbidity (see Appendix A).
During the beach seine sampling conducted in July, a sample of juvenile chinook salmonwas collected from Hoquarton Slough for stomach content analysis. The contents wereremoved and identified in the laboratory.
1999 Monitoring Program
Information developed during the 1998 sampling program was used to design apreliminary sampling strategy for long-term monitoring of fish. This sampling strategywas initiated in late March 1999 and continued through the end of July 1999. As will bediscussed below, comparisons between the round-haul net samples and the beach seinesamples collected in 1998 indicated that beach seine sampling around the perimeter of themud and sand flats provided results comparable (in terms of abundant species collected)with samples collected on the open mud and sand flats by the round-haul net. Since theround-haul net was technically more difficult to operate and required more staff than

10
beach seining, use of the round-haul net was discontinued in 1999 and more effort wasexpended on beach seine sampling.
A preliminary survey of suitable sites for beach seining was conducted during early April1999 and the location of potential sites was mapped. Note that no suitable beach seinesites were found along the south end of the Bay adjacent to the Three Capes Highway.Potential sites were selected based on boat accessibility and seineable shorelineconditions at high tide. High tide seining sites were selected rather than low tide sites fortwo reasons. First, when sampling is conducted at approximately 2-week intervals as itwas in this study, it is much easier to resample the same location at high tide than at lowtide. On shallow mud and sand flats the low tide water line can vary several hundred feetduring a lunar cycle. Therefore, sampling the same location at low tide with a beachseine would be impossible on a 2-week sampling schedule. Second, staffing and fundinglimitations precluded sampling at both high and low tide.
The potential beach seining sites were subdivided into lower, middle, and upper bay sites.The dividing lines between upper, middle and lower bay were the same as those used byODFW for their surveys in the mid 1970s. From the potential sites, six were selectedfrom the upper, six from the middle, and six from lower regions of the Bay for a total of18 beach seining sites (Figure 4). Three of the six sites within each region were locatedalong shoreline with coarse grained substrate (gravel, cobble or mixed cobble/boulder).The other three sites within each region were located along shoreline with fine grainedsubstrate (i.e., sand or fine sand/silt). Final selection of sites within each region wasdone by assigning numbers to all potential sites with coarse grain and fine grain shorelineconditions and then randomly selecting three sites from the coarse grain group and threefrom the fine grain group. In a few cases, it was necessary to deviate from the randomselection process where the number of potential sites was small (e.g. lower bay rockyshoreline sites). The presence of eelgrass at or near to selected coarse or fine grain beachseine sites was recorded and used as an additional habitat criterion for comparisonpurposes.
Beach seine sampling was initiated in late April and was conducted at approximately bi-weekly intervals through June. In July, a single set of beach seine samples was collectedduring the latter part of the month. Samples were collected near high tide (+ about 2hours). Since high tide occurs about 40 minutes later in the upper bay than at the mouthof the Bay, it was possible to collect samples over about a 6-hr interval each day.Sampling was limited to daylight hours.
Trawling was conducted at two channel locations in the lower Bay (Figure 4). Thesesites were selected based on results of the 1998 trawl surveys and represented the twoareas with the highest catch per unit effort. Two replicate trawls were made at low tideat each of the two trawl sites. Sampling was conducted at approximately biweeklyintervals from late April through June on the same schedule as the beach seine sampling.A late July sample also was collected to coincide with the timing of the 1998 estuary-wide trawl sampling. All samples were collected during daylight hours.

11
Figure 4. Location of sampling sites in Tillamook Bay for the 1999 fish monitoringprogram.

12
Sampling in the salt marsh at the south end of the Bay was continued in 1999. Threeadditional sampling sites were established (Figure 4). The new sampling sites providedtreatment replication and were sited so that comparisons in fish use between lower andupper regions of the marsh could be made. Three of the sites were in the lower portion ofthe salt marsh near the adjoining sand flat and three were in higher elevation marshtoward the mid-region of the salt marsh. All sites were located on either third or fourthorder tidal channels. Sampling efficiency was estimated based on recapture of fin-clipped fish released upstream of the fyke nets at high tide. All fyke-net sampling waslimited to daylight hours. Water quality sampling was conducted concurrent withcollection of all fish samples. The water quality parameters measured in 1999 weretemperature, salinity, and conductivity.
Habitat Characterization
Habitat conditions at each sampling site were described in terms of both physical andchemical conditions. Standard data forms (see Appendix D, Figure A-2) were used torecord the data. Physical habitat was described based on visual observations of thesubstrate (Appendix B). Substrate classifications were based on the predominantsubstrate components and included the following:
• sand (predominantly fine sand)• mud (fine sand mixed with silt and mud)• gravel (0.5 to 2.5 inches in diameter)• cobble (2.5 to 10.0 inches in diameter)• boulder (>10.0 inches in diameter)• eelgrass• other rooted aquatic plants
Tidal stage, water temperature (C), dissolved oxygen (mg/l), pH, salinity (ppt),conductivity (µ mhos/cm) and turbidity (NTUs) were routinely collected near the watersurface at the time of sampling during the 1998 sampling period. A Hydrolab DataSonde 4-Water Quality Multiprobe was used to collect water quality parameters. Thedissolved oxygen, pH and turbidity probes on the Hydrolab failed part way through the1999 sampling period. Only the water temperature, salinity and conductivity probesconsistently provided reliable data throughout the 1999 sampling period. Therefore, onlydata are presented for dissolved oxygen, pH or turbidity for the 1999 sampling period.Longitude and latitude coordinates for each sampling station were recorded during boththe 1998 and 1999 sampling periods with a Lowrance Model 212 global positioning unit(GPS). The GPS unit was not corrected for military modification of satellitetransmissions.
Sampling Gear
Round-Haul Net
The round-haul net was used during the 1998 sampling period to sample shallow

13
intertidal mud flat, sand flat and eelgrass bed habitats. The net was constructed with thefollowing components:
• outer wing section---57.9 m (190 ft) x 3.0 m (10 ft), 3.8 cm (1.5 in) stretchmesh nylon net
• inner wing section---41.2 m (135 ft) x 2.4 m (8 ft), 3.2 cm (1.25 in) stretchmesh nylon net
• triangular floored cod-end---1.27 cm (0.5 in) knotless netting, having 3.0 m(10 ft) sides on the triangle, 2.4 m (8 ft) deep
A foam core float line was used for floatation on the wing segments and a solid core leadline was used to hold the bottom of the wing segments against the substrate. A ropebridal was attached to the end of the outer wing segment to allow towing by a boat. Thetriangular cod end of the net had floats around the top edge of the triangle and a heavylead line was attached to the outer edge of the floor of the cod end to keep the floorsecured against the substrate. The cod end was held open by three steel pipes that werepushed into the substrate at the three corners of the triangular cod end. Rings attached tothe three corners of the triangle provided the attachment sites for the three steel pipes.The three pieces of steel pipe were 3.0 m (10 ft) in length.
Plates 1 through 3 show the sequential steps in deployment of the round-haul net. Thenet was deployed from a specially designed "shooting box" secured to the bow of a 21-ftaluminum jet sled. The wing of the net was then deployed in the direction of the tidalcurrent by backing the boat in a large circle. The wing was brought back to the cod endso that the net formed a closed circle. The bridal rope on the wing was then quicklyattached to a towrope at the stern of the boat and the net wing was towed to close thecircle. As the net was closed, fish encircled by the wing were herded toward the cod end.The wings were white in color so that they were easily visible to fish. The cod end wasdyed black to reduce net avoidance. When the wing was closed against the mouth of thecod end, the lead line at the front edge of the cod end was lifted above the water surfaceto retain fish in the cod end. Captured fish were then removed by hand or dip net.
Beach Seine
Beach seining was conducted at shoreline sites with a 30.5 m (100 ft) x 1.8 m (6 ft) beachseine. The seine was constructed of 0.95 cm (3/8 in) woven nylon netting with foamfloats and a solid core lead line. Brails (wooden poles) were attached to both ends of thenets to facilitate keeping the lead line on the bottom during deployment and hauling-in ofthe net. During the 1998 sampling, use of the seine involved anchoring one end of theseine to the shoreline and then deploying the seine in an arc to bring the other end back toshore. This was usually done by wading; however, at a few locations where water depthwas too deep for wading, the net was deployed from a boat. We attempted tostandardized the process of net deployment so that approximately the same surface areawas sampled at each station.

14

15
Beginning in April 1999, the seining procedure was modified somewhat to ensure betterstandardization of the area sampled at each station. A rope bridal approximately 50 feetin length was attached to the brail on one end of the beach seine. The bridal was thenattached to the bow of a boat equipped with an outboard jet drive. The net was deployedby anchoring one end on the bank and slowly backing the boat out perpendicular to theshoreline until the entire net was in the water and pulled tight. The boat was then backedin the direction of the tidal current. When the boat was close to shore the, bridal wasreleased and the free end of the net was pulled onto the shore. At a few sites where thewater was too shallow to operate the boat, the same procedure was followed except thatthe net was deployed by wading instead of with the boat.
Trawl
Trawling in subtidal channel habitat was conducted with a 4-seam semi-balloon trawlwith a 6.1 m (20 ft) head rope and 7.6 m (25 ft) foot rope. A "tickler chain" was attachedto the footrope. Mesh sizes were:
• body and wings --- 3.7 cm (1.5 in) stretch mesh 100 meshes deep,• intermediate section---3.2 cm (1.25 in) stretch mesh 66 meshes deep,• cod end, outer bag---2.9 cm (1.13 in) stretch mesh 88 meshes deep,• cod-end, inner bag---1.8 cm (0.69 in) stretch mesh 200 meshes deep.
Doors on the trawl measured 0.53 m (21 in) x 0.76 m (30 in) and were pulled with a V-shaped bridal with 18.3 m (60 ft) legs. A small crab boat (8.8 m) equipped with ahydraulic winch was used to fish the trawl net. Tows were made in the direction of thetidal current and were typically five minutes in duration.
Fyke Net
Three identical fyke nets were used to sample fish in salt marsh channels. The aluminumtube frame at the mouth of each fyke net was 1.8 m (6 ft) x 1.8 m (6 ft). The netconsisted of four panels of 0.95-cm (0.375-in) stretch mesh netting, which tapered fromthe mouth to a 10.2 cm (4 in) diameter opening at the cod end of the net. Beginning inMarch 1999, 0.25 in (0.64 cm) mesh nylon net liners were installed in the fyke nets topreclude potential loss of very small salmonids. A PVC sleeve attached the cod end ofthe fyke net to a nylon sleeve on a 61 cm (24 in) x 91 cm (36 in) live box. The live boxwas covered with 0.64 cm (0.25 in) woven mesh nylon net. A pit was dug in the tidalchannel at the location of each live box so that fish entering the live box would havewater available when the channel drained out.
At each fyke net sampling site, a wooden frame was installed to support the fyke netframe in a vertical position across the channel (Plate 4). The channel sites selected forinstallation of the fyke nets were less than 1.8 m (6 ft) in width. Therefore, to install thewooden frames, slots were cut in the banks and a narrow trench was dug across thechannel bottom. The frame was forced into the slots in the bank and down into thebottom of the channel to form a tight seal. A 3.8-cm deep slot was provided on the twosides and bottom of the wooden frame to receive the net frame. With this arrangement

16
Plate 4. Fyke net in support frame at low tide.
the net could be easily slipped in and out of the wooden frame. When in place, a fyke netsampled all of the water leaving the tidal channel.
Fyke net samples were collected by placing the fyke nets in the wooden frames at highslack tide. The nets fished until the channel drained dry at low tide. During the 1999sampling periods, three sites were sampled on one day and the remaining three sites weresampled on the following day.
Fish Handling Procedures
Fish collected by the various sampling gear were identified to species and measured tothe nearest millimeter. For fish species with forked tails, fork length (FL) measurementswere taken; standard lengths (SL) were recorded for other fish species. Where largenumbers of a given species were collected in a sample, a sub-sample of fish wasmeasured (usually 25 or more specimens) and the remainder were counted and released.Juvenile salmonids were anesthetized with MS 222 prior to measuring to reduce handlingstress. A "wet bottom" net was used to transfer fish from holding tanks to the measuringboard to reduce the time fish were out of the water. Identification of estuarine and marinespecies were based on keys in Pacific Fishes of Canada (Hart 1973) and Pacific CoastFishes of North America 1983 (Eschmeyer et al. 1983).

17
During 1998, a small sample of juvenile chinook salmon were collected from HoquartonSlough for stomach content analysis. These fish were preserved in 90 percent ethanolafter their body cavities were opened. Stomach contents were identified under adissecting microscope in the laboratory. During the 1999 sampling program, severalsamples of juvenile chum and chinook salmon were preserved in 10% formalin solution,placed in labeled containers and archived for future stomach content analyses.
Coordination with Other Programs
During spring and early summer of 1998 and 1999, ODFW monitored downstreammigration of juvenile anadromous salmonids at two screw-trap locations on the LittleNorth Fork Wilson River and on the Little South Fork Kilchis River. A percentage of thechum salmon, chinook salmon, coho salmon, steelhead trout, and cutthroat trout capturedat the traps were marked with a caudal fin clip. The marked fish were released upstreamof the screw traps and the percentages of each species recovered at the screw trap wasused to obtain gear efficiency estimates. These estimates were then used to calculateweekly estimates of out-migrant numbers for each species. We examined all juvenilesalmonids captured during our study for fin clips and recorded all fin clipped fishobserved. We used the information compiled by ODFW on the peak periods ofdownstream migration to help interpret the abundance patterns of juvenile salmonids inthe estuary.
RESULTS AND DISCUSSION
Temperature and Salinity
Burt and McAllister (1959) classified Tillamook Bay as a two-layered system during thehigh run-off periods from November through March and as a well-mixed, verticallyhomogeneous system during low flow periods from April through October. Bottom andForsberg (1978) described the Bay as a well mixed to partially mixed system throughoutmost of the year. Bottom and Forsberg suggested that the combination of large tidalamplitude, shallow depths, and moderate freshwater inflow probably prevents themaintenance of a two-layered system for extended periods of time.
Maps showing the seasonal patterns of temperature and salinity at high tide in TillamookBay were developed by Bottom and Forsberg (1978) based on the data collected byODFW during the mid-1970s (Figures 5 and 6). These maps demonstrate the largeseasonal influence of freshwater inflow on the longitudinal gradient of temperature andsalinity from lower to upper Bay. The ODFW study also showed that the distribution ofmany fish species within the Bay was broadly correlated with salinity conditions. Morespecies used the mid- and upper regions of the Bay during periods of maximum salt waterintrusion. Since one of the objectives of this study was to describe present fish use of theestuary by updating results of ODFW's mid-1970s fish surveys, it was important todetermine whether salinity and temperature conditions were similar between the twostudies.

18
Figure 5. Average seasonal temperatures (C) in Tillamook Bay during period May 1974-November 1976 from samples taken near the bottom at high tide (Bottom and Forsberg1978).
19
Figure 6. Average seasonal salinities (ppt) in Tillamook Bay during period May 1974-November 1976 from samples taken near the bottom at high tide (Bottom and Forsberg1978).
20
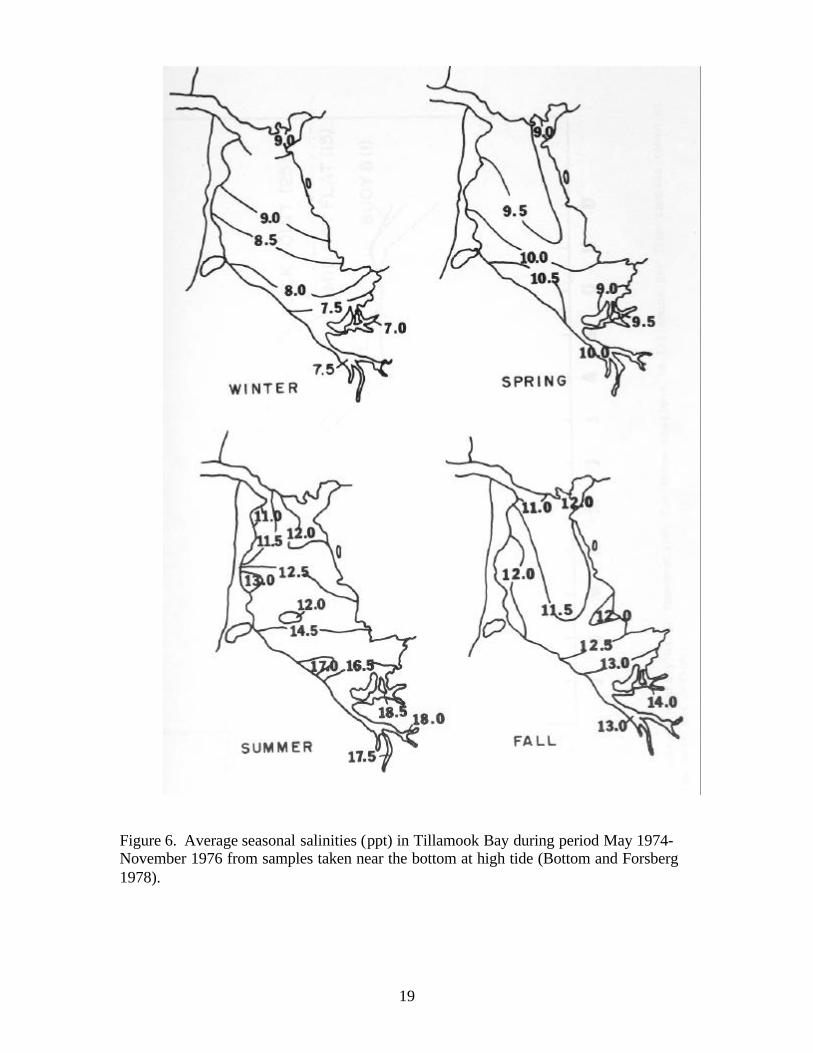
Fresh water inflow during the two studies was compared based on Wilson River flow(U.S.G. S. gauge No. 14301500) and precipitation at the Tillamook airport (U.S. WeatherBureau) (Figures 7 and 8). The period April though July was used for comparison sincemost of the estuary-wide fish distribution data in this study were collected between lateApril and late July 1999. Wilson River flow was consistently lower during April 1999than during April in the mid-1970s. Precipitation showed the same pattern with the meanmonthly precipitation being about 2.1 inches lower in 1999. During May, Wilson Riverflow was only slightly higher in 1999 than in the previous study although mean monthlyprecipitation during May 1999 was about 2.4 inches higher. River flow conditions andprecipitation for June and July 1999 were relatively low and were nearly the same as themid-1970s study. Since the 1999 estuary-wide fish sampling was initiated in late April, itappears that inflow conditions during the period of fish collection (i.e., late April throughJuly) were about the same for the two studies
The seasonal ranges in salinity and temperature for the two studies are compared inTables 1 and 2, respectively. The range in salinity conditions measured during spring of1999 were similar to mean spring conditions reported for mid-1970s in the middle andupper regions of the Bay (Table 1). However, in the lower bay, mean salinity at the sixbeach seine sites in 1999 ranged from 19-31 ppt whereas, mean salinity across the lowerbay in the mid-1970s was a constant 28 ppt. The wide range in mean salinity for the1999 lower bay sites was caused largely by relatively low values at stations LB-E1 andLB-E2 during May. The May samples at these two locations were taken within 1 hour ofhigh tide. Thus, time of sample collection probably was not responsible for the lowvalues. Both of these sampling sites are located at Hobsonville Point near the channelleading into the Bay from the Miami River. Variations in freshwater input from theMiami River channel probably affected salinity conditions at these two sitesdisproportionate to other lower Bay sites. Therefore, the variability in salinity seen in thelower Bay during spring 1999 was probably caused by localized freshwater input aroundHobsonville Point.
Salinity conditions in the lower and upper regions of the Bay during summer of 1999were very similar to mean summer conditions found in the mid 1970s in these regions(Table 1). The maximum mean salinity recorded at the mid-bay sites during the summerwas the same as the maximum mean salinity for ODFW's mid-bay data.
The range in mean water temperatures during the spring and summer of 1999 were morevariable and somewhat higher in all three regions of the Bay than the ranges in meanspring and summer temperature conditions reported for the ODFW study (Table 2). Thehigher temperatures in 1999 may reflect the bias associated with comparing temperaturesduring the latter part of the spring season and the warmest part of the summer season withODFW's means for the full three-month spring and summer periods. The wider range inmean temperatures in 1999 probably reflects the variability introduced from samplingover a longer period of the tidal cycle in 1999 (i.e., + 2 hours of high tide).

21
Figure 7. Mean stream flow in the Wilson River for the period April-July 1975 through1976 and Wilson River stream flow for the period April-July 1999 (U.S.G.S.gauge No.14301500).
Figure 8. Mean monthly precipitation in Tillamook, Oregon for the periods April-July1974 through 1976 and April-July 1999 (U.S. Weather Bureau).
0.0
500.0
1000.0
1500.0
2000.0
2500.0
3000.0
1-Apr
8-Apr
15-Apr
22-Ap
r29
-Apr6-M
ay
13-M
ay
20-May
27-May
3-Jun
10-Jun
17-Ju
n24
-Jun
1-Jul
8-Jul
15-Ju
l22
-Jul
29-Ju
l
Flo
w (
cfs)
1974-761999
0
1
2
3
4
5
6
7
8
A p r i l M a y J u n e Ju ly
Pre
cip
itat
ion
(in
ches
)
1 9 7 4 - 1 9 7 6
1 9 9 9

22
Table 1. Comparison of 1999 spring and summer salinity ranges for the lower, mid andupper bay regions with ODFW's mean salinity ranges for spring and summer 1974-76.
SALINITY RANGE (ppt)REGION Spring 1999 Spring 1975* Summer 1999 Summer 1975*Lower Bay 19-31 28 30-33 32Mid Bay 14-27 16-27 15-30 27-31Upper Bay 1-16 <1-23 6-27 9-30*represents mean of 1974-76 data
Table 2. Comparison of 1999 spring and summer water temperature ranges in the lower,mid and upper bay regions with ODFW's mean water temperature ranges for spring andsummer 1974-76.
WATER TEMPERATURE RANGE (C)REGION Spring 1999 Spring 1975* Summer 1999 Summer 1975*Lower Bay 10.2-11.5 9.5-10.0 11.0-13.8 11.0-12.0Mid Bay 11.3-12.7 9.5-10.0 14.0-17.4 12.0-13.0Upper Bay 10.3-13.6 9.0-10.5 16.8-19.2 13.0-17.5*represents mean of 1974-76 data

23
Overall, it appears that salinity and temperature conditions were similar between the twostudies. In both studies, the moderating effect of cool, saline ocean waters in the lowertemperatures in the lower bay during 1999 varied only about 4 0 C, ranging from 10.3 toregion of Tillamook Bay was apparent in the temperature data. Mean surface watertemperatures in the lower bay varied only about 4 0 C, ranging from 10.3 to 14.4 0 Cbetween late April and late July (Table 3). Mean temperatures in the mid-regionof the Bay varied over a wider range than in the lower Bay due to shallow depths and thestrong influence of air temperature. The upper bay had the widest range in meantemperature (i.e. 10.5-18.5 0 C) because conditions in the upper bay are influenced to agreater extent by freshwater inputs from the Kilchis, Wilson, Trask and TillamookRivers. The maximum temperatures recorded at individual beach seine sites in the lower,middle and upper Bay during 1999 were 15.10 C, 19.4 0 C and 21.4 0 C, respectively.Maximum temperatures recorded in the Bay during previous studies were 21.1 0 C in Julyin the mid-1970s (Forsberg et al. 1977) and 210 C by the U. S. Army Corps of Engineer(1974).
Mean salinity in the lower Bay during the 1999 study period was 28.4 ppt and rangedfrom 20.8 ppt in early May to 34.6 ppt in late July (Table 4 ). Mean salinity in the mid-region of the Bay was 22.8 ppt and ranged from 18.3 to 29.9 ppt. Mean salinity in theupper region of the Bay was only 11.7 ppt but ranged from 7.7 ppt in early May to 26.9ppt in late July. The highest salinity recorded during 1999 at the station farthest upstreamin the Bay (i.e., Station UB-E1) was 6.5 ppt but salinities as high as 30.1 ppt wererecorded within the upper region of the Bay (Site UB-W3) during late July, indicatingsubstantial salt water intrusion. During the mid-1970s, ODFW recorded salinities as higha 35.0 ppt as far upstream as Dick Point, which is 12.9 km from the Bay mouth. Bottomand Forsberg (1978) noted that in the upper bay the widest range in salinities occurred atthe bottom of the deeper channels, which were not sampled in this study.
Salinity and temperature conditions in the marsh habitat at the south end of the Bay hadnot been monitored prior to this study. Salinity conditions varied widely over the 1999study period at the six fyke net stations in the salt marsh (Figure 9). From late Aprilthrough May, the marsh was essentially a fresh water marsh with mean high-tidesalinities ranging from 0.0 ppt to 1.1 ppt. As freshwater input declined in June and July,salinity in the marsh increased and by late July averaged about 10 ppt at high tide.Periodic sampling conducted at three of the fyke net sites during the summer of 1998indicated that salinity in the marsh was higher during late June and late July 1998 than in1999 with values ranging from 8.0-14.2 ppt on June 25 to 10.9-18.2 ppt on July 27. Thehighest salinity measured at a marsh site was 23.2 ppt at F-1 and occurred on September25, 1998. It should be noted that all sampling during 1998 and 1999 was conductedduring the daylight hours and that the highest tides during the spring and summersampling periods occurred at night. Therefore, the marsh may have experienced slightlyhigher salinity at night during the spring and summer due to the larger influx of marinewater.

24
Table 3. Mean (in bold type), minimum and maximum water temperatures measuredduring beach seine sampling in the lower, mid and upper regions of Tillamook Bay in1999.
Temperature (C)Sample DatesLower Bay Mid Bay Upper Bay
27-29 Apr 10.3(9.7-10.8)
11.8(10.7-12.6)
12.1(9.9-13.6)
10-12 May 11.1(10.3-11.7)
11.8(11.6-12.0)
10.5(7.8-13.2)
25-27 May 11.6(9.8-13.0)
15.0(12.3-17.2)
15.4(14.3-17.6)
14-16 Jun 14.0(12.5-14.7)
17.0(15.4-19.4)
16.2(16.2-21.4)
29 Jun-1 Jul 14.4(12.1-16.0)
16.9(14.9-18.3)
18.5(16.6-20.5)
26-28 Jul 10.4(8.5-11.6)
14.1(11.7-15.6)
16.7(16.0-17.4)
Table 4. Mean (in bold type), minimum and maximum salinities measured at the watersurface during beach seine sampling in the lower, mid, and upper regions of TillamookBay in 1999.Sample Dates Salinity (ppt)
Lower Bay Mid Bay Upper Bay27-29 Apr 28.5
(23.9-31.8)22.2
(16.1-28.4)14.8
(12.1-18.0)10-12 May 20.8
(9.3-29.9)19.6
(16.5-24.2)7.7
(0.1-17.5)25-27 May 26.3
(18.2-32.6)18.3
(8.4-29.4)8.8
(2.6-12.8)14-16 Jun 30.3
(27.8-32.1)23.4
(19.2-28.0)21.6
(16.8-27.1)29 Jun-1 Jul 29.8
(33.6-35.7)23.5
(11.0-28.7)21.1
(10.6-24.8)26-28 Jul 34.6
(33.6-35.7)29.9
(26.5-33.5)26.9
(19.2-30.1)

25
Figure 9. Mean salinity (ppt) at six fyke net sites in marsh habitat at the south end ofTillamook Bay for the period late April through late July 1999.
Mean water temperatures at high tide in the marsh habitat at the southern end of the Bayvaried over a wider range than mean temperatures at the upper Bay beach seine sites (Figure 10). Mean temperatures in the marsh were slightly cooler from late Aprilthrough mid May and slightly warmer from late May through July. These differencesprobably reflect the greater influence of freshwater inputs from the Kilchis and WilsonRivers, which drain into the marsh. The maximum temperatures recorded at individualmarsh sampling sites during the 1998 and 1999 study periods were 23.2 0 C and 21.6 0 C,respectively. Both of the high values occurred in late July.
Species Composition
To compare the species composition of the fish community found in this study with thespecies composition found by ODFW in the mid-1970s, we combined the total catchresults for the 1998 and 1999 sampling programs (Appendix C). The total combinedcatch for this study was 19,359 fish of which 13,809 were collected in 1999 and 5,550were collected in 1998. The total combined catch for the ODFW study was 148,693 fish.
0.0
2.0
4.0
6.0
8.0
10.0
12.0
13-Apr
20-Apr
27-Apr
04-M
ay
11-M
ay
18-M
ay
25-M
ay
01-Ju
n
08-Ju
n
15-Ju
n
22-Ju
n
29-Ju
n06
-Jul
13-Ju
l20
-Jul
27-Ju
l
Mea
n S
alin
ity
(pp
t)

26
Figure 10. Mean water temperature (C) at six fyke net sites in marsh habitat at the southend of Tillamook Bay for the period late April through late July 1999.
All but two species (coho salmon and rockfish) collected during 1998 were capturedduring the estuary-wide survey conducted between July 14 and August 8. Additional fish(included in the above total) were captured in other sampling activities during 1998,including gear testing (mid June through early July), fyke netting in marsh habitat (midJune through October) and collection of fish for gear efficiency tests (October). The1999 total catch includes fish caught by fyke netting, which was initiated in late Marchand continued through late July, and by beach seining and trawling, which were initiatedin late April and continued through late July.
Table 5 compares the list of species collected in this study with the list of speciescollected during the ODFW study. A total of 40 species was collected in this studywhereas a total of 56 species was captured or observed during ODFW's 2.5-year study.Of the 40 species captured in this study, all but four were present in the mid-1970s catch.The four species not captured previously were the rockweed gunnel, rock prickleback,speckled sanddab and an unidentified eelpout. All four of these species were representedby only one or two individuals.
5.0
7.0
9.0
11.0
13.0
15.0
17.0
19.0
24-A
pr
01-May
08-May
15-May
22-May
29-May
05-Ju
n
12-Ju
n19
-Jun
26-Ju
n03
-Jul
10-Ju
l17
-Jul
24-Ju
l
Mea
n W
ater
Tem
pea
ture
(o
C)
MarshBeach Seine
27
Table 5. Scientific and common names of fish species collected from Tillamook Bayduring the mid-1970s (all seasons) and during this study (summer and autumn of 1998and spring and summer 1999).Family, genus and species Common Name Present During
1974-1976Present During
1998-99Petromyzontidae Entosphenus tridentatus Pacific Lamprey X ---Rajidae Raja binoculata Raja rhina
Big SkateLongnose Skate
XX
------
Acipenseridae Acipenser medirostris Green Sturgeon X ---Clupeidae Alosa sapidissima Clupea harengus pallasi
American ShadPacific Herring
XX
XX
Engraulidae Engraulis mordax Northern Anchovy X XSalmonidae Oncorhynchus tshawytscha Oncorhynchus clarki Oncorhynchus kisutch Oncorhynchus keta Oncorhynchus mykiss
Chinook SalmonCutthroat TroutCoho SalmonChum SalmonSteelhead Trout
XXXXX
XXXXX
Osmeridae Hypomesus pretiosus Spirinchus thaleichthys
Surf SmeltLongfin Smelt
XX
X---
Gadidae Microgadus proximus Pacific Tomcod X XZoarcidae Lycodes sp. Eelpout (small juvenile) --- XAtherinidae Atherinops affinis Top Smelt X XGasterosteidae Aulorhynchus flavidus Gasterosteus aculeatus
TubesnoutThreespine Stickleback
XX
XX
Syngnathidae Syngnathus griseolineatus Bay Pipefish X XEmbiotocidae Amphistichus rhododterus Phanerodon furcatus Embiotoca lateralis Rhacochilus vacca Cymatogaster aggregata Hyperporsopon argenteum Hyperprosopon ellipticum
Redtail SurfperchWhite SeaperchStriped SeaperchPile PerchShiner PerchWalleye SurfperchSilver Surfperch
XXXXXXX
---XXXX------
Stichaeidae Lumpenus sagitta Xiphister mucosus Anoplarchus purpurescens
Snake PricklebackRock PricklebackHigh cockscomb
X---X
XX---
Pholidae Pholis ornata Xererpes fucorum Pholis schultzi Apodichthys flavidus
Saddleback GunnelRockweed GunnelRed GunnelPenpoint Gunnel
X---XX
XX------

28
Family, genus and species Common Name Present During1974-1976
Present During1998-99
Anarhichadidae Anarrhichthys ocellatus Wolf-eel X ---Ammodtidae Ammodytes hexapterus Pacific Sand Lance X XGobiidae Clevelandia ios Arrow Goby X XScorpaenidae Sebastes sp . Rockfish sp. X XAnoplopomatidae Anoplopoma fimbria Sablefish X ---Hexagrammidae Hexarammos sp. Ophodon elongatus
Greenling sp.Lingcod
XX
XX
Cottidae Cottus asper Leptocottus armatus Oligocottus maculosus Artedius fenestralis Artedius lateralis Hemilepidotus hemilepidotus Enophrys bison Scorpaenichthys marmoratus Blepsias cirrhosus Hemilepidotus hemilepidotus Clinocottus acuticeps
Prickley SculpinPacific Staghorn SculpinTidepool SculpinPadded SculpinSmoothhead sculpinRed Irish LordBuffalo SculpinCabezonSilverspotted SculpinBrown Irish LordSharpnose sculpin
XXXXXXXXXXX
XXXX---XXX---------
Agonidae Occella verrucosa Pallasina barbata Stellerina xyosterna
Warty PoacherTubenose PoacherPricklebreast Poacher
XXX
---------
Cyclopteridae Liparis fucensis Liparis rutteri
Slipskin snailfishRingtail snailfish
XX
------
Bothidae Clitharichthys sordidus Clitharichthys stigmaeus
Pacific SanddabSpeckled Sanddab
X---
XX
Pleuronectidae Parophrys vetulus Platichthys stellatus Psettichthys melanostictus Isopsetta isolepis
English SoleStarry FlounderSand SoleButter Sole
XXXX
XXX---

29
A total of seven families and 23 species found in the mid-1970s study were not present inour catch. All of the missing species were relatively rare in the ODFW catch, with nonecomprising more than 0.1 percent of the total catch. Note also that several of the specieslisted for the ODFW study were observed during SCUBA diving or captured in gill nets(i.e., green sturgeon, big skate, longnose skate and wolf eel.) and may not have beensusceptible to our sampling gear. White sturgeon (Acipenser transmontanus) are knownto be present in the Bay but were not caught during either study. Although it is difficultto state with certainty, it is likely that most of the differences in the species compositionbetween the two studies can be explained in terms of sampling effort. Generally, one canexpect to encounter more rare species as sampling effort increases. ODFW sampledmonthly during all four seasons at 28 sampling locations over a 2.5-year period. Theyconducted 1,239 trawls and 465 beach seine sets. In this study, we sampled about thesame number of sites but duration of sampling was limited to five months in 1998 andfour months in 1999. We made a total of 30 trawls, 120 beach seine sets, and 17 round-haul net sets.
Relative Abundance
Comparisons between the two studies in terms of relative abundance of species in thecombined catches show more similarities than differences (Table 6). In both studies theten most abundant species comprised over 95 percent of the total catch. Eight of the tenmost abundant species in the mid-1970s catch were among the ten most abundant speciesin the 1998-99 catch.
Surf smelt was the most abundant species in the mid-1970s catch and accounted for 32.5percent of the total. Surf smelt ranked second in the 1998-99 catch, comprising 19.8percent of the catch. Nearly all of the surf smelt in the 1998-99 catch were caught duringthe 1999 sampling period. Pacific staghorn sculpin was the most abundant species in the1998-99 catch accounting for 21.1 percent of the total. Pacific staghorn sculpin wasrelatively less abundant in the ODFW study where it ranked sixth in abundance andcomprised only 2.6 percent of the catch. The lower relative abundance and total catch ofPacific staghorn sculpin in the mid-1970s could reflect differences in sampling gearrather than real differences in abundance. ODFW used a beach seine with 1.27 cm (0.5inch) mesh whereas we used a beach seine with 0.96 cm (0.375 inch) mesh. Many of thejuvenile Pacific staghorn sculpin collected in this study were very small and would havebeen difficult to capture in a larger mesh seine such as that was used by ODFW.Therefore, ODFW may have underestimated the number of small Pacific staghorn sculpinin their beach seine sampling.
Shiner perch ranked second and third in the 1974-76 and 1998-99 studies, respectively.Shiner perch was widely distributed and relatively abundant during both the 1998 and1999 sampling periods. Pacific herring ranked third in abundance in the 1974-76 catchand fifth in abundance during this study. Year-to-year variability in Pacific herringabundance was large in this study. Very few were caught in 1998 whereas, substantialnumbers were present in 1999. English sole ranked fourth in abundance in this study andfifth in the 1974-76 study.

30
Table 6. Relative abundance of fish species captured during the spring and summer 1998-99 by beach seine, round-haul net and trawl compared with relative abundance of fishspecies captured during May through July 1974-76 by beach seine and otter trawl (Datafor 1974-76 compiled from Bottom and Forsberg 1978).
1998-99 Combined Catch* 1974-76 Combined CatchSpecies Number Percent Species Number Percent
Pacific Staghorn Sculpin 2910 21.06% Surf Smelt 22183 32.50%Surf Smelt 2736 19.80% Shiner Perch 17967 26.32%Shiner Perch 2700 19.54% Pacific Herring 13730 20.12%English Sole 1551 11.23% Northern Anchovy 3558 5.21%Pacific Herring 1513 10.95% English Sole 3333 4.88%Chum Salmon 713 5.16% Pacific Staghorn Sculpin 1765 2.59%Chinook Salmon 283 2.05% Chinook Salmon 1251 1.83%Pacific Sanddab 272 1.97% Rockfish sp. 790 1.16%Starry Flounder 259 1.87% Starry Flounder 736 1.08%Pacific Sand Lance 214 1.55% Pacific Sand Lance 728 1.07%Threespine Stickleback 151 1.09% Chum Salmon 575 0.84%Coho Salmon 97 0.70% Saddleback Gunnel 531 0.78%Lingcod 82 0.59% Buffalo Sculpin 232 0.34%Tidepool Sculpin 79 0.57% Greenling sp. 178 0.26%Prickley Sculpin 75 0.54% Cabezon 106 0.16%Cutthroat Trout 38 0.28% Coho Salmon 63 0.09%Topsmelt 29 0.21% Sand Sole 58 0.08%Saddleback Gunnel 18 0.13% Prickley Sculpin 49 0.07%Buffalo Sculpin 15 0.11% Threespine Stickleback 46 0.07%Arrow Gobie 12 0.09% Pacific Tomcod 46 0.07%Striped Sea Perch 12 0.09% Cutthroat Trout 42 0.06%Greenling sp. 11 0.08% Bay Pipefish 37 0.05%Steelhead Trout 7 0.05% Pile Perch 32 0.05%Bay Pipefish 5 0.04% Lingcod 28 0.04%Northern Anchovy 5 0.04% Snake Prickleback 24 0.04%Sand Sole 4 0.03% Tubesnout 20 0.03%Padded Sculpin 4 0.03% Striped Sea Perch 20 0.03%Speckled Sanddab 3 0.02% Padded Sculpin 19 0.03%American Shad 3 0.02% Penpoint Gunnel 16 0.02%Cabezon 2 0.01% American Shad 14 0.02%Rockweed Gunnel 2 0.01% Red Irish Lord 14 0.02%Snake Prickleback 2 0.01% Pacific Sanddab 14 0.02%Pile Perch 2 0.01% Steelhead Trout 12 0.02%Red Irish Lord 2 0.01% Tidepool Sculpin 10 0.01%Unident. Sculpin 1 0.01% Ringtail Snailfish 8 0.01%Tom Cod 1 0.01% White Seaperch 4 0.01%Eel Pout 1 0.01% Sharpnose Sculpin 3 <0.01%Tubesnout 1 0.01% Tubenose Poacher 2 <0.01%White Seaperch 1 0.01% Red Gunnel 2 <0.01%Rock Prickleback 1 0.01% Warty Poacher 2 <0.01%Total 13,817 Brown Irish Lord 2 <0.01%

31
1998-99 Combined Catch* 1974-76 Combined CatchSpecies Number Percent Species Number Percent
Topsmelt 1 <0.01%Redtail Surfperch 1 <0.01%High Cockscomb 1 <0.01%Walleye Surfperch 1 <0.01%Longfin Smelt 1 <0.01%Silverspotted Sculpin 1 <0.01%Smoothead Sculpin 1 <0.01%Total 68,257
*1998 data set used in this comparison includes only the results of the estuary-wide survey conductedbetween July 14 and August 8, 1998.

32
Juvenile chum salmon and juvenile chinook salmon ranked sixth and seventh in thisstudy, respectively. Chinook salmon also ranked seventh in the ODFW study but chumsalmon were less abundant, ranking eleventh. All of the chum salmon collected in thisstudy were captured during the spring of 1999. It is possible that the smaller catch ofchum salmon during the mid-1970s was related to the larger mesh size of the beach seineused by ODFW. During May, many chum salmon fry are still small enough to readilypass through a 1.7 cm (0.5 inch) mesh opening.
Juveniles of two flatfish species (Pacific sanddab and starry flounder), ranked eighth andninth in the 1998-99 catch, respectively. Starry flounder ranked ninth in the 1974-76catch but Pacific sanddab was poorly represented comprising less than 0.02% of thecatch. It is possible that Pacific sanddab abundance has increased since the mid 1970s.However, we found substantial year-to-year variability in this study with Pacific sanddabcomprising about 7.7 percent of the 1998 catch and only about 0.5 percent of the 1999catch. The 1999 results for Pacific sanddab are more in line with the 1974-76 catchresults.
Pacific sandlance ranked tenth in both studies. We believe that the relative abundance ofPacific sandlance may have been underestimated in both studies due to poor samplingefficiency for this species. Pacific sandlance is a pelagic species and is not readilycaptured by bottom trawls. During beach seining and round-haul net sampling, weobserved large numbers of these slender fish avoiding capture by escaping through thenet mesh.
Northern anchovy and rockfish were among the ten most abundant species in the mid-1970s but were not among the ten most abundant species in this study. We collected onlya few northern anchovy and only one rockfish during our 1998-99 study. Thesedifferences in relative abundance could reflect species-specific differences is samplingefficiency or indicate that population densities of these two species are much lower nowthan they were in the mid-1970s. A closer look at these two species is provided below.
Bottom and Forsberg (1978) reported that northern anchovy were caught primarily byseine during the summer of 1975. Nearly all of the northern anchovy caught by ODFWwere taken in 10 seine hauls at Kincheloe Point near the mouth of the Bay. Residency inthe Bay appeared to be short with large numbers collected only during July, August andSeptember 1975. Relatively low numbers of northern anchovy were collected during1974 and 1976. Bottom and Forsberg (1978) concluded that there is probablytremendous annual variation in the use of the estuary by northern anchovy. This largeannual variation could explain the low numbers seen in this study. Additional monitoringwill be needed to determine whether northern anchovy are still periodically abundant inthe Bay.
Juvenile rockfish, probably blue (S. mystinus) or black rockfish (S. melanops), werecaptured almost exclusively in the lower bay during ODFW's study (Bottom andForsberg 1978). A total of 1,267 juvenile rockfish were collected during the period Maythrough July 1974-1976. Most of these fish were captured by beach seine during the

33
summer and fall months. Although sampling was conducted in 1998 and 1999 in thesame general areas where juvenile rockfish were found in the mid 1970s (e.g.,Hobsonville Point), only one juvenile rockfish was collected. This fish was collected atHobsonville Point by beach seine in October 1998. The near absence of this group offish in the 1998-99 samples could be due to a number of factors, including differences insampling techniques and levels of effort. However, it seems highly unlikely that thetechniques and level of effort used in this study would not have resulted in the capture ofat least a few more individuals unless abundance was substantially lower than in the mid1970s.
Several other species that were relatively common in the mid-1970s catch were poorlyrepresented in the 1998-99 catch. These species included buffalo sculpin, greenling,cabezon and saddleback gunnel. The greater abundance of buffalo sculpin, greenling andcabezon in ODFW's catch was probably related to more intensive sampling in deepchannel habitat. All three of these species were taken primarily at channel sampling sitesby trawl. We also collected these species by trawl in deep channel habitat. However, ourtrawl sampling was limited to a few sites in the lower Bay whereas ODFW sampledchannel habitat throughout the Bay with their small otter trawl.
During the ODFW study, saddleback gunnel was found throughout the Bay during thesummer months with peak catch-per-unit-effort occurring during June and July. ODFWcaught more saddleback gunnel in trawl samples than in beach seine samples with asummer catch-per-unit-effort of 1.59 fish per trawl. They found the greatest number inareas with eelgrass beds present. The observed difference between studies in total catchand relative abundance of saddleback gunnel could reflect the higher efficiency of thetrawl for this species and the greater intensity of ODFW's sampling effort, particulary oneelgrass beds.
Distribution and Abundance
We relied primarily on the 1999 beach seine data for describing the general distributionand abundance of fish in the estuary. The nine species listed in Table 7 represented over97 percent of the beach seine catch . All but one of these species were found throughoutthe estuary. The only exception was Pacific sandlance. Pacific sandlance was found onlyin the lower region of the Bay in 1999 but was captured in both the mid- and lower bayregions during 1998. Pacific Herring was not collected in the middle region of the Bay in1999 but was collected in both the upper and lower regions, indicating that they occurthroughout the Bay. The distribution of these species in 1999 was in general agreementwith their distribution in the mid-1970s. The single exception was that ODFW caughtPacific herring only in the lower and mid-regions of the Bay. By far the majority of thePacific herring caught in this study also were in the lower bay.
Total catch-per-unit-effort for beach seine in 1999 was 100.8, 65.1 and 106.4 fish perseine haul for the upper, middle and lower regions of the Bay, respectively. On an annualbasis, ODFW found that beach seine catch-per-unit-effort was much higher in the lowerbay than in the mid- and upper regions of the Bay. However, during summer the upper

34
bay catch increased as marine species moved further into the Bay with salt waterintrusion (Bottom and Forsberg 1978). Their summer catch-per-unit-effort patterngenerally fits with the results seen in this study.
We did not attempt to directly compare catch-per-unit-effort values obtained by beachseine in this study with ODFW's mid-1970s beach seine catch-per-unit-effort data forseveral reasons. First, ODFW used different size and different mesh beach seines thanwe used. During their first year of sampling they used a 45.5 m by 3.1 m seine and onlysampled lower bay stations. In subsequent years they used the 45.5 m seine in the lowerbay but sampled upper bay stations with a seine approximately one-half this length.Second, they sampled at high and low tide on many occasions and generally caught morefish at low tide (Bottom and Forsberg 1978). We did not sample at low tide.
Catch-per-unit-effort values for surf smelt and Pacific staghorn sculpin were about thesame in the 1999 beach seine catch but surf smelt frequency of occurrence was less thanhalf that of Pacific staghorn sculpin (Table 7). This indicates that surf smelt were notcaught as often but were found in relatively high numbers when they were caught. Thiswas true also for shiner perch, Pacific herring, and Pacific sandlance. The relatively lowcatch-per-unit-effort and frequency of occurrence of juvenile chinook salmon in the catchlargely reflects their late occurrence during the study period. Chinook salmon werecaught at 8 of the 18 beach seine sites after first appearing in the catch in mid June.
In the lower bay, both beach seining and trawling were conducted on the same samplingschedule during the spring and summer of 1999. Table 8 compares the ten most abundantspecies caught in the beach seine with the ten most abundant caught in the trawl. Sincesampling efficiencies were not determined for either the beach seine or trawl, thecomparisons shown in Table 8 provide only a general indication of the differencesbetween the shallow shoreline habitat sampled by beach seine and the deep channelhabitat sampled by trawl. Also note that trawling was conducted at low tide, which mayhave resulted in concentration of certain species in the deeper channels.
Part of the difference between the beach seine and trawl catches could be related to thetrawl's selectivity for bottom-dwelling species (Table 8). With the exception of Pacificherring, shiner perch and surf smelt, all of the relatively abundant species in the trawlcatch were bottom dwelling species. Pacific herring, which is generally considered apelagic species, is known to undertake daily vertical migrations in the ocean (Lassuy1989). Herring may gather near the bottom during the day but are frequently observed inmidwater schools. Their relatively high catch-per-unit-effort in the bottom trawl isprobably related to this diurnal movement pattern. Greenling, lingcod, and buffalosculpin were rarely caught in the beach seine and probably represent species typicallyassociated with the deeper tidal channel habitat. The beach seine catch in the lower bayincluded some of the bottom-dewelling species but had a much higher proportion ofpelagic species such as chum salmon, chinook salmon, Pacific sandlance and cutthroattrout (Table 8). Several relatively rare species such as cabezon, eelpout, tom cod, sandsole and rock prickleback were only captured in the trawl.

35
Table 7. Location of capture of the nine most abundant fish in 1999 beach seine samplesranked according to catch-per-unit-effort and frequency of capture.
Location of Capture in BaySpecies
Catch-per-unit-effort*
Rank Frequencyof Capture
Rank Lower Middle Upper
Surf Smelt 24.0 1 0.23 3 X X XP. Staghorn Sculpin 20.3 2 0.53 1 X X XShiner Perch 16.2 3 0.13 6 X X XPacific Herring 10.9 4 0.08 8 X XEnglish Sole 8.6 5 0.23 3 X X XChum Salmon 6.6 6 0.28 2 X X XChinook Salmon 1.9 7 0.14 5 X X XStarry Flounder 1.7 8 0.15 4 X X XPacific Sandlance 1.6 9 0.04 8 X
*one beach seine haul = one unit of effort
Table 8. Catch-per-unit-effort of the ten most abundant species caught in the lower Bayby beach seine compared with catch-per-unit-effort of the ten most abundant species inthe trawl during 1999.
Species Caught inBeach Seine
Catch-per-unit-effort*
Species Caught inTrawl
Catch-per-unit-effort**
Surf Smelt 34.5 Pacific Herring 13.9Pacific Herring 24.9 Shiner Perch 7.3English Sole 18.4 English Sole 2.6Chum Salmon 10.9 Lingcod 2.3Pacific Staghorn Sculpin 10.3 Pacific Sanddab 2.0Pacific Sandlance 4.9 Pacific Staghorn Sculpin 1.9Chinook Salmon 4.7 Greenling sp. 0.4Tidepool Sculpin 0.9 Saddleback Gunnel 0.3Shiner Perch 0.7 Surf Smelt 0.3Cutthroat Trout 0.5 Buffalo Sculpin 0.2
*one unit of effort = one beach seine haul**one unit of trawl effort = one 5-minute trawl

36
Use of the Estuary by Anadromous Salmonids
All five species of anadromous salmonids known to occur in the Tillamook Baywatershed were collected during this study. However, only chum salmon and chinooksalmon were caught in any abundance. The following is a description of our findings foreach of the five salmonid species.
Chum Salmon
Today, the Bay supports much smaller runs of chum salmon than it did historically andindex counts of adult spawners indicate that interannual variability in run size is large(ODFW spawning count data, 1997). The lower reaches and lower tributaries of theMiami, Kilchis and Wilson Rivers are the primary spawning areas for chum salmon inthe Tillamook Bay watershed.
Studies of estuarine residency of chum salmon in other estuaries indicate that chumsalmon fry typically disperse several kilometers from the river mouth upon entry into theestuary, favoring the shoreline and eelgrass beds (Healey 1982). The first habitatoccupied includes creeks and sloughs high in the delta area, but other intertidal areas arequickly colonized. The fry have been observed to congregate in the upper intertidal at thefringe of marshes and to penetrate deep into the marshes along tidal creeks. At low tide,the fry retreat into tidal creeks and delta channels. Simenstad and Salo (1982) found thatresidency time in Puget Sound estuaries is variable (range 4-32 days) with the majoritystaying about 30 days.
The first chum salmon fry captured in this study were caught March 28, 1999 in a fykenet set in the marsh at the upper end of the Bay. Over 300 fry were caught in one of thetwo functioning fyke nets set on that date. Relatively small numbers of chum salmon frywere captured in the marsh on April 13 (60 fry) and on April 24 (5 fry). On the 13th
four of six fyke nets contained fry and on the 24th only one of the six fyke nets containedfry. None were captured in the marsh during subsequent fyke net sampling in Maythrough July. When beach seining was initiated in late April, the largest concentration ofchum salmon fry was found at the lower bay sampling sites. The decline seen in themarsh at the upper end of the Bay and the relatively high numbers caught in the lowerbay in late April suggests a steady emigration from the upper estuary to the ocean.
Catch-per-unit-effort of chum salmon fry for beach seine is shown in Figure 11 alongwith ODFW's mean beach seine catch-per-unit-effort of chum for the same period in1974-76. The ODFW catch-per-unit-effort data are not directly comparable due todifferences in the seines discussed above but were used to compare trends in abundancethrough time. During this study, chum salmon fry were most abundant in the beach seinecatch in late April. During the mid-1970s, the first chum salmon fry were captured inFebruary and their numbers gradually increased to a peak in May. Chum salmon werepresent in the beach seine catch in both studies into July but numbers were very low bylate June, indicating that most of the fish had left the estuary by that time.

37
Figure 11. Beach seine catch-per-unit-effort for chum salmon fry caught from Aprilthrough July 1999 compared with the mean beach seine catch-per-unit-effort for the sametime interval in ODFW’s 1974-76 study (1974-76 data from Bottom and Forsberg 1978).
During 1998 and 1999, ODFW operated a screw trap for downstream migrating juvenilesalmonids on the Little North Fork Wilson River. The out-migration of chum salmon fryfrom the Little North Fork peaked in the second and third week of April in 1998 and1999. Assuming that the Little North Fork Wilson River out-migration timing wasrepresentative of the overall chum salmon out-migration timing for the watershed, peakabundance in the estuary should have occurred in late April. This is consistent with theresults of the 1999 beach seine catch data.
Chum salmon length frequency distributions for the 1999 beach seine and fyke netcatches (Figure 12) indicate that the fry probably enter the estuary at between 40 and 45mm. By the end of April most of the fry were larger than 45 mm, suggesting that thepeak of the downstream migration period was over. By late May, the majority of the frywere in the 60-70 mm size range. However, there were still small numbers of fry in the40-50 mm size range present, indicating that some recruitment to the Bay probablycontinued through May. By late June, most of the fry had moved out of the Bay; thosethat remained grew substantially between the end of May to the end of June. As shownin Figure 13, the mean length of chum salmon increased from 46 mm in late March to 87mm by the end of June.
0
5
10
15
20
25
30
35
APR MAY JUN JUL
CP
E
1974-751999
CHUM SALMON
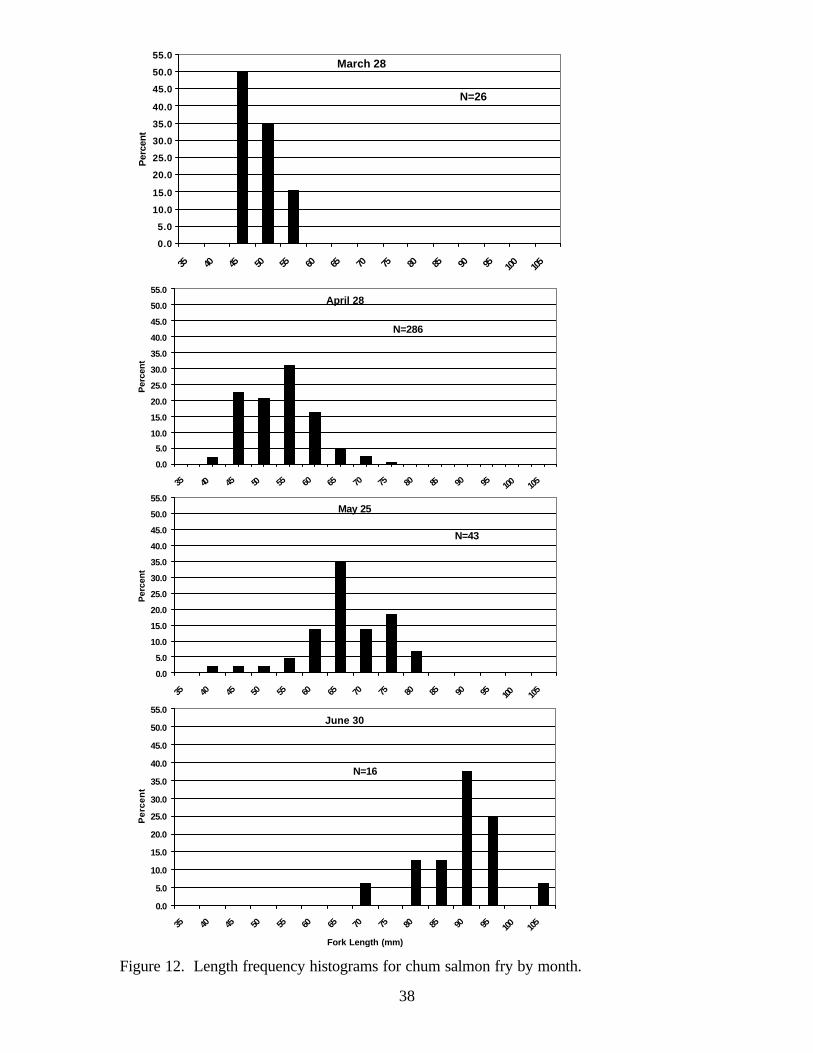
38
Figure 12. Length frequency histograms for chum salmon fry by month.
March 28
0.0
5.0
10.0
15.0
20.0
25.0
30.0
35.0
40.0
45.0
50.0
55.0
35 40 45 50 55 60 65 70 75 80 85 90 95 100 105
Per
cent
N=26
April 28
0.0
5.0
10.0
15.0
20.0
25.0
30.0
35.0
40.0
45.0
50.0
55.0
35 40 45 50 55 60 65 70 75 80 85 90 95 100 105
Per
cent
N=286
May 25
0.0
5.0
10.0
15.0
20.0
25.0
30.0
35.0
40.0
45.0
50.0
55.0
35 40 45 50 55 60 65 70 75 80 85 90 95 100 105
Per
cent
N=43
June 30
0.0
5.0
10.0
15.0
20.0
25.0
30.0
35.0
40.0
45.0
50.0
55.0
35 40 45 50 55 60 65 70 75 80 85 90 95 100 105
Fork Length (mm)
Per
cen
t
N=16

39
Figure 13. Mean lengths (horizontal bar in box) of chum salmon fry collected in beachseine samples between March 28 and June 30, 1999 (numbers on x-axis represent the fivesampling periods between March 28 and June 30).
As part of our routine sampling procedure, we examined all fish captured for fin clips.During the April 1999 sampling period, we found that five of the 462 chum salmoncaught by beach seining had upper caudal fin clips. These clips were made by ODFW atthe screw trap on the Little North Fork Wilson River. Beginning in March, they routinelyclipped the upper caudal fins of a subset of the fry captured. The marked fish were thenreleased upstream of the screw trap. The ratio of marked to unmarked fish in the screwtrap catch was used to estimate trapping efficiency for an out-migrant populationestimate. All of the marked fish were allowed to continue their migration to the estuaryand ocean. Since all of the recaptured fish were caught in the lower region of the Bay,we assumed that they were well distributed among fry for other spawning areas withinthe watershed.
We used the ratio of fin clipped fry in our April catch and in ODFW's estimatedoutmigrant population estimate the contribution of the Little North Fork Wilson River tothe total population of fry in the Bay in late April. For this estimate, we assumed thatmortality on fin-clipped and non-fin clipped fry was equal. We believe this is areasonable assumption. Based on weekly estimates of the number of out-migrating fry,ODFW calculated that 38,220 fry (64% of the total out-migration) had passed the screwtrap by 18th of April (Dalton, T. pers com. October 1999). We estimated that travel time

40
from the trap (located 9.1 River Miles from the mouth of the Wilson River) to the lowerestuary was approximately 10 days. Therefore, the fin-clipped fish captured in our beachseine would have been marked at the trap between early March and the 18th of April. Ofthe 38,220 fry passing the trap, 760 fry had been marked with upper caudal clips. Toestimate the total number of Little North Fork Wilson River fry expected in our beachseine catch, we used the formula N = PRM-1 where
N = Number of Little North Fork Wilson River chum fry in beach seine catchP = Estimated number of chum fry passing the screw trap by April 18R = Number of fin-clipped chum fry recovered in the April beach seiningM = Number of chum fry marked at the screw trap by April 18
The resulting estimate for the number of Little North Fork Wilson River chum fry in thebeach seine catch was 251 fry or about 54 percent of the total April beach seine catch.Assuming that the ratio of marked to unmarked fish in the beach seine catch isrepresentative of that ratio in the total population, then this suggests that a very largeproportion (roughly 54 percent) of the chum fry in the Bay during late April wereproduced in the Little North Fork Wilson River.
Chinook Salmon
Both spring and fall races of chinook salmon are present in the Tillamook Bay watershed.Mature chinook (2 to 6 years of age) return to all five of the major sub-basins from earlySeptember through mid-February. Peak entry into the rivers occurs in mid-October. Fallchinook spawn from October to January and spring chinook spawn for early Septemberto early October. Although hatchery fish contribute to the fall runs, it is believed thatmost fall chinook are produced from naturally spawning fish (Nicholas and Hankin1988). Spring salmon runs are heavily supplemented by hatchery fish produced at theTrask River and Whisky Creek hatcheries. The fall chinook runs have remained healthyand strong over the past 25 years. The spring chinook runs are considered to bedepressed compared to historic levels but have remained relatively stable (Nicholas andHankin 1988).
Because of their many juvenile life history patterns, chinook salmon have the most variedpattern of estuary utilization. Some chinook migrate seaward as fry. These fish havebeen observed in other estuaries to colonize the estuary in much the same way as chumsalmon fry, first occupying tidal creeks high in the marsh area and later the outer estuary.(Healey 1982). Unlike chum, chinook salmon fry don't appear to occupy high salinitynursery areas. Most fall chinook juveniles in Oregon estuaries appear to enter asunderyearling smolts in May and June (Reimers 1973). Bottom and Forsberg (1978) andForsberg et al. (1977) reported juvenile chinook salmon present in Tillamook Bay fromJune through November with a few collected in January through March and in May.Yearling chinook (mostly from the spring run) are thought to move directly into theneritic habitat without much utilization of salt marsh or other shallow habitat (Simenstadand Salo 1982).
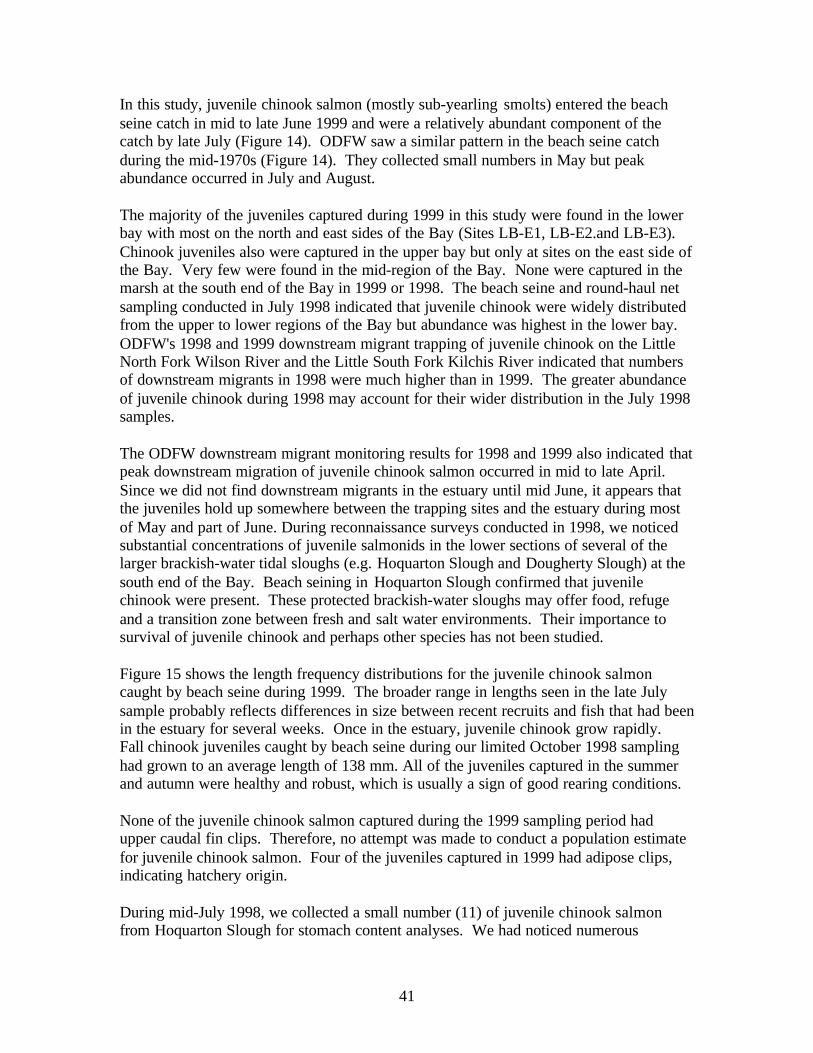
41
In this study, juvenile chinook salmon (mostly sub-yearling smolts) entered the beachseine catch in mid to late June 1999 and were a relatively abundant component of thecatch by late July (Figure 14). ODFW saw a similar pattern in the beach seine catchduring the mid-1970s (Figure 14). They collected small numbers in May but peakabundance occurred in July and August.
The majority of the juveniles captured during 1999 in this study were found in the lowerbay with most on the north and east sides of the Bay (Sites LB-E1, LB-E2.and LB-E3).Chinook juveniles also were captured in the upper bay but only at sites on the east side ofthe Bay. Very few were found in the mid-region of the Bay. None were captured in themarsh at the south end of the Bay in 1999 or 1998. The beach seine and round-haul netsampling conducted in July 1998 indicated that juvenile chinook were widely distributedfrom the upper to lower regions of the Bay but abundance was highest in the lower bay.ODFW's 1998 and 1999 downstream migrant trapping of juvenile chinook on the LittleNorth Fork Wilson River and the Little South Fork Kilchis River indicated that numbersof downstream migrants in 1998 were much higher than in 1999. The greater abundanceof juvenile chinook during 1998 may account for their wider distribution in the July 1998samples.
The ODFW downstream migrant monitoring results for 1998 and 1999 also indicated thatpeak downstream migration of juvenile chinook salmon occurred in mid to late April.Since we did not find downstream migrants in the estuary until mid June, it appears thatthe juveniles hold up somewhere between the trapping sites and the estuary during mostof May and part of June. During reconnaissance surveys conducted in 1998, we noticedsubstantial concentrations of juvenile salmonids in the lower sections of several of thelarger brackish-water tidal sloughs (e.g. Hoquarton Slough and Dougherty Slough) at thesouth end of the Bay. Beach seining in Hoquarton Slough confirmed that juvenilechinook were present. These protected brackish-water sloughs may offer food, refugeand a transition zone between fresh and salt water environments. Their importance tosurvival of juvenile chinook and perhaps other species has not been studied.
Figure 15 shows the length frequency distributions for the juvenile chinook salmoncaught by beach seine during 1999. The broader range in lengths seen in the late Julysample probably reflects differences in size between recent recruits and fish that had beenin the estuary for several weeks. Once in the estuary, juvenile chinook grow rapidly.Fall chinook juveniles caught by beach seine during our limited October 1998 samplinghad grown to an average length of 138 mm. All of the juveniles captured in the summerand autumn were healthy and robust, which is usually a sign of good rearing conditions.
None of the juvenile chinook salmon captured during the 1999 sampling period hadupper caudal fin clips. Therefore, no attempt was made to conduct a population estimatefor juvenile chinook salmon. Four of the juveniles captured in 1999 had adipose clips,indicating hatchery origin.
During mid-July 1998, we collected a small number (11) of juvenile chinook salmonfrom Hoquarton Slough for stomach content analyses. We had noticed numerous

42
Figure 14. Beach seine catch-per-unit-effort for juvenile chinook salmon caught fromApril through July 1999 compared with the mean beach seine catch-per-unit-effort for thesame time interval in ODFW’s 1974-76 study (1974-76 data from Bottom and Forsberg1978).
Chinook Salmon
0
10
20
30
40
50
60
APR MAY JUN JUL
CP
E
1974-751999

43
Figure 15. Length frequency histograms for juvenile chinook salmon captured in beachseines during June and July 1999.
0.0
5.0
10.0
15.0
20.0
25.0
50 60 70 80 90 100
110 120
130 140 150
160
170
Per
cen
t
June
N= 59
0.0
5.0
10.0
15.0
20.0
25.0
50 60 70 80 90 100 110
120 130
140
150 160
170
Fork Length (mm)
Per
cen
t
July
N=109

44
juvenile salmonids feeding on the surface of the slough at the upper end of the Bay.Eleven juveniles were collected for stomach content analysis. The majority of the foodorganisms in the stomachs of the juvenile chinook salmon from Hoquarton Slough(Table 9) were organisms that would be expected to be associated with the surface film(e.g., adult Diptera, adult Hymenoptera, other adult insects and spiders). Aquatic insectlarvae and Isopods comprised about 24 percent of the organisms consumed. Food habitstudies conducted by ODFW during the mid-1970s fish survey (Bottom and Forsberg1978) indicated that insects were by far the major food item consumed by chinookjuveniles collected from the Bay throughout the year.
During the 1999 sampling period, several samples of chinook and chum salmon juvenileswere collected at various locations in Tillamook Bay for stomach content analyses.These fish were preserved and will be archived until they can be analyzed in the future.
Coho Salmon
Adult coho salmon enter Tillamook Bay from October through December. The adultsmay hold in the upper tidal portion of the Bay until autumn freshets increase flow intributary streams and rivers. Spawning occurs in all five sub-basins. Most spawningoccurs in small to medium-size tributaries in areas with low to moderate gradient. Peakspawning occurs in November. Juveniles generally spend a year in fresh water beforemigrating to the ocean, although out-migration as fry has been documented (Dalton perscom. October 1999). Most of the yearling smolts appear to move quickly through theestuarine environment to the ocean. However, some estuarine rearing is probable basedon the capture of small numbers of juveniles over extended periods (Bottom and Forsberg1978). Very little is known about coho fry use of the estuarine environment. Recentstudies in the South Slough of Coos Bay, Oregon (Sadro 1999) and the Salmon River,Oregon estuary (Bottom D. pers com. July 1999) indicate that coho fry in those systemsutilize marsh and channel habitat where salinities can exceed 20 ppt. Sadro (1999)suggested that sufficient growth may occur in the estuarine environment that some of thesub-yearling fish could become large enough to enter the ocean with yearling smolts.
In this study, juvenile coho salmon were found in the estuary from early May throughmid-June 1999. A total of 75 juveniles were collected. The majority of these fish werecaught at upper bay sampling sites UB-E1, UB-E2 and UB-E3 near the mouths of theKilchis, Wilson and Trask Rivers. All but one of the coho juveniles caught in the lowerbay were captured at Hobsonville Point near the entrance of the Miami River. One smallcoho fry was captured at fyke net site F-3 in the marsh at the south end of the Bay.Salinities at time of capture ranged from 9.3 to18.2 ppt in the lower bay and from 0.0 to5.4 ppt in the upper bay.
The two ODFW out-migrant monitoring sites in the watershed, indicated that the peakout-migration of coho salmon smolts (age 1+) occurred during May and the peak in fryout-migration occurred in March to early April. The length frequency distribution of the1999 juvenile coho catch (Figure 16) indicates the presence of at least two age
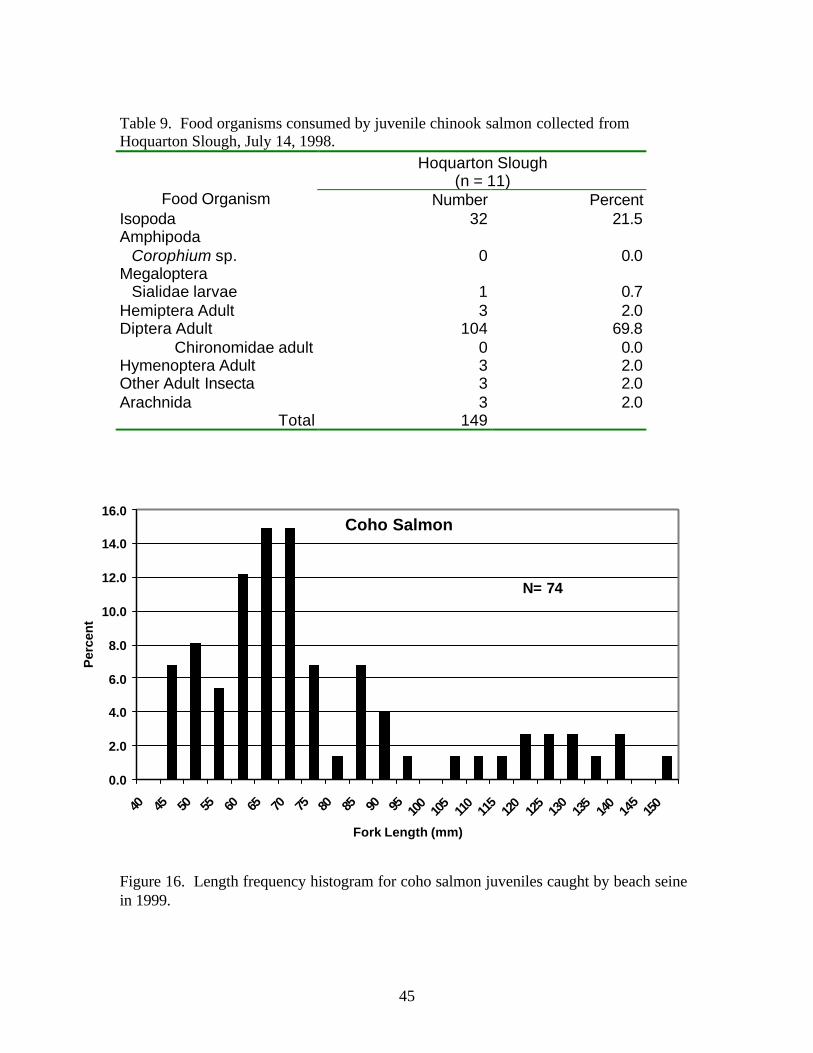
45
Table 9. Food organisms consumed by juvenile chinook salmon collected fromHoquarton Slough, July 14, 1998.
Hoquarton Slough(n = 11)
Food Organism Number PercentIsopoda 32 21.5Amphipoda Corophium sp. 0 0.0Megaloptera Sialidae larvae 1 0.7Hemiptera Adult 3 2.0Diptera Adult 104 69.8
Chironomidae adult 0 0.0Hymenoptera Adult 3 2.0Other Adult Insecta 3 2.0Arachnida 3 2.0
Total 149
Figure 16. Length frequency histogram for coho salmon juveniles caught by beach seinein 1999.
Coho Salmon
0.0
2.0
4.0
6.0
8.0
10.0
12.0
14.0
16.0
40 45 50 55 60 65 70 75 80 85 90 95 100
105
110
115
120
125
130
135
140
145
150
Fork Length (mm)
Per
cen
t
N= 74
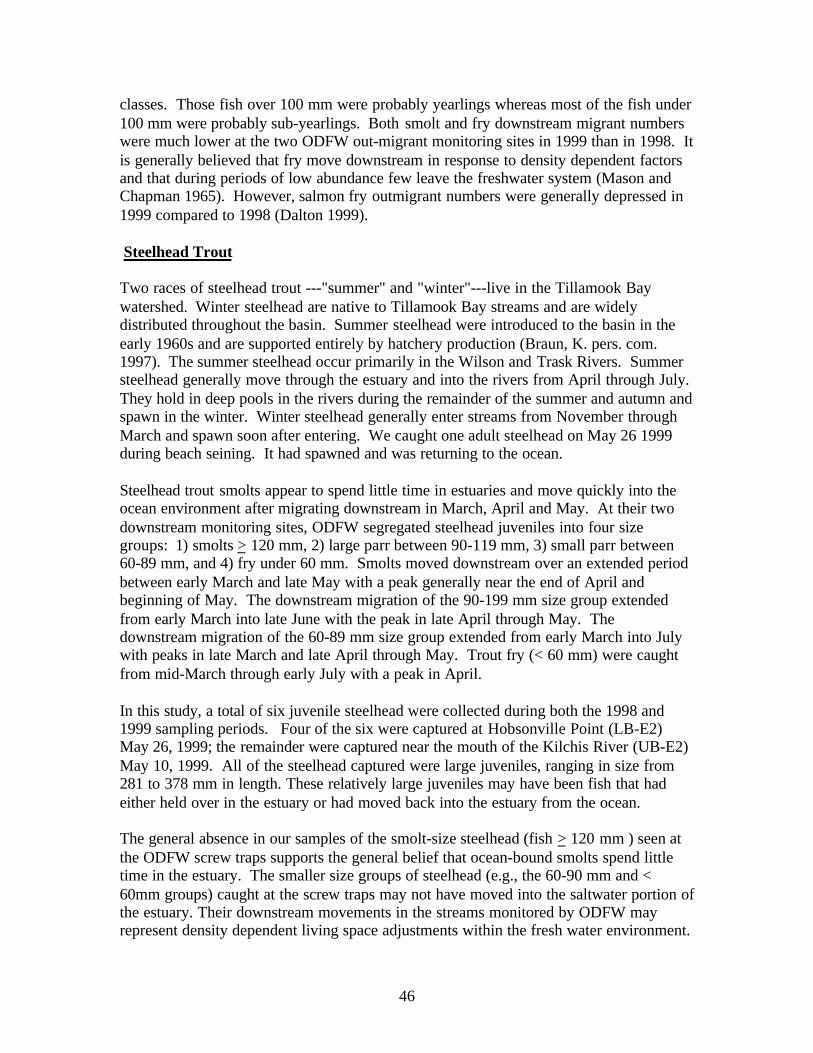
46
classes. Those fish over 100 mm were probably yearlings whereas most of the fish under100 mm were probably sub-yearlings. Both smolt and fry downstream migrant numberswere much lower at the two ODFW out-migrant monitoring sites in 1999 than in 1998. Itis generally believed that fry move downstream in response to density dependent factorsand that during periods of low abundance few leave the freshwater system (Mason andChapman 1965). However, salmon fry outmigrant numbers were generally depressed in1999 compared to 1998 (Dalton 1999).
Steelhead Trout
Two races of steelhead trout ---"summer" and "winter"---live in the Tillamook Baywatershed. Winter steelhead are native to Tillamook Bay streams and are widelydistributed throughout the basin. Summer steelhead were introduced to the basin in theearly 1960s and are supported entirely by hatchery production (Braun, K. pers. com.1997). The summer steelhead occur primarily in the Wilson and Trask Rivers. Summersteelhead generally move through the estuary and into the rivers from April through July.They hold in deep pools in the rivers during the remainder of the summer and autumn andspawn in the winter. Winter steelhead generally enter streams from November throughMarch and spawn soon after entering. We caught one adult steelhead on May 26 1999during beach seining. It had spawned and was returning to the ocean.
Steelhead trout smolts appear to spend little time in estuaries and move quickly into theocean environment after migrating downstream in March, April and May. At their twodownstream monitoring sites, ODFW segregated steelhead juveniles into four sizegroups: 1) smolts > 120 mm, 2) large parr between 90-119 mm, 3) small parr between60-89 mm, and 4) fry under 60 mm. Smolts moved downstream over an extended periodbetween early March and late May with a peak generally near the end of April andbeginning of May. The downstream migration of the 90-199 mm size group extendedfrom early March into late June with the peak in late April through May. Thedownstream migration of the 60-89 mm size group extended from early March into Julywith peaks in late March and late April through May. Trout fry (< 60 mm) were caughtfrom mid-March through early July with a peak in April.
In this study, a total of six juvenile steelhead were collected during both the 1998 and1999 sampling periods. Four of the six were captured at Hobsonville Point (LB-E2)May 26, 1999; the remainder were captured near the mouth of the Kilchis River (UB-E2)May 10, 1999. All of the steelhead captured were large juveniles, ranging in size from281 to 378 mm in length. These relatively large juveniles may have been fish that hadeither held over in the estuary or had moved back into the estuary from the ocean.
The general absence in our samples of the smolt-size steelhead (fish > 120 mm ) seen atthe ODFW screw traps supports the general belief that ocean-bound smolts spend littletime in the estuary. The smaller size groups of steelhead (e.g., the 60-90 mm and <60mm groups) caught at the screw traps may not have moved into the saltwater portion ofthe estuary. Their downstream movements in the streams monitored by ODFW mayrepresent density dependent living space adjustments within the fresh water environment.

47
Sea-Run Cutthroat Trout
Adult sea-run cutthroat trout enter Pacific Northwest estuaries during late summer andearly fall before moving upstream to spawning grounds. Spawning occurs in smallheadwater streams during late winter and early spring. The majority of smolts are 2 to 4years of age and enter the estuarine environment during April and May (Nicholas andHankin 1988). ODFW's catch results for the two out-migrant monitoring sites in theTillamook Bay watershed indicated that cutthroat trout smolts migrated downstream fromearly March through mid June with a peak in May through June.
Little is known about the estuarine residency of sea-run cutthroat trout. Juveniles havebeen captured in off-shore waters from May through August (Pearcy et al. 1990),suggesting that at least some move relatively quickly into the ocean after movingdownstream from fresh water.
We captured a total of 37 sea-run cutthroat trout during beach seining in 1999. Only onewas collected during the 1998 sampling. Most of the fish captured appeared to be in smallschools of similar size fish. About half were caught at Hobsonville Point (sites LB-E1and LB-E2) in the lower bay; the remainder were caught near the mouth of the KilchisRiver (site UB-E2) in the upper bay. Twenty five of the sea-run cutthroat trout werecaught in May, four were caught in June and eight were caught in late July. During themid-1970s, ODFW caught 78 sea-run cutthroat trout over a 3-year period (Bottom andForsberg 1978). ODFW's catch occurred between April and October with highestnumbers found from May through August. Results of the two studies indicate that atleast a portion of the sea-run cutthroat trout use the Bay for rearing throughout the springand summer months.
Based on the length frequency distribution of the sea-run cutthroat trout captured in 1999(Figure 17), it appears that there were several year classes of fish represented in the catch.Some of the larger trout may have been spawned-out adults returning from fresh water.All of the fish appeared healthy and in robust condition.
Use of the Estuary by Non-Salmonid Species
The non-salmonid component of the Tillamook Bay fish community, as in other estuarieson the Pacific Coast, is composed primarily of marine species. The catch was dominatedby a small number of euryhaline marine fishes. Shiner perch, Pacific staghorn sculpin,surf smelt, Pacific herring and starry flounder were among the ten most abundant speciesin the present study and were among the ten most abundant species reported from CoosBay (Cummings and Schwartz 1971), Neatharts Bay (Stout 1976), Salmon River(Mullen, 1978), Yaquina Bay (Pearcy and Myers 1974), and Umpqua River estuary(Johnson et al. 1986).
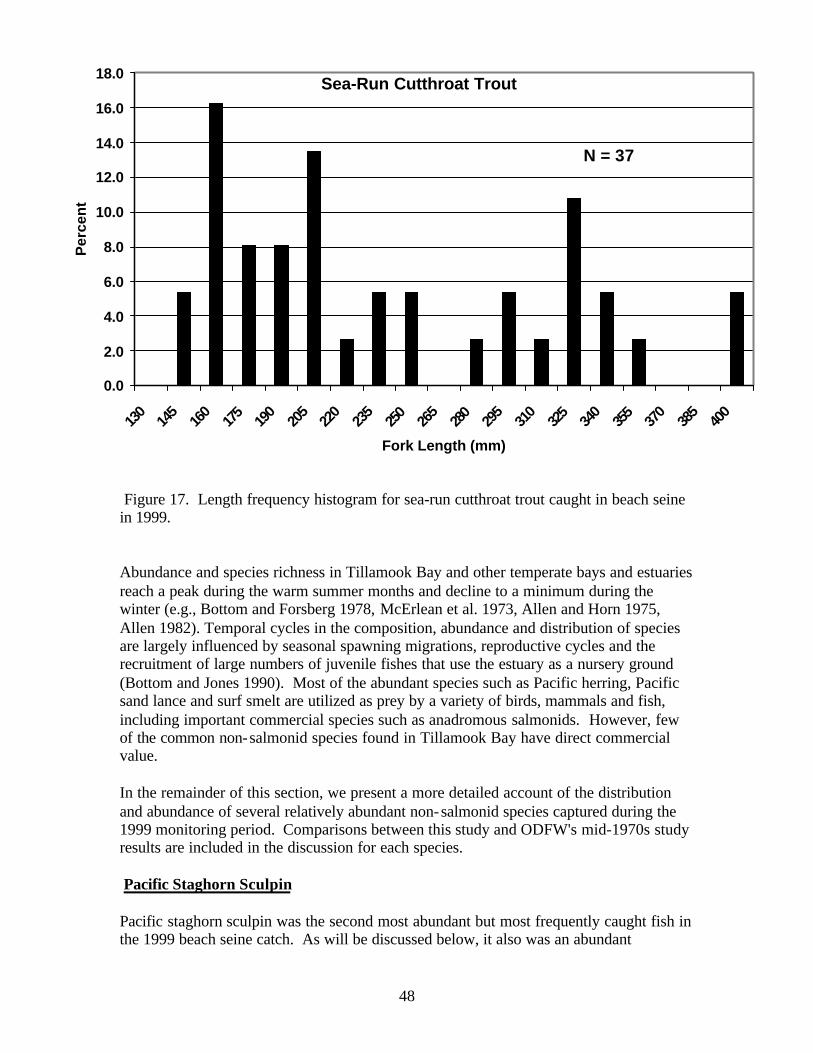
48
Figure 17. Length frequency histogram for sea-run cutthroat trout caught in beach seinein 1999.
Abundance and species richness in Tillamook Bay and other temperate bays and estuariesreach a peak during the warm summer months and decline to a minimum during thewinter (e.g., Bottom and Forsberg 1978, McErlean et al. 1973, Allen and Horn 1975,Allen 1982). Temporal cycles in the composition, abundance and distribution of speciesare largely influenced by seasonal spawning migrations, reproductive cycles and therecruitment of large numbers of juvenile fishes that use the estuary as a nursery ground(Bottom and Jones 1990). Most of the abundant species such as Pacific herring, Pacificsand lance and surf smelt are utilized as prey by a variety of birds, mammals and fish,including important commercial species such as anadromous salmonids. However, fewof the common non-salmonid species found in Tillamook Bay have direct commercialvalue.
In the remainder of this section, we present a more detailed account of the distributionand abundance of several relatively abundant non-salmonid species captured during the1999 monitoring period. Comparisons between this study and ODFW's mid-1970s studyresults are included in the discussion for each species.
Pacific Staghorn Sculpin
Pacific staghorn sculpin was the second most abundant but most frequently caught fish inthe 1999 beach seine catch. As will be discussed below, it also was an abundant
Sea-Run Cutthroat Trout
0.0
2.0
4.0
6.0
8.0
10.0
12.0
14.0
16.0
18.0
130
145
160
175
190
205
220
235
250
265
280
295
310
325
340
355
370
385
400
Fork Length (mm)
Per
cen
t
N = 37

49
component of the fyke net catch from the salt marsh habitat. Pacific staghorn sculpin is aeuryhaline marine species that uses the estuary for spawning, rearing and feeding.Spawning of Pacific staghorn sculpin probably occurs over an extended period of time.Forsberg et al. (1977) believed that spawning probably occurred in the late fall since thefirst juveniles appeared in December at a length of 20 to 45 mm. We found substantialnumbers of 20-40 mm juveniles in April and May. The eggs of Pacific staghorn sculpinare demersal and adhesive. Larvae are planktonic (marine and estuarine), and juvenilesand adults are demersal (Emmett et al. 1991). Pacific staghorn sculpin have no economicvalue but are an important predator on ghost shrimp, Callianassa californiensis, (Posey1986) and are eaten by various fishes, birds and mammals.
Although Pacific staghorn sculpin were widely distributed throughout Tillamook Bay, theshallow, sandy tidal-flat habitat on the west side of the mid-region of the Bay appeared tobe the most productive area during the sampling period. Bottom and Forsberg (1978)found that Pacific staghorn sculpin were more abundant on tide flats than channels duringtheir 1974-76 sampling of the Bay.
Beach seine catch-per-unit-effort for Pacific staghorn sculpin peaked in May during our1999 study period (Figure 18). ODFW showed a mid-summer peak in abundance ofPacific staghorn sculpin in their beach seine catch-per-unit-effort data (Forsberg et al.1977). The relatively high catch-per-unit-effort during April, May and June in this studymay reflect differences in sampling efficiency on small Pacific staghorn sculpin. Thelength frequency distribution of Pacific staghorn sculpin in the 1999 beach seine catch(Figure 19) indicates that small juveniles dominated the catch through June. Larger adultPacific staghorn sculpin entered the catch in substantial numbers in July. Bottom andForsberg (1978) noted that although some adults stay in the Bay year round, many adultsentered the Bay in July and moved back into the ocean by early December.
Surf Smelt
Surf smelt was the most abundant species in the 1999 beach seine catch. Surf smelt areconsidered a nearshore coastal species, which does not typically spawn in estuaries butuses them for feeding and rearing. The eggs are benthic. Larvae, juveniles, and adultsare pelagic but remain principally inshore (Emmett et al. 1991).Surf smelt are not commercially important but are preyed upon by numerous birds,mammals and fishes (Emmett et al. 1991).
Although surf smelt were caught in all three regions of the Bay in this study, they weremost frequently found at lower bay stations. The largest catches occurred in the upperbay (site UB-W2) in early May and in the lower bay (LB-W3) in mid June. DuringODFW's mid-1970s study, surf smelt spatial distribution showed no discernable trendover an annual period (Bottom and Forsberg 1978). However, their catch-per-unit-effortdata indicated that surf smelt were most abundant along shoreline areas in the lower bay.In this study catch-per-unit-effort for beach seine was highest during May but in theODFW study it was highest in June and remained relatively high in July (Figure 20).

50
Figure 18. Beach seine catch-per-unit-effort for Pacific staghorn sculpin caught fromApril through July 1999 compared with the mean beach seine catch-per-unit-effort for thesame time interval in ODFW’s 1974-76 study (1974-76 data from Bottom and Forsberg1978).
0
5
10
15
20
25
30
APR MAY JUN JUL
CP
E
1974-751999
PACIFIC STAGHORN SCULPIN

51
Figure 19. Length frequency histograms for Pacific staghorn sculpin caught in beachseine April through July 1999.
April
0.0
2.0
4.0
6.0
8.0
10.0
12.0
14.0
16.0
18.0
20.0
22.0
24.0
25 35 45 55 65 75 85 95 105
115 125 135
145 155
Per
cen
t
N = 165
May
0.0
2.0
4.0
6.0
8.0
10.0
12.0
14.0
16.0
18.0
20.0
22.0
24.0
25 35 45 55 65 75 85 95 105
115
125
135
145
155
Per
cen
t
N = 454
June
0.0
2.0
4.0
6.0
8.0
10.0
12.0
14.0
16.0
18.0
20.0
22.0
24.0
25 35 45 55 65 75 85 95 105 115
125 135
145 155
Per
cen
t
N = 398
July
0.0
2.0
4.0
6.0
8.0
10.0
12.0
14.0
16.0
18.0
20.0
22.0
24.0
25 35 45 55 65 75 85 95 105 115
125 135
145 155
Tail Length (mm)
Per
cen
t N = 151

52
Figure 20. Beach seine catch-per-unit-effort for surf smelt caught from April throughJuly 1999 compared with the mean beach seine catch-per-unit-effort for the same timeinterval in ODFW’s 1974-76 study (1974-76 data from Bottom and Forsberg 1978).
0
20
40
60
80
100
120
140
160
APR MAY JUN JUL
CP
E
1974-751999
SURF SMELT

53
Surf smelt often occur in large schools. Chance occurrence of a large school at asampling site has a large influence on catch-per-unit-effort for a sampling period. Thismight explain the differences in the pattern of abundance seen between this study andODFW's study. Only a few large catches were responsible for the high numbers in Juneand July during ODFW's mid-1970s study.
The 1999 length frequency distributions over the April-July sampling period indicate thatjuveniles in the 50-60 mm size group were recruited to the population from April throughMay (Figure 21). By mid to late June, most of the recruitment had stopped. The mode ofthe length frequency distribution shifted from between 50-60 mm in April and May to 80-90 mm in July, indicating substantial growth in the cohort. A few adult fish werecaptured in addition to the juveniles in late July.
Shiner Perch
Shiner perch was the third most abundant species in our 1999 beach seine catch. Thisspecies occurs primarily in near-shore shallow marine, bay and estuarine habitats. It is alive-bearer; eggs are retained within the female and juveniles are born fully developed.Juveniles and adults are primarily neritic and pelagic (Garrison and Miller 1982). Theshiner perch is a small, yet abundant species in many estuaries and bays and is preyedupon by numerous birds, mammals and fishes (Wydoski and Whitney 1979).
Shiner perch were first caught in late May during our 1999 study period and were presentin the catch through July. Although they occurred within all three regions of the Bay,they were caught at only a few sampling sites within each region. In the lower Bay, theywere collected only at sites LB-E1, LB-E2 and LB-E3. In the mid-region, they werecaptured only at MB-E3 and MB-W1, and in the upper bay only at UB-E1, UB-E2 andUB-W3. The highest catch occurred at UB-E3 in late July and was dominated byjuveniles. The beach seine catch-per-unit-effort showed a gradual increase in abundancefrom May through July (Figure 22). The ODFW beach seine mean catch-per-unit-effortfor the same time interval showed a much sharper increase in abundance from June toJuly (Figure 22). Increases in the number of juvenile shiner perch were responsible forthe July increases in both studies.
The length frequency distributions for the beach seine catches (Figure 23) indicate thatthe catch in late May was dominated by adult fish over 90 mm in length. There wereprobably at least two year-classes of adults present in May. Juvenile shiner perch enteredthe catch in June and were the largest component of the catch by the end of July.
Pacific Herring
Pacific herring was the fourth most abundant species in the 1999 beach seine catch.Pacific herring are found in most Pacific coast estuaries north of San Diego, Californiabut occurs primarily north of Point Conception, California. The Pacific herring does notmake extensive coastal migrations, but moves onshore and offshore in schools as it
54
Figure 21. Length frequency histograms for surf smelt collected by beach seine Aprilthrough July 1999.
0.0
5.0
10.0
15.0
20.0
25.0
30.0
40 45 50 55 60 65 70 75 80 85 90 95 100 105 110 115 120 125 130 135
Per
cent
May
N=156
0.0
5.0
10.0
15.0
20.0
25.0
30.0
40 45 50 55 60 65 70 75 80 85 90 95 100 105 110 115 120 125 130 135
Per
cent
June
N=181
0.0
5.0
10.0
15.0
20.0
25.0
30.0
40 45 50 55 60 65 70 75 80 85 90 95 100 105 110 115 120 125 130 135
Fork Length (mm)
Per
cent
July
N=61

55
Figure 22. Beach seine catch-per-unit-effort for shiner perch caught from April throughJuly 1999 compared with the mean beach seine catch-per-unit-effort for the same timeinterval in ODFW’s 1974-76 study (1974-76 data from Bottom and Forsberg 1978).
0
50
100
150
200
250
300
350
APR MAY JUN JUL
CP
E
1974-751999
SHINER PERCH

56
Figure 23. Length frequency histograms for shiner perch caught in beach seine duringMay, June and July1999.
0.0
5.0
10.0
15.0
20.0
25.0
30.0
35.0
40.0
35 45 55 65 75 85 95 105
115
125
135
145
Per
cen
t
June
N=217
0.0
5.0
10.0
15.0
20.0
25.0
30.0
35.0
40.0
35 45 55 65 75 85 95 105
115
125
135
145
Fork Length (mm)
Per
cen
t
July
N=196
0.0
5.0
10.0
15.0
20.0
25.0
30.0
35.0
40.0
35 45 55 65 75 85 95 105
115 125
135 145
Per
cen
t
May
N=52
57
intertidal (3.7 m above mean lower low water) and subtidal areas (to 20 m depth), butnormally occur in +1 to -2 m depth. Larvae and juveniles are neritic and adults arePacific herring occurred in the beach seine catch from May 30 through late July 1999.On May 30, juveniles were collected at LB-E2 in the lower bay. None were found at anyof the other sites in May. The distribution of the catch in June and July was clumped attwo stations in the lower bay (LB-E2 and LB-W1) and two in the upper bay (UB-E2 andUB-E3). Pacific herring was not found at any of the other beach seine sites. Thisdistribution pattern probably reflects both a preference for certain areas in the Bay andthe relatively low probability of encountering individual schools of Pacific herring.
Beach seine catch-per-unit-effort increased from late May to June then stayed about thesame in July (Figure 24). This pattern contrasts with the sharp increase in catch-per-unit-effort shown in ODFW's mid-1970s beach seine catch data (Figure 24). Whether thesedifferences reflect actual differences in abundance between the two studies is difficult toknown since catch-per-unit-effort for schooling species is typically highly variable.
The length frequency distribution for the May through July beach seine samples indicatesthat the catch was made up entirely of juvenile fish (Figure 25). Considerable growthoccurred during the interval May through July as indicated by the increasing length of themodal length class.
English Sole
English sole was the fifth most abundant species in the 1999 beach seine catch. Englishsole spawn in the ocean during September-April off Oregon (Kruse and Tyler 1983). Theearly larvae are pelagic, but later in their development they move to the benthos in bothcoastal and estuarine areas, and assume a demersal existence for the remainder of theirlife (Stevens and Armstrong 1984, Krygier and Pearcy 1986). Juvenile English sole useestuaries almost exclusively for rearing. Most juvenile English sole emigrate fromestuaries and complete their life cycle in the offshore coastal waters. Emigration beginswhen they reach a length of 75-80 mm (Gunderson et al. 1990). Juvenile English sole arepreyed on by variety of birds, mammals and fish; the adults are a commercially valuablefood fish.
Juvenile English sole were present throughout the 1999 monitoring period. Juvenileswere captured only at lower bay sites in April and early May. By late May, they werealso present at several mid-bay and upper bay sites. The largest numbers were capturedon shallow sandy beach habitat on the west side of the Bay. The largest single catch (285juveniles) occurred at Crab Harbor (site LB-W2) on June 30. Beach seine catch-per-unit-effort increased substantially from May through July. A very similar pattern ofabundance occurred during ODFW's mid-1970s study (Figure 26).
The month to month variability in length-frequency distribution for the 1999 beach seinecatch of English sole (Figure 27) probably reflects the combined effects of immigrationof small (30-45 mm) juveniles from the ocean, emigration of individuals larger than

58
Figure 24. Beach seine catch-per-unit-effort for Pacific Herring caught from Aprilthrough July 1999 compared with the mean beach seine catch-per-unit-effort for the sametime interval in ODFW’s 1974-76 study (1974-76 data from Bottom and Forsberg 1978).
0
20
40
60
80
100
120
140
160
APR MAY JUN JUL
CP
E
1974-751999
PACIFIC HERRING

59
Figure 25. Length frequency histograms for Pacific herring caught in beach seine inMay, June and July 1999.
0.0
10.0
20.0
30.0
40.0
50.0
60.0
70.0
80.0
90.0
30 35 40 45 50 55 60 65 70 75 80 85 90
Per
cen
t
May
N=27
0.0
10.0
20.0
30.0
40.0
50.0
60.0
70.0
80.0
90.0
30 35 40 45 50 55 60 65 70 75 80 85 90
Per
cen
t
June
N=92
0.0
10.0
20.0
30.0
40.0
50.0
60.0
70.0
80.0
90.0
30 35 40 45 50 55 60 65 70 75 80 85 90
Fork Length (mm)
Per
cen
t
July
N=57
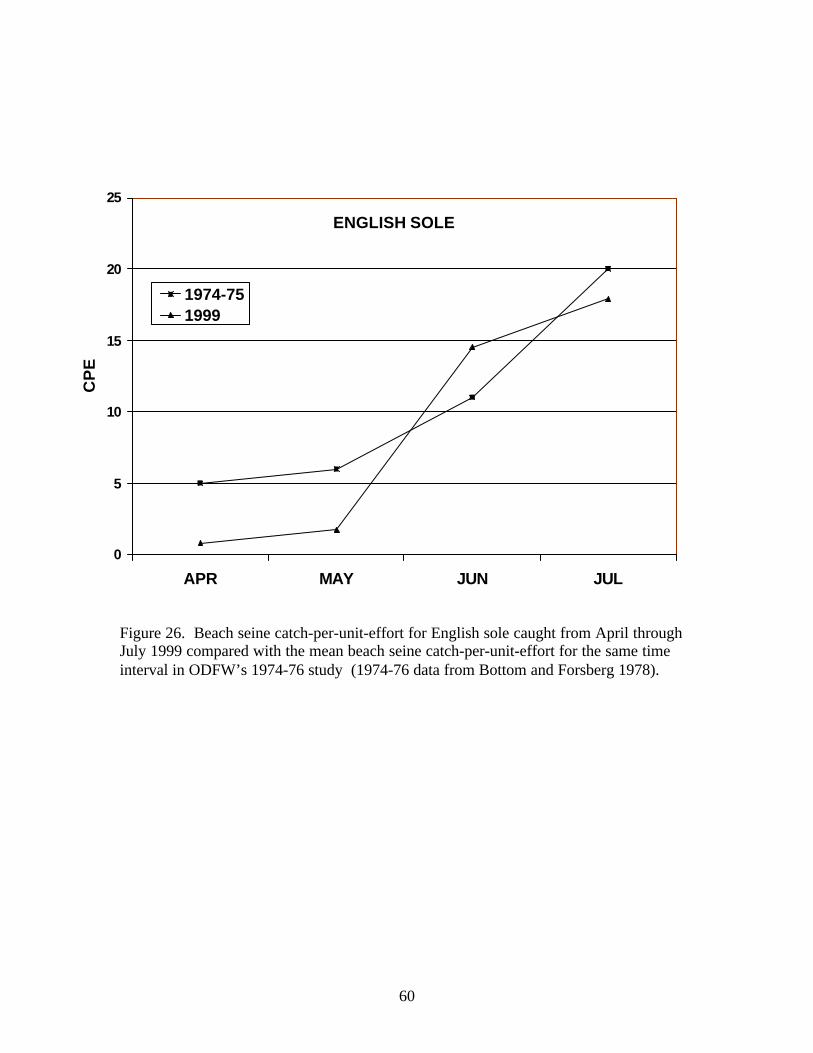
60
Figure 26. Beach seine catch-per-unit-effort for English sole caught from April throughJuly 1999 compared with the mean beach seine catch-per-unit-effort for the same timeinterval in ODFW’s 1974-76 study (1974-76 data from Bottom and Forsberg 1978).
0
5
10
15
20
25
APR MAY JUN JUL
CP
E
1974-751999
ENGLISH SOLE
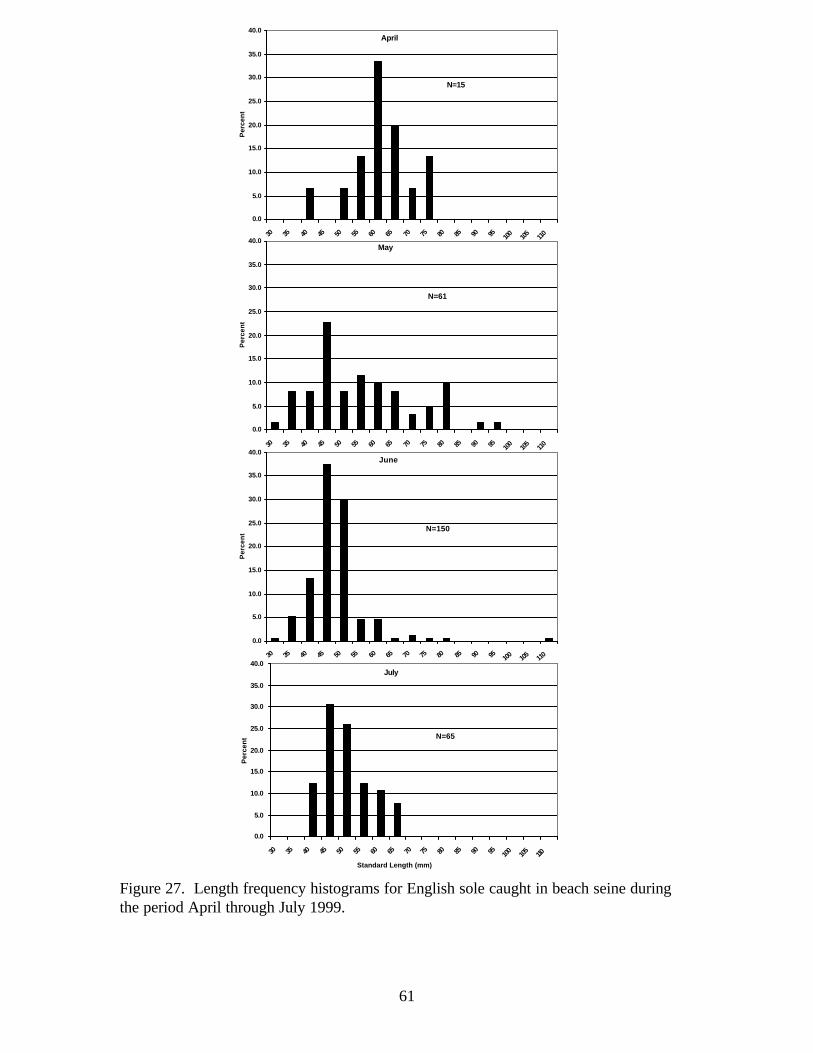
61
Figure 27. Length frequency histograms for English sole caught in beach seine duringthe period April through July 1999.
0.0
5.0
10.0
15.0
20.0
25.0
30.0
35.0
40.0
30 35 40 45 50 55 60 65 70 75 80 85 90 95 100
105
110
Per
cen
t
April
N=15
0.0
5.0
10.0
15.0
20.0
25.0
30.0
35.0
40.0
30 35 40 45 50 55 60 65 70 75 80 85 90 95 100
105
110
Per
cen
tMay
N=61
0.0
5.0
10.0
15.0
20.0
25.0
30.0
35.0
40.0
30 35 40 45 50 55 60 65 70 75 80 85 90 95 100 105 110
Per
cen
t
June
N=150
0.0
5.0
10.0
15.0
20.0
25.0
30.0
35.0
40.0
30 35 40 45 50 55 60 65 70 75 80 85 90 95 100
105
110
Standard Length (mm)
Per
cen
t
July
N=65

62
about 75 mm from the estuary, and settlement of new larvae. These complexities in thedynamics of the juvenile population make it very difficult to draw conclusions regardinggrowth or estuarine survival of individual cohorts through time.
Starry Flounder
The starry flounder is distributed Arctic-circumboreal and found in the eastern PacificOcean from Santa Ynez River, California, north through the Bering and Chukchi Seas toBathurst Inlet in Arctic Canada. The starry flounder does not migrate extensively(Pedersen and DiDonato 1982). However, tagging studies have shown that there is somemovement along the coast (Westerheim 1955). It also has some bathymetric migrationsprobably related to spawning. Spawning occurs near river mouths and sloughs in shallowwater (<45 m deep) (Garrison and Miller 1982). Spawning takes place primarily fromFebruary to April in Puget Sound and British Columbia (Hart 1973). Eggs and larvae arepelagic, while juveniles and adults are demersal (Garrison and Miller 1982). Juvenilescommonly invade far up rivers (Moyle 1976), but appear to be estuarine-dependent.Adults have been found in marine waters to 375 m depth, but most are captured at depths<150 m (Allen and Smith 1988). The starry flounder is a moderately important flatfishspecies landed by the Pacific coast trawl fishery. It is also important recreationally insome areas. It is prey for marine mammals and piscivorous birds.
Starry flounder ranked ninth in relative abundance in our 1999 beach seine catch. Mostof the starry flounder captured in this study were found in the mid- and upper regions ofthe Bay and most were captured in June and July. The largest number of starry flounderin a single beach seine haul was 66 fish and occurred at mid-region station MB-W2 onJuly 1. The station where starry flounder were caught most frequently was UB-E1,which is the site farthest up bay and typically had the lowest salinity. Catch-per-unit-effort of starry flounder was relatively low throughout the study period, ranging from<0.5 in April to about 3.5 in June (Figure 28). Catch-per-unit-effort for starry flounderwas about the same for ODFW's mid-1970s beach seine catch (Figure 28). Forsberg etal. (1977) reported that starry flounder were most abundant during the summer and fall of1974-1975 in Tillamook Bay with peak abundance in July.
Sufficient numbers of starry flounder for length frequency histograms were captured onlyduring June and July. According to Emmett et al. (1991), male juvenile starry flounderrange in length from approximately 7 mm to 17-30 cm (males) and females range fromabout 7 mm to 23-35 cm. All of the starry flounder captured by beach seine in this studywere classified as juveniles since the largest fish captured was less than 13 cm. Thelength frequency distribution for June (Figure 29) probably represents a single cohort ofjuveniles. The wider length frequency distribution in July probably reflects acombination of growth and recruitment of new individuals to the population of juveniles.

63
Figure 28. Beach seine catch-per-unit-effort for starry flounder caught from Aprilthrough July 1999 compared with mean beach seine catch-per-unit-effort for the sametime interval in ODFW's 1974-75 study (1974-76 data from Bottom and Forsberg 1978).
0
5
10
15
20
25
APR MAY JUN JUL
CP
E
1974-751999
ENGLISH SOLE

64
Figure 29. Length frequency histograms for starry flounder caught by beach seine inJune and July 1999.
0.0
5.0
10.0
15.0
20.0
25.0
30.0
35.0
30 35 40 45 50 55 60 65 70 75 80 85 90 95 100 105 110 115 120
Per
cen
t
June
N=42
0.0
5.0
10.0
15.0
20.0
25.0
30.0
35.0
30 35 40 45 50 55 60 65 70 75 80 85 90 95 100
105
110
115
120
Standard Length (mm)
Per
cen
t
July
N=51

65
Environmental Relationships
SalinitySalinity appeared to influence the distribution of several abundant species. Pacificherring, English sole and surf smelt were found primarily in relatively high salinities(Figure 30). Juvenile chinook salmon, although found throughout the Bay, also appearedto prefer the higher salinities of the lower bay. Chum salmon abundance was highest inthe 20 to 25 ppt range. Beach seining was initiated in late April after the majority ofchum salmon fry had migrated through the upper estuary. Therefore, the apparentpreference of chum salmon fry for higher salinity water could, in part, reflect the effect ofsample timing. Starry flounder were most abundant in lower salinity water. Shiner perchand Pacfic staghorn were most abundant in the 25 to 30 ppt range but were also commonacross the entire salinity range, indicating broad salinity tolerance.
Substrate Type
The estuary contains several different types of fine substrate (e.g., sand, sandy silt, andfine silty sand) and several types of coarse substrate (e.g., boulders, cobble, gravel, andmixed shell/fine gravel). As pointed out by Bottom and Forsberg (1978), substrate as afactor in the distribution and abundance of species in Tillamook Bay is difficult to isolatebecause it may be segregated along the longitudinal axis of the Bay as is salinity. This isparticularly true with the fine-grained substrates. In this study, we established replicatedsampling sites on only two major habitat types---coarse substrate and fine substrate.Within each of the three regions of the Bay, three replicate seine hauls were made onsites with rocky shorelines and three with fine grained substrates (i.e., sand or finesand/silt). A 2-way analysis of variance (ANOVA) was used to test for significantdifferences in mean number of species and total catch-per-unit-effort between the twomajor substrate types. There were significantly more (P < 0.05) species on the rockysubstrate (3.5 per sample) than on the fine grained substrates (2.6 per sample). On theother hand, the fine grain substrate mean beach seine catch-per-unit-effort was higher(97.8 fish per set) but not significantly different from the mean catch-per-unit-effort (87.1fish per set) on the rocky substrate. Beach seine sampling efficiency was probablysomewhat lower at the rocky intertidal sites than at sandy beach sites since the rocksmade it more difficult to keep fish from escaping under the net. This might explain thelower mean catch-per-unit-effort at the rocky intertidal sites. The higher mean number ofSpecies that were most abundant on the fine grained substrates included English sole,Pacific sanddab, and starry flounder. Those that were more abundant on the rockyshoreline habitat included chinook salmon, cutthroat trout, coho salmon, and shinerperch.
In the ODFW report, saddleback gunnel were described as a common species that weredistributed throughout the Bay, particularly during the summer months. Saddlebackgunnel prefer mud bottom substrates with eelgrass or seaweed (Eschmeyer et al. 1983).ODFW's map of eelgrass beds (Forsberg et al. 1977) showed extensive beds throughoutthe mid-region of the Bay. Based on multispectral analysis of aerial photographs taken in

66
Figure 30. Beach seine catch-per-unit-effort of abundant fish species by salinity.
Pacific Herring
0
5
10
15
20
25
30
35
40
45
5 10 15 20 25 30 35
Salinity (ppt)
CP
E
Shiner Perch
0
5
10
15
20
25
5 10 15 20 25 30 35
Salinity (ppt)
CP
E
Starry Flounder
0
1
2
3
4
5
6
7
8
5 10 15 20 25 30 35
Salinity (ppt)
CP
E
Chinook Salmon
0
0.5
1
1.5
2
2.5
3
3.5
4
4.5
5 10 15 20 25 30 35
Salinity (ppt)
CP
E
Chum Salmon
0
2
4
6
8
10
12
0 5 10 15 20 25 30 35
Salinity (ppt)
CP
E
English Sole
0
5
10
15
20
25
5 10 15 20 25 30 35
Salinity (ppt)
CP
E
Pacific Staghorn Sculpin
0
5
10
15
20
25
30
35
5 10 15 20 25 30 35
Salinity (ppt)
CP
E
Surf Smelt
0
10
20
30
40
50
60
70
5 10 15 20 25 30 35
Salinity (ppt)
CP
E
67
May 1996 during extreme low tide conditions, much of the eelgrass that was mapped inthe mid-1970s appears to be absent from the mid-region of the Bay. Most of the presentheavy eelgrass beds are now located in the northwest corner of the middle region and inthe lower region of the Bay. This apparent shift in the distribution of eelgrass beds mayexplain, in part, the relatively infrequent occurrence of saddleback gunnel in this study.
Fish Use of Salt Marsh Habitat
It has generally been found that salt marshes and associated tidal channels in the upperregions of Pacific Coast estuaries function as nursery areas for post larval and juvenilefish (e.g., Allen 1982, Bottom et al. 1987). Salt marshes, both natural and restored, alsohave been identified as rearing habitat for coho, chum and chinook salmon juvenilesduring their migration to the ocean (e.g., Sadro 1999, Levy and Northcote 1982, Shreffleret al. 1990, Miller and Simenstad 1997). Tillamook Bay has an extensive area of saltmarsh at the southern end of the Bay, part of which is dissected by a network of tidalsurge channels. Much of the marsh has developed over the last 50 years on the deltacreated by sediments carried downstream from the Kilchis, and Wilson Rivers. Themajority of the marsh is dominated by the sedge Carex lyngbyi. To our knowledge, noprevious studies of fish use of the marsh have been conducted.
We sampled the salt marsh habitat from mid June through mid October 1998 and fromlate March through late July 1999. The 1998 sampling program was used to test thesampling gear, evaluate the sampling strategy, and to provide initial insight into summerand autumn fish use of the marsh. The 1999 sampling program employed a morecomprehensive sampling design and was conducted on an approximate bi-weeklysampling schedule from late March through July. Results of the 1998 and 1999 marshsampling are presented separately below.
1998 Salt Marsh Studies
During 1998, the fyke nets were set during daylight hours under moderate high tideconditions, which ranged from +5.8 to +6.8 ft MSL at Garibaldi. Higher high tides oftenoccurred during the night but we did not attempt night sampling. Under the tidalconditions sampled, flooding of the marsh surface occurred for only a relatively shortperiod at high tide. Flooding of the marsh surface was more extensive and lasted for alonger period of time at site F-1, which was slightly lower in elevation than the other twosites. Maximum water velocities through the nets during the outgoing tides were notmeasured but were visually estimated to be less than 0.6 m per second (2 ft per second)on all sampling dates.
A total of 2,640 fish were captured during the 1998 sampling period. The catchcomprised three species---threespine stickleback, Pacific staghorn sculpin, and shinerperch. Of the three species, threespine stickleback was the most abundant, comprising 94percent of the total catch. Pacific staghorn sculpin and shiner perch each comprisedabout 3 percent of the total catch.

68
The largest catches occurred during June and July (Table 10). Adult threespinestickleback in spawning condition were responsible for the relatively large numbersduring these months. Site F-1, which was lowest in elevation and closest to the mud flaton the west side of the marsh, had the largest catches of threespine stickleback in Juneand July. The largest single catch (1,504 fish) of threespine stickleback occurred at siteF-1 on June 23.
Threespine stickleback also were captured in June and July at the other two sites but inmuch lower numbers. In September only a few threespine stickleback were captured at allthree sites. In October, numbers remained low at F-1 and F-2 but increased to over 100fish at F-3. The catch of threespine stickleback at F-3 in October was comprised of amixture of adult and juvenile fish. At low tide in October, we noted that residual pools insome of the marsh channels contained large numbers juvenile threespine stickleback. Themarsh probably serves as a refuge and rearing area for young threespine stickleback.
Table 10. Numbers of threespine stickleback, staghorn sculpin and shiner perch caughtin fyke nets on each of the 1998 sampling dates.
Date ThreespineStickleback
Staghorn Sculpin Shiner Perch TotalCatch
F-1 F-2 F-3 F-1 F-2 F-3 F-1 F-2 F-36/13* - - 3 - - 34 - - 0 376/23** 1504 - - 2 - - 1 - - 15076/25 740 12 21 25 3 1 4 3 0 8097/02** 8 0 12 207/8*** NA 3 0 NA 10 0 NA 0 0 137/27 21 1 12 11 1 7 18 0 4 759/25 39 4 2 3 0 0 5 2 0 5510/13 6 4 108 2 0 0 4 0 0 124* Only F-3 sampled, initial gear testing* * Only F-1 sampled, initial gear testing*** The F-1 net frame was not seated completely and allowed fish to avoid capture.
Pacific staghorn sculpin were present in all of the samples taken at site F-1 in 1998 butwere absent from the catch at site F-2 in September and October and at site F-3 in July,September and October. The largest number (34) of Pacific staghorn sculpin was takenat site F-3 in mid June. Throughout the study period, the catch of Pacific staghornsculpin was dominated by juveniles.
Shiner perch were present in all of the samples collected at site F-1 during the 1998sampling period. Shiner perch were only captured at site F-2 on June 25 and September25 and at F-3 on July 27. The largest number of shiner perch was caught at site F-1 on

69
June 25. Most of the shiner perch captured were juveniles and ranged in length from 44to 95 mm.
During four of the fyke net sets, a round-haul net set was made on the sand flat adjacentto the marsh. This was done to compare the species composition of fish on the adjacentsand flat habitat with the species composition in the marsh. Starry flounder, English sole,Pacific sanddab and juvenile chinook salmon were captured on the sand flat but not in themarsh (Table 11). Pacific staghorn sculpin and shiner perch were captured in bothhabitats; threespine stickleback were not captured on the sand flat. Starry flounder wererelatively abundant on the sand flat and occurred in three of the four samples. Otherspecies occurred less frequently. Only one juvenile chinook salmon was collected on thesand flat at the time the fyke net samples were collected. However, juvenile chinooksalmon were present in the upper bay during early and mid July based on our beach seineand round-haul net sampling programs.
Quantitative estimates (numbers per unit area) of fish use of the marsh were calculatedfor the areas sampled by each of the fyke nets. These estimates required estimates offyke net sampling efficiency and knowledge of the marsh surface area drained upstreamof each fyke net. We conducted two efficiency tests during October to provide an initialestimate of fyke net efficiency. Shiner perch, staghorn sculpin, juvenile chinook salmonand one starry flounder were collected by beach seine. They were separated into twogroups ---one group of 15 fish and one group of 22 fish. A small portion of the upperlobe of the caudal fin was clipped off each fish to allow the fish to be identified uponrecapture. The fish were released at high tide in the upper portions of the F-1 and F-3drainage basins. Numbers of fin clipped fish recovered at the fyke nets were tallied afterthe channels had drained out at low tide.
Of the group of 22 fish released at F-1, six (27%) were recaptured at the net. Of thegroup of 15 fish released above F-3, four (27%) were recaptured at the net. Although thepercent recovery was consistent, the rates of recapture were considerably lower that wehad anticipated. The low recapture rates were explained when it was found that most ofthe fin clipped fish had avoided the nets by squeezing through a few small spaces on theoutsides of the wooden net support. Many of the clipped fish were found under the nets,where they became trapped after passing around the wooden support. We believe thespaces that allowed the fish to escape in October had developed during the latter part ofthe study due to bank erosion at the frames. Net efficiencies were probably higher duringmost of the sampling.
The results of the efficiency tests were instructive with regard to the design of the 1999monitoring program because they indicated how important it is to completely seal off thechannel being sampled. Apparently fish search for ways around passive fyke nets andwill take advantage of any opportunity to avoid going into the net. Modifications to thewooden support frames were made in 1999 to prevent fish from getting around or underthe frames. After these modifications, we did not find evidence that fish were gettingaround or under the net frames.

70
Table 11. Comparison of species and numbers of fish collected on sand flat habitatadjacent to the salt marsh (round-haul net) with species and numbers of fish collected insalt marsh habitat (fyke net).
6/25/98 Sand Flat Marsh3-Spine Stickleback 0 773English Sole 4 0Shiner Perch 2 7Staghorn Sculpin 0 29Starry Flounder 10 0
7/8/98 Sand Flat Marsh3-Spine Stickleback 0 3Chinook Salmon 1 0Shiner Perch 20 0Staghorn Sculpin 7 10Starry Flounder 5 0
7/27/98 Sand Flat MarshThreespine Stickleback 0 40Pacific Sanddab 40 0Shiner Perch 0 25Staghorn Sculpin 0 15Starry Flounder 8 0
10/13/98 Sand Flat MarshPacific Sanddab 1 0Threespine Stickleback 0 114Shiner Perch 0 3Staghorn Sculpin 0 4
Estimates of the number of fish per-unit-area of marsh sampled by each of the fyke nets(Table 12) were calculated using the catch data, estimates of marsh surface area drainedby each of the channels sampled, and an estimate of fyke net sampling efficiency. Thecatch data for the June-July and September-October sampling periods were groupedseparately and a mean catch for each period was calculated for each species and samplingsite. The estimates of marsh surface area drained upstream of each sampling site were asfollows: F-1 = 0.11 hectares (0.3 acres), F-2 = 0.27 hectares (0.66 acres), and F-3 = 0.11hectares (0.3 acres). We used the 27% sampling efficiency estimate for the entire studyperiod. However, as discussed above, sampling efficiency during the spring and summermay have been substantially higher before small spaces were eroded around the netframes allowing fish to bypass the nets. Therefore, the estimated number of fish perhecare reported for the June-July period (Table 12) are probably overestimates.

71
The comparison of numbers of fish per-unit-area by station and season (Table 12)indicate that variability was high between stations and between seasons. The lowerelevation region of the marsh sampled at F-1 generally contained more fish per-unit-areathan the higher elevation sites sampled at F-2 and F-3. The relatively high catches ofthreespine stickleback at F-2 and F-3 during the fall were the only exceptions.
Based on the results of the 1998 sampling program, we modified the 1999 samplingdesign to increase sample replication and to test the hypothesis that fish abundance in thelower marsh is greater than fish abundance in the higher elevation regions of the marsh.The number of fyke net sampling sites was increased from three to six. Two of the newsites were placed in low elevation marsh and one new site was placed in relatively highelevation marsh. The three sites used in the 1998 sampling were retained and sampledduring the 1999 period.
1999 Marsh Monitoring
During the 1999 monitoring period, six fyke nets were set at approximately 2-weekintervals during daylight hours. Samples were obtained during moderate to moderatelyhigh high-tide conditions, which ranged from +5.5 to +7.0 ft MSL at Garibaldi.Unfortunately, the highest high tides during the study period occurred at night and werenot sampled. Under the tidal conditions sampled, flooding of the marsh surface occurredon most of the sampling dates, with high tide depths over the marsh surface ranging fromabout 0.1 to 0.8 m on different dates. Considerable variation in high tide elevationsoccurred during the spring due to storm surges from the ocean. Flooding of the marshsurface was more extensive and lasted for a longer period of time at sites F-1, F-5 and F-6, which were lower in elevation and closer to the open bay than the other three sites,which were located in the mid-region of the marsh. Maximum water velocities throughthe nets during the outgoing tides were not measured but were visually estimated to beless than 0.6 m per second (2 ft per second) on all sampling dates.
A total of 2,536 fish were captured during the period late March through late July 1999.The catch was comprised of six species (Table 13). The most abundant species in thecatch were threespine stickleback, Pacific staghorn sculpin and chum salmon fry. Withthe exception of a small peak in late April, catch-per-unit-effort for Pacific staghornsculpin was relatively constant throughout the sampling period (Figure 31). Catch-per-unit-effort for threespine stickleback increased sharply in mid June and declinedgradually through the end of July. As in 1998, adult threespine stickleback in spawningcondition were responsible for the high catch-per-unit-effort values in June and July.
Chum salmon fry were caught from late March through April. The largest catch of chumsalmon fry occurred on 28 March at site F-1 when only two of the six fyke net sites werefunctional. Site F-3, the other site sampled on March 28, did not have any chum salmonpresent. High seas and gale-force winds washed out several of our newly establishedfyke net frames on March 29 and forced a delay in startup of the full marsh sampling

72
Table 12. Estimates of mean numbers of fish per hectare of marsh sampled duringsummer (June-July) and fall (September-October), 1998.
Mean Number of Fish per Hectare of Marsh SampledFyke Net SiteJune-July September-October
Threespine SticklebackF-1 19,436 758F-2 73 135F-3 101 1,852
Staghorn SculpinF-1 320 84F-2 65 0F-3 337 0
Shiner PerchF-1 296 152F-2 65 0F-3 34 0
Table 13. Relative abundance of fish species collected by fyke net during 1999 in saltmarsh habitat.
Species Number*Threespine Stickleback 1188Pacific Staghorn Sculpin 959Chum Salmon 368Shiner Perch 117Prickley Sculpin 2Coho Salmon 1*totals for six nets fished on seven sampling dates
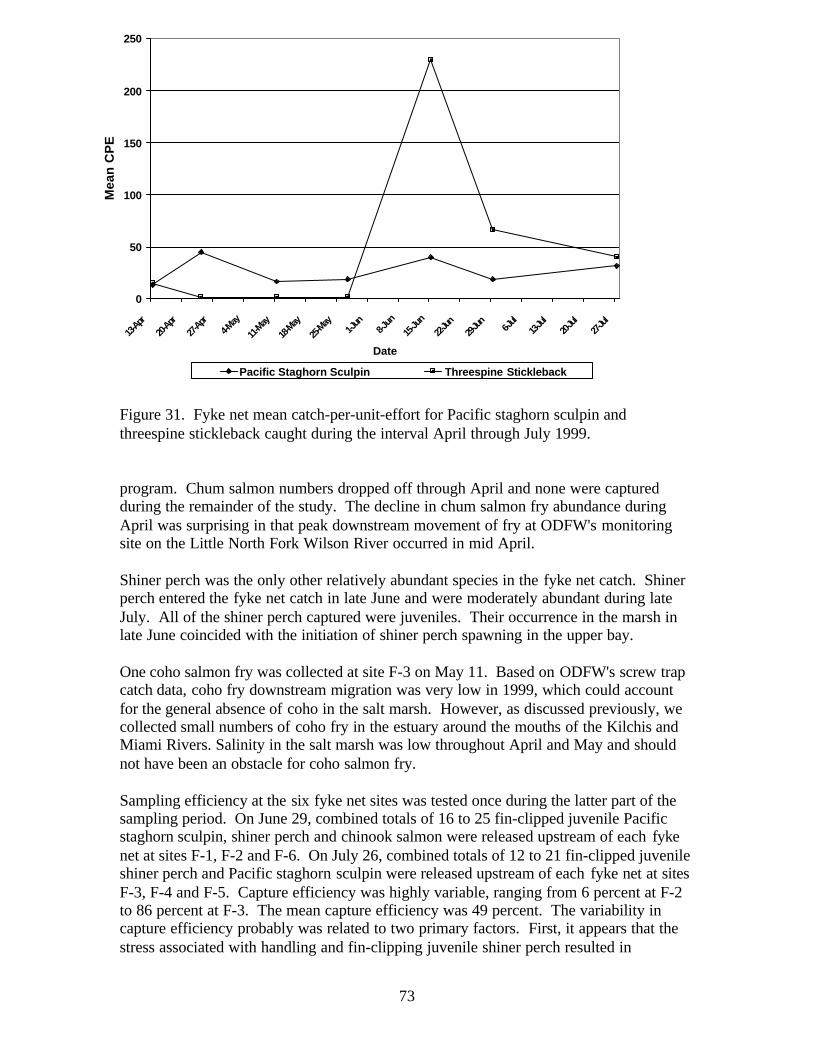
73
Figure 31. Fyke net mean catch-per-unit-effort for Pacific staghorn sculpin andthreespine stickleback caught during the interval April through July 1999.
program. Chum salmon numbers dropped off through April and none were capturedduring the remainder of the study. The decline in chum salmon fry abundance duringApril was surprising in that peak downstream movement of fry at ODFW's monitoringsite on the Little North Fork Wilson River occurred in mid April.
Shiner perch was the only other relatively abundant species in the fyke net catch. Shinerperch entered the fyke net catch in late June and were moderately abundant during lateJuly. All of the shiner perch captured were juveniles. Their occurrence in the marsh inlate June coincided with the initiation of shiner perch spawning in the upper bay.
One coho salmon fry was collected at site F-3 on May 11. Based on ODFW's screw trapcatch data, coho fry downstream migration was very low in 1999, which could accountfor the general absence of coho in the salt marsh. However, as discussed previously, wecollected small numbers of coho fry in the estuary around the mouths of the Kilchis andMiami Rivers. Salinity in the salt marsh was low throughout April and May and shouldnot have been an obstacle for coho salmon fry.
Sampling efficiency at the six fyke net sites was tested once during the latter part of thesampling period. On June 29, combined totals of 16 to 25 fin-clipped juvenile Pacificstaghorn sculpin, shiner perch and chinook salmon were released upstream of each fykenet at sites F-1, F-2 and F-6. On July 26, combined totals of 12 to 21 fin-clipped juvenileshiner perch and Pacific staghorn sculpin were released upstream of each fyke net at sitesF-3, F-4 and F-5. Capture efficiency was highly variable, ranging from 6 percent at F-2to 86 percent at F-3. The mean capture efficiency was 49 percent. The variability incapture efficiency probably was related to two primary factors. First, it appears that thestress associated with handling and fin-clipping juvenile shiner perch resulted in
0
50
100
150
200
250
13-Apr
20-Apr
27-Apr
4-May
11-M
ay
18-M
ay
25-M
ay1-J
un8-J
un15
-Jun
22-Ju
n29-
Jun
6-Jul
13-Ju
l20-
Jul
27-Ju
l
Date
Mea
n C
PE
Pacific Staghorn Sculpin Threespine Stickleback
74
mortality in some of the fish introduced to the channels. We found several of the fin-clipped juvenile shiner perch dead in the channels during the June efficiency test.Mortality and perhaps altered behavior due to stress could explain part of the recapturevariability, particularly in the June test. The second contributor to variability wasresidualism in small pools upstream of the fyke nets. We noted that many of the stockedfish were reluctant to enter the fyke nets and waited until the channels were almost drybefore moving in. Where there was even a small amount of residual water upstream ofthe nets, the fish preferred to stay in the water rather than enter the nets. We did not findany evidence that fish were avoiding capture by finding a way around the fyke nets. Inthe future, it is recommended that any residual water upstream of the fyke nets should beelectrofished with a backpack electrofisher to remove fish that have not left the channels.
We located three fyke net sites close to the lower (western) edge of the salt marsh andthree sites in the higher mid-region of the salt marsh to determine whether fish use of themarsh varies with elevation in the marsh. Unfortunately, the high variability in the netefficiency tests indicated that the 1999 data set was unreliable for quantitative statisticalhypothesis testing. Electrofishing of the residual pools upstream of the nets isrecommended for future sampling and should allow accurate estimates of total numbersof fish using the tidal channels.
Based strictly on presence or absence in the fyke nets, it appears that chum salmon mayutilize the lower portions of the marsh to a greater extent than the higher elevationportions. In early April, chum salmon fry were captured in all three of the lowerelevation sites but only one of the higher elevation sites. In late April, only site F-5 (alower elevation site) had chum salmon present. It is possible that higher elevationportions of the salt marsh are invaded to a greater extent during maximum high tides,which occurred at night during this study.
Threespine stickleback abundance in the marsh appeared to be somewhat lower in 1999than in 1998 based on comparison of the total catches. However, site to site variabilitywas high in both years. This suggests that the distribution of threespine stickleback isprobably clumped in specific areas of the marsh. In the 1999 samples, the largest catchesof adult threespine stickleback occurred at site F-4, which is one of the sites in the mid-region of the marsh; in 1998 the largest catch occurred at site F-1 a lower elevation site.
We did not compute an estimate of the number of fish per unit surface area of the marshfor the 1999 data set. The uncertainty with regard to the 1999 fyke net samplingefficiency data represents a problem in expanding the catch results.
In summary, the 1999 sampling results indicated that the salt marsh habitat providesrearing habitat for juveniles of several fish species. Substantial numbers of juvenilechum salmon used the marsh during late March through mid April. Juvenile chinooksalmon were absent from the fyke net catch during both the 1998 and 1999 samplingperiods. However, we did not sample during the night and it is possible that juvenilechinook salmon could be present during night-time high tides. The presence of adultthreespine stickleback in the June and July fyke net catch indicates that threespine

75
stickleback probably use the marsh for spawning. Juvenile threespine stickleback wereabundant in residual pools in the marsh during the latter part of the 1998 study period.The marsh appears to be a preferred habitat for threespine stickleback since they wereinfrequently caught in our beach seine or trawl sampling of the open bay. JuvenilePacific staghorn sculpin were moderately abundant in the fyke net catch throughout the1999 study period. Their greater relative abundance in 1999 compared with 1998 wasprobably related to the small-mesh net liners installed in the fyke nets in 1999, whichretained more of the small juveniles.
Invertebrates Collected Incidental to Fish Collections
Juvenile and adult Dungeness crabs (Cancer magister) were caught in beach seine,round-haul net and trawl sets during 1998 and in beach seine and trawl sets during 1999.Juvenile Dungeness crab were found throughout the Bay and appeared to be mostabundant in the upper and mid sections of the Bay. Adult crabs were primarily found inthe lower region of the Bay but a few were captured from the mid-region. Thisdistribution pattern is consistent with that found by ODFW in the mid-1970s (Forsberg etal. 1977).
During beach seining in October 1998 and April, May and June 1999, several Europeangreen crab (Carcinus maenus) were captured at several sites in the lower and mid-regionof the Bay. All were associated with rocky shoreline habitat. The European green crab isan exotic species that until recently was not known to occur in Tillamook Bay. The factthat a number of adults were captured in a few seine hauls suggests that the green crab isbecoming well established in the Bay. Green crabs are voracious predators on juvenileoysters and other small clams and invertebrates. Therefore, they have the potential ofcausing harm to the oyster industry as well as altering basic ecological relationships inthe estuary.
Recommendations for Long-term Fish Monitoring
The design of a long-term monitoring program for the fish community of Tillamook Bayis being developed through a step-wise process. In 1998, we conducted preliminarysampling throughout the estuary with several types of sampling gear. The results of the1998 sampling program were then used to design a prototype monitoring program, whichwas tested during the spring and summer of 1999. The information developed from theinitial test of the monitoring program, has been used to further refine the monitoringprogram. This section summarizes the steps that have lead to the presentrecommendations for long-term monitoring. Appendix D outlines the proposedmonitoring plan for future monitoring of the Bay. It is anticipated that this plan will befurther refined as additional information is developed and specific data needs areidentified.
We started development of the long-term monitoring program with the basic assumptionthat documentation of changes in the fish community through time requires information

76
on species composition and the distribution and abundance of species across habitattypes. Basic to obtaining such information is the need to determine the following:
• appropriate sampling techniques,• appropriate level of effort (i.e. number of sample replicates),• appropriate sampling sites, and• appropriate timing and frequency of sampling
Sampling Techniques
Sampling techniques that have been employed in Tillamook Bay for scientific fishsampling include beach seining, trawling, round-haul netting, gill-netting, and SCUBAdiving. Two types of trawl have been used. In the mid-1970s, ODFW used a small ottertrawl, which was towed over the intertidal flats and subtidal areas with a small boat. Theotter trawl was selective for fish occurring near or on the bottom and rarely capturedpelagic species such as juvenile salmonids. The semi-balloon trawl used in this studywas considerably larger (7.6-m footrope) and consequently, its use was limited to thedeeper subtidal channels in the lower Bay. Like the otter trawl, it was also selective forspecies occurring near or on the bottom of the Bay. Gill netting was used by ODFW, butthey found that drifting algae generally fouled the nets and made then visible to fish.SCUBA gear was used by ODFW during the mid-1970s in areas difficult to sample withother kinds of gear. Variability in water clarity limited the usefulness of this technique.
To be suitable for a cost-effective long-term monitoring program, fish sampling gear foruse in Tillamook Bay should have the following characteristics:
1. allow sampling in the major habitats found in the Bay,2. collect a representative sample of fish,3. allow standardized calculation of catch-per-unit-effort or catch per area
sampled, and4. be easy to use
A large part of Tillamook Bay consists of shallow intertidal and subtidal mud and sandflats. Therefore, sampling gear suitable for collecting representative samples from thistype of habitat was considered a priority for the monitoring program. Beach seine,round-haul net, and small otter trawl were considered the possible options for this habitat.Use of a beach seine is limited to the shoreline areas, whereas both the trawl and round-haul net are capable of sampling offshore areas. The beach seine and the round-haul netwere considered the types of sampling gear most likely to yield representative samples offish because both techniques sample the water column as well as the bottom.
The catch results for the 1998 beach seine and round-haul net samples are compared inTable 14. The total number of species collected by the two types of sampling gear wassimilar for the mid-summer sampling period. The beach seine collected 17 species andthe round-haul net collected 15 species. Much of the difference in species compositionbetween the beach seine and round-haul net catches can be explained in terms of

77
Table 14. Species and numbers of fish collected from Tillamook Bay by beach seine,round-haul net and trawl during the 1998 mid-summer survey.Species Seine Round-Haul TrawlShiner Perch 379 42 361Staghorn Sculpin 393 82 202English Sole 232 195 138Pacific Sanddab 13 41 165Surf Smelt 129 0 0Chinook Salmon 33 46 0Starry Flounder 20 54 2Prickley Sculpin 73 0 0Threespine Stickleback 66 0 0Tidepool Sculpin 42 0 0Pacific Sand Lance 0 39 0Ling Cod 0 0 25Top Smelt 3 8 0Buffalo Sculpin 0 0 11Striped Seaperch 5 4 1Padded Sculpin 2 0 2Saddleback Gunnel 1 1 1Red Irish Lord 0 0 2Northern Anchovy 0 0 2Bay Pipefish 1 0 0Kelp Greenling 1 0 0Rockweed Gunnel 1 0 0American Shad 0 1 0Cutthroat Trout 0 1 0Pacific Herring 0 1 0Rock Prickleback 0 1 0White Seaperch 0 1 0Cabazon 0 0 1Pile Perch 0 0 1Sand Sole 0 0 1Snake Prickleback 0 0 1Tube-snout 0 0 1TOTAL 1394 517 918

78
differences in habitat types sampled. For example, two of the species collected by beachseine but not collected in the round-haul net (i.e., prickly sculpin and threespinestickleback) were found only in Hoquarton Slough during the survey period. No round-haul net sampling was conducted in the slough habitat. Another example is the tidepoolsculpin, which was collected by beach seine but absent from the round-haulnet catches.Tidepool sculpin were found primarily in rocky intertidal habitat near the mouth of theBay, a habitat type not sampled by the round-haul net.
In those portions of the Bay where both beach seine and round haul-net were used (i.e.beach seine sites 4-8 and round-haul net sites 3-14), the species composition of the catchwas quite similar. At these sites the beach seine caught only one species (bay pipefish)not captured by the round-haul net. The round-haul net captured several pelagic speciesnot captured by the beach seine (i.e., Pacific sand lance, American shad, cutthroat trout,Pacific herring). However, with the exception of Pacific sand lance, only a singleindividual represented these additional species. All of these species were subsequentlycaptured by beach seine during the 1999 sampling period. These comparisons indicatethat either type of gear probably could provide a reasonable index to the speciescomposition and relative abundance of fish in the shallow subtidal and intertidal habitat.
The biggest difference between the beach seine and the round-haul net lies in the ease ofoperation and the length of time that sampling can be conducted during a tidal cycle. Thebeach seine is relatively easy to operate and can be used over varying tidal conditions.Effective use of the round-haul net requires an experienced crew and the use of a boatequipped with a jet unit for shallow water operation. Also, use of the round-haul net islimited to a relatively short period of time around high tide when tidal currents areminimal. We view the round-haul net as a research tool that can be used to betterunderstand fish use of shallow open-water intertidal and subtidal areas but is probably notappropriate for a cost-effective, long-term monitoring program.
Diversity of species was found to be highest in the lower Bay and we believe thatmonitoring should include sampling of fish from both the shallow and deeper portions ofthis area. Beach seining is the recommended technique for sampling the shallowintertidal habitat in the lower region of the Bay. A semi-balloon trawl similar is size tothat used in this study appears to be a reasonably good technique for sampling the deepersubtidal channel habitat. Boats suitable for towing the trawl are available for rent in theGaribaldi Harbor for a reasonable rate. The trawl is easy to use and can be towed for aspecified length of time to yield catch-per-unit-effort data.
The salt marsh habitat at the south end of the Bay is an important part of the estuary andpresents some special sampling problems. We tested stationary fyke nets during thesummer and autumn of 1998 and found that, when properly installed and maintained,they could be used to collect quantitative fish samples.
In summary, our experience to date indicates that beach seine and semi-balloon trawl arethe types of sampling gear most likely to provide cost-effective, yet representativesamples of the fish community in the open bay. Stationary fyke nets are a suitable
79
technique for sampling salt marsh habitat. The beach seine can be used to provide eithercatch-per-unit-effort data or catch-per-unit-area data. Although selective for fishes thatoccur near the bottom of the Bay, the trawl offers an efficient and cost-effectivetechnique for sampling fish in the deeper subtidal channel habitat. The fyke nets, whencoupled with electrofishing residual pools upstream of the net, efficiency testing andestimates of the drainable basins sampled may yield quantitative estimates of fish-per-unit area of salt marsh.
Sampling Effort and Siting of Sampling Stations
One of the most difficult tasks in setting up a monitoring program is deciding on anappropriate level of sampling effort. Generally, a balance must be achieved betweenobtaining statistical confidence in the data and the cost of obtaining the data. Inanalyzing the results of the 1998 round-haul net and beach seine data, we found thatsample variability in catch-per-unit-effort was very high for both types of sampling gear.The high variability between samples was probably related to a combination of thenatural patchy distribution of fish on the intertidal mud flat and sand flat habitat anddifferences in habitat characteristics between sites.
The variability between sample replicates caused by differences in habitat conditions(e.g. substrate characteristics and salinity) can be reduced through careful selection ofsample locations and partitioning of the estuary. For beach seine sites, the majordifferences in habitat, and presumed differences in species usage, are seen on oppositesides of the Bay (substrate differences) and from the upper to the lower ends of the Bay(salinity gradient). This division of major habitat types results in six regions forsampling: Upper East, Upper West, Middle East, Middle West, Lower East and LowerWest. During 1999, we established three replicate beach seine sites within each of thesesix regions for a total of 18 sites. This stratified random sampling design lends itself toseveral standard types of statistical analytical techniques (e.g., ANOVA).
The 1999 beach seine sampling results indicated that the distribution and abundance ofindividual species remained highly variable, particularly for schooling species. However,composite measures of community structure such as mean numbers of species and totalcatch-per-unit-effort were less variable and appear to be suitable parameters for statisticalanalysis. We recommend retaining the same number and same sample locations forfuture beach seine monitoring
Variability in the 1998 trawl catch-per-unit-effort also was high between sampling sitesin the lower Bay. The highest catches and the largest number of species occurred insamples from the lower end of the Bay City channel near the Ghost Hole and HobsonvillePoint and the Main Channel in front of the Garibaldi boat harbor .The lowest catchesoccurred in the South Channel and the Bay outlet channel. Trawl sampling conducted byODFW in the mid-1970s also indicated relatively high species richness and high catch-per-unit-effort in the vicinity of Hobsonville Point and in the Garibaldi harbor (Bottomand Forsberg 1978). The reason for the trawl site differences in abundance and speciesrichness are not known but could reflect localized differences in factors such as food

80
abundance, tidal current velocities or substate conditions. Since the goal for long-termmonitoring of the subtidal channel habitat is to document trends in species compositionand relative abundance though time, trawl sampling in areas that support relatively highdensities of fish is recommended. We implemented the 2-station trawl sampling strategyin the 1999 monitoring program. Two replicate trawls were conducted at low tide on eachsampling date off Hobsonville Point (site T-1) and off Garibaldi Harbor (site T-2).Starting points for the trawl samples in each of these areas were randomly selected from alist of potential starting points. Two replicate 5-minute trawls from each area wereobtained on each sampling date. Results indicated that the trawls provided a reasonablesample of the species composition and relative abundance of fish in the deeper portionsof the lower Bay. No change in trawl sampling sites is recommended.
Frequency of Sampling
Frequency of sampling is another important consideration with regard to comparing datafrom year to year. Many of the species in the Bay have seasonal peaks in abundance(Bottom and Forsberg 1978). These peaks in abundance can be expected to varysomewhat from year to year due to natural fluctuations in local and regional climaticconditions, food availability, etc. To accommodate these year-to-year fluctuations inabundance, sampling should be conducted periodically throughout the period of relativelyhigh abundance. During 1999, we tested an approximate bi-weekly sampling schedule.The sample results for abundant species indicated that this frequency of sampling wassufficient to identify peaks in abundance. We recommend that beach seine sampling becontinued on a twice-monthly frequency. Trawl samples indicated that monthly samplingwould be an adequate sampling frequency to document species composition and generalpatterns of abundance of fish in the channel habitat of the lower bay.
The period April through July brackets the time of peak abundance of most juvenileanadromous salmonids as well as most of the other relatively abundant species (e.g.,English sole, shiner perch, surf smelt) known to occur in the estuary (Bottom andForsberg 1978). Based on results of the 1999 sampling program, we recommend thatbeach seine sampling be conducted on a twice-monthly schedule from April through JulyTrawl sampling should be conducted during the same time interval but on a monthlyschedule.
Our 1999 monitoring results for the salt marsh habitat indicated that use of the salt marshby chum salmon fry may peak in late March. Therefore, we recommend that the fyke netsampling program be initiated in mid March and conducted on a twice-monthlyfrequency through April. From May through July, the marsh habitat appears to be usedalmost exclusively by Pacific staghorn sculpin, threespine stickleback and shiner perch.Monthly sampling during this time period should be sufficient to document use of the saltmarsh by these species.

81
Coordination With Other Monitoring Programs
Coordination with other monitoring programs both within and outside of the TillamookBay watershed can greatly expand the usefulness of the information developed in theproposed long-term monitoring program. For example, our coordination with ODFW'sout-migrant monitoring program in the Little North Fork Wilson River and Little SouthFork Kilchis River, allowed us to develop an estimate of the contribution of the LittleNorth Fork Wilson River to the total chum salmon fry production for the entirewatershed. The high percentage of chum produced by the Little North Fork potentiallyhas very important implications regarding management of chum salmon spawning habitatin the watershed. This kind of information could be very useful in estimating carryingcapacity of the Bay, habitat selection and residence time in the Bay, and survival rates ofchum fry from freshwater to the estuary if collected over a period of several years. Wehave discussed these results with representatives of ODFW and believe that greatercoordination between the two studies can be achieved in the future.
It is also important to coordinate with researchers in other estuaries on the PacificNorthwest Coast. Such coordination could potentially allow separation betweencoastwide trends in fish abundance and local trends in fish abundance. Severalmonitoring programs have recently been initiated in other regional estuaries including theSouth Slough of Coos Bay, Salmon River, and the Alsea River. Coordination in samplingtechniques, timing of sampling and analyses would greatly facilitate comparison ofresults.
Statistical Analysis
The replicated sampling design of the beach seine and fyke net sampling programs allowthe use of a number of statistical analyses techniques. For example, we used a 2-wayANOVA to analyze effects of major habitat types on numbers of species and on totalcatch-per-unit-effort and to compare Pacific staghorn sculpin abundance in upper andlower elevation fyke nets. Using the 2-way ANOVA allows examination of the data interms of the effects of habitat and effects of time of sampling.
One year's worth of data can be used to statistically compare the six different habitatareas sampled by beach seine, the two areas sampled by trawl and the two areas sampledby fyke net. If trends in species composition or abundance are hypothesized after 4-5years of data, Spearman's rank correlation coefficient (Conover, 1980) can be used to testfor trends (defined as correlation between year and catch) in total catch for each habitatarea. Profile analysis or Multivariate Analysis of Variance (MANOVA) can be used totest if trends are consistent across sites. Variables may need to be transformed to meetthe normality assumptions of these latter two tests.
We recognize that the sampling proposed above would require a substantial effort, andoffer the following suggestions for reducing this effort if it is deemed necessary to do so:

82
1) Sample alternate years. It would be better to get a clear picture of the status of theestuary every two years than to get a partial picture every year.
2) Sample only some habitats. Perform the same replication as recommended above,but eliminate some of the six habitat areas from this replication scheme.
3) A combination of 1) and 2). Sample half of the habitat areas in each year.
If sampling all six habitat areas by beach seine is not feasible, one of the three reductionstrategies above should be considered. These alternatives will reduce sampling effortwith the least cost to the data quality.
Food Habit Analysis
Food habits of important fish species is another parameter that we recommendmonitoring relative to evaluating long-term health of the fish community. Changesthrough time in the dominant food organisms consumed by selected fish species couldindicate important changes in the ecosystem. Some fish species such as chum salmonhave been shown in other estuaries (Simenstad et al. 1980, Simenstad and Eggers 1981)to be highly size and taxa specific in their choice of food items. Therefore, changes inthe species composition or size distribution of the food resources could potentially affectgrowth and survival of important fishery resources. Long-term monitoring of the foodhabitats of selected fish species is probably the best method for identifying such changesand would provide another index to the general health of the estuary.
Fish species that would be appropriate candidates for monitoring stomach content includethe following:
• Chum salmon juveniles• Chinook salmon juveniles• English sole juveniles• Staghorn sculpin
The two salmonid species were selected because both species rear for extended periods oftime in the estuary. English sole and staghorn sculpin were selected because they arerelatively abundant and widespread benthic feeders.
Collection of individuals of the above four species should occur concurrently with theproposed beach seine sampling program. Monthly collections from May through midJuly would provide a reasonable level of sampling effort. Each monthly collection wouldinclude 20 individuals of each species (depending on availability). These fish would bepreserved and stored in labeled containers until stomach content analysis could bepreformed. Depending on the availability of funds, the samples could either be archivedor sent to a laboratory that specializes in identification of stomach contents of estuarineand marine fishes. Graphic analysis of percent composition of major food items could beused to compare food habits through time for each species.
83
ACKNOWLEDGEMENTS
Many thanks are due Charles Wooldrich, Helen Hill and Robert Rees who worked longhours and trecked many miles across the tide flats and muddy marsh to help with the fishsampling. In addition, I would like to thank Tim Dalton for volunteering to help with fishcollection and for his help in analyzing the chum salmon data. The financial supportprovided by Tillamook County Performance Partnership and the Tillamook Bay NationalEstuary Project made this report possible.
LITERATURE CITED
Allen, L G. and M.H. Horn. 1975. Abundance, diversity and seasonality of fishes inColorado Lagoon, Alamitos Bay, California. Estuarine and Coastal Marine Science3:371-380.
Allen, L.G. 1982 Seasonal abundance, composition, and productivity of the littoral fishassemblages in upper Newport Bay, CA. Fishery Bulletin 80:769-790.
Allen, M.J. and G. B. Smith. 1988. Atlas and zoogeography of common marine fishes inthe northeast Pacific Ocean and Bering Sea. NOAA Tech. Rep. NMFS 66, 151 pp.
Bottom, D. 1998. Salmon Monitoring Plan Coordinator for Oregon Department of Fishand Wildlife. Telephone conversation with R. Ellis, December 1998.
Bottom, D. 1999. ODFW, research biologist. Personal communication. July 1999.
Bottom, D.L. and K. K. Jones. 1990. Species composition, distribution, and invertebrateprey of fish assemblages in the Columbia River Estuary. Prog. Oceanog. 25:243-270.
Bottom, D. L., K.K. Jones and J.D. Rogers. 1987. Fish community structure, standingcrop and production in upper South Slough (Coos Bay, Oregon). South Slough NationalEstuarine Research Reserve Technical Report Series. No. SOS 1-88.
Bottom, D., and B. Forsberg. 1978. The fishes of Tillamook Bay. Oregon Department ofFish and Wildlife, project no. F-100-R. 56 pp.
Boule, M.E. and K. F. Birely. 1986. History of estuarine wetland development andalteration: what have we wrought? Northwest Environmental Journal. 3:43-61.
Braun, K. 1997. ODFW, Fisheries Biologist Tillamook Region. Personalcommunication. February 1997..
Burt, W.V. and W. B. McAllister. 1959. Recent studies in the hydrography of Oregonestuaries. Research Briefs. Fish. Oreg. 7(1):14-27.

84
Camber, P. 1977. Sediment Accumulation in Tillamook Bay, Oregon, a large drowned-river estuary. Report to TBNEP, Garibaldi, OR.
Camber, P. 1997. Sediment Accumulation in Tillamook Bay, Oregon.a large drowned-river estuary. Report to TBNEP, Garibaaldi, OR.
Conover, W.J. (1980). Practical Nonparametric Statistics, Second Edition. John Wiley &Sons, Inc., New York.
Coulton, K., P. Williams and P. Brenner. 1996. An environmental history of theTillamook Bay estuary and watershe. Reprot to the TBNEP, Garibaldi, OR.
Cummings, T.E. and E. Schwartz. 1971. Fish in Coos Bay, Oregon, with comments ondistribution, temperature, and salinity of the estuary. Fish Comm. Oregon., CoastalRivers Invest. Inf. Rep. 70-11. 22pp.
Dalton, T. 1999. ODFW fisheries biologist, Tillamook region. Personal communication.October 1999.
Eldrdge, M.B. and W.M.Kaill. 1973. San Francisco Bay area's herring resource - acolorful past and controversial future. Mar. Fish. Rev. 25:25-31.
Emmett, R.L., S.A. Hinton, S.L. Stone and M.E. Monaco. 1991. Distribution andabundance of fishes and invertebrates in West Coast estuaries. Volume II: Species lifehistory summaries.
Eschmeyer,W., E. Herald and H. Hammann. 1983. Pacific Coast Fishes. HoughtonMifflin Co. Boston, Mass. 336 pp.
Forsberg, B., J. Johnson and S. Klug. 1977. Identification, distribution and notes onfood habits of fish and shellfish in Tillamook Bay, Oregon. Research Section, OregonDepartment of Fish and Wildlife, Federal aid progress report, Fisheries. 117 pp.
Garrison, K.J.,and B.S. Miller. 1982. Review of the early life history of Puget Soundfishes. Fish. Res. Inst., Univ. Wash., Seattle, WA 729 pp (FRI-UW-8216)
Gunderson, D.R., D. A. Armstrong, S. Yun-Bing, R.A. McConnaughey. 1990. Patterns ofestuarine use by juvenile English sole (Parophrys vetulus) and Dungeness crab (Cancermagister). Estuaries 13:59-71.
Hart, J. 1973. Pacific Fishes of Canada. Fisheries Research Board of Canada. Bull. 80.Ottawa, Canada. 740 pp.
Hart, J.L. 1973. Pacific fishes of Canada. Fish. Res. Bd. Can., Bull. 180. 740 pp.
85
Healey, M. 1982. Juvenile Pacific salmon in estuaries, the life support system. As citedin: V. S. Kennedy, ed., Estuaries Comparisons. Academic Press, Inc. New York, NY.
Healey, M. 1982. Juvenile Pacific salmon in estuaries, the life support system. As citedin V.S. Kennedy, ed., Estuaries comparisons. Academic Press, Inc., New York, NY.
Johnson , J.A., DlP. Liscia and D.M. Anderson. 1986. The seasonal occurrence anddistribution of fish in the Umpqua estuary, April 1977 through January 1986. UmpquaDistrict, ODFW, Roseburg, OR. 10 pp.
Johnson, R.A. (1992). Applied Multivariate Statistical Analysis, Third Edition. PrenticeHall, Inc., New Jersey.
Komar, P. 1997. Sediment accumulation in Tillamook Bay, Oregon, a large drowned-river estuary. Tillamook Bay National Estuary Project. Garibaldi, OR.
Kruse, G.H. and A.V. Tyler. 1983. Simulation of temperature and upwelling effects onthe English sole (Parophrys vetulus) spawning season. Can. J. Fish. Aquatic. Sci. 40:230-237.
Krygier, E.E. and W.G. Pearcy. 1986. The role of estuarine and offshore nursery areas foryoung English sole, Parophrys vetulus Girard, off Oregon. Fish. Bull U.S. 84:119-132.
Levy, D.A. and T.G. Northcote. 1982. Juvenile salmon residency in a marsh area of theFraser River Estuary. Can. J. Fish. Aquat. Sci. 39:270-276.
McErlean, A.J.,S.G. O'Connor, J.A. Mihursky and C.I. Gibson. 1973. Abundance,diversity and seasonal patterns of estuarine fish populations. Estuarine and CoastalMarine Science, 1:19-36.
Miller, J.A. and C.A. Simenstad. 1997. A comparative assessment of a natural andcreated estuarine slough as rearing habitat for juvenile chinook and coho salmon.Estuaries. 20:792-806.
Morrow, J.E. 1980. The freshwater fishes of Alaska. Alaska Northw. Publ. Co.,Anchorage,AK, 248 pp.
Moyle, P.B. 1976. Inland fishes of California. Univ. Calif. Press, Berkeley, CA. 405 pp.
Mullen, R.E. 1978. Fishes of the Salmon River estuary. ODFW, Information Report(Fish) 79-5, Portland, OR. 9 pp.
Newell, A. 1998. Chapter 4: Water Quality. In Tillamook Bay EnvironmentalCharacterization, A Scientific and Technical Summary. Ed. R. Hinzman and S. Nelson.Tillamook Bay National Estuary Project.
86
Nicholas, J., and D. Hankin. 1988. Chino salmon populations in Oregon coastal riverbasins: Description of the life histories and assessment of recent trends in run strengths.ODFW Information Report. 88-1. 359 pp.
Parker, R.R. 1962. Estimates of mortality rates for Pacific Salmon (Oncorhynchus). J.Fish. Res. Bd. Can. 19:561-589.
Parker, R.R. 1968. Marine mortality schedule of pink salmon of the Bella Coola River,central British Columbia. J. Fish. Res. Bd. Can. 25: 757-794.
Pearcy, W.G. and S.S. Myers. 1974. Larval fishes of Yaquina Bay, Oregon: a nurseryground for marine fishes? Fishery Bull. 72:201-213.
Pedersen, M., and G. DiDonato. 1982. Groundfish management plan for Washington'sinside waters. Prog. Rep. No. 170, Wash. Dept. Fish., Olympia, AW, 123 pp.
Peterman, R.M. 1978. Testing for density dependent marine survival in Pacificsalmonids. J. Fish. Res. Bd. Can. 35: 1435-1450.
Posey, M.H. 1986. Predation on burrowing shrimp: distribution and communityconsequences. J. Exp. Mar. Biol. Ecol. 103:143-161.
Reimers, P.E. 1973. The length of residence of juvenile fall chinook salmon in the SixesRiver, Oregon. P. 1-43in R.T. Gunsolous (ed.) Research Reports of the fisheriesCommission of Oregon, Portland, Oregon. 4:2.
Ricker, W.E. 1958. Handbook of computations for biological statistics of fishpopulations. Fish Res. Bd. Can. Bull. 119, 300 pp.
Sadro, S. 1999. Winchester tidelands monitoring report. South Slough National EstuarineResearch Reserve, Charleston, OR.
Shreffler, D.K., C.A. Simenstad, and R.M. Thom. 1990. Temporary residence by juvenilesalmon n a restored estuarine wetland. Can. J. Fish Aquat. Sci. 47: 2079-2084.
Simenstad, C. and D. Eggers. Ed. 1981. Juvenile salmonid and baitfish distribution,abundance, and prey resources in selected areas of Grays Harbor, Washington. GraysHarbor and Chehalis River improvements to navigation environmental studies. U.S.Army Corp of Engineers, Seattle, WA.
Simenstad, C., W. Kinney, S. Parker, E. Salo, J. Cordell, and H. Buechner. 1980. Preycommunity structure and trophic ecology of outmigrating juvenile chum and pink salmonin Hood Canal, Washington: A synthesis of three years' studies, 1977-1979. FinalReport, Fisheries Research Institute, University of Washington Seattle, WA. FRI-UW-8026. 113 pp.
87
Simenstad C.D., and E. Salo. 1982. Foraging success as a determinant of estuarine andnearshore carrying capacity of juvenile chum salmon, Oncorhynchus keta, in HoodCanal, Washington. As cited in: B.R. Miteff and R.A. Neve, ed., Proc. North PacificAquaculture Symposium Report 82-2. Alaska Sea Grant Progam, Universit of Alaska,Fairbanks AK.
Simenstad, C.A. and R.M. Thom. 1992. Restoring wetland habitats in urbanized PacificNorthwest estuaries. P. 423-472 In G.W. Thayer (ed.) Restoring the Nations MarineEnvironment, Maryland Sea Grant, College Park, Maryland.
Stevens, B. and D.A. Armstrong. 1984. Distribution, abundance and growth of juvenileDungeness crabs, Cancer magister, in Grays Harbor estuary, Washington U.S.A. Fish.Bull. U.S. 82:469-483.
Stout, H. editor. 1976. The natrual resources and human utilization of Netarts Bay,Oregon. National Science Foundation Grant EPP75, Oregon State University, Corvallis,OR, 247 pp.
Westerheim, S.J. 1955. Size composition, growth and seasonal abundance of juvenileEnglish sole (Parophrys vetulus) in Yaquina Bay. Research Brief, Fish Comm. Oreg.,7:4-9.
Wydoski, R.S. an R. R. Whitney. 1979. Inland Fishes of Washington. University ofWashington Press, Seattle, WA. 220 pp.

1
APPENDIX A. Water quality data collected concurrently with 1998 and 1999 fishsampling in Tillamook Bay.Date Location Sample
TypeTemp.(C)
Salinity(ppt)
D.O(mg/l)
Turbidity (NTUs)
pH Cond. Time TideStage
7/15/98 BS-1 BeachSeine
14.3 30.6 9.26 0 8.91 46.95 1151 outgoing
7/15/98 BS-2 BeachSeine
15.5 28.5 10.36 6.4 9.17 44.1 1331 incoming
7/15/98 BS-3 BeachSeine
14.5 30.6 6.28 8.1 8.98 47 1516 high tide
7/15/98 BS-4A BeachSeine
14.6 30.6 8.53 6.8 8.99 47.1 1557 high tide
7/15/98 BS-5 BeachSeine
15.8 28.9 7 40.6 8.92 44.6 1635 outgoing
7/15/98 BS-6 BeachSeine
22.5 17.8 10.8 12.7 8.97 28.8 1716 outgoing
7/15/98 BS-7 BeachSeine
21 18.2 9.85 NA 8.95 29.4 1745 outgoing
7/15/98 BS-8 BeachSeine
21.29 15.4 10.6 NA 8.96 25.26 1813 outgoing
10/13/98
BS-4A BeachSeine
13.6 13 10.8 4.6 6.31 21.7 NA NA
7/8/98 UR-8 RoundHaul
19.5 11 8.34 0 7.7 18.65 1652 NA
7/14/98 UR-1 RoundHaul
16.2 28 9.3 86.8 9 NA 1944 high tide
7/14/98 UR-3 RoundHaul
NotTaken
7/14/98 UR-5 RoundHaul
NotTaken
7/14/98 UR-6 RoundHaul
NotTaken
7/14/98 UR-7 RoundHaul
18.34 24.1 7.77 28.7 9.16 38.01 1810 high tide
7/14/98 UR-8 RoundHaul
18.73 22.3 9.13 57.3 9.13 35.45 1656 high tide
7/14/98 MR-1 RoundHaul
18.8 26 6.19 12.4 9.08 40.98 1850 high tide
7/16/98 MR-3 RoundHaul
16.4 29.6 14.3 9.4 8.71 45.6 1148
7/16/98 MR-5 RoundHaul
21.2 8.1 11.49 23.5 8.6 13.94 1347 Low tide
7/16/98 LR-1 RoundHaul
14.6 31.1 9.97 6.5 8.65 47.7 755 high tide
7/15/98 LR-3 RoundHaul
15.56 29.1 9.45 11.4 9.02 44.87 1430 incoming
7/16/98 LR-6 RoundHaul
15.3 30.6 9.43 10.5 8.68 46.91 857 high tide
7/16/98 LR-7 RoundHaul
15.8 30.4 9.48 6.7 8.66 46.64 1026
7/16/98 SheepCoral
RoundHaul
22 4.2 NA 15.9 8.69 7.5 1441 Low tide
7/27/98 UR-8 Round 20.7 25.9 8.49 3.4 7.38 40.4 1750 high tide

2
Haul6/23/98 F-1 Fyke Net 16.8 13.8 7 6 7.42 22.94 2145 high tide6/25/98 F-1 Fyke Net 15.2 14.2 6.42 6.4 7.52 23.35 1550 high tide6/25/98 F-2 Fyke Net 15.58 8 6.59 3.2 7.53 13.92 1558 outgoing
7/8/98 F-1 Fyke Net 20.1 6.5 6.4 NA 7.43 11.43 1453 high tide7/8/98 F-2 Fyke Net 20.3 2.2 6.85 NA 7.57 3.96 1501 high tide7/8/98 F-3 Fyke Net 17.38 2 9.32 NA 7.52 5.04 1440 high tide
7/27/98 F-1 Fyke Net 22.38 18.2 12.8 10 7.2 29.39 1745 high tide7/27/98 F-2 Fyke Net 23.6 10.9 10.83 14.2 7.32 18.38 1817 high tide7/27/98 F-3 Fyke Net Not
Taken9/25/98 F-1 Fyke Net 15.3 23.2 8.62 3.2 6.52 36.62 911 high tide9/25/98 F-2 Fyke Net 15.7 19.1 7.81 3.1 6.51 30.81 918 high tide9/25/98 F-3 Fyke Net 15.51 20.6 8.76 5.2 6.52 33.03 858 high tide
10/13/98
F-1 Fyke Net 12.4 2.9 9.76 11.2 6.14 5.66 911 high tide
10/13/98
F-2 Fyke Net 12.47 1.6 9.74 10.6 6.18 3 858 high tide
10/13/98
F-3 Fyke Net 12.5 1.9 10.97 10.8 6.21 3.6 926 high tide
7/24/98 T-1 Trawl 17.6 18.9 6.59 10.4 7.5 31.23 NA incoming7/24/98 T-2 Trawl Not
Taken7/24/98 T-3 Trawl Not
Taken7/24/98 T-4 Trawl 10.6 33.9 11.64 10.2 7.58 51.58 NA high tide7/24/98 T-5 Trawl 10.6 34.4 11.1 0 7.46 52.07 NA high tide
8/8/98 T-1 Trawl 17 NA NA NA NA NA NA Low tide8/8/98 T-3 Trawl 16 NA NA NA NA NA NA Low tide8/8/98 T-4 Trawl 16 NA NA NA NA NA NA Low tide8/8/98 T-5 Trawl 16 NA NA NA NA NA NA Low tide
Appendix A Continued. Water quality data for 1999 sampling season.Date Location Gear Water
Temp.(0C)
Salinity(ppt)
Conductivity Time Tide Stage
4/29/99 UB-E1 Beach Seine 13.3 3.8 6.35 1500 High4/29/99 UB-E2 Beach Seine 12.8 12.1 21.32 1332 Near High4/29/99 UB-E3 Beach Seine 12.1 13.0 20.95 1255 Incoming4/27/99 UB-W1 Beach Seine 9.9 15.2 25.63 1300 Near High4/27/99 UB-W2 Bach Seine 11.0 15.8 25.99 1326 Near High4/27/99 UB-W3 Beach Seine 13.6 18.0 29.21 1422 High4/29/99 MB-E1 Beach Seine 12.1 21.5 34.24 1145 Incoming4/29/99 MB-E2 Beach Seine 12.5 16.1 26.43 1235 Incoming4/28/99 MB-E3 Beach Seine 12.2 18.0 29.06 1500 Outgoing4/27/99 MB-W1 Beach Seine 10.7 22.3 35.41 1400 Outgoing4/28/99 MB-W2 Beach Seine 12.6 26.9 41.9 1406 High4/28/99 MB-W3 Beach Seine 10.8 28.4 43.56 1333 Near High4/28/99 LB-E1 Beach Seine 10.3 28.2 43.77 1100 Incoming4/28/99 LB-E2 Beach Seine 10.8 28.6 43.93 1207 Incoming4/28/99 LB-E3 Beach Seine 10.6 29.8 45.77 1242 Incoming4/27/99 LB-W1 Beach Seine 9.7 31.8 48.57 1030 Incoming

3
Date Location Gear WaterTemp.
(0C)
Salinity(ppt)
Conductivity Time Tide Stage
4/27/99 LB-W2 Beach Seine 9.7 23.9 37.68 1147 High4/27/99 LB-W3 Beach Seine 10.5 28.7 44.37 1445 Outgoing
5/11/99 UB-E1 Beach Seine 9.7 0.0 0.11 1400 Outgoing5/10/99 UB-E2 Beach Seine 7.8 0.1 0.16 10075/10/99 UB-E3 Beach Seine 8.3 1.4 3.00 NA Near High5/11/99 UB-W1 Beach Seine 11.2 4.6 8.29 1105 High5/12/99 UB-W2 Bach Seine 13.2 15.1 24.96 1320 Outgoing5/12/99 UB-W3 Beach Seine 12.6 17.5 28.33 1253 Outgoing5/11/99 MB-E1 Beach Seine 11.7 18.6 30.04 0800 Incoming5/10/99 MB-E2 Beach Seine 11.8 16.9 27.55 1120 Outgoing5/10/99 MB-E3 Beach Seine 12.0 16.5 26.92 1050 Near High5/12/99 MB-W1 Beach Seine 11.8 20.3 32.58 1100 High5/12/99 MB-W2 Beach Seine 11.8 21.3 34.04 1040 Near High5/12/99 MB-W3 Beach Seine 11.6 24.2 38.15 1004 Incoming5/10/99 LB-E1 Beach Seine 11.0 9.3 16.13 NA NA5/10/99 LB-E2 Beach Seine 10.3 12.2 20.61 1207 Outgoing5/12/99 LB-E3 Beach Seine 11.1 29.5 45.48 1014 High5/11/99 LB-W1 Beach Seine 10.9 29.9 45.94 0845 Incoming5/11/99 LB-W2 Beach Seine 11.7 23.0 36.45 1230 Outgoing5/11/99 LB-W3 Beach Seine 11.7 20.6 32.89 1210 Outgoing
5/25/99 UB-E1 Beach Seine 14.3 0.0 0.06 1415 Outgoing5/27/99 UB-E2 Beach Seine 17.6 2.6 4.68 1130 Incoming5/27/99 UB-E3 Beach Seine 14.5 5.4 9.39 1045 Incoming5/26/99 UB-W1 Beach Seine 15.5 11.6 19.67 1145 Near High5/26/99 UB-W2 Bach Seine 15.8 12.8 21.37 1239 High5.26/99 UB-W3 Beach Seine 14.6 11.7 19.7 1315 Near High5/27/99 MB-E1 Beach Seine 13.7 11.8 20.8 0945 Incoming5/25/99 MB-E2 Beach Seine 15.5 14.1 23.55 1300 Outgoing5/27/99 MB-E3 Beach Seine 13.9 8.4 14.62 1015 Incoming5/26/99 MB-W1 Beach Seine 17.1 21.1 33.73 1300 Outgoing5/27/99 MB-W2 Beach Seine 17.2 24.8 38.89 1250 High5/26/99 MB-W3 Beach Seine 12.3 29.4 45.16 NA Outgoing5/25/99 LB-E1 Beach Seine 12.3 18.2 28.54 1015 Near High5/25/99 LB-E2 Beach Seine 12.3 18.2 28.54 0955 Incoming5/26/99 LB-E3 Beach Seine 9.8 32.6 49.70 1000 Incoming5/26/99 LB-W1 Beach Seine 10.0 32.0 49.56 0920 Incoming5/26/99 LB-W2 Beach Seine 13.0 26.1 40.76 1025 Near High5/26/99 LB-W3 Beach Seine 12.1 30.6 46.97 1400 Outgoing
6/14/99 UB-E1 Beach Seine 19.0 6.5 11.75 1815 Outgoing6/14/99 UB-E2 Beach Seine 18.1 16.8 27.44 1430 Incoming6/14/99 UB-E3 Beach Seine 17.2 19.5 31.39 1410 Incoming6/16/99 UB-W1 Beach Seine 21.4 18.4 29.79 1510 Near High6/15/99 UB-W2 Bach Seine 16.2 27.1 42.23 1845 Outgoing6/15/99 UB-W3 Beach Seine 16.2 26.4 41.18 1820 Outgoing6/15/99 MB-E1 Beach Seine 16.3 22.1 34.74 1240 Incoming6/14/99 MB-E2 Beach Seine 18.3 19.9 31.70 1630 Outgoing6/14/99 MB-E3 Beach Seine 16.6 19.2 30.89 1515 Incoming6/16/99 MB-W1 Beach Seine 19.4 23.7 37.39 1400 Incoming
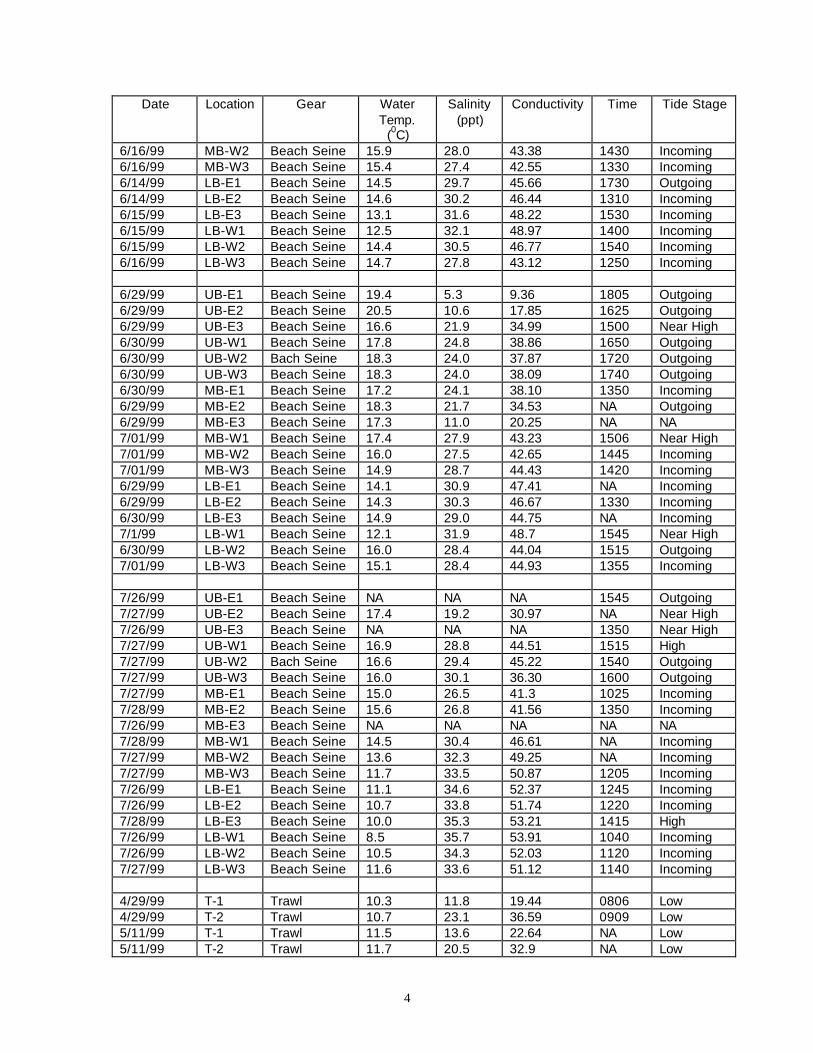
4
Date Location Gear WaterTemp.
(0C)
Salinity(ppt)
Conductivity Time Tide Stage
6/16/99 MB-W2 Beach Seine 15.9 28.0 43.38 1430 Incoming6/16/99 MB-W3 Beach Seine 15.4 27.4 42.55 1330 Incoming6/14/99 LB-E1 Beach Seine 14.5 29.7 45.66 1730 Outgoing6/14/99 LB-E2 Beach Seine 14.6 30.2 46.44 1310 Incoming6/15/99 LB-E3 Beach Seine 13.1 31.6 48.22 1530 Incoming6/15/99 LB-W1 Beach Seine 12.5 32.1 48.97 1400 Incoming6/15/99 LB-W2 Beach Seine 14.4 30.5 46.77 1540 Incoming6/16/99 LB-W3 Beach Seine 14.7 27.8 43.12 1250 Incoming
6/29/99 UB-E1 Beach Seine 19.4 5.3 9.36 1805 Outgoing6/29/99 UB-E2 Beach Seine 20.5 10.6 17.85 1625 Outgoing6/29/99 UB-E3 Beach Seine 16.6 21.9 34.99 1500 Near High6/30/99 UB-W1 Beach Seine 17.8 24.8 38.86 1650 Outgoing6/30/99 UB-W2 Bach Seine 18.3 24.0 37.87 1720 Outgoing6/30/99 UB-W3 Beach Seine 18.3 24.0 38.09 1740 Outgoing6/30/99 MB-E1 Beach Seine 17.2 24.1 38.10 1350 Incoming6/29/99 MB-E2 Beach Seine 18.3 21.7 34.53 NA Outgoing6/29/99 MB-E3 Beach Seine 17.3 11.0 20.25 NA NA7/01/99 MB-W1 Beach Seine 17.4 27.9 43.23 1506 Near High7/01/99 MB-W2 Beach Seine 16.0 27.5 42.65 1445 Incoming7/01/99 MB-W3 Beach Seine 14.9 28.7 44.43 1420 Incoming6/29/99 LB-E1 Beach Seine 14.1 30.9 47.41 NA Incoming6/29/99 LB-E2 Beach Seine 14.3 30.3 46.67 1330 Incoming6/30/99 LB-E3 Beach Seine 14.9 29.0 44.75 NA Incoming7/1/99 LB-W1 Beach Seine 12.1 31.9 48.7 1545 Near High6/30/99 LB-W2 Beach Seine 16.0 28.4 44.04 1515 Outgoing7/01/99 LB-W3 Beach Seine 15.1 28.4 44.93 1355 Incoming
7/26/99 UB-E1 Beach Seine NA NA NA 1545 Outgoing7/27/99 UB-E2 Beach Seine 17.4 19.2 30.97 NA Near High7/26/99 UB-E3 Beach Seine NA NA NA 1350 Near High7/27/99 UB-W1 Beach Seine 16.9 28.8 44.51 1515 High7/27/99 UB-W2 Bach Seine 16.6 29.4 45.22 1540 Outgoing7/27/99 UB-W3 Beach Seine 16.0 30.1 36.30 1600 Outgoing7/27/99 MB-E1 Beach Seine 15.0 26.5 41.3 1025 Incoming7/28/99 MB-E2 Beach Seine 15.6 26.8 41.56 1350 Incoming7/26/99 MB-E3 Beach Seine NA NA NA NA NA7/28/99 MB-W1 Beach Seine 14.5 30.4 46.61 NA Incoming7/27/99 MB-W2 Beach Seine 13.6 32.3 49.25 NA Incoming7/27/99 MB-W3 Beach Seine 11.7 33.5 50.87 1205 Incoming7/26/99 LB-E1 Beach Seine 11.1 34.6 52.37 1245 Incoming7/26/99 LB-E2 Beach Seine 10.7 33.8 51.74 1220 Incoming7/28/99 LB-E3 Beach Seine 10.0 35.3 53.21 1415 High7/26/99 LB-W1 Beach Seine 8.5 35.7 53.91 1040 Incoming7/26/99 LB-W2 Beach Seine 10.5 34.3 52.03 1120 Incoming7/27/99 LB-W3 Beach Seine 11.6 33.6 51.12 1140 Incoming
4/29/99 T-1 Trawl 10.3 11.8 19.44 0806 Low4/29/99 T-2 Trawl 10.7 23.1 36.59 0909 Low5/11/99 T-1 Trawl 11.5 13.6 22.64 NA Low5/11/99 T-2 Trawl 11.7 20.5 32.9 NA Low

5
Date Location Gear WaterTemp.
(0C)
Salinity(ppt)
Conductivity Time Tide Stage
5/26/99 T-1 Trawl 16.0 7.4 12.91 1745 Low5/26/99 T-2 Trawl 16.1 9.3 16.0 1750 Low6/16/99 T-1 Trawl 16.2 10.7 18.12 1030 Low6/16/99 T-2 Trawl 16.2 16.7 27.29 1055 Low6/30/99 T-1 Trawl 16.6 20.4 32.67 1032 Low6/30/99 T-2 Trawl 15.0 27.7 43.00 1123 Low7/28/99 T-1 Trawl 15.6 21.9 34.80 0755 Low7/28/99 T-2 Trawl 15.5 23.3 36.76 0830 Low
4/13/99 F-1 Fyke 9.7 0.0 0.08 1715 High4/12/99 F-2 Fyke NA NA NA NA High4/12/99 F-3 Fyke NA NA NA NA High4/12/99 F-4 Fyke 10.2 0.5 0.08 1550 High4/13/99 F-5 Fyke 10.2 0.5 0.08 1600 High4/13/99 F-6 Fyke NA 1.1 2.09 1615 High
4/23/99 F-1 Fyke NA NA NA NA High4/23/99 F-2 Fyke NA NA NA NA High4/24/99 F-3 Fyke 10.3 0.6 1.12 0945 High4/24/99 F-4 Fyke NA NA NA NA High4/24/99 F-5 Fyke 11.2 0.5 0.94 1000 High4/23/99 F-6 Fyke NA NA NA NA High
5/11/99 F-1 Fyke 9.8 0.3 0.66 1005 High5/11/99 F-2 Fyke 9.0 0.1 0.18 1030 High5/10/99 F-3 Fyke 8.9 1.0 1.74 0936 High5/10/99 F-4 Fyke 8.1 0.5 0.97 0927 High5/10/99 F-5 Fyke 7.9 0.2 0.33 0917 High5/11/99 F-6 Fyke 10.5 0.3 0.67 1015 High
5/25/99 F-1 Fyke 14.3 0.8 1.52 1155 High5/25/99 F-2 Fyke 13.1 0.2 0.42 1130 High5/27/99 F-3 Fyke 18.2 1.1 2.13 1350 High5/27/99 F-4 Fyke 19.3 1.0 1.95 1330 High5/27/99 F-5 Fyke 17.5 0.4 0.85 1340 High
F-6 Fyke
6/15/99 F-1 Fyke 18.1 14.7 24.32 1150 High6/15/99 F-2 Fyke 18.3 8.4 14.60 2000 Outgoing6/14/99 F-3 Fyke 18.4 4.3 7.67 1600 Near High6/14/99 F-4 Fyke 18.3 6.5 11.45 1550 Near High6/14/99 F-5 Fyke 18.8 7.1 12.44 1520 High6/15/99 F-6 Fyke 18.1 14.7 24.30 1640 Outgoing
6/29/99 F-1 Fyke 19.6 9.1 15.54 1535 High6/29/99 F-2 Fyke 21.7 4.6 8.11 1555 High6/30/99 F-3 Fyke 18.6 2.4 4.41 NA High6/30/99 F-4 Fyke 18.1 3.9 6.98 1607 High6/30/99 F-5 Fyke 18.2 5.2 9.24 1600 High6/29/99 F-6 Fyke 21.8 4.9 8.83 1525 High

6
Date Location Gear WaterTemp.
(0C)
Salinity(ppt)
Conductivity Time Tide Stage
7/27/99 F-1 Fyke 17.9 17.0 27.71 1410 High7/27/99 F-2 Fyke 18.5 14.4 23.93 1420 High7/27/99 F-3 Fyke 18.7 5.2 9.14 1325 High7/27/99 F-4 Fyke 18.8 4.5 8.04 1330 High7/27/99 F-5 Fyke 18.0 11.4 19.19 1335 High7/27/99 F-6 Fyke 18.8 10.0 17.06 1345 High
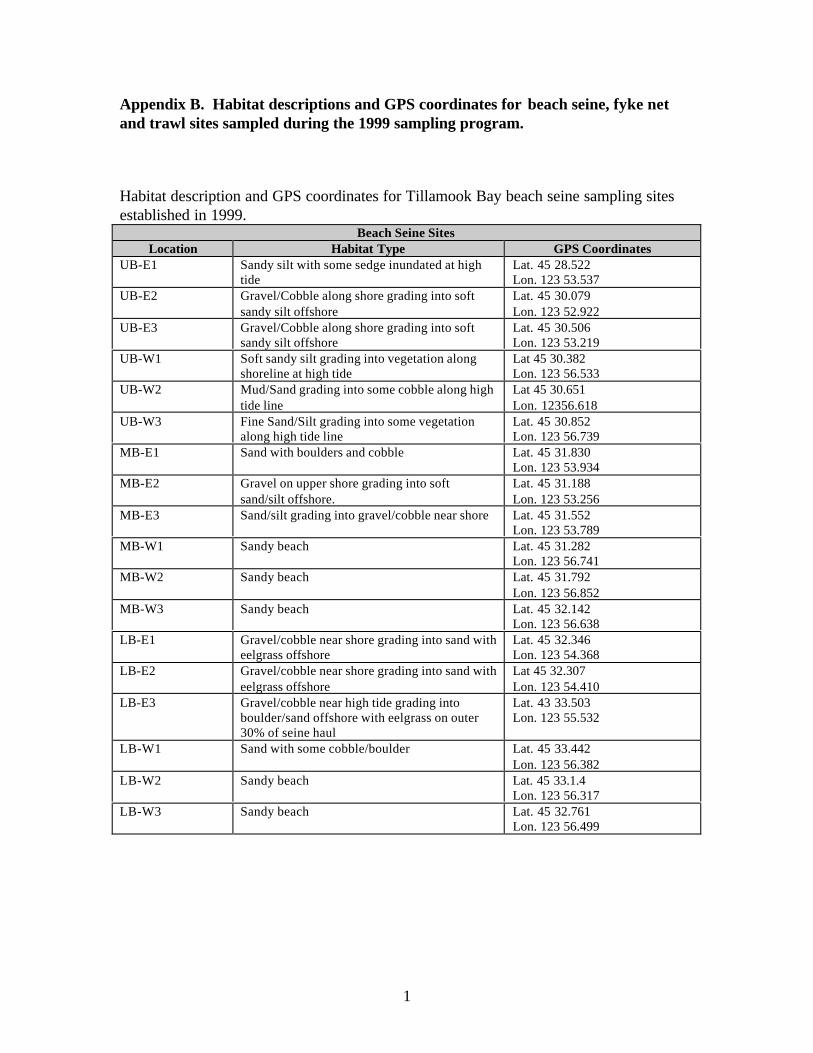
1
Appendix B. Habitat descriptions and GPS coordinates for beach seine, fyke netand trawl sites sampled during the 1999 sampling program.
Habitat description and GPS coordinates for Tillamook Bay beach seine sampling sitesestablished in 1999.
Beach Seine SitesLocation Habitat Type GPS Coordinates
UB-E1 Sandy silt with some sedge inundated at hightide
Lat. 45 28.522Lon. 123 53.537
UB-E2 Gravel/Cobble along shore grading into softsandy silt offshore
Lat. 45 30.079Lon. 123 52.922
UB-E3 Gravel/Cobble along shore grading into softsandy silt offshore
Lat. 45 30.506Lon. 123 53.219
UB-W1 Soft sandy silt grading into vegetation alongshoreline at high tide
Lat 45 30.382Lon. 123 56.533
UB-W2 Mud/Sand grading into some cobble along hightide line
Lat 45 30.651Lon. 12356.618
UB-W3 Fine Sand/Silt grading into some vegetationalong high tide line
Lat. 45 30.852Lon. 123 56.739
MB-E1 Sand with boulders and cobble Lat. 45 31.830Lon. 123 53.934
MB-E2 Gravel on upper shore grading into softsand/silt offshore.
Lat. 45 31.188Lon. 123 53.256
MB-E3 Sand/silt grading into gravel/cobble near shore Lat. 45 31.552Lon. 123 53.789
MB-W1 Sandy beach Lat. 45 31.282Lon. 123 56.741
MB-W2 Sandy beach Lat. 45 31.792Lon. 123 56.852
MB-W3 Sandy beach Lat. 45 32.142Lon. 123 56.638
LB-E1 Gravel/cobble near shore grading into sand witheelgrass offshore
Lat. 45 32.346Lon. 123 54.368
LB-E2 Gravel/cobble near shore grading into sand witheelgrass offshore
Lat 45 32.307Lon. 123 54.410
LB-E3 Gravel/cobble near high tide grading intoboulder/sand offshore with eelgrass on outer30% of seine haul
Lat. 43 33.503Lon. 123 55.532
LB-W1 Sand with some cobble/boulder Lat. 45 33.442Lon. 123 56.382
LB-W2 Sandy beach Lat. 45 33.1.4Lon. 123 56.317
LB-W3 Sandy beach Lat. 45 32.761Lon. 123 56.499

2
Appendix B continued.
Habitat description and GPS coordinates for Tillamook Bay fyke net sampling sitesestablished in 1998 (F-1 through F-3 and 1999 (F-4 through F-6).
Fyke Net SitesLocation Habitat Type GPS coordinates
F-1 Lower Salt Marsh Lat 45 29.092Lon. 123 53.566
F-2 Upper Salt Marsh Lat 45 28.869Lon. 123 53.420
F-3 Upper Salt MarshF-4 Upper Salt MarshF-5 Lower Salt MarshF-6 Lower Salt Marsh Lat. 45 29.107
Lon. 123 53.434
Habitat description and GPS coordinates for Tillamook Bay trawl sampling transectsestablished in 1999.
Trawl TransectsLocation Habitat Type GPS Coordinates for starting
points on each transectT-1, replicate #1 Subtidal Channel, gravel and
shellLat. 45 32.600Lon. 123 54.250
T-1, replicate #2 Subtidal Channel, gravel andshell
Lat. 45 32.548Lon. 123 54.211
T-2, replicate #1 Subtidal Channel, pea gravel andshell
Lat. 45 33.196Lon. 123 55.235
T-2, replicate #2 Subtidal Channel, pea gravel andshell
Lat. 45 33.193Lon. 123 55.239

1
Appendix C. Total beach seine, trawl, fyke net and round-haul net catch by stationand sampling date.
1998 BEACH SEINE CATCH DATA
Numbers of fish caught at beach seine sampling sites in Tillamook Bay July 14 -15 1998.SPECIES B1 B2 B3 B4a B5 B6 B7 B8 B9 B10 B11Bay Pipefish 1Chinook Salmon 18 4 11English Sole 6 6 204 9 1 6Greenling sp. 1Pacific Herring 1Pacific Sanddab 1 12 2Pacific Staghorn Sculpin 2 2 218 29 5 17 74 33 13 11Padded Sculpin 2Prickley Sculpin 22 51 3Rockweed Gunnel 1Saddleback Gunnel 1 3Shiner Perch 1 1 17 357 3 2Starry Flounder 10 3 4 3 8Striped Surfperch 3 2Surf Smelt 129Threespine Stickleback 7 59 2Tidepool Sculpin 42Top Smelt
Numbers of fish caught in Tillamook Bay at beach seine sites B4a and B4b in November1998.
B4a B4bSPECIESNov. 13 1998 Nov. 13 1998 Nov. 14 1998
Bay Pipefish 5 9Chinook Salmon 2 4 9Coho Salmon 1Pacific Herring 8 2Pacific Sanddab 1Pacific Staghorn Sculpin 28 17 20Rockfish sp. 1Rockweed Gunnel 1Saddleback Gunnel 2Shiner Perch 5Starry Flounder 1Surf Smelt 1 16Threespine Stickleback 1Tubesnout 3
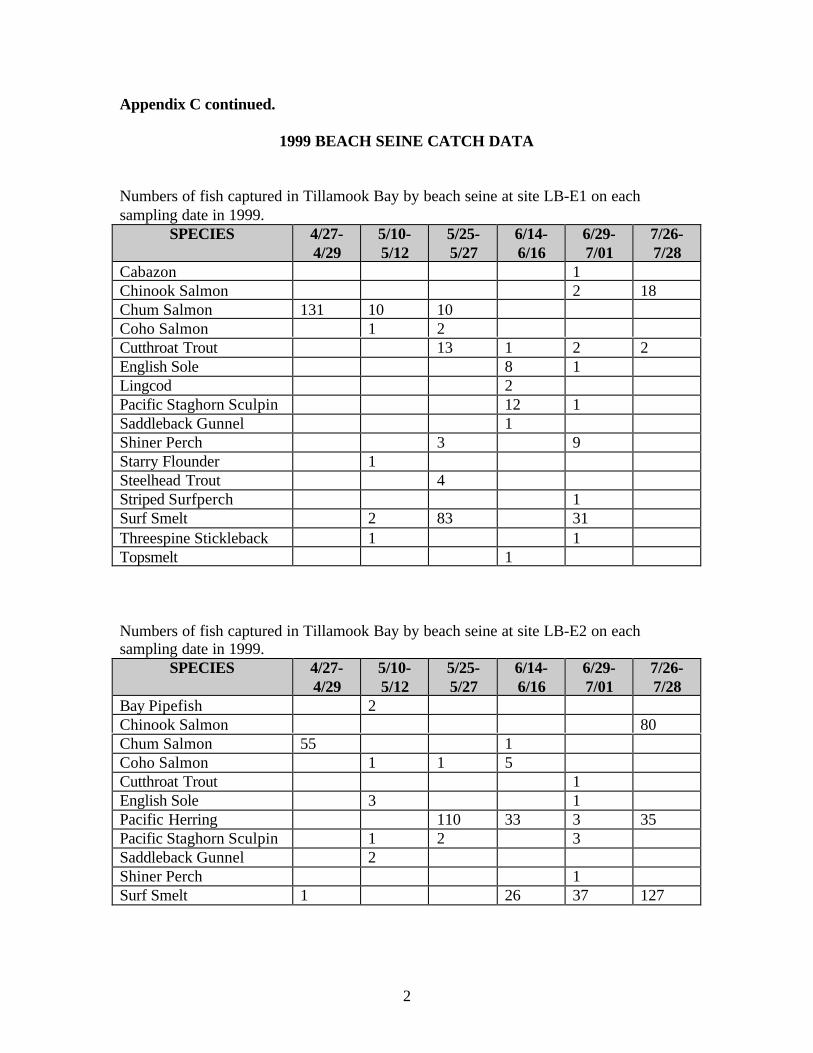
2
Appendix C continued.
1999 BEACH SEINE CATCH DATA
Numbers of fish captured in Tillamook Bay by beach seine at site LB-E1 on eachsampling date in 1999.
SPECIES 4/27-4/29
5/10-5/12
5/25-5/27
6/14-6/16
6/29-7/01
7/26-7/28
Cabazon 1Chinook Salmon 2 18Chum Salmon 131 10 10Coho Salmon 1 2Cutthroat Trout 13 1 2 2English Sole 8 1Lingcod 2Pacific Staghorn Sculpin 12 1Saddleback Gunnel 1Shiner Perch 3 9Starry Flounder 1Steelhead Trout 4Striped Surfperch 1Surf Smelt 2 83 31Threespine Stickleback 1 1Topsmelt 1
Numbers of fish captured in Tillamook Bay by beach seine at site LB-E2 on eachsampling date in 1999.
SPECIES 4/27-4/29
5/10-5/12
5/25-5/27
6/14-6/16
6/29-7/01
7/26-7/28
Bay Pipefish 2Chinook Salmon 80Chum Salmon 55 1Coho Salmon 1 1 5Cutthroat Trout 1English Sole 3 1Pacific Herring 110 33 3 35Pacific Staghorn Sculpin 1 2 3Saddleback Gunnel 2Shiner Perch 1Surf Smelt 1 26 37 127

3
Appendix C continued.
Numbers of fish captured in Tillamook Bay by beach seine at site LB-E3 on eachsampling date in 1999.
SPECIES 4/27-4/29
5/10-5/12
5/25-5/27
6/14-6/16
6/29-7/01
7/26-7/28
Chinook Salmon 34Chum Salmon 27 5 7 4 16Pacific Sand Lance 2 1Pacific Sanddab 7Saddleback Gunnel 1 1Shiner Perch 13Striped Surfperch 1Surf Smelt 15Tidepool Sculpin 3 9 7 13Unidentified Sculpin 1
Numbers of fish captured in Tillamook Bay by beach seine at site LB-W1 on eachsampling date in 1999.
SPECIES 4/27-4/29
5/10-5/12
5/25-5/27
6/14-6/16
6/29-7/01
7/26-7/28
Chum Salmon 75 1 2Coho Salmon 1Lingcod 1Pacific Herring 479 258Pacific Sand Lance 60 111 1Pacific Staghorn Sculpin 1 1Shiner Perch 18Tidepool Sculpin 1 1Topsmelt 7
Numbers of fish captured in Tillamook Bay by beach seine at site LB-W2 on eachsampling date in 1999.
SPECIES 4/27-4/29
5/10-5/12
5/25-5/27
6/14-6/16
6/29-7/01
7/26-7/28
Chinook Salmon 1Chum Salmon 17 3 6Coho Salmon 1English Sole 2 11 29 8 236 258Pacific Staghorn Sculpin 7 21 73 81 86 37Starry Flounder 1 1Surf Smelt 1Topsmelt 1

4
Appendix C continued.
Numbers of fish captured in Tillamook Bay by beach seine at site LB-W3 on eachsampling date in 1999.
SPECIES 4/27-4/29
5/10-5/12
5/25-5/27
6/14-6/16
6/29-7/01
7/26-7/28
Chinook Salmon 1 24Chum Salmon 4 10English Sole 11 6 14 54 21Pacific Herring 33 85Pacific Staghorn Sculpin 2 7 1Sand Sole 1Steelhead Trout 1Surf Smelt 41 1 430 98 332Threespine Stickleback 1
Numbers of fish captured in Tillamook Bay by beach seine at site MB-E1 on eachsampling date in 1999.
SPECIES 4/27-4/29
5/10-5/12
5/25-5/27
6/14-6/16
6/29-7/01
7/26-7/28
Chinook Salmon 3 4English Sole 1 1 16Pacific Herring 1 10Pacific Staghorn Sculpin 1 1 9 2 3Shiner Perch 12Starry Flounder 2
Numbers of fish captured in Tillamook Bay by beach seine at site MB-E2 on eachsampling date in 1999.
SPECIES 4/27-4/29
5/10-5/12
5/25-5/27
6/14-6/16
6/29-7/01
7/26-7/28
Chinook Salmon 1Chum Salmon 1Coho Salmon 1English Sole 1Pacific Herring 24Pacific Sand LancePacific SanddabPacific Staghorn Sculpin 110 5 9 2 11 9Shiner Perch 226 107Starry Flounder 1 1 1Surf Smelt 5 13Threespine Stickleback 1

5
Appendix C continued.
Numbers of fish captured in Tillamook Bay by beach seine at site MB-E3 on eachsampling date in 1999.
SPECIES 4/27-4/29
5/10-5/12
5/25-5/27
6/14-6/16
6/29-7/01
7/26-7/28
Bay Pipefish 1Chinook Salmon 1Chum Salmon 1 1Coho Salmon 1 1 1 17English Sole 1 1 1Pacific Staghorn Sculpin 47 68 7 1 8 16Shiner Perch 76 1Starry Flounder 1 3Surf Smelt 46 3 15Threespine Stickleback 3 2 1
Numbers of fish captured in Tillamook Bay by beach seine at site MB-W1 on eachsampling date in 1999.
SPECIES 4/27-4/29
5/10-5/12
5/25-5/27
6/14-6/16
6/29-7/01
7/26-7/28
Arrow Goby 4Chum Salmon 123Pacific Staghorn Sculpin 19 24 79 28 44 10Shiner Perch 5Starry Flounder 2 2 17Topsmelt 1
Numbers of fish captured in Tillamook Bay by beach seine at site MB-W2 on eachsampling date in 1999.
SPECIES 4/27-4/29
5/10-5/12
5/25-5/27
6/14-6/16
6/29-7/01
7/26-7/28
Chum Salmon 5 1Pacific Staghorn Sculpin 81 89 93 82 26 21Starry Flounder 73
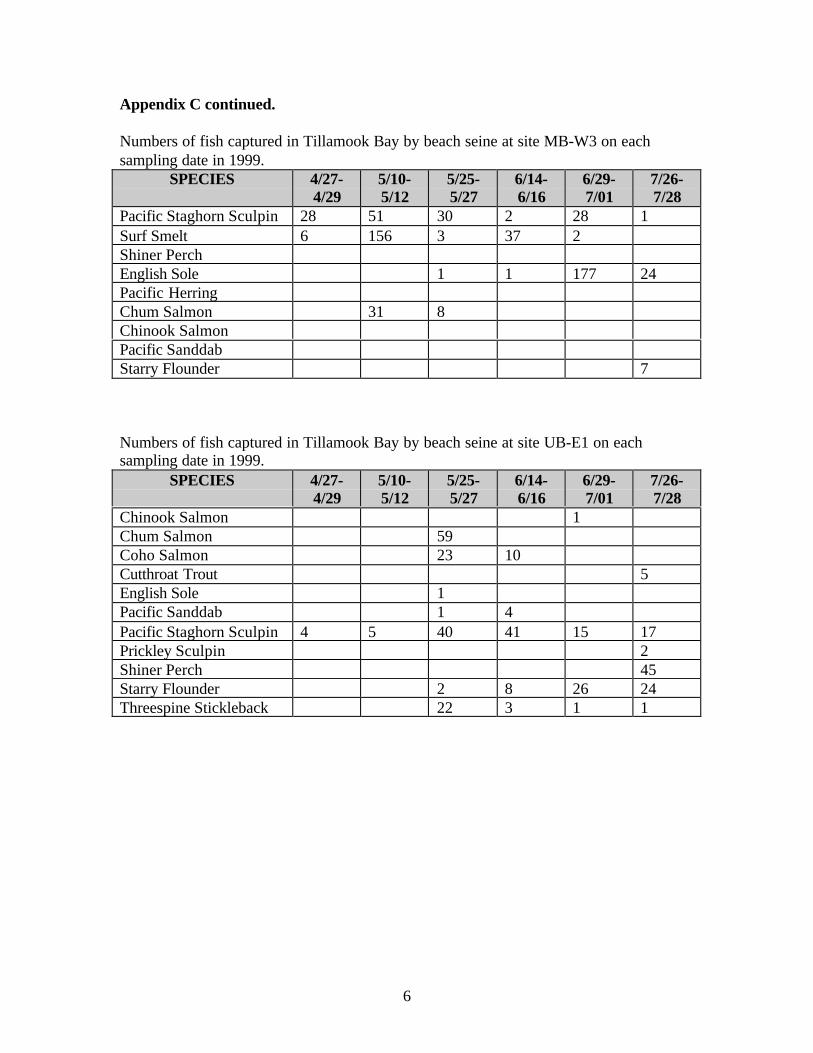
6
Appendix C continued.
Numbers of fish captured in Tillamook Bay by beach seine at site MB-W3 on eachsampling date in 1999.
SPECIES 4/27-4/29
5/10-5/12
5/25-5/27
6/14-6/16
6/29-7/01
7/26-7/28
Pacific Staghorn Sculpin 28 51 30 2 28 1Surf Smelt 6 156 3 37 2Shiner PerchEnglish Sole 1 1 177 24Pacific HerringChum Salmon 31 8Chinook SalmonPacific SanddabStarry Flounder 7
Numbers of fish captured in Tillamook Bay by beach seine at site UB-E1 on eachsampling date in 1999.
SPECIES 4/27-4/29
5/10-5/12
5/25-5/27
6/14-6/16
6/29-7/01
7/26-7/28
Chinook Salmon 1Chum Salmon 59Coho Salmon 23 10Cutthroat Trout 5English Sole 1Pacific Sanddab 1 4Pacific Staghorn Sculpin 4 5 40 41 15 17Prickley Sculpin 2Shiner Perch 45Starry Flounder 2 8 26 24Threespine Stickleback 22 3 1 1

7
Appendix C continued.
Numbers of fish captured in Tillamook Bay by beach seine at site UB-E2 on eachsampling date in 1999.
SPECIES 4/27-4/29
5/10-5/12
5/25-5/27
6/14-6/16
6/29-7/01
7/26-7/28
Chinook Salmon 7 6Chum Salmon 21 1Coho Salmon 8 12 1Cutthroat Trout 11 1 5English Sole 2Pacific Herring 1 1Pacific Staghorn Sculpin 1 1Prickley Sculpin 2Shiner Perch 3 1 12Starry Flounder 1Steelhead Trout 2Threespine Stickleback 4 2 22 1
Numbers of fish captured in Tillamook Bay by beach seine at site UB-E3 on eachsampling date in 1999.
SPECIES 4/27-4/29
5/10-5/12
5/25-5/27
6/14-6/16
6/29-7/01
7/26-7/28
American Shad 2Chinook Salmon 7 3Chum Salmon 5 1Coho Salmon 3 2 1English Sole 2 1 1Pacific Herring 1 6Pacific Staghorn Sculpin 16 2 20 16 22Saddleback Gunnel 1 3Shiner Perch 5 3 100 777Starry Flounder 1Threespine Stickleback 9 3 2

8
Appendix C continued.
Numbers of fish captured in Tillamook Bay by beach seine at site UB-W1 on eachsampling date in 1999.
SPECIES 4/27-4/29
5/10-5/12
5/25-5/27
6/14-6/16
6/29-7/01
7/26-7/28
Chinook Salmon 1Chum Salmon 46 1 1Coho Salmon 2Pacific Staghorn Sculpin 12 63 34 38 14 16Shiner Perch 2 25 127Surf Smelt 4Threespine Stickleback 1Topsmelt 2
Numbers of fish captured in Tillamook Bay by beach seine at site UB-W2 on eachsampling date in 1999.
SPECIES 4/27-4/29
5/10-5/12
5/25-5/27
6/14-6/16
6/29-7/01
7/26-7/28
Bay Pipefish 1Chinook Salmon 1Chum Salmon 1 1English Sole 3Pacific Herring 94Pacific Staghorn Sculpin 1 14 42 18 14Shiner Perch 104 16 13Starry Flounder 1 7Surf Smelt 14 992 2 2 4
Numbers of fish captured in Tillamook Bay by beach seine at site UB-W3 on eachsampling date in 1999.SPECIES 4/27-
4/295/10-5/12
5/25-5/27
6/14-6/16
6/29-7/01
7/26-7/28
Arrow Goby 8Chum Salmon 4 3 2Coho Salmon 1Northern Anchovy 1Pacific Herring 156Pacific Staghorn Sculpin 29 124 43 101 11Shiner Perch 1 2 39Starry Flounder 1Surf Smelt 6 40 5 1Threespine Stickleback 1Topsmelt 3 1 1
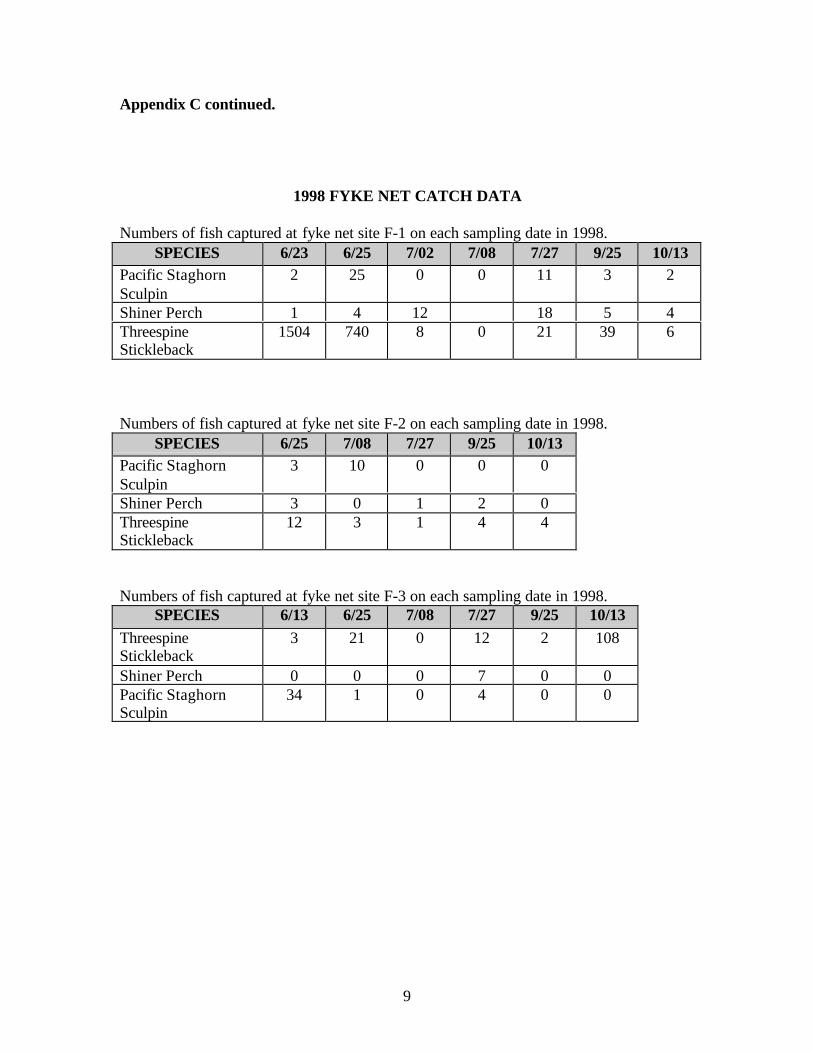
9
Appendix C continued.
1998 FYKE NET CATCH DATA
Numbers of fish captured at fyke net site F-1 on each sampling date in 1998.SPECIES 6/23 6/25 7/02 7/08 7/27 9/25 10/13
Pacific StaghornSculpin
2 25 0 0 11 3 2
Shiner Perch 1 4 12 18 5 4ThreespineStickleback
1504 740 8 0 21 39 6
Numbers of fish captured at fyke net site F-2 on each sampling date in 1998.SPECIES 6/25 7/08 7/27 9/25 10/13
Pacific StaghornSculpin
3 10 0 0 0
Shiner Perch 3 0 1 2 0ThreespineStickleback
12 3 1 4 4
Numbers of fish captured at fyke net site F-3 on each sampling date in 1998.SPECIES 6/13 6/25 7/08 7/27 9/25 10/13
ThreespineStickleback
3 21 0 12 2 108
Shiner Perch 0 0 0 7 0 0Pacific StaghornSculpin
34 1 0 4 0 0
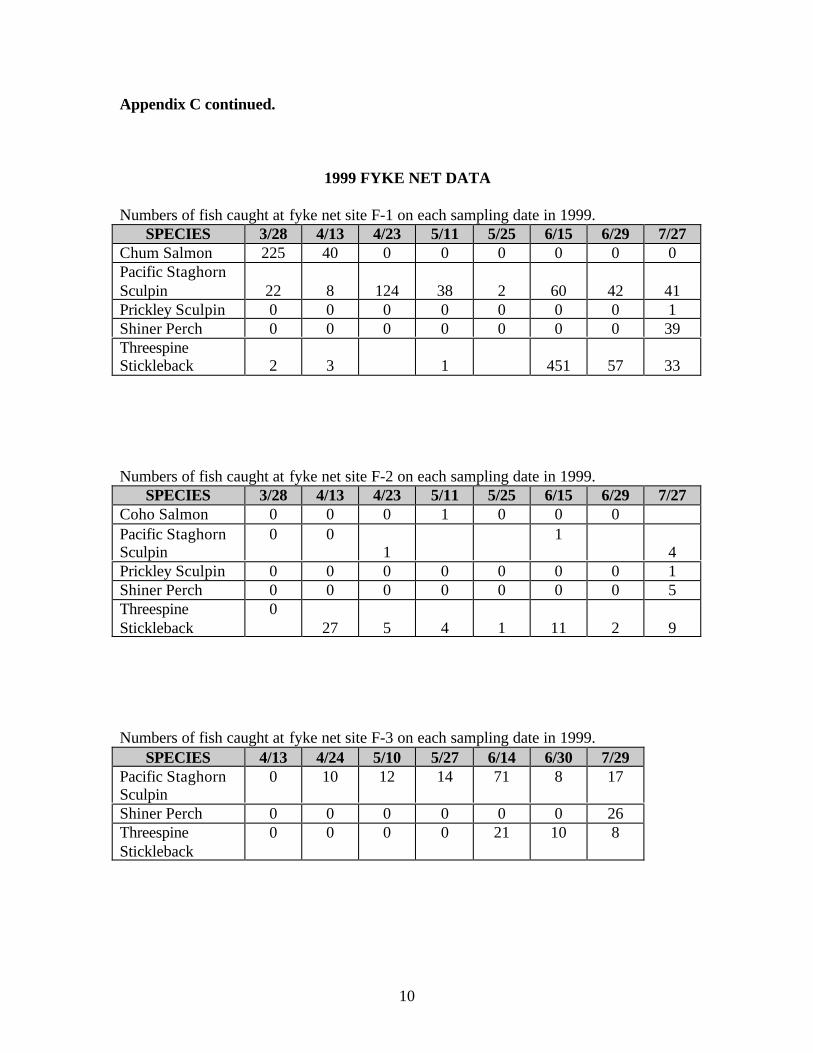
10
Appendix C continued.
1999 FYKE NET DATA
Numbers of fish caught at fyke net site F-1 on each sampling date in 1999.SPECIES 3/28 4/13 4/23 5/11 5/25 6/15 6/29 7/27
Chum Salmon 225 40 0 0 0 0 0 0Pacific StaghornSculpin 22 8 124 38 2 60 42 41Prickley Sculpin 0 0 0 0 0 0 0 1Shiner Perch 0 0 0 0 0 0 0 39ThreespineStickleback 2 3 1 451 57 33
Numbers of fish caught at fyke net site F-2 on each sampling date in 1999.SPECIES 3/28 4/13 4/23 5/11 5/25 6/15 6/29 7/27
Coho Salmon 0 0 0 1 0 0 0Pacific StaghornSculpin
0 01
14
Prickley Sculpin 0 0 0 0 0 0 0 1Shiner Perch 0 0 0 0 0 0 0 5ThreespineStickleback
027 5 4 1 11 2 9
Numbers of fish caught at fyke net site F-3 on each sampling date in 1999.SPECIES 4/13 4/24 5/10 5/27 6/14 6/30 7/29
Pacific StaghornSculpin
0 10 12 14 71 8 17
Shiner Perch 0 0 0 0 0 0 26ThreespineStickleback
0 0 0 0 21 10 8

11
Appendix C continued.
Numbers of fish caught at fyke net site F-4 on each sampling date in 1999.SPECIES 4/13 4/24 5/10 5/27 6/14 6/30 7/29
Chum Salmon 6 0 0 0 0 0 0
Pacific StaghornSculpin
1 26 11 10 36 28 42
Shiner Perch 0 0 0 0 0 0 17ThreespineStickleback
0 0 0 2 602 230 62
Numbers of fish caught at fyke net site F-5 on each sampling date in 1999.SPECIES 4/13 4/24 5/10 5/27 6/14 6/30 7/29
Chum Salmon 13 5 0 0 0 0 0Pacific StaghornSculpin
62 49 13 11 38 11 36
Shiner Perch 0 0 0 0 0 1 28ThreespineStickleback
55 0 1 0 138 80 91
Numbers of fish caught at fyke net site F-6 on each sampling date in 1999.SPECIES 4/13 4/23 5/11 5/25 6/15 6/29 7/27
Chum Salmon 1 0 0 0 0 0 0Pacific StaghornSculpin
6 60 22 72 30 21 48
ThreespineStickleback
1 1 0 1 154 19 36

12
Appendix C continued.
1998 TRAWL CATCH DATA
Numbers of fish caught at trawl site T-1 in July and August 1998.SPECIES 7/24 8/08
Buffalo Sculpin 4 4Cabazon 1 0English Sole 93 25Ling Cod 22 3Northern Anchovy 1 0Pacific Sanddab 57 55Pacific Staghorn Sculpin 87 114Padded Sculpin 0 2Pile Perch 0 1Red Irish Lord 0 2Saddleback Gunnel 0 1Shiner Perch 13 200Snake Prickleback 0 1
Numbers of fish caught at trawl site T-2 in July and August 1998.SPECIES 7/24 8/08
English Sole 0 10Northern Anchovy 1 0Pacific Sanddab 0 66Pacific Staghorn Sculpin 1 2Padded Sculpin 0 3
Numbers of fish caught at trawl site T-3 in July and August 1998.SPECIES 7/24 8/08Buffalo Sculpin No fish caught 3English Sole 10Pacific Sanddab 49Shiner Perch 3
Numbers of fish caught at trawl site T-4 in July and August 1998.SPECIES 7/24 8/08English Sole No sample taken 10Pacific Sanddab at this site 3Starry Flounder 1Striped Surfperch 1

13
Appendix C continued.
Numbers of fish caught at trawl site T-5 in July and August 1998.SPECIES 7/24 8/08Pacific Sanddab No fish caught 1Sand Sole 1Tubesnout 1
1999 TRAWL CATCH DATA
Numbers of fish caught in replicate #1 at trawl site T-1 on each sampling date in 1999.SPECIES 4/29 5/11 5/26 6/16 6/30 7/28English Sole 1 5 3Greenling spp. 1 3Lingcod 4Pacific Herring 1 1 1 217Pacific Sanddab 1 1 1 2Pacific Staghorn Sculpin 2 1 28Saddleback Gunnel 1Shiner Perch 2 2 20Surf Smelt 5Tidepool Sculpin 3
Numbers of fish caught in replicate #2 at trawl site T-1 on each sampling date in 1999.SPECIES 4/29 5/11 5/26 6/16 6/30 7/28Buffalo Sculpin 1Eel Pout sp. 1English Sole 2 18 5Greenling spp. 2 2 2Lingcod 2 7 6 7 5 1Pacific Herring 2Pacific Sanddab 1 10 1 3Pacific Staghorn Sculpin 2 7 2Pile Perch 1Saddleback Gunnel 1 1Sand Sole 2Shiner Perch 11 6 44 42Surf SmeltUnident. Sculpin 1

14
Appendix C continued.
Numbers of fish caught in replicate #1 at trawl site T-2 on each sampling date in 1999.SPECIES 4/29 5/11 5/26 6/16 6/30 7/28Buffalo Sculpin No fish No fish 2English Sole 3 caught caught 6Lingcod 18Pacific Herring 80 5Pacific Sanddab 3 17 3Pacific Staghorn Sculpin 1 1 1Saddleback Gunnel 1Shiner Perch 1 2 2 2
Numbers of fish caught in replicate #2 at trawl site T-2 on each sampling date in 1999.SPECIES 4/29 5/11 5/26 6/16 6/30 7/28Buffalo Sculpin No fish No fish 2English Sole 9 caught caught 2 1 7Lingcod 1 1Northern Anchovy 1Pacific Herring 20 6Pacific Sanddab 2 2 1Saddleback Gunnel 1 1Sand Sole 1Shiner Perch 8 32Speckled Sanddab 2Surf Smelt 3

15
Appendix C continued.
1998 ROUND HAUL NET CATCH DATA
Round haul net catch at lower bay sampling sites 7/15-7/16 1998.SPECIES LR-1 LR-3 LR-6 LR-7
Chinook Salmon 7 29English Sole 3 5 1Pacific Sandlance 36Pacific Staghorn Sculpin 1 1Rock Prickleback 1Saddleback Gunnel 1Starry Flounder 2Striped Surfperch 4White Surfperch 1
Round haul net catch at mid-bay sampling sites 7/14-7/16 1998.SPECIES MR-1 MR-3 MR-5
English Sole 8 35 41Pacific Sanddab 1Pacific Sandlance 3Pacific Staghorn Sculpin 4 5Topsmelt 1 2Shiner Perch 8 1
Round haul net catch at upper bay sampling sites 7/13-7/17 1998.SPECIES UR-1 UR-3 UR-5 UR-6 UR-7 UR-8 UR-
SCAmerican Shad 1Chinook Salmon 1 5Cutthroat Trout 1English Sole 72 21 9Pacific Herring 1Pacific Sanddab 3Pacific Staghorn Sculpin 35 2 19Shiner Perch 7 3Starry Flounder 1 1 6 5 1Topsmelt 2

16
Appendix C continued.
Round haul net catch at sampling site UR-6 on July 8, 1998.SPECIES 7/08
Chinook Salmon 1Pacific Staghorn Sculpin 7Shiner Perch 20Starry Flounder 5
Round haul net catch at sampling site UR-8 on June 23, June 25 and July 27 1998.SPECIES 6/23 6/25 7/27English Sole 1 4Pacific Sanddab 40Pacific Staghorn Sculpin 1Shiner Perch 2 2Starry Flounder 28 10 8

1
APPENDIX D
LONG-TERM MONITORING PLANFOR
FISH IN TILLAMOOK BAY
INTRODUCTION
A plan for long-term monitoring of fish use of the Tillamook Bay estuary is outlinedbelow. This plan is designed to accomplish two broad objectives: 1) to provide an indexto the estuary-wide status of the fish community in the Bay, and 2) to provide site-specific quantitative baseline information on fish use of salt marsh habitat. Rationale forselection of monitoring sites, sampling gear, levels of effort and sampling techniques aredescribed in the report "Fish Use of Tillamook Bay" prepared for the Tillamook BayNational Estuary Program (TBNEP) by Ellis Ecological Services and TeraStat ConsultingGroup, October 1999. In designing the plan, emphasis was placed on using cost-effective, proven sampling techniques that do not require high levels of specializedtraining.
The specific objectives of the monitoring plan are:
• To provide reliable information on fish species composition and relativeabundance that can be used as an index to long-term trends in the fishcommunity of Tillamook Bay.
• To monitor food habits of selected fish species through time as an index tolong-term trends in fish food resources.
• To develop quantitative baseline information on the numbers and species offish using relatively undisturbed salt marsh habitat in Tillamook Bay.
APPROACH
Beach seining is recommended as the primary sampling technique for monitoring speciescomposition and relative abundance for the estuary-wide survey. Six regions of the Bayhave been identified for location of sampling sites. These are as follows: Lower WestSide, Lower East Side, Middle West Side, Middle East Side, Upper West Side and UpperEast Side. The lower, upper and middle regions of the Bay are shown in Figure A-1.Three sampling locations within each of the six regions have been selected for beachseining.
A semi-balloon bottom trawl would be used to monitor species composition and relativeabundance of fish in subtidal channel habitat in the lower region of the Bay. Two trawlareas have been identified for replicated trawl sampling (Figure ).

2
Four species of fish (juvenile chinook salmon, juvenile chum salmon, staghorn sculpinand English sole) would be collected incidental to the beach seine sampling for food habitanalysis.Stationary fyke nets would sample tidal channels within the large salt marsh at the southend of the Bay. Six sampling sites would be sampled---three in the lower marsh near themud flat and three in the interior mid-section of the marsh. These sites were establishedduring the 1999 sampling program and fyke net frames were installed. Quantification ofthe areas drained by the tidal channels sampled would be used to estimate numbers offish per-unit-area of marsh.
LOCATION OF SAMPLING SITES
Beach Seine Sites
Figure A-1 shows the location the beach seine sites around the perimeter of the Bay.Sites were selected to provide representation of the typical substrate along the shoreline.A permanent marker (e.g. 0.75-inch rebar rod) should be placed at each site high enoughon the bank to ensure that it would not be lost to bank erosion. The longitude and latitudecoordinates for each permanent marker should then be determined with a GlobalPositioning System (preferably a DGPS system) and recorded. A photograph of each siteshould be taken and archived.
Trawl Sites
Five sites in the lower Bay were sampled during the summer of 1998 with a semi-balloonbottom trawl (Figure A-1). All of these sites were free from bottom obstructions andwere successfully sampled. Two of the sites sampled (i.e., in front of Garibali Harborand in the lower end of the Bay City Channel) were found have relatively high densitiesof fish compared to the other sites sampled. These two general areas were selected forlong-term monitoring sites and were sampled during 1999. Specific monitoring sites ineach area were identified as follows:
• On a map of the lower Bay, a number of potential starting points for trawlingin the main channel in front of the Garibaldi Harbor and in the lower end ofthe Bay City Channel including the Ghost Hole were identified.
• Each of the potential starting points within each area was assigned a number.• A random numbers table was used to select two trawl lanes from each of the
two areas for sampling.
The starting points should be located in the field and a GPS unit used to record thelongitude and latitude coordinates. All future sampling would use these samecoordinates to locate starting points and trawl lanes.

3
Figure A-1. Locations of beach seine, trawl, and fyke net monitoring sites in TillamookBay.

4
Salt Marsh Sites
The salt marsh to be monitored is located on the southeast end of the Bay between themouths of the Kilchis and Wilson Rivers (Figure A-1). Sampling conducted during thesummer and fall of 1998 and 1999 indicated that fish use of the marsh appears to differbetween the lower elevation region near the mud flat and the higher interior region of themarsh. Therefore, initial stratification of the marsh into a lower elevation region and ahigher elevation region was done prior to initiation of the 1999 sampling period. Thisstratification was determined based on observation of the marsh vegetation anddifferences in the amount of marsh that is inundated during average high tide conditions.
A network of tidal channels drains the salt marsh. First order channels are those thatdrain directly into the Bay. These channels are often quite wide (i.e. 50 to 100 ft ormore). The first order channels divide into second order channels which divide into thirdorder channels, etc. Previous sampling indicates that fyke net sampling can best beaccomplished in third or fourth order channels, depending on width.
A survey of the tidal channels within the lower and upper regions of the marsh wasconducted during 1999 and potential locations for installation of fyke net sites wereidentified. Third and fourth order channels that have sections narrow enough forinstallation of a fyke net (i.e. approximately four to five feet in width) and that drain dryduring low tide were identified as candidate sites.
The three sites established in 1998 were retained and three new sites were selected in1999, using the following procedure:
• From the list of candidate sites, two within the lower elevation marsh and one withinthe higher elevation marsh were selected using a random selection process.
• Longitude and latitude coordinates for each selected site were determined with aGPS unit and recorded for permanent reference.
MATERIALS AND METHODS
It should be noted that before any sampling for fish is conducted, it would be necessary toobtain a scientific collectors permit from the Oregon Department of Fish and Wildlife.Also, it may be necessary to obtain a Section 10 permit from the National MarineFisheries service due to the presence of federally listed species in the estuary (i.e. cohosalmon).
Beach Seining
The following equipment is recommended for beach seining:
• A beach seine with the following dimensions : 2 m deep x 30.5 m long with amid-section seine bag measuring 2 m x 2 m across the opening. The mesh ofthe beach seine should be woven nylon with 0.63 cm (0.25 inch) openings. A
5
solid core lead line is recommended. The float line should have sufficientfloats to keep the net from sinking in deep water.
• Two 30-gal. Plastic garbage barrels, one for net storage the other for holdingfish when large numbers are captured.
• A measuring board with millimeter increments• Two 5-gal. Plastic buckets for holding fish• A 16 ft or larger boat equipped with required safety equipment and an
appropriate size outboard engine• Chest waders for each field crew member• Coast Guard approved flotation devices for each field crew member• Multiprobe Hydrolab• GPS unit• Camera• Notebook with Rite in the Rain paper• Sample jars for specimens that can not be identified in the field• Ethanol for preserving fish specimens• Labels of Rite in the Rain paper• Fish keys for aid in field identification of fish• MS-222 anesthetic
Field staff requirements for beach seining are as follows:
• One fishery biologist trained in the identification of estuarine fishes, fishsampling techniques, and proper boat handling techniques.
• Two field technicians capable of pulling a heavy beach seine, previous fisheryexperience desirable but not essential.
Sampling methods for beach seining are as follows:
• When approaching the beach seining site care should be taken to avoiddisturbance of the area to be seined.
• Secure one end of the seine to the bank and then stretch the entire net outperpendicular to the shoreline. Deployment by boat would be required at siteswhere the bank drops off relatively steeply.
• In a sweeping arc, pull the free end of the seine back to shore. A bridal ropeattached to the free end of the net should be use to help pull the net to shore.
• The net should be slowly retrieved, keeping the lead line on the bottom.• The lead line should be brought to shore before the float line.• Fish captured in the seine should be transferred immediately to a bucket
containing clean water• Captured fish should be identified to species, measured to the nearest
millimeter then placed in a recovery bucket until they are released to the Bay.• The following water quality data should be collected in conjunction with each
beach sample:• Water temperature (0 C)

6
• Dissolved oxygen (mg/liter)• Salinity (ppt)• Turbidity (NTUs)
• All data should be recorded on standard field data forms similar to that shownin Figure A-2
Sampling frequency:• Twice-monthly April through July
Trawling
The following equipment is recommended for trawling:• A semi-balloon trawl with the following dimensions:
1. A 4-seam semi-balloon trawl with a 6.1 m (20 ft) head rope and 7.6 m (25ft) foot rope. A "tickler chain" should be attached to the footrope.
2. body and wings --- 3.7 cm (1.5 in) stretch mesh 100 meshes deep,3. intermediate section---3.2 cm (1.25 in) stretch mesh 66 meshes deep,4. cod end, outer bag---2.9 cm (1.13 in) stretch mesh 88 meshes deep,5. Cod-end, inner bag---1.8 cm (0.69 in) stretch mesh 200 meshes deep.6. Trawl doors 0.53 m (21 in) x 0.76 m (30 in)7. V-shaped bridal with 18.3 m (60 ft) legs.
• A 28-ft or longer boat equipped with a hydraulic winch• One 30-gal. plastic garbage barrel for holding fish if on-board tank is not
available• A measuring board with millimeter increments• Two 5-gal. Plastic buckets for holding fish• Chest waders for each field crew member• Coast Guard approved flotation devices for each field crew member• Multiprobe Hydrolab• GPS unit• Stop watch• Camera• Notebook with Rite in the Rain paper• Sample jars for specimens that can not be identified in the field• Labels of Rite in the Rain paper• Fish keys for aid in field identification of fish• Ethanol for preserving fish specimens• MS-222 anesthetic
Field Staff Requirements for trawling are as follows:• A boat captain familiar with the channels in the lower Bay• One fishery biologist trained in the identification of estuarine fishes, fish
sampling techniques, and proper boat handling techniques.

7
Page ___of ___
Date___ ___ ___ mo da yr Tide Stage_________Location__________________________________ Water Temp.(0C)____Study Reach_______________________________ pH______________Habitat Type_______________________________ D.O. (mg/l)________Site No.___________________________________ BP(mg Hg)________Gear Type_________________________________ Turb.(NTUs)_______Trawling Effort_____________________________ Sp. Cond__________Investigators________________________________ Depth(m)__________GPS Coordinates N. Lat.______________W. Long.___________ Time_____________Photo Numbers___________________________________________________________
SPECIES Length(mm)
StomachSample
ScaleSample
Comments
Figure A-2 Fish data form.

8
• One field technician, previous fishery experience desirable but not essential.
Sampling methods for trawling are as follows:
• All trawling should be done at low tide• Use a GPS unit to locate the starting point for each trawl track• Deploy the trawl over the back of the boat and ensure that the doors are
spreading the net properly• Tow with the current for 5 minutes• Use a stop-watch to accurately measure the time of the trawling• Use the hydraulic winch and crab block to retrieve the net at the end of the 5-
minute tow• Bring the doors on board and then the net• Open the cod end of the net and transfer the fish to a holding tank containing
fresh Bay waterCaptured fish should be identified to species, measured to the nearestmillimeter then placed in a recovery bucket until they are released to the Bay
• The following water quality data should be collected in conjunction with eachtrawl sample:
1. Surface and bottom water temperature (0 C)2. Surface and bottom dissolved oxygen (mg/liter)3. Surface and bottom salinity (ppt)4. Surface and bottom turbidity (NTUs)
• All data should be recorded on standard field data forms similar to that shownin Figure A-2
Sampling Frequency:
• Monthly from April through July. Sampling should be conducted inconjunction with one of the twice-monthly beach seine sampling dates.
Fish Food Habits
The following supplies and equipment are recommended for the food habit study:
• 10% formalin solution for initial preservation of the fish• Wide mouth sample jars with leak-proof lids• Small scissors with sharp points• Sample labels• Data form for recording species and lengths of fish collected
Field Staff Requirements for the food habit study are as follows:
• Same as for beach seining
9
Sampling Methods for the food habit study are as follows:
• Specimens should be collected incidental to the beach seine sampling• If possible all of the specimens should be collected from the same region of
the Bay e.g. upper Bay. If not possible, separate the specimens based onregion of the Bay from which they were collected
• A total of 20 individuals of each of the following species should be collectedonce each month during the sampling period pending approval by ODFW:1. Juvenile chinook salmon2. Juvenile chum salmon3. English sole4. Staghorn sculpin
• Upon collection, the body cavity should be opened with fine-tipped scissors• The specimens should then be placed in a labeled jar containing 10 percent
formalin solution. The formalin can be replaced at a later date with 90 percentethanol.
Fyke Net
The following supplies and equipment are recommended for the fyke netsampling:
• Three fyke nets (these are available at TBNEP)• Wooden frames to hold the fyke nets in the marsh channels have been
installed. However, if any of the frames need replacing they should bereplaced with pressure-treated 2x6-inch and 2x4- inch lumber. Refer to PlateA-1 for a picture of an installed frame. The net frame slides into a groove inthe two uprights and the bottom cross-member. Sandwiching a 2x4-inchboard between two 2.6-inch boards forms the groove. It is essential that 6 milplastic sheeting be attached to the upstream side of the bottom cross-memberand the lower in-water portions of the two uprights. Strips of wooden lath canbe nailed over the edge of the plastic to hold it onto the frame. When coveredwith mud and sod, the plastic sheeting should form a tight seal around the in-water portion of the wooden frame and prevent fish from going around orunder the frame.
• Boat and outboard motor suitable for accessing the salt marsh• 200 ft field tape (initial setup only)• Wooden stakes (initial setup only)• shovels (initial setup only)• GPS unit• 5-gal pail for holding fish• Chest waders for each field crew member• Coast Guard approved flotation devices for each field crew member• measuring board• Data forms for recording species and lengths of fish collected (Figure A-2)

10
Field Staff Requirements for the fyke-netting program are as follows:
• Experienced fisheries biologist for initial set up and training of fieldtechnicians
• Two field technicians, previous fisheries experience desirable but notessential. One should be experienced in use of small boats.
Initial setup and sampling methods for the fyke net monitoring program are asfollows:
• Installation of the wooden support frames requires the following steps:
1. Transport the frames to the site in pieces and assemble with galvanizedscrews.
2. Dig slots in each bank and the channel bottom to receive the woodenframe.
3. Install the wooden frame into the slots in the bank. Plastic sheetingshould be attached prior to installation.
Plate A-1. Fyke net support frame.

11
4. Be sure that the bottom of the frame does not create a pool upstream of thenet.
5. Cover the plastic sheeting with mud and sod and pack sod tightly in theslots on the sides of the channel to completely seal the frame in place.
• Mapping the drainage basin for each fyke net site involves the followingsteps:
1. During winter or early spring when the vegetation is off the marsh, stakeout the perimeter of the drainage basin upstream of each fyke net site withwooden stakes. Generally the approximate dividing line betweenadjoining drainages is visually apparent. If there is doubt, the direction ofwater flow during an outgoing tide that floods the marsh surface can beused to determine the boundary. Survey methods could be used but thesmall differences in elevation across the marsh would require a largeamount of survey work, which is probably not justified.
2. Once the perimeter of the drainage area has been staked, a field tape canbe used to prepare a scaled map of the drainage area. The maps producedfor each fyke net site would then be used to calculate the surface area ofmarsh sampled by each net.
Sampling methods for the fyke nets are as follows:
• At high slack tide, place the three fyke nets in the wooden frames at eitherthe lower elevation or higher (mid-marsh) sampling sites. Usually itshould be possible to take the boat almost to the sampling site at high tide.
• Note the time each net was started and record the published high tideelevation for Tillamook Bay for the sampling date.
• Measure the following water quality parameters:1. Water temperature (0 C)2. Dissolved oxygen (mg/liter)3. Salinity (ppt)4. Turbidity (NTU)
• After the channels have drained out on the out-going tide, use a backpackelectrofisher to remove any fish remaining in residual pools upstream ofthe net.
• After the electrofishing is completed, lift nets and collect fish from thelive boxes.
• Fish should be transferred to a bucket containing fresh Bay water.• Captured fish should be identified to species, measured to the nearest
millimeter then placed in a recovery bucket until they are released to theBay.
• The above sampling procedure should be repeated on the next day at theremaining three fyke net sites.
Efficiency testing of the fyke nets should be conducted as follows:

12
• Capture efficiency of the fyke nets should be estimated at least once andpreferably more often during each year's fyke net sampling operation.
• Fish for the efficiency tests should be of the same species and size rangeas those found in the marsh.
• The test fish would be captured in the upper Bay by beach seine and held(no longer than 24 hours) in aerated water prior to the efficiency tests.
• Approximately 20 fish would be required for each fyke net site.• The upper tip of the caudal fin would be clipped so that the fish could be
identified upon recapture.• The test fish would be released upstream of each fyke net at high tide in
the upper portion of the drainage area.• Fin clipped fish would be counted in the fyke net catch.• The percent of fish recovered would be used as an estimate of sampling
efficiency.
Sampling Frequency:
• Twice-monthly from mid March through April; monthly from Maythrough July.
DATA ANALYSIS
Data recorded on field data forms should be copied onto a computer spreadsheet file (e.g.Excel) either during or shortly after the annual sampling period. There are many possibleways that the data could be summarized. At a minimum, summary tables showing thespecies collected and their relative abundance should be prepared for the beach seine andtrawl catches. The fyke net data should be converted to numbers of fish per unit area forcomparison purposes.
Fish collected for food habit analysis could either be archived or sent to a laboratory forprocessing. Food items should be identified to the lowest practical taxonomic level.Results of the food habit analysis could be analyzed in a number of different ways.Graphical representation of the major components is often used to show differencesbetween locations and species.
For statistical analysis, catch from the bi-weekly samples could be analyzed usingAnalysis of Variance techniques on transformed count data. The variables used tocompare beach seine and trawl sites and years within each site should be mean catch pereffort of abundant species and mean combined catch per effort of all species. One year'sworth of data can be used to statistically compare the six different habitat areas sampledby beach seine and the two areas sampled by trawl. If trends in species abundance arehypothesized after 4-5 years of data, Spearman's rank correlation coefficient (Conover,1980) can be used to test for trends (defined as correlation between year and catch) intotal catch for each habitat area. Profile analysis or Multivariate Analysis of Variance

13
(MANOVA) (Johnson and Wichern, 1992) can be used to test if trends are consistentacross sites. Variables may need to be transformed to meet the normality assumptions ofthese latter two tests. The approach for the fyke net samples would be essentially thesame as for the beach seine and trawl except data would be reported as numbers of fishper unit area of marsh surface sampled and adjusted for net efficiency.
QUALITY CONTROL
One of the most important issues for a long-term monitoring program is consistency insampling techniques and sampling locations through time. These issues should beaddressed through the following quality control measures:
• Be sure that the person in charge of the monitoring program is a competentfishery biologist familiar with estuarine fishes and the problems associatedwith working in the estuarine environment.
• Develop a standard procedure manual that will provide the detailed guidanceneeded to ensure consistency in techniques from year to year regardless ofchanges in staffing. The outline presented herein would be a good start for thestandard procedure manual.
• Keep a record of the descriptions and coordinates for each sampling site onfile in a safe location (preferably two separate locations).
• Be sure that the gear used from year to year is well maintained and that if gearis replaced it is a duplicate of the previous gear.
• Use standard data forms for collection of field data.• Ensure that water quality sampling equipment is properly calibrated prior to
each field- sampling period.
Also, it is essential that whenever data are transferred from field data sheets to computerspread sheets or other forms, the transferred data is checked against the original data foraccuracy and completeness. Someone other than the data entry person should conductthe check.
COORDINATION WITH OTHER MONITORING PROGRAMS
Where possible the proposed fish-monitoring program should be coordinated with otheron-going and proposed monitoring programs. One of these programs is the smolt out-migrant monitoring being conducted in the Tillamook Bay watershed by OregonDepartment of Fish and Wildlife (ODFW). Juvenile salmonids collected by ODFW arebeing fin-clipped so that they can be recognized upon recapture in the estuary. Any fin-clipped fish captured during the estuary fish monitoring program should be recorded andreported to the ODFW monitoring team. It is possible that the water quality datacollected in conjunction with the fish monitoring program can be used as supplementaldata by those conducting water quality monitoring in the Bay and watershed.
14
OPTIONAL MONITORING PLANS
It is recognized that the sampling proposed above would require a substantial effort, andthe following suggestions are offered for reducing this effort if it is deemed necessary todo so:
1) Sample alternate years. It would be better to get a clear picture of the status of theestuary every two years than to get a partial picture every year.
2) Sample only some habitats. Perform the same replication as recommended above, buteliminate some of the six habitat areas from the beach seine program.
3) A combination of 1) and 2). Sample half of the habitat areas in each year.
If sampling all six habitat areas by beach seine is not feasible, one of the three reductionstrategies above should be considered. These alternatives will reduce sampling effortwith the least cost to the data quality.