1997 Annual Report - Cooper Tires
30
Cooper Tire & Rubber Company, founded in 1914, specializes in the manufacturing and marketing of rubber products for consumer use. Products include automobile, truck and motorcycle tires; inner tubes; vibration control systems; automotive sealing; hose and assemblies. The Company markets its products nationally and internationally through well-established channels of distribution. Among its customers are automotive manufacturing companies, independent tire dealers and wholesale distributors, and large retail chains. COOPER TIRE & RUBBER COMPANY CONTENTS Letter to Stockholders .................................. 02 Operations Review– Tire Products ......................................... 04 Engineered Products ................................ 08 Product Overview ....................................... 11 Financial Review ........................................ 12 Financial Statements .................................... 20 Auditor’s Report ........................................ 25 Eleven-Year Summary .................................. 26 Directory .................................................. 28 The Cover: Cooper Tire & Rubber Company has long used a knight’s helmet as part of its logo to symbolize strength, fidelity and integrity. The helmet depicted on the cover, once worn by the 16th century general, Alessandro Farnese, is an exceptional example of quality, excellence and craftsmanship. Because of these shared values, we believe it was very appropriate for the cover of this year’s annual report. (Photo by Erich Lessing/Art Resources, N.Y.)
Transcript of 1997 Annual Report - Cooper Tires

Cooper Tire & Rubber Company, founded in 1914, specializes in the manufacturing and marketing of rubber products for consumer use. Products includeautomobile, truck and motorcycle tires; inner tubes;vibration control systems; automotive sealing; hoseand assemblies.
The Company markets its products nationally andinternationally through well-established channels ofdistribution. Among its customers are automotivemanufacturing companies, independent tire dealersand wholesale distributors, and large retail chains.
COOPER TIRE & RUBBER COMPANY
CONTENTS
Letter to Stockholders . . . . . . . . . . . . . . . . . . . . . . . . . . . . . . . . . . 02
Operations Review–
Tire Products . . . . . . . . . . . . . . . . . . . . . . . . . . . . . . . . . . . . . . . . . 04
Engineered Products . . . . . . . . . . . . . . . . . . . . . . . . . . . . . . . . 08
Product Overview . . . . . . . . . . . . . . . . . . . . . . . . . . . . . . . . . . . . . . . 11
Financial Review . . . . . . . . . . . . . . . . . . . . . . . . . . . . . . . . . . . . . . . . 12
Financial Statements . . . . . . . . . . . . . . . . . . . . . . . . . . . . . . . . . . . . 20
Auditor’s Report . . . . . . . . . . . . . . . . . . . . . . . . . . . . . . . . . . . . . . . . 25
Eleven-Year Summary . . . . . . . . . . . . . . . . . . . . . . . . . . . . . . . . . . 26
Directory . . . . . . . . . . . . . . . . . . . . . . . . . . . . . . . . . . . . . . . . . . . . . . . . . . 28
The Cover: Cooper Tire & Rubber Company has long used a knight’s helmet as part of its logo to symbolizestrength, fidelity and integrity. The helmet depicted on the cover, once worn by the 16th century general,Alessandro Farnese, is an exceptional example of quality, excellence and craftsmanship. Because of these sharedvalues, we believe it was very appropriate for the cover of this year’s annual report.
(Photo by Erich Lessing/Art Resources, N.Y.)

1997 1996 1995
Operating Results
Net sales . . . . . . . . . . . . . . . . . . . . . . . . . . . . . . . . . . . . . . . . . . . . . $1,813,005 $1,619,345 $1,493,622
Income before income taxes . . . . . . . . . . . . . . . . . . . . . . 194,792 172,092 180,070
Net income . . . . . . . . . . . . . . . . . . . . . . . . . . . . . . . . . . . . . . . . . . 122,411 107,884 112,820
Basic and diluted earnings per share . . . . . . . . . . . . 1.55 1.30 1.35
Dividends per share . . . . . . . . . . . . . . . . . . . . . . . . . . . . . . . .35 .31 .27
Financial Position
Working capital . . . . . . . . . . . . . . . . . . . . . . . . . . . . . . . . . . . . . $1,354,281 $1,256,130 $1,272,216
Long-term debt . . . . . . . . . . . . . . . . . . . . . . . . . . . . . . . . . . . . . 205,525 69,489 28,574
Stockholders’ equity . . . . . . . . . . . . . . . . . . . . . . . . . . . . . . . 833,575 786,612 748,799
Stockholders’ equity per share . . . . . . . . . . . . . . . . . . . 10.58 9.67 8.95
Other Operating Data
Capital expenditures . . . . . . . . . . . . . . . . . . . . . . . . . . . . . . . $0,107,523 $0,193,696 $0,194,894
Depreciation . . . . . . . . . . . . . . . . . . . . . . . . . . . . . . . . . . . . . . . . . 94,464 76,820 63,313
Net income as % of sales . . . . . . . . . . . . . . . . . . . . . . . . . . 6.8% 6.7% 7.6%
Net income as % of beginning of yearstockholders’ equity . . . . . . . . . . . . . . . . . . . . . . . . . . . . . 15.6% 14.4% 17.0%
Long-term debt as % of capitalization . . . . . . . . . . 19.8% 8.1% 3.7%
Current ratio . . . . . . . . . . . . . . . . . . . . . . . . . . . . . . . . . . . . . . . . 2.8 2.4 2.7
Number of shares outstanding (thousands) . . . . 78,760 81,367 83,662
Number of stockholders . . . . . . . . . . . . . . . . . . . . . . . . . . . 5,281 5,991 6,721
Number of employees . . . . . . . . . . . . . . . . . . . . . . . . . . . . . 10,456 8,932 8,284
*Prior to cumulative effect of changes in accounting in 1992 for postretirement benefits other than pensions and income taxes.
FINANCIAL HIGHLIGHTS (Dollar amounts in thousands; per-share amounts in dollars)
1
This was a year of growth for the Company, bothdomestically and internationally. Construction projects,foreign acquisition and technology improvementswere all highlights in 1997.
Sales were strong for our tires and engineeredproducts reaching a record-setting total of $1.8 billionfor the year. Only a small part of these sales can beattributed to our acquisition of Avon Tyres Limited ofthe United Kingdom in early 1997. The perseveranceand dedication of the Cooper team allowed us toachieve an overall sales increase of 12 percent in anindustry environment that was extremely competitive.
Our earnings were at near record levels with netincome of $122 million, an increase of 13.5 percentover 1996. On both basic and diluted per share bases,earnings set an all-time record at $1.55 compared to$1.30 in 1996, an increase of 19.2 percent.
Our long-term debt, which now stands at $206 million, substantially increased due to the Avon Tyres purchase and our common stock repurchase. During the first quarter of 1997 we completed the repurchase of 5 million shares of common stock which was first authorized and startedin 1996. A second 5 million share repurchase wasauthorized but not acted on during 1997.
Long-term debt as a percent of total capitalizationwas 19.8 percent with a current ratio of 2.8 to 1, whichwe believe is very strong.
Stockholders’ equity grew to $834 million in1997 and reflects 14.2 percent annual compoundedgrowth over the past 10 years for Cooper investors.Stockholders’ equity per share grew to $10.58 whichis 9 percent higher than a year earlier.
During the year the board of directors declaredan increase in the dividend from 8.5 cents to 9.5 centsper share. Yearly dividend payments to stockholdershave increased each year since 1979, and dividendshave been paid to stockholders every year since 1950.
Strong cash flows provided by operations enabledus to make investments in productivity, expansion,product quality and technology development. All expenditures were directed toward helping the Company remain competitive in the long term.Our 1997 capital spending finished at $108 million.In the last ten years, Cooper has spent more than onebillion dollars in capital improvements. This invest-ment represents a solid commitment to the future ofthe Company.
TO OUR STOCKHOLDERS:
2
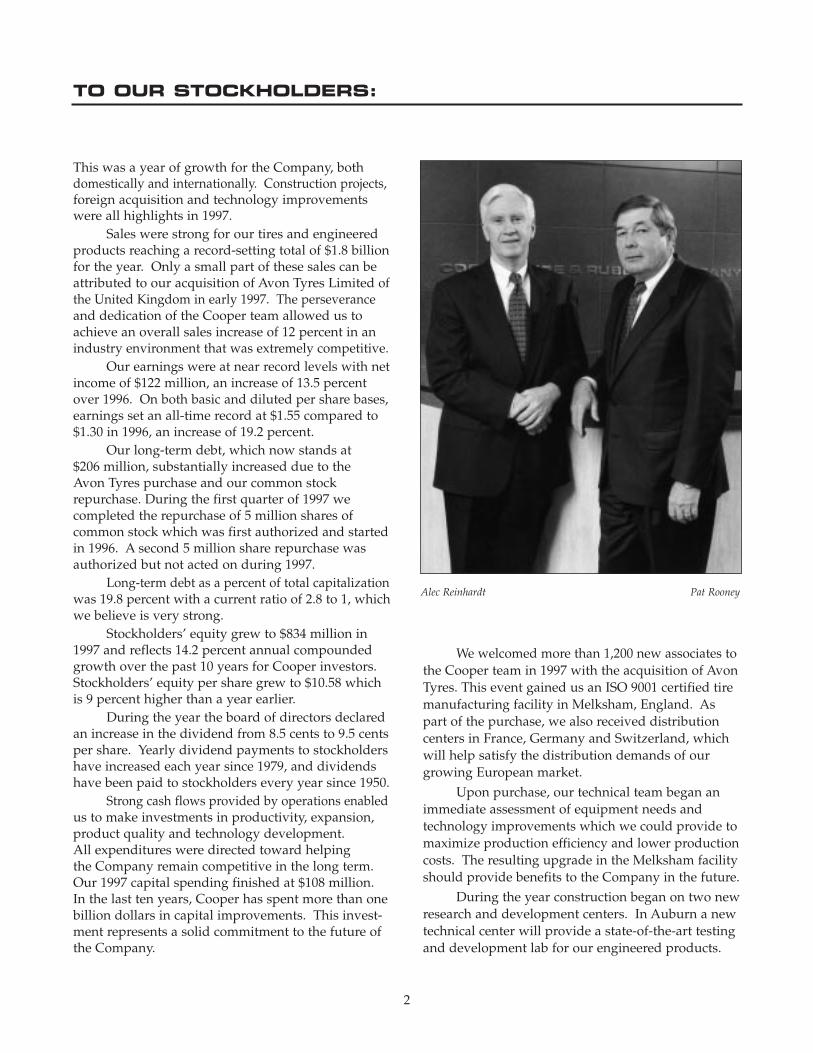
Alec Reinhardt Pat Rooney
We welcomed more than 1,200 new associates tothe Cooper team in 1997 with the acquisition of AvonTyres. This event gained us an ISO 9001 certified tiremanufacturing facility in Melksham, England. Aspart of the purchase, we also received distributioncenters in France, Germany and Switzerland, whichwill help satisfy the distribution demands of ourgrowing European market.
Upon purchase, our technical team began animmediate assessment of equipment needs and technology improvements which we could provide tomaximize production efficiency and lower productioncosts. The resulting upgrade in the Melksham facilityshould provide benefits to the Company in the future.
During the year construction began on two newresearch and development centers. In Auburn a newtechnical center will provide a state-of-the-art testingand development lab for our engineered products.

In Findlay a new research and engineering facilitywill allow for significant expansion of our testinglabs. Scheduled for completion during 1998, both of these facilities will enable our technical expertiseto grow significantly in the future.
Labor relations in 1997 included negotiationswith the United Steelworkers of America for contractsat El Dorado (vibration controls), Findlay (tires),Bowling Green (seals) and Auburn (vibration controls).We were pleased all contracts were settled withoutwork stoppage. We had to increase inventories toassure that customer commitments would be met,and those costs were reflected in our earnings for the year.
Two changes occurred on the board of directorsduring the year. Delmont A. Davis, a member of theboard since 1992, chose not to stand for re-election atthe May annual meeting. At that time, John F. Meier,chairman and chief executive officer of Libbey Inc.,joined the board with a term expiring in 2000. At the meeting in February, 1998, the board honoredDr. Allan H. Meltzer, who served on Cooper’s boardsince 1983 and retired upon reaching the board’smandatory retirement age of 70. His advice, counseland enthusiastic participation on the board will be missed.
In executive management changes, Roderick F.Millhof was elected a Vice President of the Companyin January, 1998, and is currently leading the engineered products operations as a result of theretirement of Robert C. Gasser. During Bob’s leadershipour engineered products operations grew successful-ly in every way including sales, earnings, personnel,facilities and reputation for excellence.
At the direction of the board, in 1997 we beganan initiative which has been referred to as “Cooper 21.”Our team was challenged to make a comprehensivestrategic review of our business as we prepare toenter the next century. Throughout the year, taskgroups have been reviewing the world marketplacefor tires and engineered products and the forceswhich will affect future demand for our products.
Competitors were thoroughly examined to discover their movements both domestic and abroad,and how their plans might affect our opportunitiesfor success.
Our own internal strengths and weaknesseswere identified. Competencies we might exploit
PAGE HEADING
3
were analyzed. Ultimately a list of strategic imperativeswas formulated with potential responses considered.Based on this information, our board of directors willmeet early in 1998 to make decisions on the strategicdirection for the Company.
We are excited about the development of thisformalized plan for our continued success. It has beenextremely gratifying to see our employee teamsexploring the many opportunities which will resultin a blueprint for the future of the Company and also may enrich their own career opportunities.
In reviewing our year-end results, we feel it is important to note that in an industry which onlygrew 2.9 percent during the year, our tire sales brokerecords with a double-digit increase. The productionof light vehicles increased moderately during 1997while we recorded our highest ever sales in engineeredproducts. Our achievements in sales and earningsimproved our competitive position in both tires and engineered products.
We are challenged to be proactive in guidingthe success of the Company. We are actively seekingopportunities which capitalize on our strengths forpotential growth and will result in increased shareholder value.
With our significant investments in equipmentand technology, combined with what we feel is the best employee team in the rubber industry, we believe the future looks bright for our Company.
Patrick W. RooneyChairman of the Board, President, Chief Executive Officer
J. Alec ReinhardtExecutive Vice President, Chief Financial Officer

INDUSTRY OVERVIEW
The Company shipped a record number of tires in 1997, continuing to outpace the overall industry in replacement tire shipments.
In the U.S. replacement market, tire shipmentsincreased 2.9 percent, rising almost 6.3 million unitsfrom the 1996 total of 214.4 million units. Cooper’sincrease in unit sales contributed a substantial share of the industry increase. The strong overall U. S. economy was a significant factor in allowing the tireindustry to record a better than average increase for the year.
By product category, industry replacement passenger tire shipments increased 2.4 percent; lighttruck replacement tire shipments posted an increase of 5.2 percent; and medium truck tire shipmentsrecorded a strong increase of 6.5 percent. Inner tubeshipments continued to decline resulting in a 3.1 percent decrease from 1996 totals.
According to a trade publication, capacity inthe industry increased by almost two percent from1996 to 1997 and contributed to the intense competitiveenvironment in the retail tire market.
Consumer preference for larger wheel diameterscontinued in 1997 with 32 percent of the performancetire sales being 16-inches or greater, compared to just23 percent during 1996. Performance tires overallcontinued their steady increase as a percent of totalreplacement tire market -- showing an even greaterincrease in the original equipment market.
The expertise and customer service provided byindependent dealers continues to benefit today’s tireconsumer. According to a leading industry magazine,Modern Tire Dealer, independent tire dealers as a distribution channel, represented 71 percent of allpassenger tires sold in 1997. With the Company distributing its Cooper, Mastercraft, Starfire andRoadmaster house brand tires primarily throughindependent tire dealers, this growing trend has a positive implication for the Company’s domesticsales growth. The newly-acquired Avon brand also is sold primarily through the independent dealerchannel both in the U.S. and abroad.
PRODUCTS
With the acquisition of Avon Tyres Limited, Cooper’sassortment of products grew to include several newcategories including motorcycle tires, racing tires andremould materials. During the year, several newproduct lines were introduced and additional sizeswere made available for one of the most popularbroadline offerings.
The new Cooper CXMT 320 was added during1997 to fit a niche for local delivery and trailer serviceapplications. With low profile sizing and a premium16/32-inch tread depth, this commercial-size, all-steelradial tire rounds out the overall offering fromCooper in the medium truck tire category.
Promoted as the “ultimate sports/touring tire,”the Avon Azaro radial front/rear motorcycle tire wasintroduced featuring Cooper-Avon’s patented variablebelt density (VBD). The tire provides outstandingmileage, consistent cornering and good handlingeven as the tire wears. Cooper-Avon Tyres Limited isthe world’s fifth largest motorcycle tire manufacturer.
The popular Cooper Lifeliner Classic II passengertire line was expanded to include eight new 75 seriessizes including an extra load size for full-size vansand pickup trucks.
In early 1998 Cooper introduced a new lighttruck radial, the Cooper SRM II Radial LT with
OPERATIONS – TIRE PRODUCTS
GLOSSARY OF TERMS
Remould materials - Rubber materials produced for the retreading or remoulding of tires. Cooper-Avon is the largest supplier of these rubber materials in the United Kingdom.
Variable Belt Density (VBD) - The process in building motorcycle tires by which a continuousbelt of aramid fibers is wound onto the tire withthe plies applied closer together in the center of the tire and further apart at the shoulder.Exclusive to Cooper-Avon’s motorcycle tire production, this process enhances the wear and stability of the tire.
Low profile sizing - In simplest terms, a tire havingshort sidewalls and wide tread. On a low profiletruck tire, the sidewall height is 80 percent or lessof the tire width.
CAD - Computer-aided design software used byCooper’s mold and product design groups todesign tire molds in three-dimensional models.

special sizes available for the international market.This replacement for the popular rib light truck lineshould prove to be a good seller worldwide.
FACILITIES
Cooper has an ongoing commitment to modernizationat all its manufacturing facilities. In fact, during thepast 10 years, more than $1 billion has been spent incapital improvement projects. Increasing productioncapacity, implementing the latest technology toupgrade product quality and lowering productioncosts are at the heart of Cooper’s improvement projects.
When Cooper acquired the Melksham, England,manufacturing operation in early 1997, a needsassessment of the facility began immediately in orderto maximize the investment. During the year anaggressive plan was put into place for additional
equipment as well asupgrades to existing equipment in order toincrease output. Throughthe diligent efforts of the talented Melksham andFindlay teams, the initialphase of the modernizationwill be completed in early 1998 and should benefitCooper’s long-term Europeansales plans.
In the United States, all four tire plants were involvedin a program designed toimprove tire uniformity. The “Operational Excellence”process improvement programuses a statistical-based approachto ensure predictability of eachmanufacturing process. Thisprogram helps tremendously ineliminating process variationsand ultimately helps all products
achieve a consistent uniformity that meets or exceedscustomer expectations.
All of Cooper’s tire plants in the U.S. this yearwill be linked with a computerized maintenance system which helps keep equipment running at maximumefficiency. Cooper uses a systematic approach to facil-ity improvement, generally selecting a lead plant toinstall any new process or equipment, then perfectingthe process before it is transferred to the remainingplants. The new computerized maintenance system is an example of this successful approach.
Late in 1997 two projects were announcedwhich will significantly strengthen Cooper’s testing,research and engineering efforts for decades to come.In December construction began on an expansion tothe research and engineering facility located inFindlay. The 73,500-square-foot addition will providean optimum environment for creativity and collaborationusing fiber optic technology to enhance communicationfrom initial design to final production of the tire.
Also in 1997 plans were finalized for theCompany to construct a tire testing facility in southernTexas. By the end of 1998, this 1,000-acre site nearSan Antonio will contain a one-mile road course,
In July Cooper went "live" on the Internet with its web sitewww.coopertire.com. Browsers can read about Cooper's prod-ucts, history and facilities as well as locate the independentCooper dealers nearest to them. Designed for fast and easyuse, the site features graphics that are bright, colorful andhave a quick load time.
• Dealer Locator• Tires
• Engineered Products• Financial Highlights• Plants & Distribution Centers• Our Spokesman• History
• Employment Opportunities• E-Mail
COOPER TIRE & RUBBER COMPANY
Welcome!Welcome!

a 2 1/2 mile oval course and a vehicle dynamics wettesting area. Cooper’s speed-to-market with newproducts will be greatly enhanced with this control of future tire testing projects.
A new graphic arts facility in Findlay will becompleted in 1998. This 12,000-square-foot structurewill consolidate the production and distribution ofthe Company’s printed materials. The new facilitywill save Cooper considerable time and expense inthe production of printed forms, advertising materialsand other promotional materials necessary to helpmarket all Cooper products.
TECHNOLOGY
Over the years Cooper engineers and technicianshave continually monitored advancements in computer technology to help keep products at thehighest quality level and to maximize efficiency.New product development is critical in maintaining a competitive edge in the tire marketplace. Cooper’sentire product development program is computer-driven in order to reduce time for the developmentprocess and provide the best quality in the designs.
The Company’s CAD process allows engineersto create tire designs and predict the performance ofthat specific design – on screen – before any furtherdevelopment takes place. Through a rapid prototypingsystem, Cooper can provide its private-brand customerswith a three dimensional, plastic model of the tire forquick evaluation regarding appearance issues.Linked with the new mold design facility in Findlay,the CAD system can quickly produce mold drawingsand, ultimately, a prototype tire in days when justseveral years ago, it took weeks and months to provide the first sample tire for a new product line.
Cooper’s entire technology process is fast-moving and cutting-edge and employees are proud of their efforts in providing new qualityproducts to customers around the world.
MARKETING
National awareness increased dramatically for Cooperin 1997 with the addition of Arnold Palmer as thecompany spokesman and the significant increase inadvertising media expenditures for the year.Between March and September, the Palmer-Cooper
OPERATIONS – TIRE PRODUCTS
More than 118,000 motorists pass by this billboarddaily on the New Jersey turnpike. Linking ArnoldPalmer and Cooper, this billboard is one part of thenational media campaign launched in 1997 toenhance Cooper's national awareness.
Inside dealers’ showrooms, ArnoldPalmer appeared as a life-sized
“stand-up” among the tires on display.Colorful posters were also provided to
dealers for in-store awareness ofCooper’s new spokesman.

association was highlighted on cable stations nationallyby rotating two memorable 30-second commercialson popular cable TV programs. Cooper’s associatesponsorship of the network televised PGA event, the Bay Hill Invitational, also contributed to theincrease in recognition for the Cooper brand.
Cooper dealers were provided a wide assortmentof Arnold Palmer materials to promote the associationin their local markets including television and radiocommercials, in-store display materials, billboardpaper and even a counter card which promoted theuse of the PSA (prostate specific antigen) test and its benefits in providing early warning for prostatecancer. In early 1997 Arnold Palmer underwent sur-gery for prostate cancer and attributes the PSAas an important element in helping him detect thedisease early.
In mid-year, Cooper announced the renaming ofthe Melksham operation to Cooper-Avon Tyres Limited.Reflecting Cooper-Avon’s image as a premium per-formance tire manufacturer, a distinctive red and blue logo was introduced. Subsidiaries in France,Germany and Switzerland became known as Cooper-Avon Pneumatiques SARL, Cooper-Avon Reifen(Deutschland) Gmbh and Cooper-Avon Suisse SA,
respectively. Avon Technical Services is now Cooper-Avon International Development Limited.
Cooper was honored by private-brand customer Sears and received high marks from itsindependent dealers during the year. In March 1997Cooper was presented with the Sears Partners inProgress Award from a pool of more than 10,000 ven-dors vying for the recognition. Cooper also receivedthe Source Award as the top supplier in the automotive division and the Chairman’s Awardfor innovation.
Later in the year, Cooper and Mastercraftbrands were ranked at the top of a national survey of tire dealers conducted by the industry magazineTire Review. Of the 47 brands mentioned by dealers,Mastercraft ranked first and Cooper second. Of the“major” brands, dealers ranked Cooper at the top.
Cooper continues to be a respected manufacturerin the tire industry with the unmatched ability toprovide excellence in customer service, top qualityproducts and competitive pricing.
Highlighting Cooper's international presence, advertisingmaterials bearing the theme “Made in the U.S.A. Proven
around the world” were made available to international customers in 1997. The campaign features Cooper Tires on
off-road vehicles performing in a variety of countriesincluding Tunisia, Holland, Chile and Sweden.

INDUSTRY OVERVIEW
During 1997 North American light vehicle productionincreased 3.4 percent over the previous year.Passenger car sales continued to decline while lighttruck sales increased moderately. As in past years,the Company continues to experience high demandfor its engineered products.
Automotive industry analysts are predicting a slight downturn for 1998 in total North Americanvehicle production while Cooper anticipates continuedgrowth for products produced by the Company.Sales of Cooper original equipment engineered rubber products per vehicle produced have steadilyincreased in the past decades as OEM manufacturerscontinue to recognize and take advantage of Cooper’sexpertise in the engineered products field.
PRODUCTS AND TECHNOLOGY
The Company continues to strengthen its position as a partner with the automakers in vehicle designand system problem solving. Original equipmentmanufacturers are increasingly more dependent onCooper to be integrally involved in the up-frontdesign work on components for vehicles of thefuture. The ongoing investments in improvementsfor equipment and technology make the Companywell-prepared for this challenge.
Benchmarking studies increased during 1997 inautomotive product lines. Cooper assessed a varietyof world-class vehicles in customer-designated categories to determine key performance characteristicssuch as ride evaluation, pressure mapping, noisemeasurement and physical properties evaluation.These efforts have allowed Cooper to provide valuableperformance data to customers which will result inbetter products for consumers.
Research and development continues in activenoise and vibration control products with outstandingprototype performance models demonstrated topotential customers this past year. Production tooling using injection molding also began for a new spring design for a Tier-One supplier to heavytruck manufacturers.
The initial version of Computer ControlledAdjustable Mounts (CCAM) was completed in 1997.This advanced technology allows the ride characteristicsof mounts to be changed-- through computer adjustment--without removing the mount from the vehicle,resulting in a much quicker development cycle. In an effort to significantly reduce cost and weightfor vehicles, engineering is nearing completion for extruded aluminum roll restrictors to replace cast-iron designs.
Development was completed on a uniquehydraulic cradle mount design which allows varyingdamping effects in fore and aft directions versus lateraldirections as well as a heavy-duty hydrobushing forlarge sports utility vehicles. The Company also completed development and began production tooling for multiple vibration control parts for theGMT800 pickup truck program.
At the design center near Detroit, a new modelingsystem was installed to produce solid models directlyfrom CAD data. This innovative system allows
OPERATIONS – ENGINEERED PRODUCTS
Through a new program called Cooper Development Strategy (CDS),Cooper’s engineered products operation has enhanced its management
of the product development process. CDS helps Cooper engineers trackthe design, development, validation and manufacturing of Cooper's
products while working to exceed customer expectations. Through CDS,everyone on the Cooper team is able to understand how his or her
actions affect the overall product development cycle and what can be done to improve upon it.

level of engineering excellence for customers and theentire engineered products operation.
The Bowling Green sealing plant was expandedduring 1997 to include an additional 30,000 squarefeet of warehouse and manufacturing space. Thisexpansion allows for increased production for newbusiness contracts in the sealing product lines.
At the El Dorado vibration control manufacturingfacility, a new, precision, high-output banbury rubbermixer was installed this past year along with additionalequipment to meet increased business activities.
The Mount Sterling and Piedras Negras facilitiesreceived QS-9000 certifications in 1997. All six ofCooper’s engineered products manufacturing locationsnow have achieved this status and continue to regularlypass all QS-9000 audits.
MARKETING
Today’s automotive manufacturers require suppliersto quickly provide parts everywhere vehicles arebeing manufactured. Cooper’s first involvement inthis world-car manufacturing concept was the FordCDN 27 (Contour, Mystique and Mondeo) which wasdesigned in Europe, tested in Michigan and Germanyand built in Missouri, Mexico, England and Belgium.In order to be competitive in this “follow-me” sourcingenvironment, Cooper employees must work side-by-side with customer engineers and other
GLOSSARY OF TERMS
Benchmarking - Used to evaluate products orprocesses from various sources in order to deter-mine what the state of the art is, or to compare aproduct to others available in the marketplace.
Damping - A material’s ability to absorb energy toreduce vibration.
Tier-One - Manufacturers who supply parts or components directly to vehicle manufacturers.Companies at the Tier-Two level provide parts ormaterials to Tier-One suppliers.
QS-9000 - Rating program for automotive suppliersthat certifies all quality procedures are fully documented and strictly followed.
In early 1997 the engineered products sales, engineering and design force was consolidated into one major facility in Farmington Hills, Michigan,a suburb of Detroit. The 35,000-square-foot facility houses the body seal, hose and vibration control products sales groups as well as an expandedengineering and design center for body sealing and hose. The facility enables the Company to provide more services to all of its engineered products customers.
Cooper engineers to evaluate design concepts beforecreating a production tool sample, a savings in bothtime and money.
FACILITIES
Cooper is committed to continuous improvementand growth to meet the worldwide demand for itsproducts. Completion is expected in 1998 of a 76,000-square-foot engineering technical center in Auburn.This new facility will help provide an even higher

Company is determined to stay competitive intoday’s automotive market with a commitment to investments in technology, facilities and people for greater business opportunities in the future. By producing high-quality products through innovative technology, it is the goal of Cooper to
continue to grow as a world-class manufacturerof engineered products.
suppliers from around the world to develop parts to fit the manufacturer’s requirements. Cooper isactively seeking opportunities for technical agreementsand joint-ventures with other companies to strengthenits position in this global process.
Cooper engineered products appeared on everyone of the top ten best selling vehicles in the UnitedStates again in 1997. The Company currently manufactures more than 1,800 types of parts whichare sold directly to the automotive manufacturers or other Tier-One suppliers. As technology movestoward modularity -- more assemblies of productsrather than single product lines -- Cooper is in a position to modify production to take advantage of this trend.
The Company’s Auburn plant was recognizedwith several quality awards in 1997 including theGold Pentastar from Chrysler and the CertifiedSupplier Award from Eaton Yale SuspensionDivision. Mount Sterling received the Q1 awardfrom Ford Motor Company as well as the GoldPentastar from Chrysler. Piedras Negras also receivedthe Gold Pentastar from Chrysler.
The
OPERATIONS – ENGINEERED PRODUCTS
10
In 1997 Dodge launched its newest sport utility vehicle– the Durango. All of the body seals on the Durango areCooper-made as well as a number of hose products and vibration control components.
1997 TOP TENSELLING VEHICLES
Cooper has supplied parts for every vehicle on the 1997 top tenselling vehicles list as either a Tier-One or Tier-Two supplier.
1. FORD F-SERIES PICKUP 6. FORD TAURUS
2. CHEVROLET C/K PICKUP 7. DODGE RAM PICKUP
3. TOYOTA CAMRY 8. HONDA CIVIC
4. HONDA ACCORD 9. CHEVROLET CAVALIER
5. FORD EXPLORER 10. FORD RANGER

Radial passenger lines incorporate moderndesigns, competitive UTQG ratings andperformance characteristics which meet
the demands of today’s driver.
Light trucks and SUVsaccounted for five of the
top ten best selling vehiclesin 1997. Cooper’s line-up
meets the demand forstyle, durability and per-formance in this growing
market.
In the medium truck tire line, Cooper offers state-of-the-art radials along with conventional bias ply designs to meet the
needs of tractor-trailer rigs, buses, and other commercial vehicles.
Cooper supplies inner tubes in both radial and bias constructions for passenger, light truck, medium truck and special applications.
Avon brand motorcycle tires are produced for sport and touring bikes and are highlyrespected worldwide by riders for their quality and performance.
PRODUCT OVERVIEW
TIRE PRODUCTSCooper sells replacement tires and tubes to consumers through a network of independentdealers, large wholesale distributors, massmerchandisers and large retail chains.
The Company supplies engineered rubber products to virtually every automobile manufacturerin the United States and Canada, either directly or through other Tier-One suppliers.
Vibration control systems help minimize vehicle vibrations. Cooper produces mounts, bushings,isolators and torsional springs to help reduce vehicle noise and increase passenger comfort.
Automotive sealing products help seal the vehicle from outside elements. Cooper manufacturesrubber seals around vehicle doors, trunk and hood and window channels.
Hoses and assemblies are required to transport fluids, fuels and gases. Cooper’s products includehoses in a variety of shapes, sizes, diameters, lengths, rubber compounds and constructions.
ENGINEERED PRODUCTS
passenger
light truck
medium truck
motorcycle
vibration control
automotive sealing
inner tubes

senior notes and the payment of scheduled debt maturities.The new notes were issued to finance stock repurchasesand the acquisition of Cooper-Avon. Long-term debt, asa percent of total capitalization, increased to 19.8 percentat December 31, 1997 from 8.1 percent one year earlier.
Noncurrent deferred income taxes increased to $74million at December 31, 1997 from $53 million one yearearlier, primarily reflecting the excess of tax depreciationover book depreciation.
The Company has been named in environmentalmatters asserting potential joint and several liability forpast and future cleanup, state and Federal claims, siteremediation, and attorney fees. The Company has determined that it has no material liability for these matters. In addition, the Company is a defendant inunrelated product liability actions in Federal and statecourts throughout the United States in which plaintiffsassert monetary damages. While the outcome of litigationcannot be predicted with certainty, the Company believesthe pending claims and lawsuits against it should nothave a material adverse effect on its financial conditionor the results of its operations.
Stockholders’ equity increased $47 million during1997 reaching $834 million at year-end. The retention of earnings (net income less dividends paid) added $95 million to stockholders’ equity, but was partially offset by $54 million relating to the repurchase of 2.7 million shares of the Company’s stock. The adjustmentto the minimum pension liability, recognition of theimpact of cumulative foreign currency translation andexercise of stock options also contributed to the increase.Stockholders’ equity per share was $10.58 at year-end1997, an increase of 9 percent over $9.67 per share at year-end 1996.
Results of OperationsCustomer demand for the Company’s engineered rubberproducts was excellent. New and larger contracts withour customers continued to be achieved. Shipments ofthe Company’s tires outpaced those of the industry and also benefited from inclusion of Cooper-Avon’soperations during the last three quarters of the year. Netsales increased 12 percent in 1997 to a record of $1.8 billion. This followed an 8 percent increase in sales in1996 which resulted primarily from growth in customerdemand. These improvements were achieved in an environment of intense competitive pressure.
Gross margins, as a percent of net sales, were 17.3percent in 1997 compared to 15.6 percent in 1996 and 16.8
FINANCIAL REVIEW Including MANA GEMENT’S ANALYSIS and NOTES TO FINANCIAL STATEMENTS
12
Financial ConditionThe financial position of the Company continues to beexcellent. Strong operating cash flows provided fundsfor investment in productivity, expansion, product qualityand technology development and contributed to growingfinancial strength. The financial statements of theCompany include amounts for the operations of AvonTyres Limited, renamed Cooper-Avon Tyres Limited, ofMelksham, England (Cooper-Avon) acquired late in thefirst quarter of 1997.
Working capital amounted to $354 million at year-end 1997 compared with $256 million one year earlier. A current ratio of 2.8 indicates a strong liquidity positionand is up from the year-end 1996 current ratio of 2.4.
Accounts receivable increased to $292 million from$267 million at year-end 1996, reflecting the acquisition ofCooper-Avon offset by decreases in domestic receivableamounts resulting from the timing of receipts. Collectionexperience continues to be excellent and adequateallowances have been made for possible collection losses.
Total inventories at $192 million were up from $142million at year-end 1996. Finished goods inventoriescontributed $43 million of the increase resulting from the acquisition and inventory builds required duringnegotiations of labor contracts which took place late inthe year. Work in process inventories were $9 millionhigher and raw materials and supplies inventories were$2 million lower than 1996.
Investments in property, plant and equipment were$108 million in 1997 and are lower than the $194 million invested in 1996. The Company’s capitalexpenditure commitments approximated $23 million atDecember 31, 1997. Capital expenditures in 1998 areanticipated to be higher than in 1997 but below 1996 levels. Funding for these expenditures will be availablefrom operating cash flows with additional funding avail-able, if needed, under the Company’s existing commercialpaper program, credit agreement and other informallines of credit. Depreciation was $94 million in 1997, a 23 percent increase from $77 million in 1996, reflectingthe significant capital expenditures in recent years.
Intangibles and other assets are up $44 millionreflecting the value of certain trademarks and technologyacquired with the purchase of Cooper-Avon, as well asamounts related to pension accounting.
Long-term debt at $206 million increased $136 millionfrom year-end 1996 reflecting the March 1997 issuance of$200 million of 7 5/8 percent notes under the Company’sShelf Registration Statement, the retirement of the 9 percent

percent in 1995. During 1997, capacity utilization was maintained at high levels and technology improvementsyielded greater efficiencies. However, decreases in rawmaterial costs continued to be offset by price concessions.Cooper-Avon operations did not contribute to gross margin improvement in 1997. In 1996, intense pricingpressure in the replacement tire industry contributed togross margin erosion from 1995. Raw material costsmoderated in 1996, following two years of significantincreases, and offset some of the price concessions.
Increases in 1997 selling, general and administrativeexpenses were attributable to the inclusion of Cooper-Avonand expanded advertising programs. As a percent of netsales, these expenses were 5.8 percent in 1997 comparedto 4.9 percent in 1996. Selling, general and administrativeexpenses in 1996 were higher than in 1995. However, asa percent of net sales, these expenses were lower than the5 percent incurred in 1995.
Interest expense in 1997 was higher than in 1996reflecting increased borrowings and lower amounts ofcapitalized interest. The increase in interest expense in1996 from 1995 resulted from increased borrowing partially offset by capitalized interest.
The effective income tax rate of 37.2 percent in 1997is comparable to 37.3 percent in 1996 and 1995.
The operations of Cooper-Avon contributed to netsales in 1997 but did not contribute to the Company’sincrease in income. Since the acquisition in March 1997,operations have been negatively impacted by the combined strength of the British pound and the lowerthan expected shipments in the Western Europeanreplacement tire market.
The Company adopted Statement of FinancialAccounting Standards (SFAS) No. 128, “Earnings perShare,” during the fourth quarter of 1997. The Standardreplaces the calculation of primary and fully dilutedearnings per share with basic and diluted earnings per share. Amounts presented in all years reflect therequirements of the new Standard. Earnings per share in 1997 were favorably impacted by the Company’s repurchase of 5 million shares of its common stock sinceSeptember 1996.
In June, 1997 the Financial Accounting StandardsBoard (FASB) issued SFAS No. 130, “ReportingComprehensive Income,” and SFAS No. 131,“Disclosures About Segments of an Enterprise andRelated Information,” which require the disclosure oftotal comprehensive income and change the method for determining and reporting business segment
FINANCIAL REVIEW
13
information. The Company’s components of comprehensiveincome have historically been for the impact of pensionaccounting and foreign currency. The FASB’s approach todetermine business segments will cause the Company toreport certain financial information at segment levels.These Standards are required to be adopted in 1998.
The Company has developed and initiated its plansto address the possible exposures related to the impact ofthe Year 2000 on its systems and computer equipment.Key financial information and operational systems havebeen assessed and detailed plans have been implementedto address modifications required by December 31, 1999.The Company expects these modifications to be completedand tested by that time. The financial impact of makingthe required changes will be comprised of internal costs, excluding the costs required to upgrade andreplace systems and equipment in the normal course ofbusiness, and is not expected to be material to theCompany’s consolidated financial position or results of operations. The Company has also initiated communi-cations with its significant suppliers to ensure they haveappropriate plans to resolve Year 2000 issues where failure of their systems could adversely affect theCompany’s operations.
Forward-Looking StatementsThis report may contain forward-looking statementsinvolving uncertainty and risk. It is possible theCompany’s future financial performance may differ fromexpectations due to a variety of factors including but not limited to: changes in economic conditions in theworld, increased competitive activity, technologyadvancements, fluctuations in raw material and energyprices, changes in foreign exchange rates, and otherunanticipated events and conditions.
It is not possible to foresee or identify all such factors. Any forward-looking statements in this reportare based on certain assumptions and analysis made bythe Company in light of its experience and perception ofhistorical trends, current conditions, expected futuredevelopments and other factors it believes are appropriatein the circumstances. Prospective investors are cautionedthat any such statements are not a guarantee of futureperformance and actual results or developments may differ materially from those projected. The Companymakes no commitment to update any forward-lookingstatement included herein, or to disclose any facts, eventsor circumstances that may affect the accuracy of any forward-looking statement.

Significant Accounting PoliciesThe Company employs accounting policies that arebased on generally accepted accounting principles.The preparation of financial statements in conformitywith these principles requires management to makeestimates and assumptions that affect reportedamounts of (1) revenues and expenses during thereporting period, and (2) assets and liabilities, as wellas disclosure of contingent assets and liabilities, at thedate of the financial statements. Actual results coulddiffer from those estimates.
The following summary of significant accountingpolicies is presented for assistance in the evaluationand interpretation of the financial statements and supplementary data.
Consolidation - The consolidated financial state-ments include the accounts of the Company and itssubsidiaries, all of which are wholly-owned. All mate-rial intercompany accounts and transactions havebeen eliminated.
Cash and cash equivalents - The Company considersall highly liquid investments with an original maturityof three months or less to be cash equivalents. Thecarrying amount reported in the balance sheets forcash and cash equivalents approximates its fair value.
Inventories - Inventories are valued at cost, whichis not in excess of market. Inventory costs have beendetermined by the last-in, first-out (LIFO) method forsubstantially all domestic inventories. Costs of otherinventories have been determined principally by thefirst-in, first-out (FIFO) method.
Property, plant and equipment - Assets are recordedat cost and depreciated or amortized using thestraight-line method over their expected useful lives.For income tax purposes accelerated depreciationmethods and shorter lives are used.
Intangibles - Intangibles include trademarks, technology and intellectual property acquired fromAvon Rubber p.l.c. These assets are being amortized overtheir useful lives which range from 15 years to 40 years.
Stock options - The Company accounts foremployee stock options in accordance with AccountingPrinciples Board Opinion (APB) No. 25, “Accountingfor Stock Issued to Employees.” Additional disclosuresrequired under Statement of Financial AccountingStandards (SFAS) No. 123, “Accounting for Stock-BasedCompensation,” are included in the Stock Options note.
Revenue recognition - Revenues are recognizedwhen goods are shipped to customers in accordancewith their purchase orders.
Warranties - Estimated costs for product warrantiesare charged to income at the time of sale.
Research and development - Costs are charged toexpense as incurred and amounted to approximately$21,700, $19,700 and $16,000 in 1997, 1996 and 1995,respectively.
Earnings per share - During the fourth quarter of1997 the Company adopted SFAS No. 128, “Earningsper Share.” The Standard replaces the calculation ofprimary and fully diluted earnings per share with basicand diluted earnings per share. Amounts presented inall years reflect the requirements of the new Standard.
Accounting pronouncements - In June 1997, theFinancial Accounting Standards Board (FASB) issuedStatement of Financial Accounting Standards (SFAS)No. 130, “Reporting Comprehensive Income,” andSFAS No. 131, “Disclosures about Segments of anEnterprise and Related Information,” which require thedisclosure of total comprehensive income and changethe method for determining and reporting businesssegment information. The Company’s components ofcomprehensive income have historically been for theimpact of pension accounting and foreign currency.The FASB’s approach to determine business segmentswill cause the Company to report certain financialinformation at segment levels. These Standards arerequired to be adopted for fiscal years beginning afterDecember 31, 1997.
BusinessThe Company, a specialist in the rubber industry,manufactures and markets automobile, truck andmotorcycle tires; inner tubes; vibration control systems; automotive sealing; hose and assemblies.Product shipments to original equipment vehicle manufacturers historically have approximated 15 to20 percent of net sales.
The Company manufactures products in NorthAmerica and the United Kingdom for the transportationindustry. Shipments of domestically-produced products to customers outside the United Statesapproximated eight, nine and eight percent of netsales in 1997, 1996 and 1995, respectively. Sales to onemajor customer approximated 12, 17 and 14 percent ofnet sales in 1997, 1996 and 1995, respectively.
AcquisitionOn March 14, 1997, the Company, through a wholly-owned United Kingdom subsidiary, acquired the tireoperations of Avon Rubber p.l.c. (Avon) of the UnitedKingdom. This purchase includes the land and manufacturing facility in Melksham, England; the sharesof Avon Tyres Limited and shares of tire distributioncompanies in France, Germany and Switzerland; and
FINANCIAL REVIEW(Dollar amounts in thousands; per-share amounts in dollars)
14

short-term basis, with interest at varying rates. Thecredit facility provides for borrowings in foreign cur-rencies and supports the issuance of commercialpaper. The proceeds may be used for general corpo-rate purposes. A commitment fee is payable quarterlyand is based on the daily unused portion of the amountauthorized. The agreement requires the maintenance ofcertain debt and fixed charge coverage ratios. TheCompany has other informal lines of credit available tomeet domestic borrowing needs.
In March 1997 the Company issued $200,000 of 7 5/8 percent notes under a Registration Statement withthe Securities and Exchange Commission. The notes,due March 15, 2027, provide for semiannual interestpayments on March 15 and September 15 with principaldue in full at maturity. Proceeds from the issuancewere used for the repurchase of 5,000,000 shares of theCompany’s common stock and the acquisition of AvonTyres Limited. Based on the borrowing rates availableto the Company for instruments with similar termsand maturity at December 31, 1997 the fair value of the 7 5/8 percent notes was $223,417.
On October 2, 1997 the Company retired the 9 percent senior notes due in 2001.
Interest paid on debt during 1997, 1996 and 1995was $12,983, $6,217 and $3,515, respectively. Theamount of interest capitalized was $1,628, $4,315 and$2,694 during 1997, 1996 and 1995, respectively.
The required principal payments for long-termdebt during the next five years are as follows: 1998 -$453; 1999 - $224; 2000 - $182; 2001 - none; 2002 - none.
Lease CommitmentsThe Company rents certain manufacturing facilitiesand equipment under long-term leases expiring atvarious dates. Rental expense for operating leaseswas $11,079 for 1997, $7,242 for 1996 and $6,696 for1995.
Future minimum payments for all noncancelableoperating leases during the next five years are as fol-lows: 1998 - $5,069; 1999 - $3,722; 2000 - $2,485; 2001 -$1,867; 2002 - $1,350.
Accrued LiabilitiesAccrued liabilities at December 31, were as follows:
0 199700 0 19960Payroll . . . . . . . . . . . . . . . . . . . . . . . . . . . . . . . . . . . $40,311 $32,299Other . . . . . . . . . . . . . . . . . . . . . . . . . . . . . . . . . . . . . $42,135 $33,428
.......................................................................... $82,446 $65,727
.......................................................................... $60,910 $10,710
FINANCIAL REVIEW
other minor assets. In a separate transaction theCompany acquired from Avon various trademarksand technology. The acquisitions have been accountedfor as a purchase with allocations, subject to adjust-ments, as follows:
Working capital . . . . . . . . . . . . . . . . . . . . . . . . . . . . . . . . . . . . . $37,861)Property, plant and equipment . . . . . . . . . . . . . . . . . . . . . . 54,288)Intangibles and other assets . . . . . . . . . . . . . . . . . . . . . . . . . 28,710)Debt . . . . . . . . . . . . . . . . . . . . . . . . . . . . . . . . . . . . . . . . . . . . . . . . . (13,867)Other liabilities . . . . . . . . . . . . . . . . . . . . . . . . . . . . . . . . . . . . . . (10,461)
............................................................................................ $96,531)
............................................................................................ $60,910)The Company’s consolidated financial results and financial position subsequent to the date of the acqui-sition reflect Avon operations. Had these acquisitionsoccurred as of the beginning of 1996, the pro formaresults of operations giving effect to the acquisitionswould not be materially different from the net sales,net income and earnings per share presented in thestatements of income.InventoriesUnder the LIFO method, inventories have beenreduced by approximately $60,627 and $73,925 atDecember 31, 1997 and 1996, respectively, from current cost which would be reported under the first-in, first-out method. Approximately 85 percentand 99 percent of the Company’s inventories havebeen valued under the LIFO method at December 31,1997 and 1996, respectively.DebtShort-term debt at December 31, 1997 consisted of bankline borrowings primarily in European currencies at a weighted average interest rate of 5.6 percent. At December 31, 1996 short-term debt consisted of commercial paper borrowings and notes payable at aweighted average interest rate of 5.6 percent.
The Company’s long-term debt at December 31consisted of the following: 0)1997)0 019960
7 5/8% notes due 2027 . . . . . . . . . . . . . . . . . . . . . . . $200,000 $ 5,–70Commercial paper notes with a weighted
average interest rate of 5.6% . . . . . . . . . . . . –70 46,0009% senior notes due 2001 . . . . . . . . . . . . . . . . . . –70 22,727Capitalized leases and other . . . . . . . . . . . . . . . . $115,978 $ 5,843............................................................................. 205,978 74,570Less current maturities . . . . . . . . . . . . . . . . . . . . . $115,453 $, 5,081............................................................................. $205,525 $69,489............................................................................. $660,910 $10,710
The Company has an agreement with four banks authorizing borrowings up to $150,000 on a long-termbasis through October 31, 2002 and $100,000 on a
15

Common StockThere were 9,629,932 common shares reserved for theexercise of stock options and contributions to theCompany’s Thrift and Profit Sharing and Pre-TaxSavings plans at December 31, 1997.
Preferred Stock Purchase RightEach stockholder is entitled to the right to purchase1/100th of a newly-issued share of Series A preferredstock of the Company at an exercise price of $16.88.The rights will be exercisable only if a person or groupacquires beneficial ownership of 20 percent or moreof the Company’s outstanding common stock, orcommences a tender or exchange offer which uponconsummation would result in such person or groupbeneficially owning 30 percent or more of theCompany’s outstanding common stock.
If any person becomes the beneficial owner of 25percent or more of the Company’s outstanding com-mon stock, or if a holder of 20 percent or more of theCompany’s common stock engages in certain self-dealing transactions or a merger transaction in whichthe Company is the surviving corporation and itscommon stock remains outstanding, then each rightnot owned by such person or certain related partieswill entitle its holder to purchase a number of sharesof the Company’s Series A preferred stock having amarket value equal to twice the then current exerciseprice of the right. In addition, if the Company isinvolved in a merger or other business combinationtransaction with another person after which theCompany’s common stock does not remain out-standing, or if the Company sells 50 percent or more ofits assets or earning power to another person, eachright will entitle its holder to purchase a number ofshares of common stock of such other person having amarket value equal to twice the then current exerciseprice of the right.
The Company will generally be entitled toredeem the rights at one cent per right, or as adjustedto reflect stock splits or similar transactions, at anytime until the tenth day following public announce-ment that a person or group has acquired 20 percent ormore of the Company’s common stock.Stock OptionsThe Company has elected to follow APB No. 25,“Accounting for Stock Issued to Employees,” inaccounting for employee stock options. Under APBNo. 25 no compensation expense is recognizedbecause the exercise price of the Company’s employeestock options equals the market price of the underlyingstock at the date of grant.
SFAS No. 123, “Accounting for Stock-BasedCompensation,” is effective for awards granted by the Company during fiscal years beginning afterDecember 15, 1994. The Standard requires, if APB No. 25is followed, disclosure of pro forma informationregarding net income and earnings per share deter-mined as if the Company accounted for its employeestock options under the fair value method. The fairvalue for these options was estimated at the date ofgrant using a Black-Scholes option pricing model withthe following weighted-average assumptions:
0 1997 000 1996 000 1995 0Risk-free interest rate . . . . . . . . . . . . 6.1% 6.6% 6.2%Dividend yield . . . . . . . . . . . . . . . . . . 1.0% 1.0% 1.0%Expected volatility of the
Company’s common stock . . . . .197 .206 .203Expected life . . . . . . . . . . . . . . . . . . . . . 6.2 years 5.4 years 5.3 years
The weighted-average fair value of options grantedin 1997, 1996 and 1995 was $7.52, $5.58 and $6.98,respectively. For purposes of pro forma disclosures,the estimated fair value of options is amortized toexpense over the options’ vesting period. During1995, only grants awarded during the year are amor-tized. During 1996, amortization attributable to grantsawarded in both 1995 and 1996 impacts pro formaresults. During 1997, amortization attributable togrants awarded in 1997, 1996 and 1995 impacts proforma results. The Company’s reported and pro formainformation follows:
0 1997 00 0 1996 00 0 1995 0Net income:
Reported . . . . . . . . . . . . . . . . . . . . . . $122,411 $107,884 $112,820Pro forma . . . . . . . . . . . . . . . . . . . . . $121,603 $107,363 $112,653
Basic and diluted earnings per share:Reported . . . . . . . . . . . . . . . . . . . . . . $1.55 $1.30 $1.35Pro forma . . . . . . . . . . . . . . . . . . . . . $1.54 $1.29 $1.35
The Company’s 1981, 1986 and 1996 incentivestock option plans provide for granting options to keyemployees to purchase common shares at prices notless than market at the date of grant. Options underthese plans may have terms of up to ten years becomingexercisable in whole or in consecutive installments,cumulative or otherwise. The 1981 and 1986 plans wereamended in 1988 to allow the granting of nonqualifiedstock options. Nonqualified stock options are notintended to qualify for the tax treatment applicable toincentive stock options under provisions of the InternalRevenue Code. The options granted under these planswhich were outstanding at December 31, 1997 have aterm of ten years and become exercisable 50 percentafter the first year and 100 percent after the second year.
FINANCIAL REVIEW(Dollar amounts in thousands; per-share amounts in dollars)
16

17
The Company’s 1991 nonqualified stock optionplan provides for granting options to directors, whoare not current or former employees of the Company,to purchase common shares at prices not less thanmarket at the date of grant. Options granted underthis plan have a term of ten years and are exercisablein full beginning one year after the date of grant.
Summarized information for the plans follows:
WeightedNumber Average
of Exercise Price Range00Shares00 00 Price00 i Per Share 00 i
January 1, 1995Outstanding . . . . . . . . . . . . . . . 475,232 $18.15 $ 5.09 - $34.69Exercisable . . . . . . . . . . . . . . . . . . 355,522 15.93Granted under 1986 plan . . . 103,800 24.13 24.13Granted under 1991 plan . . . 3,153 24.25 24.25Exercised . . . . . . . . . . . . . . . . . . (27,900) 10.87 5.09 - $25.00Cancelled . . . . . . . . . . . . . . . . . . 0(13,110) 24.90 24.13 - $25.00
December 31, 1995Outstanding . . . . . . . . . . . . . . . 541,175 19.54 5.09 - $34.69Exercisable . . . . . . . . . . . . . . . . . . 397,822 17.85Granted under 1991 plan . . . 1,703 24.31 24.31Granted under 1996 plan . . . 140,900 18.50 18.50Exercised . . . . . . . . . . . . . . . . . . (10,400) 10.23 5.09 - $15.19Cancelled . . . . . . . . . . . . . . . . . . 0(27,786) 19.57 5.09 - $34.69
December 31, 1996Outstanding . . . . . . . . . . . . . . . 645,592 19.47 5.09 - $34.69Exercisable . . . . . . . . . . . . . . . . . . 454,439 19.24Granted under 1991 plan . . . 1,955 22.69 22.69Granted under 1996 plan . . . 229,000 24.50 24.50Exercised . . . . . . . . . . . . . . . . . . (87,936) 13.20 5.09 - $25.00Cancelled . . . . . . . . . . . . . . . . . . 0(32,264) 22.87 15.19 - $34.69
December 31, 1997Outstanding . . . . . . . . . . . . . . . 756,347 21.59 5.09 - $34.69Exercisable . . . . . . . . . . . . . . . . . . 460,992 20.58
The weighted average remaining contractual lifeof options outstanding at December 31, 1997 is 7.1 years.
SFAS No. 123 also requires segregated disclosureof options outstanding if a significant range of exerciseprices exists. This information, at December 31, 1997,is as follows:
0 iRange of Exercise Pricesi0
Less Equal to or0 than $2400greater than $24
Options outstanding . . . . . . . . . . . . . . 248,555 507,792
Weighted averageexercise price . . . . . . . . . . . . . $15.53 $24.56
Remaining contractual life . . . 5.9 7.7
Options exercisable . . . . . . . . . . . . . . . 182,100 278,892
Weighted averageexercise price . . . . . . . . . . . . . $14.40 $24.61
The status of options exercisable and availablefor grant for each plan is as follows:
1981 1986 1991 1996‘ Plan’ 0 Plan 0 ‘ Plan ’ 0 Plan 0
December 31, 1995Exercisable . . . . . . . . . . . 22,424 367,012 8,386Available for grant . . . –00 1,146,300 88,225
December 31, 1996Exercisable . . . . . . . . . . . 22,424 425,712 6,303 –00Available for grant . . . –00 –00 90,758 3,060,600
December 31, 1997Exercisable . . . . . . . . . . . 6,800 384,650 5,492 64,050Available for grant . . . –00 –00 90,317 2,841,500
Earnings Per ShareBasic earnings per share is based upon the weightedaverage number of shares outstanding which were79,127,577 in 1997, 83,213,960 in 1996 and 83,645,864 in 1995. Diluted earnings per share includes the dilutive effect of employee stock options. The impactof employee stock options in the computation of diluted earnings per share did not result in amountsdifferent from basic earnings per share.
PensionsThe Company has defined benefit plans coveringsubstantially all employees. The domestic salary planprovides pension benefits based on an employee’s yearsof service and average earnings for the five highestcalendar years during the ten years immediatelypreceding retirement. The domestic hourly plans provide benefits of stated amounts for each year ofservice. The Company’s general funding policy is tocontribute amounts deductible for Federal income tax purposes.
Employees in the United Kingdom are coveredby a contributory, defined benefit pension plan.Benefits are based on an employee’s years of serviceand last three years of earnings. Employees may makecontributions to the plan to increase their benefit. The Company’s funding requirement is determined by statute.
Pension expense for 1997, 1996 and 1995 includedthe following components:
0 1997 0 0 1996 0 0 1995 0
Service cost . . . . . . . . . . . . . . . . . . . . . . $16,668) $13,811) $09,833)Interest cost . . . . . . . . . . . . . . . . . . . . . 32,716) 24,707) 20,374)Actual return on plan assets . . . . . (70,573) (44,559) (54,268))Net amortization and deferral . . . $37,356)$ 24,144) 38,966 Net periodic pension cost . . . . . . . $16,167) $18,103) $14,905)

December 31, 1997 December 31, 1996
Plans for Which Plans for Which
Assets Exceed Accumulated Assets Exceed AccumulatedAccumulated Benefits Accumulated Benefits
Benefits Exceed Assets Benefits Exceed AssetsActuarial present value of benefit obligations:
Vested benefit obligation . . . . . . . . . . . . . . . . . . . . . . . . . . . . . . . . . . . . . . $263,848) $124,817) $147,256) $120,221)lower rule for chartAccumulated benefit obligation . . . . . . . . . . . . . . . . . . . . . . . . . . . . . . . $267,971) $128,361) $150,416) $123,905)lower rule for chartProjected benefit obligation . . . . . . . . . . . . . . . . . . . . . . . . . . . . . . . . . . . $382,367) $129,938) $218,512) $124,911)
Plans’ assets at fair value . . . . . . . . . . . . . . . . . . . . . . . . . . . . . . . . . . . . . . . . . . . 405,668) $(109,032) $225,077) $(95,195)
Projected benefit obligation less than (in excess of) plan assets . . . . . 23,301) (20,906) 06,565) (29,716)Unrecognized transition amount . . . . . . . . . . . . . . . . . . . . . . . . . . . . . . . . . . . 3,753) 1,970) 4,485) 2,326)Unrecognized prior service cost . . . . . . . . . . . . . . . . . . . . . . . . . . . . . . . . . . . . 309) 10,356) 93) 9,818)Unrecognized net loss . . . . . . . . . . . . . . . . . . . . . . . . . . . . . . . . . . . . . . . . . . . . . . 4,180) 8,412) 12,736) 12,753)Adjustment for minimum liability . . . . . . . . . . . . . . . . . . . . . . . . . . . . . . . . . . 00000000–000) $(19,910) 00000000–000) $(24,709)
Pension asset (liability) recognized in the Balance Sheet . . . . . . . . . . . . $031,543) $ (20,078) $023,879) $ (29,528)lower rule for chart
FINANCIAL REVIEW(Dollar amounts in thousands; per-share amounts in dollars)
18
For domestic plans, the assumed rate of increasein future compensation levels was 5.5 percent and theassumed discount rate used in determining the actuarialpresent value of the projected benefit obligation was 7.5percent at December 31, 1997 and 1996. The expectedlong-term rate of return on the plans’ assets was 10 percent in 1997, 1996 and 1995.
For the United Kingdom plan, the assumed discount rate used was 7.5 percent, the assumed rateof increase in future compensation levels was 5.5 percentand the expected long-term rate of return on the plans’assets was 8.5 percent at December 31, 1997.
The information presented above includes anunfunded, nonqualified supplemental executiveretirement plan covering certain employees whoseparticipation in the qualified plan is limited by provisions of the Internal Revenue Code.
The Company sponsors several defined contribution plans for its domestic employees.Substantially all domestic employees are eligible toparticipate upon attaining minimum continuous
service requirements. Participation is voluntary andparticipants’ contributions are based on their compensation. The Company matches certain planparticipants’ contributions up to various limits.Company contributions are based on the lesser of (a) participants’ contributions up to a specified percent of each participant’s compensation, less anyforfeitures, or (b) an amount equal to 15 percent of theCompany’s pre-tax earnings in excess of ten percent ofstockholders’ equity at the beginning of the year.Expense for these plans was $9,334, $8,331 and $8,489for 1997, 1996 and 1995, respectively.
Postretirement Benefits Other Than PensionsThe Company currently provides certain health careand life insurance benefits for its active and retireddomestic employees. If the Company does not termi-nate such benefits, or modify coverage or eligibilityrequirements, substantially all of the Company’sdomestic employees may become eligible for thesebenefits upon retirement if they meet certain age and
Net periodic pension cost in 1997 includes $2,018 attributable to nine months of operations for the United Kingdom plan. The increases in service and interest costs in 1996 result from changes in certain demographic actuarial assumptions made atDecember 31, 1995.
The plans’ assets consist of cash, cash equiva-lents and marketable securities. The funded status ofthe Company’s domestic and United Kingdom plansat December 31, 1997 and 1996 was as follows:

Income TaxesThe provision for income taxes consists of the following:
1997 1996 1995
Current:Federal and foreign. . . . . . . . . $52,570 $44,250 $51,141State and local . . . . . . . . . . . . . . 6,310 5,862 6,753
..................................................... 58,880 50,112 57,894Deferred:
Federal and foreign. . . . . . . . . 11,738 12,096 8,062State and local . . . . . . . . . . . . . . 1,763 2,000 1,294
..................................................... 13,501 14,096 9,356
..................................................... $72,381 $64,208 $67,250
The effective income tax rate differs from thestatutory Federal tax rate as follows:
1997 1996 1995
Statutory Federal tax rate . . . . . . . . 35.0% 35.0% 35.0%State and local income taxes, net of
Federal income tax benefit . . . . . 2.7 3.0 2.9Other. . . . . . . . . . . . . . . . . . . . . . . . . . . . . (0.5) (0.7) (0.6)
Effective income tax rate . . . . . . . . . 37.2% 37.3% 37.3%
Payments for income taxes in 1997, 1996 and1995 were $55,610, $57,884 and $53,110, respectively.
Deferred income taxes reflect the net tax effectsof temporary differences between the carryingamount of assets and liabilities for financial reportingpurposes and the amounts used for income taxpurposes. Significant components of the Company’sdeferred tax liabilities and assets as of December 31,1997 and 1996 are as follows:
1997 1996Deferred tax liabilities:
Property, plant and equipment . . . . . . . . . $107,424 $87,327Other . . . . . . . . . . . . . . . . . . . . . . . . . . . . . . . . . . . 35,434 28,647
Total deferred tax liabilities . . . . . . . . . . . 142,858 115,974Deferred tax assets:
Postretirement benefitsother than pensions . . . . . . . . . . . . . . . . 53,957 50,661
Other . . . . . . . . . . . . . . . . . . . . . . . . . . . . . . . . . . . 26,833 24,175Total deferred tax assets . . . . . . . . . . . . . . . 80,790 74,836Net deferred tax liabilities . . . . . . . . . . . . $162,068 $41,138
lower rule for chartThese amounts are included in the accompanyingbalance sheet captions:
1997 1996Prepaid expenses and
deferred income taxes. . . . . . . . . . . . . . . . . . $11,540 $11,630Deferred income taxes . . . . . . . . . . . . . . . . . . . 73,608 $052,768
Net deferred tax liabilities . . . . . . . . . . . . $62,068 $41,138lower rule for chart
FINANCIAL REVIEW(Dollar amounts in thousands; per-share amounts in dollars)
19
service requirements. The Company has reserved theright to modify or terminate such benefits at any time,subject to applicable terms and conditions containedin union agreements for non-salary participants. Inrecent years benefit changes have been implementedthroughout the Company.
The Company continues to fund these benefitcosts as claims are incurred. Postretirement benefitsexpense for 1997, 1996 and 1995 included the followingcomponents:
1997 1996 1995
Service cost . . . . . . . . . . . . . . . . . . . $03,465 $03,254 $12,607)
Interest cost . . . . . . . . . . . . . . . . . . . 11,468 10,674 9,810)
Amortization . . . . . . . . . . . . . . . . . –01 –01 (333)
\ .................................................... $14,933 $13,928 $12,084)lower rule for chart
The status of the Company’s plans at December 31,1997 and 1996 was as follows:
1997 1996Accumulated postretirement
benefits obligation (APBO):Retirees . . . . . . . . . . . . . . . . . . . . . . . . . . . . . . . . . . $080,812 $078,378Fully eligible active plan participants . . . 25,074 26,413Other active plan participants . . . . . . . . . . . $047,251 $039,143
........................................................................... 153,137 143,934Deferred gain . . . . . . . . . . . . . . . . . . . . . . . . . . . . . 2,429 2,836
Postretirement benefits liability . . . . . . . . . . $153,566 $146,770
These amounts are included in the accompany-ing balance sheet captions:
1997 1996
Accrued liabilities . . . . . . . . . . . . . . . . . . . . . . . $009,000 $007,700Postretirement benefits
other than pensions . . . . . . . . . . . . . . . . . . . 144,566 $0139,070
..................................................................... $153,566 $146,770
The discount rate used in determining the APBOwas 8 percent in 1997 and 1996. At December 31, 1997,the assumed average annual rate of increase in thecost of health care benefits (health care cost trend rate)was 8.5 percent for 1998 declining by 1/2 percent peryear through 2004 when the ultimate rate of 5.5 percent is attained. This trend rate assumption has a significant effect on the amounts reported above. A 1 percent increase in the health care cost trend ratewould increase the APBO by $3,658 and the net periodic expense by $405 for the year.
The Company has a Voluntary Employees’Beneficiary Trust and Welfare Benefits Plan (VEBA) tofund health benefits for eligible active and retireddomestic employees. The pre-funded amount was$13,400 in 1997 and $11,400 in 1996.

Assets 1997 1996
Current assets:Cash and cash equivalents . . . . . . . . . . . . . . . . . . . . . . . . . . . . . . . . . . . . . . . . . . . . . . . . . . $1,152,910 $1,119,459
Accounts receivable, less allowances of $4,791 in 1997and $3,700 in 1996 . . . . . . . . . . . . . . . . . . . . . . . . . . . . . . . . . . . . . . . . . . . . . . . . . . . . . . . 292,416 267,149
Inventories:
Finished goods . . . . . . . . . . . . . . . . . . . . . . . . . . . . . . . . . . . . . . . . . . . . . . . . . . . . . . . . . . . . . . 130,339 87,105
Work in process . . . . . . . . . . . . . . . . . . . . . . . . . . . . . . . . . . . . . . . . . . . . . . . . . . . . . . . . . . . . . 22,650 13,419
Raw materials and supplies . . . . . . . . . . . . . . . . . . . . . . . . . . . . . . . . . . . . . . . . . . . . . . $0,038,695 $0,041,094
............................................................................................................................ 191,684 141,618
Prepaid expenses and deferred income taxes . . . . . . . . . . . . . . . . . . . . . . . . . . . . $0,017,602 $0,015,399
Total current assets . . . . . . . . . . . . . . . . . . . . . . . . . . . . . . . . . . . . . . . . . . . . . . . . . . . . . . . 554,612 443,625
Property, plant and equipment:
Land and land improvements . . . . . . . . . . . . . . . . . . . . . . . . . . . . . . . . . . . . . . . . . . . . . . 28,765 23,641
Buildings . . . . . . . . . . . . . . . . . . . . . . . . . . . . . . . . . . . . . . . . . . . . . . . . . . . . . . . . . . . . . . . . . . . . . . . 272,308 265,118
Machinery and equipment . . . . . . . . . . . . . . . . . . . . . . . . . . . . . . . . . . . . . . . . . . . . . . . . . . 1,013,354 882,774
Molds, cores and rings . . . . . . . . . . . . . . . . . . . . . . . . . . . . . . . . . . . . . . . . . . . . . . . . . . . . . . . $0,084,660 $0,069,316
............................................................................................................................ 1,399,087 1,240,849
Less accumulated depreciation and amortization . . . . . . . . . . . . . . . . . . . . . . . $0,538,639 $0,448,430
Net property, plant and equipment . . . . . . . . . . . . . . . . . . . . . . . . . . . . . . . . . . . 860,448 792,419
Intangibles and other assets . . . . . . . . . . . . . . . . . . . . . . . . . . . . . . . . . . . . . . . . . . . . . . . . . . . $0,080,896 $0,036,965
............................................................................................................................ $1,495,956 $1,273,009
............................................................................................................................ $889,584,1 $889,584,1$889,584,1
CONSOLIDATED BALANCE SHEETS December 31
(Dollar amounts in thousands; per-share amounts in dollars)
20
See Financial Review, pages 14 to 19.

PAGE HEADING December 31
21
See Financial Review, pages 13 to 18.
Liabilities and Stockholders’ Equity 1997 1996
Current liabilities:Notes payable . . . . . . . . . . . . . . . . . . . . . . . . . . . . . . . . . . . . . . . . . . . . . . . . . . . . . . . . . . . . . . . . . $0,010,820) $0,032,000)Accounts payable . . . . . . . . . . . . . . . . . . . . . . . . . . . . . . . . . . . . . . . . . . . . . . . . . . . . . . . . . . . . . 100,135) 81,571)Accrued liabilities . . . . . . . . . . . . . . . . . . . . . . . . . . . . . . . . . . . . . . . . . . . . . . . . . . . . . . . . . . . . . 82,446) 65,727)Income taxes . . . . . . . . . . . . . . . . . . . . . . . . . . . . . . . . . . . . . . . . . . . . . . . . . . . . . . . . . . . . . . . . . . . 6,477) 3,116)Current portion of debt . . . . . . . . . . . . . . . . . . . . . . . . . . . . . . . . . . . . . . . . . . . . . . . . . . . . . . $00,05,453) $00,05,081)
Total current liabilities . . . . . . . . . . . . . . . . . . . . . . . . . . . . . . . . . . . . . . . . . . . . . . . . . . 200,331) 187,495)
Long-term debt . . . . . . . . . . . . . . . . . . . . . . . . . . . . . . . . . . . . . . . . . . . . . . . . . . . . . . . . . . . . . . . . . . 205,525) 69,489)
Postretirement benefits other than pensions . . . . . . . . . . . . . . . . . . . . . . . . . . . . . . . . 144,566) 139,070)
Other long-term liabilities . . . . . . . . . . . . . . . . . . . . . . . . . . . . . . . . . . . . . . . . . . . . . . . . . . . . . 38,351) 37,575)
Deferred income taxes . . . . . . . . . . . . . . . . . . . . . . . . . . . . . . . . . . . . . . . . . . . . . . . . . . . . . . . . . . 73,608) 52,768)
Stockholders’ equity:Preferred stock, $1 per share par value;
5,000,000 shares authorized; none issued . . . . . . . . . . . . . . . . . . . . . . . . . . . . . . . 0 000000–0000) 0 000000–0000)Common stock, $1 per share par value; 300,000,000 shares
authorized; 83,760,308 shares issued (83,672,372 in 1996) . . . . . . . . . . . . 83,760) 83,672)Capital in excess of par value . . . . . . . . . . . . . . . . . . . . . . . . . . . . . . . . . . . . . . . . . . . . . . . 3,101) 2,027)Retained earnings . . . . . . . . . . . . . . . . . . . . . . . . . . . . . . . . . . . . . . . . . . . . . . . . . . . . . . . . . . . . . 849,270) 754,481)Cumulative currency translation adjustment . . . . . . . . . . . . . . . . . . . . . . . . . . . . 2,448) 0–0000)Minimum pension liability . . . . . . . . . . . . . . . . . . . . . . . . . . . . . . . . . . . . . . . . . . . . . . . . . . $100(4,753) $100(7,434)
............................................................................................................................ 933,826) 832,746)
Less: 5,000,000 common shares in treasury at cost (2,305,500 in 1996) . . . . . . . . . . . . . . . . . . . . . . . . . . . . . . . . . . . . . . . . . . . . . . . . . . . . . . . . . . . . . $1(100,251) $10(46,134)
Total stockholders’ equity . . . . . . . . . . . . . . . . . . . . . . . . . . . . . . . . . . . . . . . . . . . . . . $1,833,575) $1,786,612)
............................................................................................................................ $1,495,956) $1,273,009)
............................................................................................................................ $8,890,054) $1,790,857)

1997 1996 1995
Revenues:Net sales . . . . . . . . . . . . . . . . . . . . . . . . . . . . . . . . . . . . . . . . . . . . . . . . . . . . . . . . . $1,813,005 $1,619,345 $1,493,622Other income . . . . . . . . . . . . . . . . . . . . . . . . . . . . . . . . . . . . . . . . . . . . . . . . . . . $0,001,406 $0,003,824 $0,003,836
...................................................................................................... 1,814,411 1,620,169 1,497,458
Costs and expenses:Cost of products sold . . . . . . . . . . . . . . . . . . . . . . . . . . . . . . . . . . . . . . . . . . 1,498,432 1,366,549 1,242,895Selling, general and administrative . . . . . . . . . . . . . . . . . . . . . . . . . 105,532 79,874 73,796Interest . . . . . . . . . . . . . . . . . . . . . . . . . . . . . . . . . . . . . . . . . . . . . . . . . . . . . . . . . . . $0,015,655 $0,001,654 $0,000,697
...................................................................................................... $1,619,619 $1,448,077 $1,317,388
Income before income taxes . . . . . . . . . . . . . . . . . . . . . . . . . . . . . . . . . . . . 194,792 172,092 180,070
Provision for income taxes . . . . . . . . . . . . . . . . . . . . . . . . . . . . . . . . . . . . . $0,072,381 $0,064,208 $0,067,250
Net income . . . . . . . . . . . . . . . . . . . . . . . . . . . . . . . . . . . . . . . . . . . . . . . . . . . . . . . . $1,122,411 $1,107,884 $1,112,820Net income ................................................................................. $0,128,519 $0,102,210 $0,043,687Basic and diluted earnings per share . . . . . . . . . . . . . . . . . . . . . . . . . $1.55 $1.30 $1.35Net income per share . . . . . . . . . . . . . . . . . . . . . . . . . . . . . . . . . . . . . . . . . . . . $1.22 $0.52 $9.96
CONSOLIDATED STATEMENTS OF INCOME Years ended December 31
(Dollar amounts in thousands; per-share amounts in dollars)
22
See Financial Review, pages 14 to 19.

STATEMENTS OF STOCKHOLDERS’ EQUITY Years ended December 31
(Dollar amounts in thousands; per-share amounts in dollars)
CONSOLIDATED
23
See Financial Review, pages 14 to 19.
CumulativeCommon Capital In Currency Minimum Common
Stock Excess of Retained Translation Pension Shares in$1 Par Value Par Value Earnings Adjustment Liability Treasury Total
Balance at January 1, 1995 . . . . . . . . . . . . . $83,634 $1,656) $582,137) $7 1–3 $ (5,350) $(447, 1–3) $662,077)
Net income . . . . . . . . . . . . . . . . . . . . . . . . . . . . 112,820) 112,820)
Exercise of stock options . . . . . . . . . . . . 28 275) 303)
Cash dividends - $.27 per share . . . (22,584) (22,584)
Minimum pension liability adjustment, net of income taxes . . . . . . . . . . . . . . . . $00,000 $0,000) $000,000) $0,0–0 0 (3,817) $(447, 1–3) 00 (3,817)
Balance at December 31, 1995 . . . . . . . . . 83,662 1,931) 672,373) –3 (9,167) –3) 748,799)
Net income . . . . . . . . . . . . . . . . . . . . . . . . . . . . 107,884) 107,884)
Purchase of treasury shares . . . . . . . . (46,134) (46,134)
Exercise of stock options . . . . . . . . . . . . 10 96) 106)
Cash dividends - $.31 per share . . . (25,776) (25,776)
Minimum pension liability adjustment, net of income taxes . . . . . . . . . . . . . . . . $00,000 $0,000) $000,000) $0,000 $ (1,733) $(447, 1–3) 00 (1,733)
Balance at December 31, 1996 . . . . . . . . . 83,672 2,027) 754,481) –3 (7,434) (46,134) 786,612)
Net income . . . . . . . . . . . . . . . . . . . . . . . . . . . . 122,411) 122,411)
Purchase of treasury shares . . . . . . . . (54,117) (54,117)
Exercise of stock options . . . . . . . . . . . . 88 1,074) 1,162)
Cash dividends - $.35 per share . . . (27,622) (27,622)
Cumulative currencytranslation adjustment . . . . . . . . . . . . 2,448 2,448)
Minimum pension liability adjustment, net of income taxes . . . . . . . . . . . . . . . . $00,000 $0,000) $000,000) $0,000 $ (2,681) $(447, 1–3) 00 (2,681)
Balance at December 31, 1997 . . . . . . . . . $83,760 $3,101) $849,270) $2,448 $ (4,753) $ (100,251) $833,575)Balance at December 31, 1993 . . . . . . . . . $83,581 $1,201) $465,388) $1,201 $65,388) $ (665,388) $465,388)

STATEMENTS OF CASH FLOWS Years ended December 31
(Dollar amounts in thousands)
24
CONSOLIDATED
00000199700000 00000199600000 00000199500000
Operating activities:Net income . . . . . . . . . . . . . . . . . . . . . . . . . . . . . . . . . . . . . . . . . . . . . . . . . . . . . . . $122,411) $107,884) $112,820)
Adjustments to reconcile net income to net cashprovided by operating activities:
Depreciation . . . . . . . . . . . . . . . . . . . . . . . . . . . . . . . . . . . . . . . . . . . . . . . . . 94,464) 76,820) 63,313)Deferred income taxes . . . . . . . . . . . . . . . . . . . . . . . . . . . . . . . . . . . . . 13,501) 14,096) 9,356)
Changes in operating assets and liabilities:
Accounts receivable . . . . . . . . . . . . . . . . . . . . . . . . . . . . . . . . . . . . . . . . 16,783) (10,100) (35,812)Inventories and prepaid expenses . . . . . . . . . . . . . . . . . . . . . . . (21,796) (6,669) (20,159)Accounts payable and accrued liabilities . . . . . . . . . . . . . . . (3,973) 4,799) 2,052)Postretirement benefits other than pensions . . . . . . . . . . . 6,796) 7,207) 6,315)Other . . . . . . . . . . . . . . . . . . . . . . . . . . . . . . . . . . . . . . . . . . . . . . . . . . . . . . . . . . 0 (17,769) 0 0(5,830) $003,051)
Net cash provided by operating activities . . . . . 210,417) 188,207) 140,936)
Investing activities:Property, plant and equipment . . . . . . . . . . . . . . . . . . . . . . . . . . . . . . . . (107,523) (193,696) (194,894)Acquisition of business, net of cash acquired . . . . . . . . . . . . . . . (96,531) –000 –000Other . . . . . . . . . . . . . . . . . . . . . . . . . . . . . . . . . . . . . . . . . . . . . . . . . . . . . . . . . . . . . . $001,711) $001,604) $001,258)
Net cash used in investing activities . . . . . . . . . . . . (203,343) (193,092) (193,636)
Financing activities:Issuance of debt . . . . . . . . . . . . . . . . . . . . . . . . . . . . . . . . . . . . . . . . . . . . . . . . . 386,000) 162,000) –000Payment on debt . . . . . . . . . . . . . . . . . . . . . . . . . . . . . . . . . . . . . . . . . . . . . . . . (280,292) (89,039) (5,117)Purchase of treasury shares . . . . . . . . . . . . . . . . . . . . . . . . . . . . . . . . . . . . (54,117) (46,134) –000Payment of dividends . . . . . . . . . . . . . . . . . . . . . . . . . . . . . . . . . . . . . . . . . . (27,622) (25,776) (22,584)Issuance of common shares . . . . . . . . . . . . . . . . . . . . . . . . . . . . . . . . . . . . 0 (01,162) 0 (00,106) 0 (00,303)
Net cash provided by(used in) financing activities . . . . . . . . . . . . . . . . . . 0 (25,131) 0 (21,157) 0 (27,398)
Effects of exchange rate changes on cash . . . . . . . . . . . . . . . . . . . . . . $121,246) $025,– 99) $025,– 99)
Changes in cash and cash equivalents . . . . . . . . . . . . . . . . . . . . . . . . . 33,451) (3,728) (80,098)
Cash and cash equivalents at beginning of year . . . . . . . . . . . . . $119,459) $123,187) $103,285)
Cash and cash equivalents at end of year . . . . . . . . . . . . . . . . . . . . . $152,910) $119,459) $123,187)
Cash and short-term investments at end of year . . . . . . . . . . . .$025,798) $055,111) $024,436
)
See Financial Review, pages 14 to 19.

MANAGEMENT’S RESPONSIBILITY FOR FINANCIAL REPORTING
25
The management of Cooper Tire & Rubber Companyis responsible for the integrity, objectivity and accuracyof the financial statements of the Company. The statements have been prepared by the Company in accordance with generally accepted accounting principles and, where appropriate, are based on management’s best estimates and judgment. Thefinancial information presented in this report is consistent with the statements.
The accounting systems established and main-tained by the Company are supported by adequateinternal controls augmented by written policies, internalaudits and the training of qualified personnel.
The accompanying financial statements havebeen audited by Ernst & Young LLP, independentauditors, whose report appears herein.
The Audit Committee of the Board of Directorsis composed solely of directors who are not officers oremployees of the Company. The committee meets reg-ularly with management, the Company’s internalauditors and its independent auditors to discuss their evaluations of internal accounting controls, the auditscopes and the quality of financial reporting. The independent auditors and the internal auditors have freeaccess to the committee, without management’s presence,to discuss the results of their respective audits.
Patrick W. Rooney J. Alec ReinhardtChairman of the Board, Executive Vice President,President, Chief Executive Officer Chief Financial Officer
The Board of DirectorsCooper Tire & Rubber Company
We have audited the accompanying consolidated balance sheets of Cooper Tire & Rubber Company asof December 31, 1997 and 1996, and the related consolidated statements of income, stockholders’equity, and cash flows for each of the three years in theperiod ended December 31, 1997. These financialstatements are the responsibility of the Company’smanagement. Our responsibility is to express an opinionon these financial statements based on our audits.
We conducted our audits in accordance withgenerally accepted auditing standards. Those stan-dards require that we plan and perform the audit to obtain reasonable assurance about whether thefinancial statements are free of material misstatement.An audit includes examining, on a test basis, evidencesupporting the amounts and disclosures in the financial statements. An audit also includes assessing
REPORT OF INDEPENDENT AUDITORS
the accounting principles used and significant estimates made by management, as well as evaluatingthe overall financial statement presentation. Webelieve that our audits provide a reasonable basis for our opinion.
In our opinion, the financial statements referredto above present fairly, in all material respects, theconsolidated financial position of Cooper Tire &Rubber Company at December 31, 1997 and 1996, andthe consolidated results of its operations and its cashflows for each of the three years in the period endedDecember 31, 1997, in conformity with generallyaccepted accounting principles.
Toledo, OhioFebruary 10, 1998

ELEVEN-YEAR SUMMARY OF OPERATIONS AND FINANCIAL DATA
26
NetSales
$1,813,0051,619,3451,493,6221,403,2431,193,6481,174,7281,001,071
895,896866,805748,032665,775
NetSales
19971996199519941993199219911990198919881987
NetSales
19971996199519941993199219911990198919881987
IncomeTaxes
$72,38164,20867,25079,60062,04061,67045,03038,41034,38023,85022,410
Income (a)
$122,411107,884112,820128,519102,210108,17179,43566,46458,24441,06230,680
Income BeforeIncome Taxes (a)
$194,792172,092180,070208,119164,250169,841124,465104,87492,62464,91253,090
OperatingMargin
$209,041172,922176,931208,517166,013170,646128,495108,71594,18866,57556,031
GrossMargin
$314,573252,796250,727277,265228,295229,332180,432155,892139,482106,41993,877
NetIncome
$122,411107,884112,820128,519102,210
43,21179,43566,46458,24441,06230,680
Stockholders’Equity
$833,575786,612748,799662,077550,186471,474439,648369,003310,064257,756221,566
TotalAssets
$1,495,9561,273,0091,143,7011,039,731
889,584796,858670,572616,458519,893442,582413,306
Net Property,Plant &
Equipment
$860,448792,419678,876549,601527,949460,373388,557334,794262,445212,923162,447
WorkingCapital
$354,281256,130272,216303,103204,857175,154144,285167,291150,285143,101154,283
CapitalExpenditures
$107,523193,696194,89478,449
117,249110,15785,954
100,14173,18270,62141,507
Depreciation&
Depreciation
$94,46476,82063,31355,60346,35238,07731,96927,61523,39319,87318,436
Long-termDebt
$205,52569,48928,57433,61438,72948,07553,51291,02765,72767,79070,059
NetSales
19971996199519941993199219911990198919881987
Return OnBeginningEquity (a)
15.6%14.417.023.421.724.621.521.422.618.515.7
Return OnBeginningAssets (a)
9.6%9.4
10.914.412.816.112.912.813.29.98.3
PretaxMargin (a)
10.7%10.612.114.813.814.512.411.710.78.78.0
CurrentRatio
2.82.42.73.02.62.32.22.72.52.72.6
EffectiveTax Rate (a)
37.2%37.337.338.237.836.336.236.637.136.742.2
Return OnSales (a)
6.8%6.77.69.28.69.27.97.46.75.54.6
Long-termDebt To
Capitalization
19.8%8.13.74.86.69.3
10.919.817.520.824.0
(a) Prior to cumulative effect of changes in accounting in 1992 for postretirement benefits other than pensions and income taxes.(b) Basic and diluted earnings per share prior to cumulative effect of changes in accounting were $1.30 and $1.29, respectively.(c) Share data reflects stock splits in 1992, 1990 and 1988.(d) Excluding Federal excise taxes.

(Dollar amounts in thousands; per-share amounts in dollars)
27
NetSales
19971996199519941993199219911990198919881987
NetSales
19971996199519941993199219911990198919881987
IncomeBasic
$1.551.301.351.541.22.52(b)
.96
.81
.71
.50
.38
EquityPer Share (c)
$10.589.678.957.926.585.655.304.473.773.152.72
Common SharesYear End (000) (c)
78,76081,36783,66283,63483,58283,51182,96282,51982,25981,82181,383
Net IncomeDiluted
$1.551.301.351.531.22.52(b)
.95
.80
.70
.50
.38
DividendsPer Share (c)
$.35.31.27.23.20.17.13.11.09.07.06
Common SharesAverage (000) (c)
79,12883,21483,64683,62383,55083,35782,73882,39182,07781,58381,258
Number ofStockholders
5,2815,9916,7217,6238,0966,1424,4924,4593,8713,6273,516
Number ofEmployees
10,4568,9328,2847,8157,6077,2076,5456,2256,0416,0315,720
Wages &Benefits
$517,716440,393411,694382,002346,062329,396266,683256,076233,881217,480189,209
TotalTaxes(d)
$121,189102,097101,884111,50491,47946,43267,93359,80254,02041,74339,056
Research &Development
$21,70019,70016,00014,70015,10013,70014,00010,80010,30011,20010,300
Price/EarningsAverage Ratio (a)
15.017.419.216.624.422.217.810.310.810.310.3
High
$28.4427.2529.6329.5039.6335.6326.2510.509.756.814.97
Low
$18.0018.0022.2521.6320.0022.007.886.195.633.532.78
SELECTED QUARTERLY DATA (Unaudited)
Net Gross Net Earnings Dividend 000Stock Price000Ii1997Ii 0Sales0 iiMarginiii iIncomei IPer ShareI IPer ShareI IIHighII IIILowIII
Fourth $488,908 $86,474 $34,631 $.44 $.095 $28 7/16 $20 13/16
Third 480,572 80,095 31,124 .40 .085 $27 3/8 $21 13/16
Second 463,993 84,385 31,506 .40 .085 $23 1/2 $18 5/8
First 379,532 63,619 25,150 .31 .085 $21 5/8 $18 1/4
Ii1996Ii
Fourth $416,277 $71,704 $32,700 $.40 $.085 $21 7/8 $18 3/4
Third 423,172 64,095 26,913 .32 .075 $22 3/8 $18 5/8
Second 398,858 60,292 25,162 .30 .075 $26 5/8 $21 7/8
First 381,038 56,705 23,109 .28 .075 $27 1/4 $22 3/4
Earnings per share amounts are basic and diluted as computed under the requirements of Statement of Financial Accounting Standards No. 128, “Earnings per Share.”The common stock of the Company (CTB) is traded on the New York Stock Exchange.
Stock Price (c)
Earnings Per Share (c)

EXECUTIVE OFFICES TRANSFER AGENT & REGISTRAR
Cooper Tire & Rubber Company Fifth Third Bank701 Lima Avenue 38 Fountain Square Plaza; MD - 1090F5Findlay, Ohio 45840 Cincinnati, Ohio 45263(419) 423-1321 (800) 837-2755
FOR INFORMATION
Tires and tubes – (800) 854-6288
Engineered products – (219) 925-0700
Common stock and dividends – (419) 424-4233
Web site – www.coopertire.com
ANNUAL MEETING
The annual meeting of stockholders will be held at 10 a.m., Tuesday, May 5, 1998, at Urbanski’s, 1500 Manor HillRoad, Findlay, Ohio. All stockholders are cordially invited to attend. Proxy material is sent to stockholderstogether with this report.
FORM 10-K
A copy of the Company’s annual report to the Securities and Exchange Commission on Form 10-K, including the financial statements and schedules thereto, will be furnished after March 24, 1998, upon written request to:Secretary, Cooper Tire & Rubber Company, Findlay, Ohio 45839-0550.
BOARD OF DIRECTORS
DIRECTORY Years ended December 31
28
J. Alec Reinhardt 3
Executive Vice Presidentand Chief Financial Officerof the Company
John H. Shuey 1
Chairman, Presidentand Chief Executive Officer,Amcast Industrial Corporation(Manufacturing)
Arthur H. Aronson2
Executive Vice President,Allegheny Teledyne Incorporated(Manufacturing)
John Fahl3
Vice Presidentof the Company
Deborah M. Fretz 2
Senior Vice President, Lubricants and Logistics, Sun Company, Inc. (Energy)
John F. Meier 1
Chairman and Chief Executive OfficerLibbey Inc. (Manufacturing)
Dennis J. Gormley 2
Former Chairman of the Boardand Chief Executive Officer,Federal-Mogul Corporation (Manufacturing)
Edsel D. Dunford1
Retired President and Chief Operating Officer,TRW Inc. (Manufacturing)
Patrick W. Rooney 1,3
Chairman of the Board, President and Chief Executive Officer of the Company
1 Member of the Nominating Committee2 Member of the Audit and Compensation Committee3 Member of the Executive Committee
Direct investment plan – Fifth Third Bank servesas Administrator for a direct investment plan forthe purchase, sale and/or dividend reinvestmentof Cooper Tire & Rubber Company common stock.For information, call: (800) 837-2755.

EXECUTIVE OFFICERS
Typ
29
Patrick W. RooneyChairman of the Board, President and Chief Executive Officer
John FahlVice President
Keith L. JolliffVice President
Roderick F. MillhofVice President
Stan C. KaimanSecretary
Stephen O. SchroederAssistant Treasurer
J. Alec ReinhardtExecutive Vice President and Chief Financial Officer
William C. HattendorfVice President and Treasurer
William S. KleinVice President
Richard D. TeepleVice President and General Counsel
Eileen B. WhiteCorporate Controller
MANUFACTURINGMANUFACTURING FACILITIES
TypNORTH AMERICA
Albany, Georgia (tires)3300 Sylvester RoadAlbany, Georgia 31703(912) 438-6800
Auburn, Indiana (vibration control)725 West Eleventh StreetAuburn, Indiana 46706(219) 925-0700
Bowling Green, Ohio (automotive sealing)P.O. Box 1108 • 1175 North Main StreetBowling Green, Ohio 43402(419) 352-3533
Bowling Green, Ohio (hose and assemblies)400 Van Camp RoadBowling Green, Ohio 43402(419) 353-2500
Clarksdale, Mississippi (inner tubes)P.O. Box 130 • 2205 Dr. Martin Luther King Blvd.Clarksdale, Mississippi 38614(601) 624-4366
El Dorado, Arkansas (vibration control)166 Cooper DriveEl Dorado, Arkansas 71730(501) 862-6441
Findlay, Ohio (tires)P.O. Box 550 • 701 Lima AvenueFindlay, Ohio 45839-0550(419) 423-1321
Mt. Sterling, Kentucky (hose and assemblies)250 Oak Grove DriveMt. Sterling, Kentucky 40353(606) 497-9600
Texarkana, Arkansas (tires)3500 East Washington RoadTexarkana, Arkansas 71854(501) 773-4502
Tupelo, Mississippi (tires)P.O. Box 170 • 1689 South Green StreetTupelo, Mississippi 38802(601) 842-2200
LATIN AMERICA
Piedras Negras, Mexico (vibration control)Coopermex, S.A. de C.V.Victoria Norte 2707Piedras Negras, CoahuilaMexico, C.P. 2601052-878-24763
EUROPE
Melksham, England (tires, remould materials)Cooper-Avon Tyres LimitedBath RoadMelksham, Wiltshire SN12 8AAEngland44-1225-703101
DISTRIBUTION CENTERS
TypNORTH AMERICA
Albany, Georgia3300 Sylvester RoadAlbany, Georgia 31703(912) 438-6896
Chicago, Illinois1300 Lunt AvenueElk Grove Village, Illinois 60007(847) 439-3132
Dayton, Ohio3601 Dryden RoadMoraine, Ohio 45439(937) 293-6935
Findlay, Ohio1625 Lake Cascades ParkwayFindlay, Ohio 45840(419) 423-1321
Kansas City, Missouri1026 North Century AvenueKansas City, Missouri 64120(816) 231-1300
Los Angeles, California6340 Artesia BoulevardBuena Park, California 90620(714) 521-7080
New York, New YorkP.O. Box 7062 (Mail)North Brunswick, New Jersey 08902
–––Terminal Road & Industrial DriveNew Brunswick, New Jersey 08901(732) 247-3400
Tacoma, Washington4200-D Industry DriveFife, Washington 98424(206) 922-8790
This report has been produced in its entirety on recycled paper.
Texarkana, Arkansas3500 East Washington RoadTexarkana, Arkansas 71854(870) 779-4268
Tupelo, Mississippi1689 South Green StreetTupelo, Mississippi 38801(601) 842-2200
EUROPE
Melksham, EnglandCooper-Avon Tyres LimitedBath RoadMelksham, Wiltshire SN12 8AAEngland44-1225-703101
Wilnsdorf, GermanyCooper-Avon Reifen (Deutschland) GmbHDortmunder Strasse 1557234 Wilnsdorf, Germany49-2739-87440
Compiegne, FranceCooper-Avon Pneumatiques SARL4 Rue Jacques De VaucansonZac DeMercieres II60200 Compiegne, France333-4497-0100
Dietikon, SwitzerlandCooper-Avon (Suisse) SAHagackerstrasse 128953 Dietikon, Switzerland41-1740-4144