1995-12 Searching and scanning a review of Lawrence … · Searching and scanning a ... including...
48
Calhoun: The NPS Institutional Archive Reports and Technical Reports All Technical Reports Collection 1995-12 Searching and scanning a review of Lawrence W. Stark's vision models Lind, Judith H. Monterey, California. Naval Postgraduate School http://hdl.handle.net/10945/24470
Transcript of 1995-12 Searching and scanning a review of Lawrence … · Searching and scanning a ... including...

Calhoun: The NPS Institutional Archive
Reports and Technical Reports All Technical Reports Collection
1995-12
Searching and scanning a review of
Lawrence W. Stark's vision models
Lind, Judith H.
Monterey, California. Naval Postgraduate School
http://hdl.handle.net/10945/24470

•
•
•
-....
NPS-OR-95-014
NAVAL POSTGRADUATE SCHOOL Monterey, California
SEARCHING AND SCANNING: A REVIEW OF LAWRENCE W. STARK'S VISION
MODELS
by
Judith H. Lind
December 1995
Approved for public release; distribution is unlimited.
Prepared for: U.S. Army Training and Doctrine Analysis Command White Sands Missile Range, NM

NAVAL POSTGRADUATE SCHOOL MONTEREY, CA 93943-5000
Rear Admiral M.J. Evans Superintendent
Richard Elster Provost
This report has been prepared for and funded by the U.S. Army Training and Doctrine Analysis Command (TRADOC), White Sands Missile Range, New Mexico. The report has been reviewed for technical accuracy by Dr. Lawrence W. Stark, University of California, Berkeley; Dr. Marion Kibbe, Naval Air Warfare Center Weapons Division, China Lake, California; Robert Bennett, U.S. Army TRADOC, White Sands Missile Range, New Mexico; and Ronald A. Erickson, ASI Systems International, Ridgecrest, California.
This report was prepared for timely presentation of information and is released at the working level. Reproduction of all or part of this report is authorized.
This report was prepared by:
Reviewed by:
FRANKPETHO Acting Chairman Department of Operations Research
Released by:
pAtJL:A Dean of Res arch
----·· -·. - .. ----- .......... ---··. ·---- ---·- j
~- I
~:c~~'~;,L=i;:-l Dist Special
~L_j __ {11/)ln

REPORT DOCUMENTATION PAGE Form Approved OMB No. 0704-0188
Public reporting burden for lhis collection of infonnation is estimated to average 1 hour per response, including the time for reviewing instructions, searching existing data sources, gathering and maintaining the data needed, and completing <!fld reviewi~the collection of infonnation. Send ~ments regarding lhis burden e~timate or any other aspect of lhis collection of rnformatJOn, rncludrng suggesnons for reducrng lhrs burden, to ashrngton Headquarters SerVIces, Directorate for lnformanon Operanons and Reports, 1215Jefferson Davis Highway, Suite 1204, Arlington, VA 22202-4302, and to lhe Office of Management and Budget, Paperwork Reduction Project (0704-0188), Washrngton, OC 20503.
1. AGENCY USE ONLY (Leave blank) 2. REPORT DATE 3. REPORT TYPE AND DATES COVERED
December 1995 Technical
4. TITLE AND SUBTITLE 5. FUNDING NUMBERS
Searching and Scanning: A Review of Lawrence W. Stark's Vision Models
6. AUTHOR(S)
Judith H. Lind
7. PERFORMING ORGANIZATION NAME($) AND ADDRESS(ES) 8. PERFORMING ORGANIZATION REPORT NUMBER
Naval Postgraduate School NP5-0R-95-014 Monterey, CA 93943
9. SPONSORING I MONITORING AGENCY NAME(S) AND ADDRESS(ES) 1 0. SPONSORING I MONITORING
U.S. Army Training and Doctrine Analysis Command AGENCY REPORT NUMBER
White Sands Missile Range, NM
11. SUPPLEMENTARY NOTES
12a. DISTRIBUTION I AVAILABILITY STATEMENT 12b. DISTRIBUTION CODE
Approved for public release; distribution is unlimited.
13. ABSTRACT (Maximum ZOO words)
This report provides a brief summary of the theories and research of Dr. Lawrence W. Stark and his associates related to searching for and scanning objects in the visual field. The primary goal of this study has been to assess the applicability of the theories to U.S. Army search and target acquisition problems, especially for modeling of visual search for various targets in cluttered terrain. The Stark model refers to search as a process involving active eye movements that cover a scene, with the goal of locating a specific kind of object, while scanning is systematic inspection of an object when it has been located, to compare its features with those of stored cognitive models and to complete the recognition and identification process.
Simple algorithmic models have been proposed by Stark for both the search and the scanning processes, as discussed in this report. A comprehensive top-level theoretical model of visual search has been developed, incorporating the simpler models, and a very elementary prototype computer program prepared. Stark's research and models have been reviewed for this study and the useful and most promising components identified. Model discrepancies and omissions also are noted so efforts can be made to improve the model if desired and to increase its usefulness for U.S. Army modeling.
14. SUBJECT TERMS
Combat models; Detection; Human factors; Identification; Modeling and simulation; Recognition; Scanpath theory; Target acquisition; Visual scanning; Visual scanpath; Visual search
17. SECURITY CLASSIFICATION 18. SECURITY CLASSIFICATION 19. SECURITY CLASSIFICATION OF REPORT OF THIS PAGE OF ABSTRACT
Unclassified Unclassified Unclassified NSN 7540-01-28Q-5500
15. NUMBER OF PAGES
47 1 6. PRICE CODE
20. LIMITATION OF ABSTRACT
UL Standard Form 298 (Rev. 2-89) Prescribed by ANSI Std. 239-18

Contents
1. 0 Executive Summary .......................................................................................................................... 1
2.0 Introduction ...................................................................................................................................... 2 2.1 Background .............................................................................................................................. 2 2.2 Searching Versus Scanning ...................................................................................................... 2 2.3 Purpose of Report ..................................................................................................................... 3
3.0 Visual Search .................................................................................................................................... 4 3.1 The Search Process ................................................................................................................... 4 3.2 Search Patterns ......................................................................................................................... 4 3 .3 Search Paths ............................................................................................................................. 6 3.4 Concepts Useful for Modeling Search ...................................................................................... 8 3.5 Simple Search Model... ............................................................................................................. 8
4.0 Visual Scan ..................................................................................................................................... 11 4 .I The Scanning Process ............................................................................................................. 11 4.2 Scanpaths ............................................................................................................................... 13 4.3 Scanpath Theory and Models ................................................................................................. 14
4.3.1 Markov Models ofScanpaths ...................................................................................... 14 4.3.2 String Editing Models of Scanpaths ............................................................................ 17 4.3 .3 Modeling the Scanning Process ................................................................................... 17
5.0 Theoretical and Computer-Based Models ....................................................................................... 20 5 .I Theoretical Model of Visual Search ....................................................................................... 20 5.2 Prototype Computer Version ofModel ................................................................................... 20 5.3 User-Entered and Predefmed Data ......................................................................................... 24 5.4 Main Protocol Module ............................................................................................................ 27 5.5 Search Scene Construction Module ........................................................................................ 28 5.6 Search Modules ...................................................................................................................... 29
5.6.1 Systematic Row Search algorithms ............................................................................. 29 5.6.2 Random Search algorithms .......................................................................................... 30
5. 7 Lobe Detection Modules ......................................................................................................... 31 5.7.1 Hard Visual Lobe algorithms ...................................................................................... 31 5.7.2 Hard Foveal Lobe algorithms ...................................................................................... 33
5.8 Decision Module .................................................................................................................... 34
6.0 Discussion and Assessment ............................................................................................................ 36
Glossary ................................................................................................................................................ 40

Searching and Scanning: a Review of Lawrence W. Stark's Vision Models
1.0 Executive Summary
This report provides a brief summary of the theories and research of Dr. Lawrence W. Stark and his associates related to searching for and scanning objects in the visual field. The primary goal of this study has been to assess the applicability of the theories to U.S. Anny search and target acquisition problems. Information that can be applied to the modeling of visual search for personnel, ground vehicles, and helicopters in cluttered terrain is of particular interest here.
The Stark model refers to search as a process involving active eye movements that cover a scene, with the goal of locating a specific kind of object. A search pattern is the sequence of eye movements used to cover a scene that includes an apparently random distribution of objects that could appear anywhere in the field of view. A search path is a similar process, but is used to cover natural scenes in which objects have expected locations (e.g., tanks on the ground, ships in the water).
Scanning is systematic inspection of an object after it has been located, to compare its features with those of stored cognitive models and to complete the recognition and identification process. A scanpath is used to inspect familiar objects during normal viewing of scenes, people, and objects. Scanpath theory suggests that eye movements are controlled by internal cognitive models and predicts similar sequences of visual fixations for a given observer looking at a particular image.
Stark's research has demonstrated that glimpses or fixations are not independent. Instead, the location of one glimpse is linked with that of the next. This result suggests that using mathematical models which assume independent events may not be appropriate, at least for cluttered scenes. Instead, Stark proposes using Markov models, which assume that the next event depends on the directly previous event. Stark has demonstrated the use of such models in predicting eye movements during the scanning process.
Simple algorithmic models have been proposed by Stark for both the search and the scanning processes, as discussed in this report. A comprehensive top-level theoretical model of visual search has been developed, incorporating the simpler models. This theoretical model has been used to prepare a very simple prototype computer program that predicts the number of targets detected, number of false alarms, and total search time, for a user-defmed scenario. While the program includes too many simplifications and approximations to be useful at present, it demonstrates the feasibility of developing more comprehensive programs based on the theoretical model, if necessary experimental data can be obtained.
Stark's research and models have been reviewed for this study and the useful and most promising components identified (Section 6.0). Discrepancies and model omissions also are noted so efforts can be made to improve the model if desired and to increase its usefulness for U.S. Anny search and target acquisition modeling.

Searching and Scanning: a Review of Lawrence W. Stark's Vision Models
2.0 Introduction
2.1 Background Dr. Lawrence W. Stark has been a professor at the University of California, Berkeley, for many
years. He divides his teaching efforts there among various engineering, biology, and medicine departments, including the Physiological Optics and Neurology Departments. Stark pioneered the application of control and information theories to neurological systems. His current research interests relate to bioengineering, with emphasis on human and robotic control of movement and vision.
Stark and his coworkers have published articles recently in Optometry and Vision Science, IEEE Transactions on Systems, Man, and Cybernetics, IEEE Transactions on Robotics and Automation, The Journal of the Institute ofTelevision Engineers of Japan, Experimental Brain Research, Annals of Biomedical Engineering, and Vision Research. He has contributed chapters to numerous books, including Visual Search: 11.1
For individuals interested in research related to target acquisition, Stark is noted especially for his extensive work on the human search process. His 1971 article in Scientific American, Eye Movements and Visual Perception,2 provided both a theoretical and a practical basis for follow-on work critical to understanding how humans inspect and recognize objects. More recent work on search patterns and search paths has added significantly to models of human visual processes, as these relate to target detection and identification.
2.2 Purpose of Report The primary purpose of this report is to assess the applicability of Stark's theories to U.S. Army
search and target acquisition conditions and situations, for purposes of modeling and prediction. The goals are to determine (1) whether the theory shows promise, (2) how close it is to being useful, (3) what discrepancies or omissions remain in the theory, and ( 4) how (if possible) any discrepancies or omissions can be addressed.
The following sections provide a brief sUDlllary of some of Stark's work related to searching for objects in the visual field and scanning those objects. The objective of this summary is to make this information accessible to target acquisition researchers who may not have Stark's original articles available, or who need to know the gist of this information but do not require the full details included in the published literature. Terms and their definitions included in this report are based on usage in the available Stark literature; as a result, some terms and definitions may differ from those utilized by other vision and target acquisition researchers.
This brief report does not provide a comprehensive theory of search, but instead emphasizes the definitions, information, and model components related to acquisition of ground targets by humans using direct vision, image magnification systems such as binoculars, and electro-optical sensors such as television systems. Thus our primary interest is in Stark's work that can be applied to the modeling of visual search for personnel, ground vehicles, and helicopters in cluttered terrain.
1 Brogan, D., and Carr, K., eds, Visual Search: II, Taylor and Francis, London, 1992.
2 Noton, D., and Stark, L, Eye Movements and Visual Search, in Scientific American, vol. 224, no. 6, pp 34-43, June 1991.
2

Searching and Scanning: a Review of Lawrence W. Stark's Vision Models
3.0 Visual Search
3.1 Searching Versus Scanning Eye movements are necessary for locating and identifying objects, since detailed visual
information can be obtained only through the fovea. 3 Unless the object of interest has an angular subtense of only 1 to 2 arc degrees, the eye must move in order to fixate on it and inspect it in detail . For example, if a scene subtends a horizontal angle of 20 degrees at the eye, the observer must move his or her eyes and sequentially look around the scene at the parts regarded as features. Features are tentatively located by peripheral vision, then fixated directly for detailed inspection.
As the term is used by Stark, search is a process involving active eye movements that cover a scene (the field of regard), with the goal oflocating a specific kind of object (referred to as a target). The search process ends when an object of interest is located and detected.
Once the object is detected, Stark considers that the scanning process begins. Scanning allows the observer systematically to inspect the object and to compare its features with those of stored cognitive models, in order to complete the recognition and identification processes. Identification is considered more difficult than recognition, and both are more difficult than detection.
If a scene includes clutter (random objects that possibly could be confused with the targets), the search process may be more complicated, as is illustrated in Figure 1. While searching, the observer may have to compare objects that could be either a target or clutter with at least a top-level cognitive model of the object of interest, for detection to occur prior to beginning the recognition and identification process. Thus the distinction between searching and scanning may blur under cluttered conditions.
No
Figure 1. Search and Scan Processes With and Without Clutter Present.
3 See the Glossary at the end of this report for definitions of terms as used in Stark's reports. Note that Stark's terminology differs in some instances from that used by other search and target acquisition researchers.
3

Searching and Scanning: a Review of Lawrence W. Stark's Vision Models
3.2 The Search Process Search can be defined as a process that involves active eye movements over the field of regard,
with the goal of locating and recognizing a desired object, referred to as a target. Search ends when an object of interest is detected and can be inspected to determine whether it is a target. The search process then may be followed by two other processes or events: recognition and identification of a target.
Various search behaviors and strategies are observed in humans, depending on the conditions of the search process. In particular, visual search for random targets in an "unorganized" two-dimensional (2-D) display is conducted differently than is search for "natural" targets, especially those imbedded in a three-dimensional (3-D) "natural" scene. The sequences of eye movements used to cover an unorganized search area are referred to by Stark as search patterns. Eye movement sequences used to examine a natural scene are called search paths.4• 5
Demonstration that humans consistently use search patterns and search paths puts into doubt a basic premise of Koopman's classic detection theory, which assumes that each glimpse or fixation is independent of the others.6 While independence of glimpses may hold for searching for ships at sea (where some noise is present, but no clutter), there appears to be a significant cognitive component to the search process in terrain situations. This cognitive component results in linking the location of one glimpse with that of the next, so that the focus of each fixation depends on that of the previous fixation.
3.3 Search Patterns Search patterns are considered to be efficient, repetitive, idiosyncratic sequences of eye
movements during which the eyes systematically cover an entire 2-D scene. These eye sequences occur during observation of an apparently random distribution of objects in a search area, when the observer is not familiar with the spatial organization (if any) of the objects. Examples include searching from the air for individual ships on the open ocean or trying to find specific letters randomly embedded in a uniform background (typical of much laboratory target acquisition research). Search patterns appear to be modes of covering a search area in an efficient and thorough manner when no information is available to shape the search. Patterns usually develop naturally, without instructions or training. However, practice does improve performance.
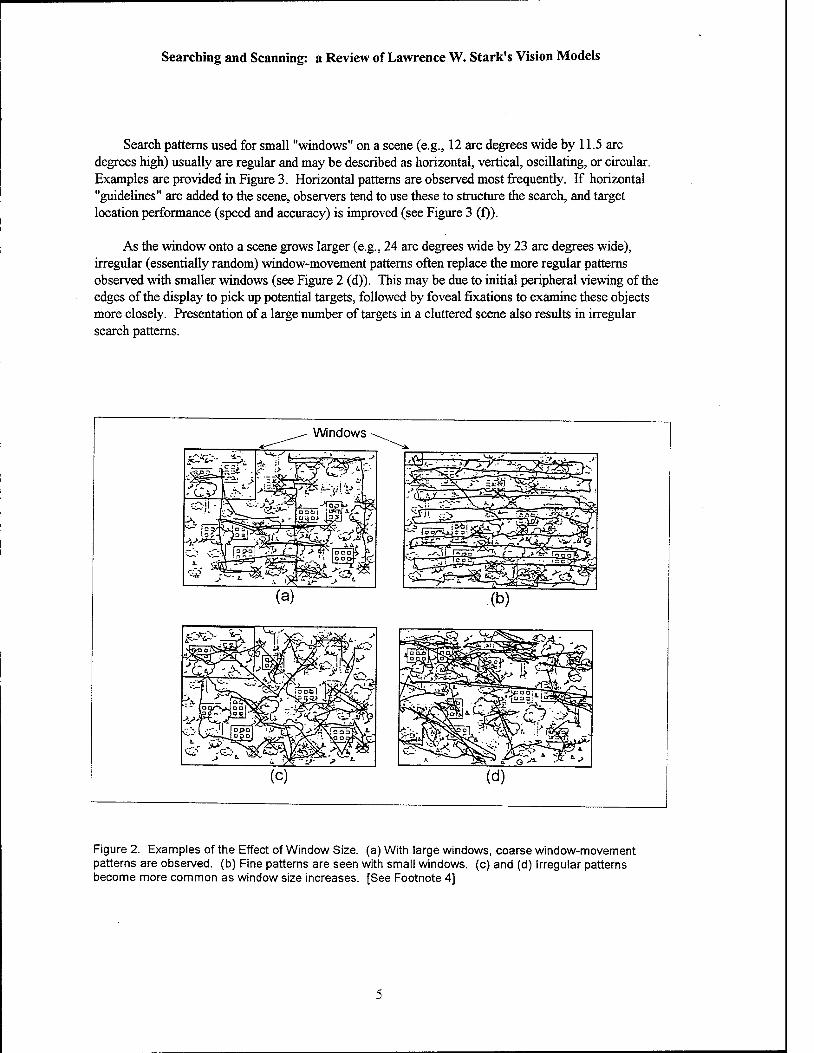
Search patterns will vary as a function of various factors, including the instantaneous field of view of the search area ("window" size), which is a simulation of the width of the human retina as peripheral vision might be restricted while using an optical device. A fine-grained search pattern is used as observers move small windows over the scene, and a coarser one is observed with larger windows (see Figure 2). Thus observers approximate what would be considered optimal visual coverage of a search area.
4 Stark, L.W., and others. Visual Search in Virtual Environments, in Proceedings ofSPIE Conference on Human Vision, Visual Processing, and Digital Display, San Jose, CA, February 1992.
5 Stark, L., and others. Keynote Lecture: Search Patterns and Search Paths in Human Visual Search, in Visual Search: II, Taylor and Francis, London, 1992.
6 Office of the Chief of Naval Operations. Search and Screening, by B.O. Koopman. Navy Dept., Washington, DC, 1946.
4
Searching and Scanning: a Review of Lawrence W. Stark's Vision Models
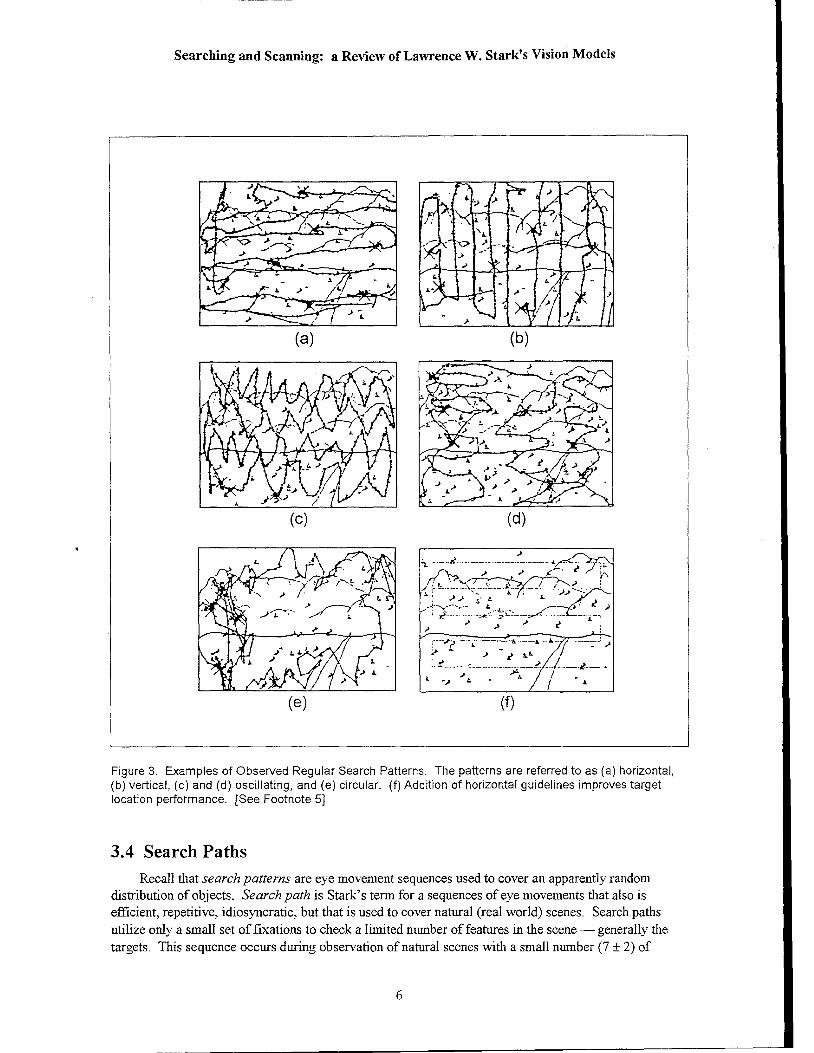
Search patterns used for small "windows" on a scene (e.g., 12 arc degrees wide by 11.5 arc degrees high) usually are regular and may be described as horizontal, vertical, oscillating, or circular. Examples are provided in Figure 3. Horizontal patterns are observed most frequently. If horizontal "guidelines" are added to the scene, observers tend to use these to structure the search, and target location performance (speed and accuracy) is improved (see Figure 3 (f)).
As the window onto a scene grows larger (e.g., 24 arc degrees wide by 23 arc degrees wide), irregular (essentially random) window-movement patterns often replace the more regular patterns observed with smaller windows (see Figure 2 (d)). This may be due to initial peripheral viewing of the edges of the display to pick up potential targets, followed by foveal fixations to examine these objects more closely. Presentation of a large number of targets in a cluttered scene also results in irregular search patterns.
Figure 2. Examples of the Effect of Window Size. (a) With large windows, coarse window-movement patterns are observed. (b) Fine patterns are seen with small windows. (c) and (d) Irregular patterns become more common as window size increases. [See Footnote 4]
5
Searching and Scanning: a Review of Lawrence W. Stark's Vision Models
(a) (b)
(c) (d)
(e) (f)
Figure 3. Examples of Observed Regular Search Patterns. The patterns are referred to as (a) horizontal, (b) vertical, (c) and (d) oscillating, and (e) circular. (f) Addition of horizontal guidelines improves target location performance. (See Footnote 5)
3.4 Search Paths Recall that search patterns are eye movement sequences used to cover an apparently random
distribution of objects. Search path is Stark's term for a sequences of eye movements that also is efficient, repetitive, idiosyncratic, but that is used to cover natural (real world) scenes. Search paths utilize only a small set of fixations to check a limited number of features in the scene- generally the targets. This sequence occurs during observation of natural scenes with a small number (7 ± 2) of
6

Searching and Scanning: a Review of Lawrence W. Stark's Vision Models
naturally-distributed targets, that is, targets located where they might be expected in the real world. This strategy is used when the background should suggest reasonable and easily-remembered places for targets to be placed in sensible fashion. Even when the actual image is shown in a 2-D display, the '"mind's eye" apparently reconstructs the corresponding 3-D format, based on prior experience.
Search paths tend to be unique to the observed scene. They are shaped and driven by spatial models of the spatial organization of target objects in a normal 3-D scene, and by knowledge accumulated from previous experience. Example search paths are shown in Figure 4. The three paths represent the same observer's search path of the same scene on three separate occasions. Notice that even over time an individual's search idiosyncrasies remain constant, for a given scene.
Most observers sweep out the path from left to right. Observers vary widely in speed of search and in the length of the search path but, as noted, a given observer's search path is similar for successive runs when the scene configuration remains constant.
Search path~
f ,':/'>;, .... --.... '
/'\\ \_.:·'.' i I) \ ·~··;//
/ '\ .
(a)
(c) (d)
Figure 4. Examples of Observed Search Paths. (a) The naturalistic scene is shown, with the observer's search path superimposed. Trucks were the target objects; vans and cars were clutter objects. (b), (c), and (d) Three other examples are shown of the same observer's search paths while viewing the same scene. Boxes indicate target detection. Searching along the paths was at a rate of approximately 5 dots per second. [See Footnote 5]
7

------------------------------------------.
Searching and Scanning: a Review of Lawrence W. Stark's Vision Models
3.5 Concepts Useful for Modeling Search
Targets usually are man-made objects in the real world whose images are often made up of vertical and horizontal lines. Processing the scene to remove everything except such straight lines is used in automatic target recognition, to help differentiate targets from background (see the example in Figure 5). Stark suggests that this technique might serve to model the preattentive detection of targets in a distracting background. However, researchers working in modeling of low-observable objects suggest that reduction of a scene to horizontal and vertical lines may be necessary but not sufficient for detection. The existence of angles and repetitive patterns within the target are equally important. 7
--
(b)
jl
I)
(c) (d)
Figure 5. Examples of the Effect of Removing All Curved Lines from Scene. (a) Original scene, with example of target at top. (b) Same scene with everything except horizontal lines removed. (c) Same scene with everything except vertical lines removed. (d) Same scene with only horizontal and vertical lines remaining. The target (boxed) can be discriminated from non-targets by its Jack of the horizontal weapon barrel. [Personal communication from L.W. Stark]
7 Doll, T.J., McWhorter, S. W., and Schmieder, D .E. Computational Model of Human Visual Search and
Detection. Georgia Institute of Technology, March 1994.
8

Searching and Scanning: a Review of Lawrence W. Stark's Vision Models
Visual search also might be modeled as a series of searches by a matched filter (possibly a template with the brightness characteristics and/or the outlines of the target) scanning a graphical artificial scene on a computer to pick out the targets from the background. Search time and number of errors (commission and omission) can be used as measures of filter performance.
Detection, recognition, and identification can be considered a sequence of tasks or processes, each more difficult than the other. Based on this definition, a hierarchy of search can be set up. For example, the filter at first can search crudely for probable targets, using as criterion that 25 pixels per target must match the template. The detected probable targets then can be compared with the template more closely, requiring a match of 625 pixels per target. This approach yields major reductions both in errors and in required search time, when compared with a single-step filter process.
When the goal is to model realistic human search times and accuracy, scene clutter cannot be simulated simply by using Gaussian noise to "obscure" a scene and its embedded targets. Instead, clutter must be modeled as unwanted signals that are similar to the signals of interest (the targets) and so could be oonfused with them.
Images of scenes and of real targets can be captured using video cameras. These scenes then can be modeled as simple black and white images to minimize computing time. Addition of gray scale values and the degrading of image resolution would match the human's visual characteristics more accurately, if the images are better than unaided vision by the eyeball.
To reduce computing time and add robustness, regions of interest in the scene can be selected serially for processing. A detection threshold then can be set for a given region, to specify the degree of similarity between template and target required for a match. However, defming "regions of interest" is no trivial process, nor is setting a realistic threshold value, especially on a region-by-region basis.
3.6 Simple Search Model
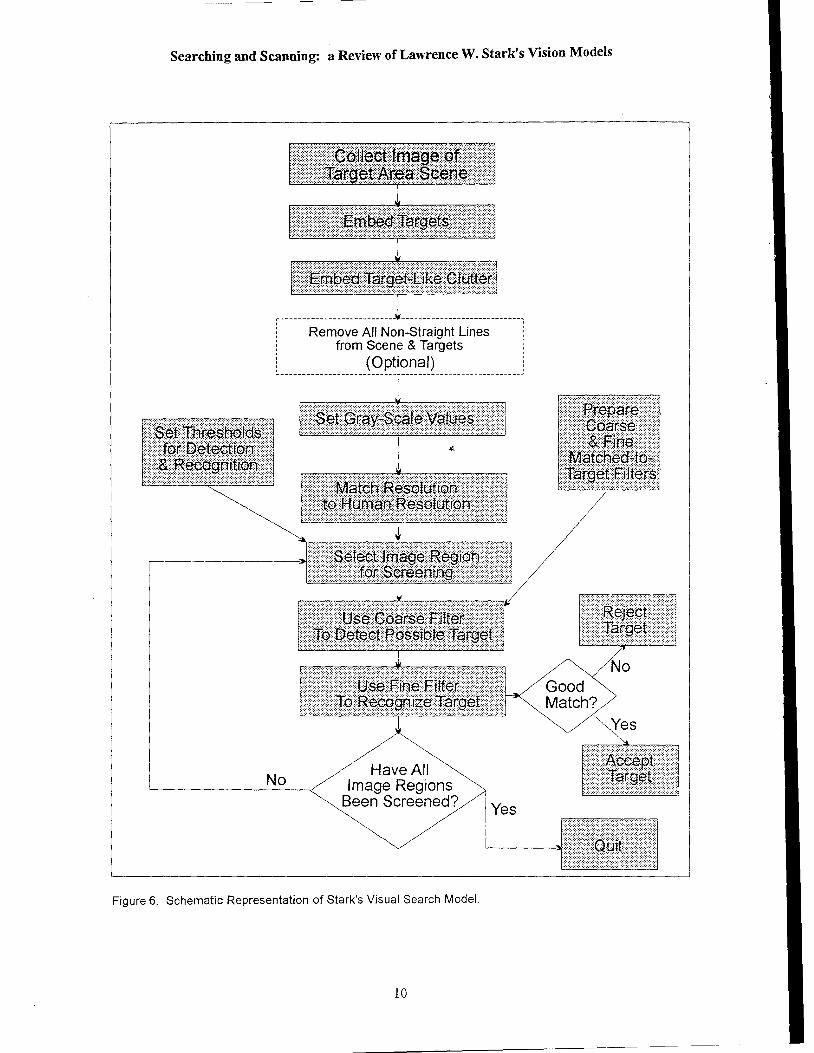
A schematic representation of a simple search model based on the above concepts from various Stark reports is shown in Figure 6. The model includes the following processes.
• Images of a scene and targets are captured and clutter is incorporated.
• The scene is processed to enhance possible targets by removing everything except straight lines.
• The scene is modified to mimic human visual resolution.
• Regions of interest are defmed, and thresholds are set to simulate target detection and recognition criteria.
• Matched filters are used to compare the images of the regions of interest with predefmed criteria for targets and to select or reject objects in those regions as targets.
9
----------------------------------------------
Searching and Scanning: a Review of Lawrence W. Stark's Vision Models
,-------------------------- ---------------------------- .. ' ' i Remove All Non-Straight Lines ! : from Scene & Targets :
l __ ---------------- --~~ pt i ~~~~~ -------------------- ~
No Have All Image Regions
Been Screened?
Figure 6. Schematic Representation of Stark's Visual Search Model.
10
Yes
Yes

Searching and Scanning: a Review of Lawrence W. Stark's Vision Models
4. 0 Visual Scan
4.1 The Scanning Process In the Stark view of the search process, scanning is considered to be a serial process involving
active, regular eye movements over an already-detected target, with the goal of recognizing and possibly identifying what is being examined. The observer inspects the object and compares its features with those of stored internal representations (cognitive models). Scanning usually ends when the recognition or identification process is complete.
Visual recognition involves storing and retrieving memories. Nerve cells in the brain's visual cortex are activated and an image of the object being viewed is formed in the "mind's eye." The human's memory system must contain an internal representation of every object that is to be recognized. Recognition of an object when it is encountered (after being observed previously) is the process of matching it with its internal representation in the memory system.
It is likely that an object's internal representation is a piecemeal affair, as assemblage of parts or features. The serial recognition hypothesis states that, during recognition, the features of the internal representation are matched serially with the features of the actual object, step by step. Successful matching of all features completes recognition. Figure 7 illustrates this serial process. 8
The average observer takes longer to recognize a target object than is needed to reject a nontarget object. Whenever a nontarget object fails to match some feature of the internal representation, that object can be rejected without further scrutiny, whereas target objects must be checked on all features. Observers also take longer to recognize complex target objects than to recognize simple ones, since more features must be checked in a complex object. On the other hand, the internal representations of well-known, very simple objects appear to be holistic, so that recognition is a rapid, parallel process.
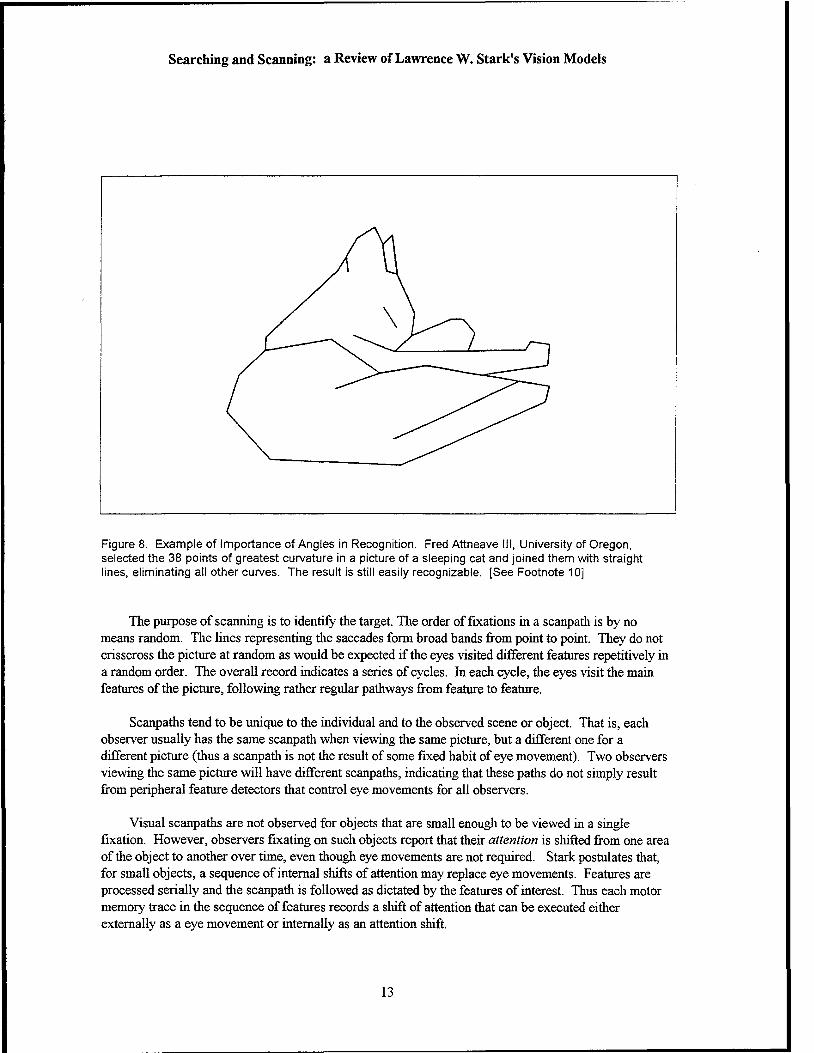
When viewing simple pictures such as line drawings, fixations tend to cluster around unpredictable or unusual details, particularly unpredictable contours such as angles. Thus sharp curves probably are important features for visual identification, and angles may be the principal features the brain uses to store and to recognize drawings (see Figure 8). This is consistent with research that has demonstrated the presence of angle-detecting neurons in various animals.
Use of angles for image storage makes sense from a space optimization (data compression) point of view. If an object is divided into connected straight segments, a segment's length and the angle that connects it to the next segment can be stored, rather than storing the entire object's construction. This is analogous to storage systems for large matrices, where positions of non-zero elements and their values are stored instead of storing perhaps 10,000 elements of which only 1 per cent are nonzero.9
8 It should be noted that some other vision researchers consider recognition to be less sequential; they hypothesize instead that numerous object parameters are considered simultaneously during the procedure.
9 Hacisalihzade, S.S., Stark, L.W., and Allen, J.S. Visual Perception and Sequences of Eye Movement Fixations: a Stochastic Modeling Approach, in IEEE Transactions on Systems, Man, and Cybernetics, vol22, no. 3, May/June 1992.
11

Searching and Scanning: a Review of Lawrence W. Stark's Vision Models
(a) (b)
Figure 7. Eye Movement Regularities While Reviewing an Image. (a) Bust of Queen Nefertiti viewed by the observer. (b) Eye movements recorded by A.L. Yarbus, Institute for Problems of Information Transmission, Moscow. The eyes seem to visit the features of the head cyclically, following fairly regular pathways, rather than crisscrossing the picture at random. 1 0
4.2 Scanpaths
Scanpath is Stark's term for repetitive and idiosyncratic sequences of eye movements for inspecting and recognizing particular familiar objects during normal viewing of scenes, people, and objects. It thus relates to the search path process, which also is used for familiar types of scenes. The scanpath is shaped by a cognitive model of the guessed object and the organization of its subfeatures. This cognitive model controls active looking to result in efficient acquisition of visual information. Scanpath sequences occupy from about 25 to 30 per cent of the observer's viewing time, the rest consisting of less regular eye movements. On occasion, scanpaths are not evident when some simple, very familiar objects are viewed.
10 Noton, D., and Stark, L, Eye Movements and Visual Search, in Scientific American, val. 224, no. 6, pp 34-43, June 1991.
12
.-----------------------------------
Searching and Scanning: a Review of Lawrence W. Stark's Vision Models
Figure 8. Example of Importance of Angles in Recognition. Fred Attneave Ill, University of Oregon, selected the 38 points of greatest curvature in a picture of a sleeping cat and joined them with straight lines, eliminating all other curves. The result is still easily recognizable. [See Footnote 1 OJ
The purpose of scanning is to identify the target. The order of fixations in a scan path is by no means random. The lines representing the saccades form broad bands from point to point. They do not crisscross the picture at random as would be expected if the eyes visited different features repetitively in a random order. The overall record indicates a series of cycles. In each cycle, the eyes visit the main features of the picture, following rather regular pathways from feature to feature.
Scanpaths tend to be unique to the individual and to the observed scene or object. That is, each observer usually has the same scanpath when viewing the same picture, but a different one for a different picture (thus a scanpath is not the result of some fixed habit of eye movement). Two observers viewing the same picture will have different scanpaths, indicating that these paths do not simply result from peripheral feature detectors that control eye movements for all observers.
Visual scanpaths are not observed for objects that are small enough to be viewed in a single fixation. However, observers fixating on such objects report that their attention is shifted from one area of the object to another over time, even though eye movements are not required. Stark postulates that, for small objects, a sequence of internal shifts of attention may replace eye movements. Features are processed serially and the scanpath is followed as dictated by the features of interest. Thus each motor memory trace in the sequence of features records a shift of attention that can be executed either externally as a eye movement or internally as an attention shift.
13

Searching and Scanning: a Review of Lawrence W. Stark's Vision Models
4.3 Scanpath Theory and Models Given that the target already has been detected, Stark's scanpath theory suggests that eye
movements are controlled by internal cognitive models already present in the brain, and predicts similar sequences of visual fixations for a given observer looking repeatedly at the image of tllis particular target. It is proposed that, in the internal representation or memory of the picture, the features are linked together in sequence by the memory of the eye movements required to look from one feature to the next. Thus the eyes tend to move from feature to feature in a fixed order, as they scan the picture. 11• 12
However, for realism, some randomness usually is included in modeling the generation of scan paths.
A scanpath feature ring has been proposed as a serial model of the human's internal representation of objects. The model maintains that representations of objects are composed of sensory memory traces recording object features and of motor memory traces of the eye movements from one feature to another.
In the feature ring model, as an observer views an object for the first time and becomes familiar with it, he or she alternately records a feature of the object and the eye movement required to reach the next feature. The memory traces of the feature ring thus are laid down, as both sensory and motor activities are recorded. The feature ring establishes a fixed ordering of features and eye movements, corresponding to the scanpath on the object. When the object is next encountered, the observer recognizes it by matching it with the feature ring, which is the object's internal representation in memory. Matching consists of verifying successive features and carrying out the intervening eye movements, as directed by the feature ring.
4.3.1 Markov Models of Scanpaths
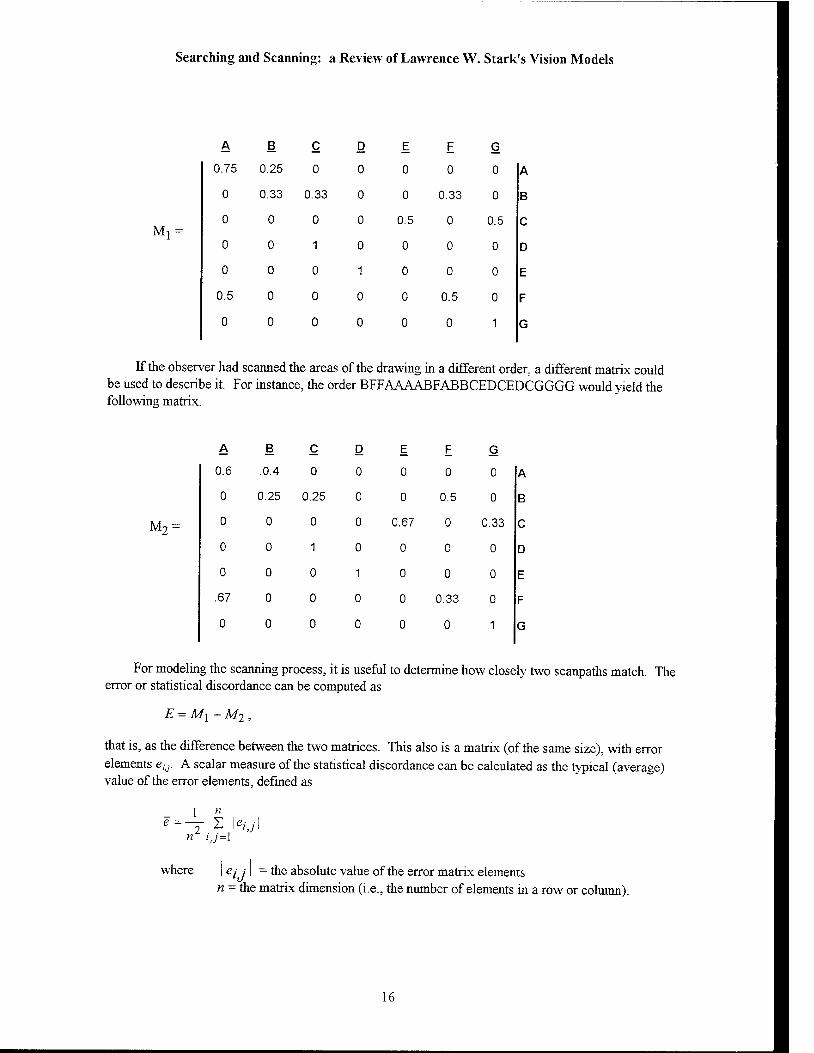
Scanpath theory predicts similar sequences of visual fixations for an observer looking at a particular image. The degree of similarity usually is determined by visual inspection of the fixation sequences. However, it has been proposed that the sequence of eye fixations of a given scanpath can be modeled as a Markov matrix. 13 Two such matrices for two scanpaths then can be compared by subtraction, to determine the error or statistical discordance matrix between the two. The result tl1en can be converted to a scalar measure of the statistical discordance to obtain a numerical value for scanpath similarity.
11 Stark, L.W .. Top-down Vision in Humans and Robots, in Proceedings ofSPIE Conference on Human Vision, Visual Processing, and Digital Display, San Jose, CA, February 1993.
12 Stark, L.W. New Quantitative Evidence for the Scanpath Theory: Top-Down Vision in Humans and Robots, in Proceedings of the First Meeting of the International Society ofTheoretical Neurobiology, Milano, January 1993.
13 Hacisalihzade, S.S., Stark, L.W., and Allen, J.S. Visual Perception and Sequences of Eye Movement Fixations: a Stochastic Modeling Approach, in IEEE Transactions on Systems, ll:fan, and Cybernetics, vol22, no. 3, p. 474, May/June 1992.
14

Searching and Scanning: a Review of Lawrence W. Stark's Vision Models
The following example of this process is based on Figure 9, which shows the eye movements made by an observer viewing for the first time a drawing adapted from Paul Klee's Old Man Figuring. The image can be divided into seven regions of interest, the hand (A), mouth (B), nose (C), left eye (D), right eye (E), neck (F), and ear (G). Call these regions states in which the fixations must be located and postulate that transitions from one state to another have certain probabilities. The result can be described as a Markov process.
Figure 9. Eye Movements While Viewing Klee's Old Man Figuring. The letters (A through G) and corresponding circles indicate the seven regions of interest about which fixations are clustered. [See Footnote 1 0]
The sequence of fixations in Figure 9 is BBFF AAAABCEDCG. That is, the observer fixates first on B, looks at B again, then moves to F. After another glance at F and four glances at A, fixation returns again to B, then to C. Therefore, the probability that the fixation state will transition from B to B is 0.33, from B to F is 0.33, and from B to Cis 0.33. The total sequence (and numerous other fixation sequences that fit this probability distribution) can be generated from the following matrix.
15
Searching and Scanning: a Review of Lawrence W. Stark's Vision Models
~ !! ~ Q £ E Q
0.75 0.25 0 0 0 0 0 A
0 0.33 0.33 0 0 0.33 0 B
0 0 0 0 0.5 0 0.5 c Ml =
0 0 0 0 0 0 D
0 0 0 0 0 0 E
0.5 0 0 0 0 0.5 0 F
0 0 0 0 0 0 G
If the observer had scanned the areas of the drawing in a different order, a different matrix could be used to describe it. For instance, the order BFF AAAABF ABBCEDCEDCGGGG would yield the following matrix.
~ !! ~ Q £ E Q
0.6 .0.4 0 0 0 0 0 A
0 0.25 0.25 0 0 0.5 0 B
M2= 0 0 0 0 0.67 0 0.33 c 0 0 0 0 0 0 D
0 0 0 0 0 0 E
.67 0 0 0 0 0.33 0 F
0 0 0 0 0 0 G
For modeling the scanning process, it is useful to determine how closely two scanpaths match. The error or statistical discordance can be computed as
that is, as the difference between the two matrices. This also is a matrix (of the same size), with error
elements ei.j· A scalar measure of the statistical discordance can be calculated as the typical (average) value of the error elements, defmed as
1 n e=- 2:: le· ·I 2 1,)
n i,J=l
where I ei,j / =the absolute value of the error matrix elements n = the matrix dimension (i.e., the number of elements in a row or column).
16

Searching and Scanning: a Review of Lawrence W. Stark's Vision Models
Errors usually get smaller as a linear function of the length of the fixation string, when plotted on a double logarithmic scale. Errors also are smaller when the state transitions are quasideterministic (probabilities of state transitions not all equal) as opposed to random (state transition probabilities about equal throughout the matrix).
This modeling technique requires that areas of interest in a target's image be determined by measuring eye fixations, and that a specific fixation point be assigned to each area of interest. Currently this is done by inspection and somewhat arbitrary grouping of points. Clustering algorithms (used in cosmology) might be useful in deciding to which group of points a given fixation belongs.
4.3.2 String Editing Models of Scan paths
Another technique suggested as a measure of scanpath similarity is that referred to as string editing. 14 A given string of fixation sequences (e.g., BBFF AAAABCEDCG) can be compared with another, possibly of a different length (e.g., BFFAAAABFABBCEDCEDCGGGG) to determine how many substitution, deletion, and insertion operations are necessary to convert the first into the second. The distance between the two strings can be considered a function of costs that can be assigned to each type of operation, e.g., either costs the same for all kinds of operations, or varied costs such as 1 for substitution, 2 for insertion, and 3 for deletion.
For example, required substitutions can be assigned a cost of 2 and both deletions and insertions a cost of 1. To transform the string ACA to CADAC requires inserting a Cat the beginning (cost: 1) and at the end (1), and substituting aD for the C in the middle (2). The resulting total cost (and thus the distance) is 4. As strings get longer, the ways of transforming one into another increase very fast, so it is not trivial to fmd the transformation that costs least. An algoritlun based on modified dynamic programming thus has been developed that guarantees that the minimum distance between two strings will be found. The resulting method shows promise for automating, objectifying, and quantifying the similarity of scanpath fixations.
4.3.3 Modeling the Scanning Process
A schematic representation of a possible Stark scanpath model for an already-detected target is shown in Figure 10. The model consists of three phases.
• Prepare a model of an actual target's scanpath (starting when detection is complete).
• Predict or collect the target image's main features of interest.
• Predict or collect the fixation sequence forming the target image's scanpath.
• Develop a state transition matrix for the probability of transitions along the scanpath for this target.
14 Hacisalihzade, S.S., Stark, L.W., and Allen, J.S. Visual Perception and Sequences of Eye Movement Fixations: a Stochastic Modeling Approach, in IEEE Transactions on Systems, Man, and Cybernetics, vol22, no. 3, p. 496, May/June 1992.
17

Searching and Scanning: a Review of Lawrence W. Stark's Vision Models
• Detect a probable target in the scene and prepare a model of the probable target's scanpath.
• Predict or collect the image's main features of interest.
• Predict or collect the fixation sequence forming the image's scanpath.
• Develop a state transition matrix for the probability of transitions along the scanpath for this probable target.
• Compare the actual and probable target scanpaths to determine similarity.
• Calculate the error between the two state transition matrices.
• If the error is large, reject the probable target; if the error is small, accept the probable target as an actual target.
18

Searching and Scanning: a Review of Lawrence W. Stark's Vision Models
Select Points of Greatest Curvature on Image; Delete
Rest of Image
Join Points of Greatest Curvature
on Image
(Optional)
No Is Error Large?
Select Points of Greatest Curvature on Image; Delete
Rest of Image
Join Points of Greatest Curvature
on Image
(Optional) ~-----------------------·-
Yes
Figure 10. Schematic Representation of Stark's Visual Scan path Model.
19

Searching and Scanning: a Review of Lawrence W. Stark's Vision Models
5.0 Theoretical and Computer-Based Models
5.1 Theoretical Model of Visual Search
Stark and his coworkers have laid the theoretical groundwork for a comprehensive computerized Model of Visual Search, based on the research discussed above. However, this comprehensive model has not yet been completed or implemented. The theoretical model is a serial one, with the various processes carried out in roughly the same sequence as in the eye and brain. When the program is operating, model output is expected to be number of detections, number of false alarms, and time to detect. Theoretical model components are shown in Figure 11, and include
• Physics of the search scene, targets, and environment. This component models the search area and the objects located there. The background can be homogeneous or heterogeneous. Target contrast, size, and distance will be modeled, along with atmospheric attenuation and sensor effects on the target image. False targets in the search scene will be included.
• Physics of eye movement and the retinal image. The effects of what Stark considers the three
most important factors for detection - apparent contrast, apparent size, and eccentricity with respect to the visual axis - are modeled. Models are included both for total visual lobe detection processes and for foveal recognition processes.
• Human search behavior. This includes models for various search strategies, both systematic and random. Both search patterns and search paths will be modeled.
• Higher level psychological processes. Cognitive processes that control active vision are modeled. Factors such as utility, cost/benefit, observer experience and training, foveal load, peripheral clutter, vigilance, and fatigue will be included, as these affect an observer's decision to consider a detected object to be a target
• Probabilistic physiology of the eye and brain. This component uses decision models to provide the probability of detection and time to detect, based on the results of experimental studies.
5.2 Prototype Computer Version of Model
While the comprehensive Model of Visual Search is far from completion, a computerized prototype was developed between July 1992 and February 1993. 15 The prototype first was implemented using the Microsoft Excel spreadsheet program on a NeXT computer system, and later was reprogrammed in the C language for a Silicon Graphics, Inc., workstation. The remainder of Section 5 describes this prototype system.
The computerized version of the model does not at present include the proposed cognitive models. The scanning process, considered integral to the recognition phase of visual search, is missing. For now recognition simply is a function of target size and contrast, along with a random draw to simulate other indeterminate factors. Also missing are the task and strategy models that significantly affect the searching and scanning processes.
15 Stark, LW., Christiansen, J., and Dixon, D. Final Report: Model of Visual Search, UC Berkeley, Berkeley, CA, February 1993.
20

Searching and Scanning: a Review of Lawrence W. Stark's Vision Models
---------------------, ' ' ' ' \ User l ' ' :_______ ----'
UserDefined
Run Parameters
------ -~ ----------,
\ Output '----- ------------- ---'
Figure 11. Components of a Comprehensive Theoretical Model of Visual Search.
Since this is a preliminary computerized model, simplifications are included so that the concepts can be demonstrated efficiently. That is, it is an "empty FOV model," numerous parameters are set to constant or fixed values, and many other parameters are predefmed and entered by the user prior to each run. The user does not interact with the system during a program run.
21

Searching and Scanning: a Review of Lawrence W. Stark's Vision Models
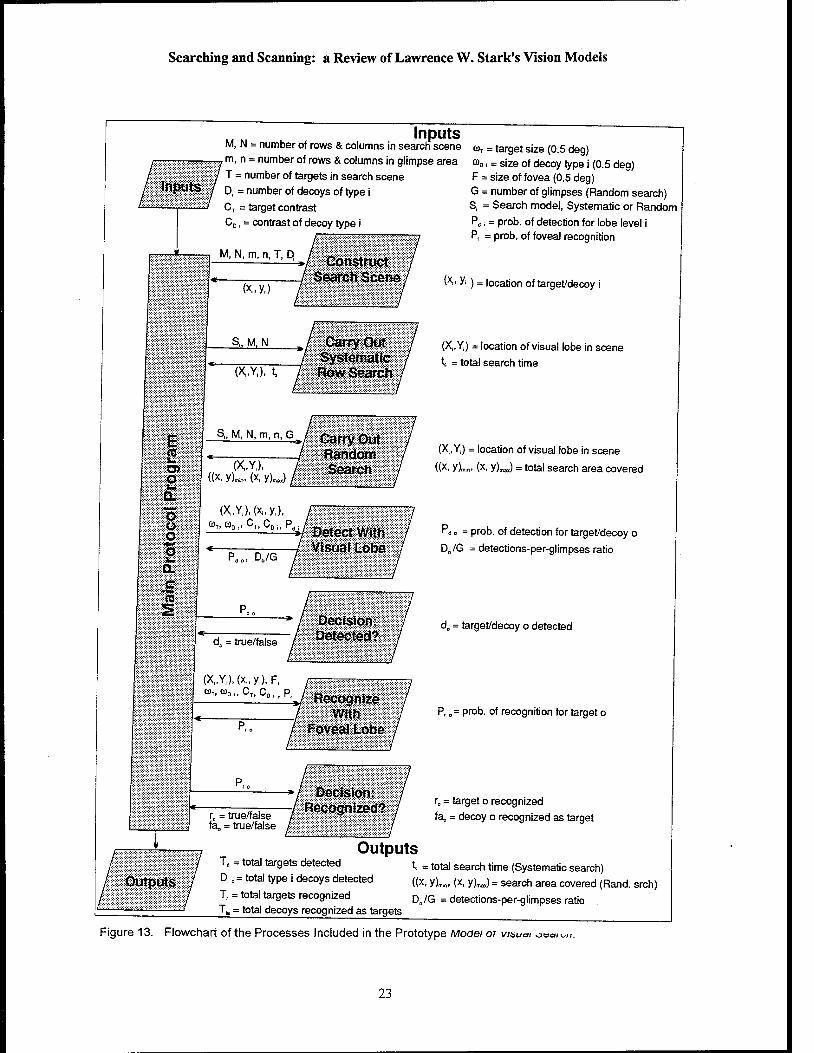
The computerized system consists of seven modules or sets of algorithms. Figure 12 shows the relationships among the program's modules, which are listed below, and Figure 13 provides a flowchart of the process.
---------------------
User '-------- ----------User
Defined Run
Parameters
:--------- ----------1
\ Output --- ----------------
Figure 12. Relationships Among the Modules of the Prototype Computerized Model of Visual Search.
22
Searching and Scanning: a Review of Lawrence W. Stark's Vision Models
Inputs M, N = number of rows & columns in searcli scene Ctlr = target size (0.5 deg) m, n = number of rows & columns in glimpse area
T = number of targets in search scene Ctla, = size of decoy type i (0.5 deg) F =size of fovea (0.5 deg)
D, = number of decoys of type i
Cr = target contrast
C0 , = contrast of decoy type i
do = true/false
(X,Y,), (x .. y,), F, COr, OOo" Cr, Co 1 , Pr
P,o
P,o
ro = true/false fa. = true/false
G = number of glimpses (Random search) S, = Search model, Systematic or Random
P., = prob. of detection for lobe level i P, = prob. of foveal recognition
(X;. Y. ) = location of target/decoy i
(X .. Y,) = location of visual lobe in scene
t, = total search time
(X,, Y,) = location of visual lobe in scene
((X, Y)m,, (x, Ylm.J =total search area covered
P. o = prob. of detection for target/decoy o
D)G = detections-per-glimpses ratio
do = target/decoy o detected
P, o = pro b. of recognition for target o
ro = target 0 recognized
fa. = decoy o recognized as target
T. =total targets detected Outputs
D, • = total type i decoys detected
T, = total targets recognized
T. =total
t, =total search time (Systematic search)
((x, Y)mon• (x, Y)m.J= search area covered (Rand. srch)
0 0 /G =detections-per-glimpses ratio
Figure 13. Flowchart of the Processes Included in the Prototype MoaeJ or vt~:>uar ..:>r;;a'""·
23

Searching and Scanning: a Review of Lawrence W. Stark's Vision Models
• Main program Protocol algorithms. This is the driver or control module. It initializes the system with user-entered run parameters, calls modules as required, collects data as other modules generate it, provides data to other modules as needed, and calculates and outputs the program's results. Output essentially is the number of targets and decoys detected, the number of targets recognized, and the number of false alarms (decoys recognized as targets). Search time, search area, detections-per-glimpses ratio, and recognitions-per-glimpses ratio also may be output.
• Search Scene Construction algorithms. This module sets up a scene that will be searched for targets. The target area scene is defmed as a checkerboard matrix, with each cell representing the visual lobe area or area covered in one glimpse of the search scene. Targets or decoys are included in some of the cells. Targets and decoys are assigned sizes and contrast values as well as locations in the simulated field of view.
• Systematic Row Search algorithms. This module moves the simulated visual lobe systematically over the scene constructed by the Search Scene Construction module. A boustrophedon ("windshield wiper") row search is performed from upper left to lower right, with each row dropping into the one below without overlap. The search proceeds in discrete jumps of constant size that simulate glimpses.
• Random Search algorithms. This module moves the simulated visual lobe randomly over the scene constructed by the Search Scene Construction module. The search proceeds in discrete jumps of constant size that simulate glimpses; only the direction of movement is randomized, using a random number generator.
• Hard Visual Lobe algorithms. This module provides the probability of target/decoy detection for a given glimpse. A hard lobe is modeled for simplicity; thus the detection probability is constant for all eccentricities of the target/decoy image on the retina within three specified lobe limits (l, 3, and 5 degrees), and zero outside these limits. Probability of detection is simply a function of target/decoy apparent size and contrast.
• Hard Foveal Lobe algorithms. This module provides the probability of target/decoy recognition using foveal vision, once the target has been detected somewhere in the glimpse area. The fovea is assumed to be 0.5 degree and target/decoy apparent size is assumed to be ::::; 0.5 degree. Probability of recognition is simply a function of target/decoy contrast.
• Decision algorithms. This module determines whether a target/decoy has been detected and whether a target has been recognized, that is, whether the calculated probability of acquisition will be considered adequate for acquisition actually to have occurred in the overall model. A random number ( 0 to 1) is compared with the probability of detection/recognition provided by one of the two lobe models; if the random number is smaller, the object is assumed to have been detected/recognized. This technique typically is used in combat simulations to represent random battlefield effects that are not being individually modeled.
5.3 User-Entered and Predefined Data
For this prototype system, the user specifies the following parameters for each run. In general, default values are provided which the user may change if desired. An example spreadsheet form for partial data entry and data results is shown in Figure 14.
24

Searching and Scanning: a Review of Lawrence W. Stark's Vision Models
lobe scene stat detect recOQ
worksheet names lobe.View1 sccnc.Vicwl #total _9clect.View1 stat.View1
target (1.649} 15 5 4
decoy1 (3.335} 74 10
decoy2 [2.241} 66 20
decoy3 (0.0-13] 62 9
bk-noisc rand"OA
false-alarm 5
Pd-fovea 0.20
Pd-pcripherv 1 0.27
Pd-pcriphery2 0.2-1
threshold-de tee! [>0.5}
Pr-fovca 0.9
Figur~:: 1<1. Example Data Entry Worksheet. The column labeled lobe includes the probability of detection and of recognition values for the 1-degree, 3-degree, and 5-degree eccentricity levels of the visual lobe. The scene column provides contrast values for the targets and the three kinds of decoys, plus the formula to be used for generating the level of background noise. The stat column lists the total numbers for targets and for each kind of decoy. In the detect column, the value [>0.5] represents the size threshold to be used for detection, while the numbers at the top are the results returned by the program for number of detections. The recog column shows the number of targets correctly recognized and the number of false alarms, at the end of a run. (See Footnote 15)
1. Scene characteristics: a. Search scene size: Scenes are predefined on separate worksheets as scene. View],
scene. View2, etc., characterized by M and N, the number of rows and columns of large cells (each representing one 5-degree visual lobe or glimpse area) in the total search scene. MN is the number of glimpses required to cover the scene systematically. Figure 15 shows a typical search scene.
b. Lobe size. Visual lobes are predefined on separate worksheets as lobe. View], lobe. View2, etc., characterized by m and n, the nwnber of rows and columns of 1-degree small cells (representing eccentricity levels) included in a single 5-degree large cell.
c. Scene clutter level. Clutter is defined by the value that will be used for background noise (bk-noise) in the scene, e.g., (0.4 *a random number).
d. Number of targets. The user enters T, the total quantity of targets that will be located in all of the cells, e.g., 15.
e. Target contrast. The user specifies Cy, a value representing target-to-background contrast, in the target-scene cell, e.g., [1.649].
25
---------------------------------------
Searching and Scanning: a Review of Lawrence W. Stark's Vision Models
=f+l.l I I I I I D
=rn=r T Dl I T
D T
D 0 I D
D T I . . m Dl
I
D I I I
: I · I I !___J_tJ
! ! I I D
I .,..-
' ' i
Tl I
i I i T 0
j -~ I I
I I I 0
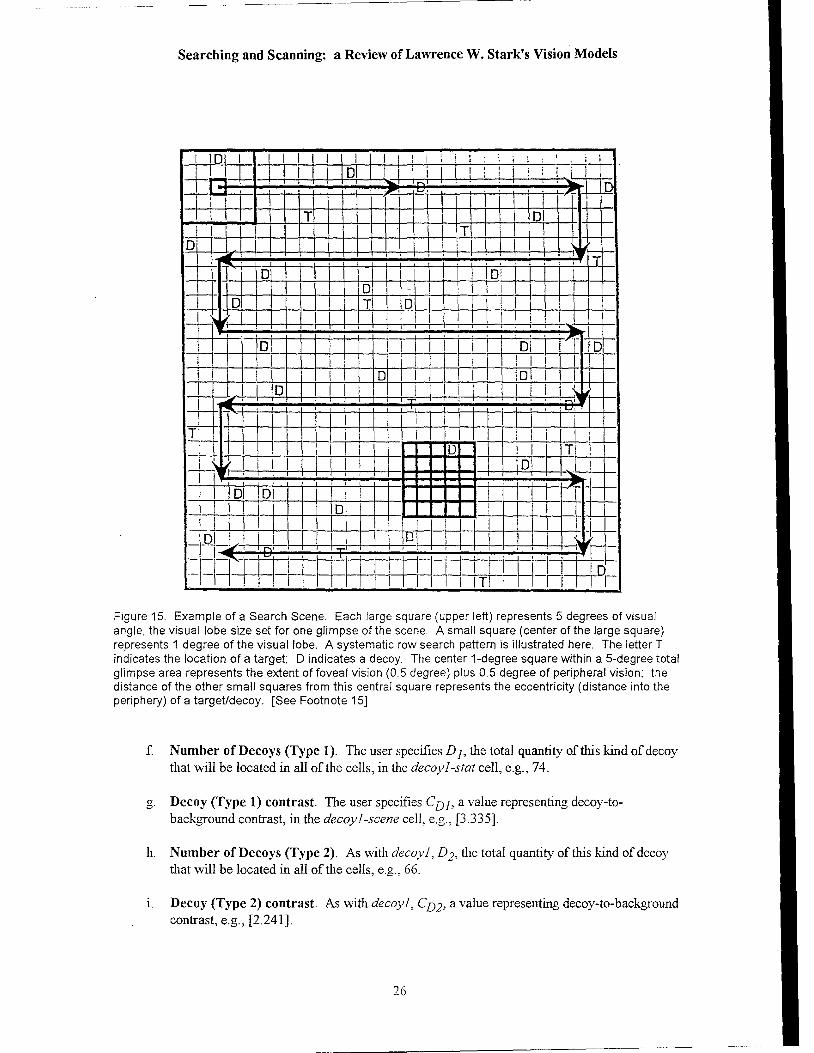
Figure 15. Example of a Search Scene. Each large square (upper left) represents 5 degrees of visual angle, the visual lobe size set for one glimpse of the scene. A small square (center of the large square) represents 1 degree of the visual lobe. A systematic row search pattern is illustrated here. The letter T indicates the location of a target; D indicates a decoy. The center 1-degree square within a 5-degree total glimpse area represents the extent of foveal vision (0.5 degree) plus 0.5 degree of peripheral vision; the distance of the other small squares from this central square represents the eccentricity (distance into the periphery) of a target/decoy. [See Footnote 15]
f. Number of Decoys (Type 1 ). The user specifies D 1, the total quantity of this kind of decoy that will be located in all of the cells, in the decoy I -stat cell, e.g., 74.
g. Decoy (Type 1) contrast. TI1e user specifies CDJ, a value representing decoy-tobackground contrast, in the decoyl-scene cell, e.g., (3.335].
h. Number of Decoys (Type 2). As with decoy], D2, the total quantity of this kind of decoy that will be located in all of the cells, e.g., 66.
1. Decoy (Type 2) contrast. As with decoy I, CD2, a value representing decoy-to-background contrast, e.g., [2.241].
26

Searching and Scanning: a Review of Lawrence W. Stark's Vision Models
J. Number of Decoys (Type 3). As with decoy], D3, the total quantity of this kind of decoy that will be located in all of the cells, e.g., 62.
k. Decoy (Type 3) contrast. As with decoy], CD3, a value representing decoy-to-background contrast, e.g., [0.843].
2. Search model to be used. Either S5 , Systematic Row Search, or Sr, Random Search, may be specified.
3. Number of glimpses. G, the total number of glimpses that will be used for the search, is specified (used only for the Random Search module).
4. Detection and recognition probabilities. Values from 0 to 1 are used for P dl for the 1-degree, P d2 for 3-degree, and P d3 for 5-degree lobe limits (e.g., 0.28, 0.27, and 0.24), and for Pr for the probability offoveal recognition (e.g., 0.9).
Several parameters are fixed for all runs. These include:
1. Target size. This is referred to as wr, fixed at 0.5 degree, or 2 degrees per cycle.
2. Decoy size. These are referred to as wDJ, wD2' and wD3, fixed at 0.5 degree, or 2 degrees per cycle.
3. Foveal lobe size. Lobe size Fis fixed at 0.5 degree.
5.4 Main Protocol Module The Protocol module provides the driver or main control algorithms. All other modules
communicate via the Protocol module.
Data Inputs. All of the user inputs listed above are input to the Protocol module, for distribution to other
modules as needed.
Data Processing. 1. Compare the user-entered scene size and lobe size to determine that they are compatible.
2. Invoke the Search Scene Construction module, pass required parameters, and collect outputs.
3. Select and invoke either the Systematic Row Search module or the Random Search module for the search process (based on the user's entry), pass required parameters, and collect outputs.
4. Invoke the Hard Visual Lobe module, pass required parameters, and collect outputs.
5. Invoke the Decision module, pass required parameters, and collect its outputs concerning whether an individual target or decoy was detected.
6. Tabulate the Decision module outputs to determine the total number of objects detected.
27

Searching and Scanning: a Review of Lawrence W. Stark's Vision Models
7. Invoke the Hard Foveal Lobe module, pass required parameters, and collect outputs concerning whether an individual object was recognized.
8. Invoke the Decision module, pass required parameters, and collect its outputs concerning whether individual targets were recognized and whether decoys were recognized as targets.
9. Tabulate the Decision module outputs to determine the total number of targets recognized and the number of false alarms (decoys falsely recognized as targets).
Module Outputs. 1. Total number of detections of targets, Td, and decoys, D ]t} D2d, D3d·
2. Total number of targets recognized, Tr.
3. Total number offalse alarms (decoys recognized as targets), Tja·
4. Total search time (from Systematic Row Search module only): t5 .
5. Total search area covered (from Random Search module only): ((x, Y)min' (x, Y)max)·
6. Cumulative detections-per-glimpses ratio: (Dr+ DDJ + Dn2 + Dn3jG.
5.5 Search Scene Construction Module This module sets up the very simple scene that will be searched for targets (see Figure 15). The
scene represents an apparently random distribution of targets and decoys (similar to scenes illustrated in Figures 2 and 3, not that ofFigure 4). Search scene parameters include the number of large and small cells in the matrix, cell contents as targets or decoys, and the contrast and size of targets and decoys. About 1 to 2 per cent of cells typically may contain targets and 3 to 6 per cent contain decoys.
As shown in Figure 15, the search scene is divided into a rectangular matrix of larger cells each representing the visual lobe area covered by a glimpse (taken here to be 5 degrees wide and 5 degrees high). Each visual lobe cell is further divided into smaller cells each representing a small portion of the visual lobe area (25 cells, each 1 degree wide by 1 degree high, in the example), used to simulate image eccentricity in the visual lobe. That is, one probability of detection can be assigned if the target/decoy is located in the center small cell, a lower probability can be assigned if it is in the "ring" just outside the center small cell, and a still lower value can be assigned for the outermost "ring" of small cells within a large visual lobe cell (see Figure 16). If there are 36large visual lobe cells in the scene and 25 small cells per large cell, the result is a matrix of900 cells.
Data Inputs. l. The number of rows, M, and the number of columns, N, of large visual lobe cells in the total search
scene.
2. The number of rows, m, and the number of columns n, of small cells in each larger visual-lobe cell.
3. Number of targets in the total search scene, T.
4. Number of decoys of each type in the scene, D 1, Db D3.
28

Searching and Scanning: a Review of Lawrence W. Stark's Vision Models
Probability of Detection j
~ -h -~ -~ o 1 ~ A Degrees Eccentricity from Visual Axis
(Simulated)
Figure 16. Representation of a Three-Level Hard Visual Lobe. The closer the image is to the visual axis, the higher the probability of detection. Eccentricity levels shown here (1 degree, 3 degrees, and 5 degrees) are the same as used in Figure 15, within a given simulated 5-degree visual lobe. (See Footnote 15]
Data Processing. 1. The location of the ith target/decoy has coordinates (xi> Yi) within a foveal lobe cell located at (Xi,
Yj). Possible target/decoy locations range from xi= (1, ... , Nn) andyi = (1, ... , Mm).
2. Determine the location of the ith target/decoy by drawing a random number: xi= RAND (1, ... , Nn). Yi =RAND (1, ... ,Mm).
3. To ensure that no more than one target/decoy occupies a single cell, include the constraint (xi,Yi) "# (xj,Yj) when i "# j; fori= 1, ... , (T+ D 1 + D2 + D3); i = 1, ... , (T+ D1 + Dz + D3).
4. Continue the process for a total of (T+ D 1 + D2 + D3) times.
Module Outputs. 1. For each target/decoy:
a. Object type, Target, Decoy 1, Decoy2, or Decoy 3 (probably identified by its assigned contrast value).
b. Object location, (xi> Yi)·
5.6 Search Modules
5.6.1 Systematic Row Search algorithms
This module moves the simulated visual lobe systematically over the scene constructed by the Search Scene Construction module (see Figure 15). A boustrophedon ("windshield wiper") row search is performed from upper left to lower right, with each row dropping to the one directly below (rather than returning to the left-most column) and with no overlap. The search proceeds in discrete jwnps of
29

Searching and Scanning: a Review of Lawrence W. Stark's Vision Models
constant size that simulate glimpses. Thus the search scene is viewed section by section, where each section is equal in area to that of the simulated visual lobe (one glimpse).
Data Inputs. 1. The number of rows, M, and the number of columns, N, of large visual lobe cells in the total search
scene.
Data Processing. 1. Label the search scene rowsX1 .. M, and the columns Y1 ... N. Each Xi and Yi intersect a section
equal to the visual lobe size.
2. Start atX1Y1. This is the first glimpse.
3. HoldX1 constant and increment Y1 to Y2.
4. Continue this process until Yi = Y N then proceed to X 2Y N
5. Hold X 2 constant and decrement Y N until Yi = Y 1· Continue this process until
Xi =XM yi = YM.
6. Calculate search time, t5 , as [(113 second) * (MN glimpses)].
Module Outputs. 1. A visual lobe cell to be searched during a given glimpse (for use by the Visual or Foveal Lobe
module): (XiYj).
2. Search time, t5 .
5.6.2 Random Search algorithms
This module moves the simulated visual lobe randomly over the scene constructed by the Search Scene Construction module (Figure 15). The search proceeds in discrete jumps that simulate glimpses; both the direction and distance of movement are randomized, using a random number generator. Movement is possible in eight directions, except for the outer-most rows and columns. The search scene is viewed section by section, where each section is equal in area to that of the simulated visual lobe (one 5-degree glimpse, in the example).
Data Inputs. 1. The number of rows, M, and the number of columns, N, of large visual lobe cells in the total search
scene.
2. The number of rows, m, and the number of columns n, of small cells in each larger visual-lobe cell.
3. Maximum number of glimpses to be used for the search process, G.
Data Processing. 1. Each visual lobe cell has a location (Xi, Yi) in the search scene (which consists ofM rows and N
columns). The visual lobe cell is composed of m rows and n columns of small cells, each with location (xi, Yi) within in the lobe cell.
30

Searching and Scanning: a Review of Lawrence W. Stark's Vision Models
2. Referring to Figure 15, the center-most small cell in a visual lobe cell represents the foveal area, and has location (x0 y c)· When the observer's glimpse moves from the center of the current visual lobe cell, it must cross 112(m - 1) small cells in they -axis and 112(n - 1) small cells in the x -axis of the current visual lobe cell, then another comparable amount in the target visual lobe. Thus the offset of the center location (xc, y c) from one glimpse to the next is: Xoffset = 2(1/2(n-1). Yoffset = 2(112(m-1).
3. The number of possible new centers for the lobe must be reduced by the offset values:
Xpossible = Nn - Xoffset·
Ypossible =Mm- Yoffset·
4. If the current glimpse is i, and the current location of the center of the visual lobe is (xi, Yi), then the next location of the center of the visual lobe is (xi + b Yi + 1 ), where (xi + 1) =RAND (1, Xpossibfe) + 112xoffset·
(yi + 1) =RAND (1,Ypossibfe) + 112Yoffset·
5. Continue random search process until i = maximum number of glimpses specified.
6. Compute the range of the search over the total search area, ((x, Y)min' (x, Y)max), as
Xmin =:_xi + 1 - 112xoffset;. Ymin = _!i + 1 - 112Yoffset· Xmax- xi + 1 + 112xoffset' Ymax- Yi + 1 + 112Yoffset·
Module Outputs. 1. Visual lobe cell to be searched during a given glimpse (for use by the Visual or Foveal Lobe
module): (XiYJ
2. Search area covered by the Random Search module: ((x, Y)min' (x, Y)max)·
5. 7 Lobe Detection Modules
5.7.1 Hard Visual Lobe algorithms
This module provides the probability of target/decoy detection using the total visual lobe, including both foveal and peripheral vision. The visual lobe is treated as a three-level "cookie cutter" detection apparatus, with annular "rings" (actually squares) subtending 1 degree, 3 degrees, and 5 degrees centered on the visual axis, within the modeled 5-degree visual field for a single glimpse (see Figure 16). Since a three-level hard lobe is modeled, detection probabilities are constant for all eccentricities of the target/decoy image on the retina within the specified lobe limits, and zero outside these limits.
Within a given lobe "ring," probability of detection is simply a function of target/decoy size, w, and contrast, C. For these simulations, the target was fixed at 0.5 degree in size; in terms of spatial frequency, w = 2 cycles/degree. Thus the probability of detection is a function only of the assigned target/decoy contrast values.
Data Inputs. 1. Visual lobe cell to be searched during this glimpse (from the Systematic or Random Search
module), (XiYJ
31

Searching and Scanning: a Review of Lawrence W. Stark's Vision Models
2. For any target/decoy in that cell: a. Location in the large cell, (xi, yj).
b. Contrast value for that target, Cy, or for that type of decoy, CDI, CD2, or CD3·
c. Size, wr, w DJ, w D2' or w DJ, fixed at 0.5 degree (2 degrees per cycle).
3. Probability of detection as a function of eccentricity within the visual lobe cell, P db P d2' P d3·
Data Processing. 1. Determine whether a target/decoy is present in this cell. If so, go to Step 2. If not, get another
visual lobe cell from the Systematic or Random Search module.
2. Determine from its (xi, yj) position in which of the three lobe levels (1 degree, 3 degrees, or 5 degrees of eccentricity) the target/decoy is located, and assign it an appropriate table of values of detection probabilities (as a function of contrast) for that lobe level.
3. For a given lobe level, use the general equation for hard lobe detection, P d = f(C, w ). Since w is fixed at 2 cycles/degree, P d = f( Cm).
4. Use the appropriate table to select the applicable value for P d, for a given eccentricity level and contrast level, e.g.,
em 11Cm Simulation P d Experimental P d
0.08 12 0.1 0.05 0.20 5 0.5 0.46 0.33 3 0.9 0.97
5. Get the next visual lobe cell from the Systematic or Random Search module, and repeat. Continue this process until all search scene cells have been reviewed.
6. Calculate the detections-per-glimpses ratio for all objects (see Figure 17): (Dr+DDJ +DD2+DD3jG.
Module Outputs. 1. Probability of detection P d for each target/decoy in each visual lobe.
2. Cumulative detections-per-glimpses ratio for all objects:
(Dr+ DDI + DD2 + DDJjG.
32

Searching and Scanning: a Review of Lawrence W. Stark's Vision Models
Cumulative Targets/Decoys Detected
6~--------------------------------~--------~
Systematic ( Pd=1.0 )
~ 5
~~-
4
50 10(' .150. 200
Number of Glimpses
Figure 17. Example of Cumulative Detections as a Function of Number of Glimpses. This example assumes that the search scene contains 50 visual lobe cells that include a total of 5 targets. Multiple passes (50 glimpses each) are made over the search scene. Number of targets/decoys detected is provided for four search conditions: systematic, with probability of detection of 1.0 and 0.3, and random, with the same probabilities of detection. [See Footnote 15]
5.7.2 Hard Foveal Lobe algorithms
This module provides the probability of target/decoy recognition using foveal vision, once the target has been detected somewhere in the visual lobe. The target/decoy closest to the center of the visual axis during a given glimpse is selected for further inspection and possible recognition.
The fovea is modeled as subtending 0.5 degree. Since acuity is uniform over the foveal area, recognition probabilities are constant for all eccentricities of the target/decoy image on the fovea. Target/decoy size is assumed to be::::; 0.5 degree, so probability of recognition is simply a function of target/decoy contrast.
Data Inputs. 1. Visual lobe cell to be searched during this glimpse (from the Systematic or Random Search
module), (XiYJ
2. For any target/decoy in that cell: a. Type, Target, Decoyl, Decoy2, or Decoy 3.
b. Location in the visual lobe, (xiyJ
33

Searching and Scanning: a Review of Lawrence W. Stark's Vision Models
c. Contrast value for that target, Cr, or type of decoy, CDJ• CD2· or CD3·
d. Size, wr, WDJ, wD2' or wD3, fixed at 0.5 degree (2 degrees per cycle).
3. Foveal lobe size F, fixed at 0.5 degree.
4. Probability of recognition within the visual lobe cell, Pr.
Data Processing. 1. Determine whether a target/decoy is present in this cell. If so, go to Step 2. If not, get another
visual lobe cell from the Systematic or Random Search module.
2. Using the general equation for hard lobe recognition, P r = j( C, w ). Since w is fixed at 2 cycles/degree, Pr = f(Cm)·
3. Use the appropriate table to select the applicable value for Pr as a function of contrast, e.g.,
0.08 0.20 0.33
12 5 3
Simulation Pr
(not provided in docwnentation)
Experimental P7
(not provided in documentation)
4. Get the next visual lobe cell from the Systematic or Random Search module, and repeat. Continue this process until all Search module cells have been reviewed.
Module Outputs. 1. Probability of recognition P r for the target/decoy closest to the visual axis of the visual lobe cell.
5.8 Decision Module
This module determines whether a target/decoy has been detected and also whether a target has been recognized. A random nwnber (0 to 1) is compared with the probability of detection/recognition provided by the lobe construction algorithms. If the random nwnber is smaller, the object is asswned to have been detected/recognized.
Data Inputs. 1. Probability of detection, P d' for each target/decoy detected in the Visual Lobe module.
2. Probability of recognition, Pr, for each target/decoy recognized in the Foveal Lobe module.
3. Type of object that was recognized as a target: Target, Decoy], Decoy2, or Decoy 3 (probably identified by its assigned contrast value).
Data Processing: Detection. 1. Determine whether a target/decoy has been detected in this cell. If so, determine P d for that
target/decoy and go to Step 2. If not, get another visual lobe cell from the Hard Visual Lobe module.
34

Searching and Scanning: a Review of Lawrence W. Stark's Vision Models
2. Obtain a random number, r, from a random number generator such that 0 :5 r :5 1.
3. Compare r with P d· If r :5 P d' then the object is detected.
Data Processing: Recognition. 1. Determine whether a target/decoy has been recognized in this cell. If so, determine P r for that
target/decoy and go to Step 2. If not, get another visual lobe cell from the Hard Foveal Lobe module.
2. Obtain a random number, r, from a random number generator such that 0 :5 r :5 1.
3. Compare r with P r· If r :5 P r' then the object is recognized as a target.
4. Determine whether that object actually is a target or is a decoy. If it is a target, the result is consider~ to be a recognition; if not, it is considered to be a false alarm.
Module Outputs. 1. Logical output for detection: Detection = true/false.
2. Logical output for recognition: Recognition= true/false; False Alarm= true/false.
35

Searching and Scanning: a Review of Lawrence W. Stark's Vision Models
6.0 Discussion and Assessment
This report provides a brief summary of the research and models of Dr. Lawrence W. Stark as these relate to searching for and scanning objects in the visual field. Information that can be applied to the modeling of visual search for personnel, ground vehicles, and helicopters in cluttered terrain has been of particular interest here. The following comments are provided to assess the applicability of Stark's theories to U.S. Army search and target acquisition (STA) conditions and situations.
1. Concepts and terminology. Stark's distinction between searching and scanning is a useful one (Section 2.2). Terms such as search patterns, search paths, and scanpaths- with clear-cut definitions of the terms - should aid significantly in modeling the serial ST A processes.
Usefulness and promise: Stark's terms and definitions generally should be useful for Army modeling of serial STA processes.
Discrepancies and omissions: The definitions used by Stark are not the same as those used by many other target acquisition researchers for the same terms, and may be confusing unless clearly defined each time used. The term scanning, in particular, usually is used for moving (slewing) sensor systems over the field of view rather than for inspecting a single target. With this caveat, the terms and definitions appear to be complete enough for serial models. However, if parallel STA processes are modeled, the search path and scanpath concepts (which are inherently linear in nature) should not be used, to minimize confusion.
2. Defining regions of interest and setting thresholds. Regions of interest in the visual scene possibly could be used to reduce computing time (Section 3.4). A detection threshold, defined for each region, is needed to specify the degree of similarity between template and target necessary for a match.
Usefulness and promise: A similar approach has been proposed for other STA models. It is appealing in its apparent simplicity.
Discrepancies and omissions: Defming regions of interest in natural scenes must be done carefully, to avoid biasing predictions: if some regions are "more interesting" than otl1ers, criteria that set objective levels of "interest" are needed. Defining appropriate thresholds for what constitutes a match is a major problem, in the absence of applicable experimental results. While the concept is intriguing, implementation of this idea is very difficult. Much research is needed to defme criteria for what constitutes a region of interest. Similarly, studies must be carried out to determine threshold values that will result in predictions that match field test results.
3. Independence of glimpses versus Markov processes. Koopman's detection theory assumes that each glimpse or fixation is independent of the others (Section 3.1). Stark has demonstrated tl1at such independence does not exist in a structured, cluttered scene. There is a significant cognitive component to the search task that apparently links the location of one glimpse with that of the next.
Usefulness and promise: Use of mathematical models that require the assumption of independent events may not be appropriate for representing search in battlefield terrain. Markov models (which assume that the next event depends on the directly previous event) may be more applicable, as Stark suggests (Section 4.3.1).
Discrepancies and omissions: The Markov matrix technique proposed by Stark assumes that two sequences of eye movements are available for comparison (as does the string editing technique; Section 4.3.2). That is, an observer's scanpath and resulting frequency matrix for a given target are known. The observer's scanpath and matrix for an
36

Searching and Scanning: a Review of Lawrence W. Stark's Vision Models
unknown object then are determined, and the matrices are compared to determine whether they represent eye movements for the same object. At least two problems come to mind: (I) how closely alike must the two matrices be, to constitute a match (the threshold problem again) and (2) since scanpaths appear to be unique to both the observer and the object observed, how can these be generalized for use in combat modeling? Significant experimental research would be needed to answer these questions.
4. Serial versus parallel processing. Stark's model is based on the concept that sequential eye movements drive the STA process (referred to as the serial recognition hypothesis; see Section 4.1). The eye focuses on a given point in the scene and processes information there, then moves to a different point, where new information is processed. The possibility that cognitive processing of information from the first point continues after the eye has moved on is not included in the model, nor is the possibility that no processing occurs until after several points have been examined and now can be compared.
Usefulness and promise: For practical purposes, a serial model is easy to visualize and to program. For now, this appears to be a reasonable approach in order to obtain workable computer programs.
Discrepancies and omissions: For the long run, modeling of human parallel processing of information used for STA should be considered. The times required for detection, recognition, and identification could be significantly different if perceptions about individual points were not reviewed individually but instead were analyzed concurrently.
5. Different processing for familiar and random scenes. Stark differentiates between search patterns (used for random distributions of objects in a scene) and search paths (used for visually covering a "natural" scene). This is an important distinction (Sections 3.2 and 3.3). Only the latter has real bearing on military STA, yet much research has focused on fmding letters or other simple objects placed randomly in non-natural, artificially structured (or plain) backgrounds.
Usefulness and promise: Research (by Stark and others) on eye movements and object location in "non-natural" backgrounds has provided useful groundwork for ST A modeling. However, data from such studies must be used with extreme caution when extrapolating to human perception of objects in natural scenes. The latter situation apparently utilizes on a completely different search process, driven by the scene and the observer's expectations.
Discrepancies and omissions: Stark cites research on both search patterns and search paths. However, the computer model discussed in this report imbeds targets and decoys essentially randomly in an artificially-structured background, so that search pattern eye movements are modeled. This is much less useful for Army STA modeling than eye movements that use search paths over real-world scenes.
6. Random, scene-covering, and object-driven eye movements. The easiest way to model search is either as a random series of eye movements (each independent of the previous) or as a systematic coverage of the scene from top to bottom or side to side. Research cited in this report indicates that neither process is likely for humans observing real-world scenes. Eye movements and information gathering instead are functions of the scene and types of targets (Section 3.3).
Usefulness and promise: Stark's data on STA processes related to real objects in realworld scenes possibly will be very useful in Army modeling. However, modeling techniques are needed that will permit some scene generalization (to be programmable, every possible type of scene in the world cannot be modeled individually) but that also reflect actual human STA performance.
37

Searching and Scanning: a Review of Lawrence W. Stark's Vision Models
Discrepancies and omissions: Although his research indicates that random or systematic scene coverage search patterns probably are unrealistic for natural scenes (except possibly for visually covering an area using a slewing sensor), Stark uses such coverage for the computer model described in this report (Section 5.3). This simplification may have been useful to get a working program, but definitely must be replaced for future military ST A modeling. However, first some determinations must be made of how soldiers process information about various military targets in different kinds of combat areas, and how direct vision processing differs from that using slewing sensors. Generalities about such processing then will be needed to make programming feasible. For example, if all tanks are examined in approximately the same detail and sequence, a generic "tank" search process then can be used when a tank is the target.
7. Hierarchy of search tasks. Stark proposes that visual search can be modeled as a series of searches by matched filters (possibly templates with brightness characteristics and/or the outline of the target; Section 3.4). A coarse filter could be used to represent the detection process, then a fmer one for recognition, and finally a quite fine one for identification. This approach implies that the STA process from detection through identification is a continuum, utilizing the same information but with increasingly fme discrimination.
Usefulness and promise: This approach could be used, but only for a very gross (and inaccurate) representation of the human search process.
Discrepancies and omissions: The multiple filter approach suffers from the same problems as Acquire's Johnson line criteria approach and the Oracle fractional perimeter approach. All three assume that detection and identification are essentially the same cognitive process and can be modeled simply by modifying a single parameter. Combat models will fail to yield real-world results as long as such a simplistic approach to human performance is included in STA prediction systems.
8. Straight lines, angles, and details. Stark suggests that scene processing which removes all scene objects except vertical and horizontal lines might represent how the eye tends to pick such lines out of the background (Section 3.4). This modeling process can be useful, but should not be accepted in isolation. Target angles and internal patterns also appear to affect discrimination from the background, and camouflage can fool the eye so that straight lines may not be seen as straight.
Usefulness and promise: Filtering a scene to remove everything except straight lines may be one useful step in modeling perception. This technique has been used for automatic target detection systems.
Discrepancies and omissions: This process, if used alone, would give incorrect results for detection probabilities (and certainly for recognition and identification). If such a model is included, additional processes are required that consider the effect on ST A of target angles (as noted by Stark, storing an image as a sequence of segment lengths and connecting angles can be quite efficient). The effect of internal detail also cannot be ignored, especially for prediction of the probability of recognition and identification.
9. Modeling of clutter. Stark notes that clutter in the target area cannot be modeled simply as "noise." Instead, it must be modeled as unwanted signals that can be confused with the targets (Section 3.4). His approach in the computer program discussed in this report has been to include random background noise, but also to include objects that are similar to the targets (decoys; see Section 5.3).
Usefulness and promise: Inclusion of decoys so a false alarm rate can be modeled in the ST A process is useful, especially since deception is commonly used on the battlefield.
38

Searching and Scanning: a Review of Lawrence W. Stark's Vision Models
Discrepancies and omissions: Modeling other clutter (besides decoys) as random noise is an oversimplification. It ignores the fact that some object shapes and luminances are more conspicuous than others and can catch the attention- even if they do not look like targets -and delay detection of the real targets. More realistic models of battlefield clutter are needed.
10. Theoretical model of visual search. The components of Stark's theoretical model include those generally accepted as strongly influencing ST A behavior: ( 1) target, background and environment, (2) eye movement and retinal images, (3) human search behavior, (4) cognitive processes, and (5) eye and brain physiology (Section 5.1).
Usefulness and promise: Stark's list offactors to be included in the model can serve as a useful checklist, to ensure that none of these critical model components has been left out. The physics of the search scene have been studied in detail for years, and modeling should be straightforward (although Stark does not address the importance of having clear line of sight between observer and target; this too often is taken for granted in models). Stark's own work provides some of the data needed to model human search behavior. The effects of target size and contrast and of image eccentricity on the retina have been successfully modeled in other systems.
Discrepancies and omissions: Much more difficult to implement are the cognitive components of ST A models. Most of the relevant ST A research has been carried out by scientists such as physiologists and physicists who study questions which either have deterministic answers or which can be modeled using known probabilistic distributions. Very little work has been done by psychologists, who are willing to study uniquely human factors that include numerous interacting elements - and that often yield "sometimes" answers best modeled using Zadah's fuzzy set and fuzzy logic theory. The lack of required human performance data is a major problem for implementing Stark's theories into an Army STA combat models.
11. Prototype computer version of visual search model. Although a prototype computer model has been constructed (presumably based on Stark's theoretical model of visual search) this computer program does little except illustrate how many approximations are needed at present to model human search behavior (Section 5.2).
Usefulness and promise: While the theoretical model shows promise, the available computerized prototype is little more than a skeleton on which a model might be hung at some later time. Operations are carried out in a logical order, and it might be possible to substitute real subroutines and procedures for the current approximations. But for now there is little of substance in the program.
Discrepancies and omissions: The program is simply too sketchy at present to warrant listing all of its problems.
39

Searching and Scanning: a Review of Lawrence W. Stark's Vision Models
Glossary
This list provides definitions of terms as they are used by Stark and in this report. Although some definitions may differ from those used by other researchers, the following set reflects the terminology and meanings commonly used by Stark and his coworkers.
Detection: the process of determining that there is something of interest in the scene that should be inspected.
Eye movements: brain-directed movements of the eyeball from one fixation point to the next.
Fovea: the 1- to 2-arc degree area of the retina located on the visual axis, upon which fixated objects are imaged. The fovea provides color vision and high-resolution imaging of objects.
Gaze movement: movement of the eye in space, including both head movements and eye movements, as the observer inspects the field of regard.
Identification: the process of determining that an object which has been recognized matches its detailed internal representation closely enough to be considered identical to that internal representation (often used interchangeably with recognition in the Stark literature).
Internal representation: components or features of a previously-observed object that are stored in the brain's memory system, then matched step by step with the object when it is viewed again and the observer attempts to recognize it.
Location: the process of determining where a specific object is placed in the scene, with respect to other objects in the scene.
Object features: the components of an image that hold the most information about that image, primarily the points where line directions change most abruptly.
Recognition: the process of matching the image of an object with its gross internal representation in the memory system (often used interchangeably with identification in the Stark literature).
Saccades: eye movements occurring at about 3 per second but occupying only about lO per cent of total viewing time. Vision is suppressed during saccades, so that almost all visual information is collected during fixations.
Scanning: a process involving active, regular eye movements over an area or target, with the goal of recognizing and possibly identifying what is looked at. The observer inspects the scene or object and compares its features with those of stored cognitive models. Scanning usually ends when the recognition or identification process is complete.
Scanpath: the repetitive and idiosyncratic sequence of eye movements used for inspecting and recognizing particular familiar objects during normal viewing of scenes, people, and objects. The scanpath is shaped by a cognitive model of the guessed object and the organization of its subfeatures. This cognitive model controls active looking to result in efficient acquisition of visual
40

Searching and Scanning: a Review of Lawrence W. Stark's Vision Models
information. Scanpath sequences occupy from about 25 to 30 per cent of the observer's viewing time, the rest consisting of less regular eye movements.
Scanpath feature ring: a serial model of the internal representation of objects. The model maintains that representations of objects are composed of sensory memory traces recording object features and of motor memory traces of the eye movements from one feature to another. As an observer views an object for the first time and becomes familiar with it, he or she alternately records a feature of the object and the eye movement required to reach the next feature. The memory traces of the feature ring thus are laid down, as both sensory and motor activities are recorded. When the object is next encountered, the observer recognizes it by matching it with the feature ring.
Scan path theory: a theory that suggests that eye movements are controlled by internal cognitive models already present in the brain, and that predicts similar sequences of visual fixations for a given observer looking repeatedly at a particular image.
Search path: an efficient, repetitive, idiosyncratic sequence of eye movements utilizing only a small set of fixations to check a number of features in the scene, generally the targets. This sequence occurs during observation of "natural" scenes with naturally-distributed targets, and leads to inspection of the expected locations of the targets. Search paths tend to be unique to the observed scene. They are shaped and driven by internal spatial models of the spatial organization of target objects in a 3-D "natural" scene, and by knowledge accumulated from previous experience.
Search pattern: an efficient, repetitive, idiosyncratic sequence of eye movements carrying the eye systematically to cover an entire 2-D scene. This sequence occurs during observation of an apparently random distribution of objects located in a search area, when the observer is not familiar with the area's spatial organization (if any). Search patterns can be regular (horizontal, vertical, oscillating, circular) or irregular (essentially random). They usually are modes of covering a search area in an efficient and thorough manner when no information is available to shape the search.
Serial recognition hypothesis: during recognition, the features of an observed object are matched serially, step by step, with the features of internal representation that may match that object. Successful matching of all features completes recognition.
Visual lobe: the probability of acquiring a target, plotted against the off-axis angle of the target image on the retina. The distribution of these probability angles constitutes a soft-shell visual lobe. When a constant probability of acquisition is assumed over several degrees (or over the entire retina), the model is referred to as a hard shell (or "cookie cutter") visual lobe.
Visual periphery: the retinal area outside tl1e fovea, extending out to tl1e limits of vision. The periphery provides low-resolution black and white vision and is especially good at motion detection. Scene features often are tentatively located in the periphery of the retina then fixated directly for detailed inspection.
Visual search: general term for a process involving active eye movements that cover or encompass a scene or the field of regard, with the goal of locating (and possibly recognizing) a desired object.
41

Searching and Scanning: a Review of Lawrence W. Stark's Vision Models
INITIAL DISTRIBUTION LIST
1. Research Office (Code 08) .............................................................................................................. 1 Naval Postgraduate School Monterey, CA 93943-5000
2. Dudley Knox Library (Code 52) .................................................................................................... 2 Naval Postgraduate School Monterey, CA 93943-5002
3. Defense Technical Information Center ......................................................................................... 2 8725 John J. Kingman Rd., STE 0944 Ft. Belvoir, VA 22060-6218
4. Department of Operations Research ........................................................................................... 1 Editorial Assistant (Code OR/Bi) Naval Postgraduate School Monterey, CA 93943-5000
5. CAPT (Sel.) Frank Petho (Code OR/Pe) ...................................................................................... 1 Naval Postgraduate School Monterey, CA 93943-5000
6. Prof. Judith H. Lind (Code OR/Li) ............................................................................................... 5 Naval Postgraduate School Monterey, CA 93943-5000
7. Artillery Division ............................................................................................................................ 77 US Army TRADOC Analysis Command Attn: A TRC-WBD, Bob Bennett White Sands Missile Range, NM 88002-5502
8. LTC Ralph Wood ............................................................................................................................. 1 TRAC Monterey Naval Postgraduate School Monterey, CA 93943-5000
9. MAJ Bill Murphy ............................................................................................................................. 1 TRAC Monterey Naval Postgraduate School Monterey, CA 93943-5000
10. Prof. Alan Washburn (Code OR/Ws) .......................................................................................... 1 Naval Postgraduate School Monterey, CA 93943-5000
11. LTC Mark Youngren (Code OR/Ym) .......................................................................................... 1 Naval Postgraduate School Monterey, CA 93943-5000
42

Searching and Scanning: a Review of Lawrence W. Stark's Vision Models
12. Prof. Morris Oriels (Code ME/Or) ............................................................................................... 1 Naval Postgraduate School Monterey, CA 93943-5000
13. Mallory Boyd ................................................................................................................................... 1 Code 4555300 Naval Air Warfare Center Weapons Division China Lake, CA 93555
14. Dale Robison .................................................................................................................................... 1 Code 4555300 Naval Air Warfare Center Weapons Division China Lake, CA 93555
15. Robert Osgood ................................................................................................................................. 1 Code 4555300 Naval Air Warfare Center Weapons Division China Lakz, CA 93555
16. Jan Stiff .............................................................................................................................................. 1 Code 4555300 Naval Air Warfare Center Weapons Division China Lake, CA 93555
17. Army Research Laboratory ............................................................................................................ 1 Attn: AMSRL-HR-SD (J. Swoboda) Aberdeen Proving Ground, MD 21005
18. Ronald A. Erickson ......................................................................................................................... 1 ASI Systems International 2835 Loraine Dr. Missoula, MT 59803
43