1994 Process monitoring and control during spot welding of ...
195
University of Wollongong Research Online University of Wollongong esis Collection University of Wollongong esis Collections 1994 Process monitoring and control during spot welding of metallic coated steels Stephen William Howes University of Wollongong Research Online is the open access institutional repository for the University of Wollongong. For further information contact the UOW Library: [email protected] Recommended Citation Howes, Stephen William, Process monitoring and control during spot welding of metallic coated steels, Master of Engineering (Hons.) thesis, Department of Mechanical Engineering, University of Wollongong, 1994. hp://ro.uow.edu.au/theses/2524
Transcript of 1994 Process monitoring and control during spot welding of ...

University of WollongongResearch Online
University of Wollongong Thesis Collection University of Wollongong Thesis Collections
1994
Process monitoring and control during spotwelding of metallic coated steelsStephen William HowesUniversity of Wollongong
Research Online is the open access institutional repository for theUniversity of Wollongong. For further information contact the UOWLibrary: [email protected]
Recommended CitationHowes, Stephen William, Process monitoring and control during spot welding of metallic coated steels, Master of Engineering (Hons.)thesis, Department of Mechanical Engineering, University of Wollongong, 1994. http://ro.uow.edu.au/theses/2524

PROCESS MONITORING AND CONTROL DURING SPOT WELDING OF METALLIC
COATED STEELS
A thesis submitted in fulfilment of the
requirements for the award of the degree
MASTER OF ENGINEERING HONOURS
from
UNIVERSITY OF WOLLONGONG
by
STEPHEN WILLIAM HOWES Bachelor of Metallurgy
DEPARTMENT OF MECHANICAL ENGINEERING
1994

This is to certify that this work has not been submitted
for a degree to any other university or institution.
Stephen Howes

This thesis is dedicated to my wife Patricia and my son Adrian.

ABSTRACT
Metallic coated steel sheet can be very aggressive towards copper alloy, resistance spot
welding electrodes. These steels accelerate the electrode degradation process far in excess of
that experienced when spot welding uncoated steels through an accumulation of the coating
around the electrode tips, changing the geometry of the electrode and through an erosion
process on the tip face in contact with the workpiece. The rate of electrode degradation is
closely linked to the chemistry of the metallic coating and can be very severe, particularly
when welding steels with coatings high in aluminium or when inappropriate welding
conditions are used.
High volume welding industries employing these steels are now faced with the need to
more frequently monitor weld quality and electrode condition in order to sustain structural
integrity of their product. Being very time consuming, the traditional shop floor, destructive
techniques for assessing weld quality, are no longer considered appropriate. This has
provided the impetus for researchers to develop new, non-destructive techniques which are
easily implemented and which remove operator judgement as to the condition of electrodes.
This work examines the feasibility of such a technique. The Adept (Advanced Grey
Scale) Vision System has been assessed as to its ability to view and accurately measure the
impression left by spot welding electrodes on the surface of a zinc-iron rich metallic coated
steel during a simulated production run and to equate these measurements to weld nugget
size and tensile shear strength.
The results of this work appear promising in that the vision system has identified
electrode wear patterns and has successfully related these to both nugget size and tensile
shear strength, these being paramount to engineers charged with design. The accuracy of
the vision system has been thoroughly checked through the use of other techniques including
carbon paper impression measurements of the degrading tips, profilometry on the
impression left by the indenting electrode and ultrasonic and X-ray measurement of the weld
prior to final destructive peel testing to measure actual weld nugget size. All techniques
i

indicate trends that support the vision systems future capability as a new, non-destructive
weld quality monitoring system.

A CKNO WLEDGEMENTS
The author gratefully acknowledges Dr Elias Siores, w h o provided the initial
encouragement to undertake this work and for his continuous guidance and support during
the period over which it was conducted. Further to this, he encouraged submissions of four
technical welding papers related to the topic, to both international conferences and journals
thereby building on the authors recognition in the welding arena and in particular the field of
resistance spot welding, an area in which the author has some 15 years experience while
working at B H P Slab and Plate Products Division Welding Development Department and
Sheet an Coil Products Division, Research and Technology Centre, Port Kembla, Australia.
Since these submissions were made during the course of the degree, they are presented in
full as Appendices 1 through to 5. The author also acknowledges Dr A Basu who provided
guidance during the final stages of the thesis.
The author also wishes to acknowledge the invaluable assistance provided by the
following individuals during various stages of the work:
Dr John Lake, B H P Wire Products Division (formerly of B H P Sheet and Coil Products
Division) for early discussions regarding the scope of the work;
Dr Ewan Maddrell, formerly of B H P Sheet and Coil Products Division, Research and
Technology Centre, for instruction in the operation of the surface profilometer
equipment;
M r Jeff Roberts of the Illawarra Technology Corporation for instruction in the operation
of the visual analysis equipment;
Dr Bob Harrison of Australian Nuclear Science and Technology Organisation for
assistance with ultrasonic examination of weld samples;
M r Ted O w e n of B H P Slab and Plate Products Division for assistance with radiographic
examination of weld samples;
Mrs Cecily Munro of B H P Sheet and Coil Products Division for her assistance in
preparation of this document.
Special thanks are due to the management of BHP's Research and Technology Centre,
Port Kembla, Australia and in particular Dr Robert Hobbs (General Manager), for providing
m e with the opportunity to undertake this work and finally to m y wife Patricia and son
Adrian, who without their love and understanding, this thesis would not have been possible.
iii
TABLE OF CONTENTS
Abstract
Acknowledgements
Table of Contents
List of Figures
List of Tables
1.0 INTRODUCTION
2.0 LITERATURE SURVEY
2.1 Resistance Spot Welding
2.2 Monitoring and Control Devices
2.3 Electrical Parameters — General
2.3.1 Welding current
2.3.2 Voltage
2.3.3 Time
2.3.4 Resistance
2.3.5 Monitors for welding voltage and current
2.3.6 Resistance measurement and monitoring of dynamic
2.4 Nugget Temperature
2.5 Infra-Red Radiography
2.6 Weld Expansion and Contraction
2.7 Acoustic Emission
2.8 Ultrasonic Signals
2.9 N e w Monitoring Approaches

3.0 E X P E R I M E N T A L P R O C E D U R E S A N D PRELIMINARY R E S U L T S 35
3.1 Materials Used in this Study 35
3.1.1 Metallic coated steel sheet 35
3.1.2 Electrode selection 35
3.2 Preliminary Experimental Work 37
3.2.1 Identification of optimum weld parameters 37
3.2.2 Electrode life testing procedure 44
3.2.3 Electrode tip life test conditions for weld parameter study 46
3.2.4 Description of the welding machine 47
3.2.5 Electrode tip life test results — weld parameter study 48
3.3 Description of Profilometer and Vision Sensing Equipment 55
3.3.1 Profilometer 55
3.3.2 Vision sensing 5§
4.0 EXPERIMENTAL RESULTS 62
4.1 Weldability Lobe 63
4.2 Tracking of Electrode Tip Degradation through Carbon Paper 65 Impressions
4.3 Tracking of Weld Impression Diameter through Profilometry 69
4.4 Tracking of Weld Impression through Vision Sensing 73
4.5 Measurement of Nugget Diameter through X-Ray Analysis 74
4.6 Measurement of Nugget Diameter through Ultrasonic Technique 76
4.7 Measurement of Nugget Diameter through Conventional Vernier Calliper Method 09
4.8 Tensile Shear Strength Testing of Weld Nuggets 84
5.0 DISCUSSION OF RESULTS 88
6.0 CONCLUSIONS 109
v

7.0 FUTURE WORK
REFERENCES
APPENDICES
LIST O F F I G U R E S
I. The resistance spot welding process 18] 5
2. Weld metal expulsion during resistance spot welding 7
3. Typical weld lobes for 1.2 m m uncoatcd and galvanized steels [21 9
4. Truncated cone and radiused spot welding electrode tip profiles 10
5. Peel test for determining weld nugget diameter and penetration [62] 12
6. The hammer and chisel test [8] 12
7. Typical relationship between monitor count and nugget diameter [10] 14
8. Schematic of dynamic electrical parameters during spot welding of mild steel [8] 17
9. The relationship between weld diameter and voltage drop during resistance 18 spot welding [8]
10. The relationship between nugget diameter and the area under the voltage curve 19 produced during resistance spot welding [8]
11. Andrews'model of the simplest form of a dynamic resistance monitor [31] 23
12. A typical dynamic resistance curve for a single pulse resistance spot weld on 23 an uncoated mild steel [32]
13. Positioning of an infra-red emission detector shown as a fibre optic cable 26 light guide' for monitoring of spot weld quality. The upper electrode is not shown [9]
14. The positioning of dual infra-red emission detectors outside of the welding 26 electrodes and at 45° to the surface of the workpiece [8]
15. Typical results from an infra-red monitoring system showing the 27 relationship between trace amplitude and weld shear strength [8]
16. A characteristic curve of electrode movement (distance designated by 'S') 28 during a single pulse spot weld observed by Stiebel et al [36]
17. Schematic output data of acoustic emission during resistance spot welding [8] 30
18. Schematic of current input into a resistance spot weld [8] 4 \
19. Finite element analysis used to measure voltage points within a truncated 43 cone electrode profile (half-section shown) [54]
20. The ratio of current density (J) at electrode face edge (or shoulder) to current 43 density at face centre in a truncated cone electrode profile [54]
21. Positioning of test strips into the welder for electrode tip life testing 46
22. General view of resistance spot welding facility including data acquisition 48 system and lathe for machining electrodes
vii

23. Tip life test results for electrogalvani/.cd, Z I N C A N N E A L (G2 ZFIOO) AI-45% 50 zinc-coated and Zn-5% Al-coated steels
24. Tip life test results for hot dipped galvanized steel 51
25. Profilometer pick-up ami and stylus drawn across indented resistance spot 55 weld surface
26. Components of the Taylor Hobson Form Talysurf 120 profilometer 56
27. Schematic of vision system experimental set-up 59
28. Resistance spot weldability lobe for 0.8 m m thick Z I N C A N N E A L ® G 3 N ZF80 65
29. Carbon paper impressions taken during the course of an electrode tip life test 67 on Z I N C A N N E A L G 3 N ZF80
30. Average tip diameter results obtained from carbon paper impressions 68
31. A transverse profilometer trace output (weld 3800, transverse direction) 70 showing points of reference for weld impression diameter measurement (x-x)
32. Profilometer trace showing areas rejected as possible reference points (arrowed) 71 for measurement of weld impression diameter (weld 3000, longitudinal direction)
3 3. Average profilometer impression diameter results 72
34. Average vision system impression diameter results 73
35. Representative X-ray prints of welds taken throughout the initial electrode 75 life test
36. Average nugget diameter results from X-ray analysis 76
3 7. Ultrasonic C-scan image for Weld Number 25 .initial electrode tip life test 79
3 8. Ultrasonic C-scan image from Weld Number 2500, initial electrode tip life test 80
3 9. Ultrasonic C-scan image from Weld Number 4600, initial electrode tip life test 81
40. Average nugget diameter results from inner and outer boundaries measured 82 from ultrasonic C-scans
41. Average nugget diameter results measured via vernier callipers after peel testing 83
42. Tension-shear test specimen configuration showing location of spot weld [7] 84
43. Average vision system impression diameter results, second electrode tip life test 85
44. Average tension-shear test results g^
45. Schematic showing the measurement positions through the carbon paper 94 impression method, profilometer and vision system
46. Longitudinal profilometer trace of the 350th weld showing positions 96 corresponding to electrode wear regions
47. Transverse profilometer trace of the 350lh weld showing position corresponding 97 to 'pin-hole cavity on the electrode face
48. Optimum vision system welding window as a function of tensile shear strength 105
49. Optimum weld nugget diameter operating under the vision system 106
IX

LIST OF TABLES
Types of metallic coated steels 8
Composition and properties of Z I N C A N N E A L G 3 N ZF80 steel 36
Composition and properties of Z I N C A N N E A L G 2 ZF100 steel 38
Composition and properties of Z I N C F O R M G300 A06 Z275 (free zinc-coated, 38 hot-dipped galvanized steel)
Composition and properties of ZINCSEAL CA3SN-E EZ10 39 (electrogalvanized steel)
Composition and properties of zinc-5% aluminium coated steel (Galfan) 39
Composition and properties of Z I N C A L U M E G300 A Z 150 (aluminium-45% 40 zinc-coated steel)
Electrode tip life test results — weld parameter study 49
Current level recordings for welding lobe construction 65
Wear-in, half-life, maturity and termination zones for the carbon paper, 98 profilometer and vision system measurement techniques
CHAPTER 1.0
INTRODUCTION
1

1.0 INTRODUCTION
The research presented in this work has been driven by an inherent problem faced by
high volume welding industries using resistance spot welding to join metallic coated, sheet
steel components. This problem is the need for frequent line stoppages in order to replace or
redress worn electrodes which have been rapidly degraded through the interaction of the
various metallic coatings with the working face of copper-based electrodes. Without
constant monitoring of electrode condition, weld quality suffers.
Weld quality itself has been traditionally monitored via destructive techniques
however, many researchers have offered methods for non-destructive monitoring. S o m e of
these are suitable for use while welding metallic coated steels but all of the techniques require
some form of contact with the workpiece. This research presents an effective alternative
based on vision sensing of weld quality in real-time and as such does not rely on physical
contact.
Prior to undertaking any experimental work to assess the potential for a resistance spot
weld quality monitoring and control system to be vision based, an intensive review of the
literature was undertaken.
In the initial phase of this review which is covered in Chapter 2.0, the basics of the
resistance spot welding process is discussed with emphasis on the problems associated with
a change from welding uncoated sheet steels to welding various types of metallic coated
sheet steels. The general mechanisms for accelerated electrode degradation are described,
along with a brief description of current shop floor, destructive weld quality monitoring
procedures. Chapter 2 then covers in detail the gamut of non-destructive weld quality
monitoring procedures which have been developed over approximately the last two decades,
some of which are in current use.
Chapter 3.0 outlines the initial experimental work conducted in order to identify
appropriate welding conditions for Z I N C A N N E A L (zinc-iron rich) type metallic coated
steels prior to conducting vision system monitored, electrode tip life tests. The effects of
electrode tip geometry (tip diameter and included angle on truncated cone tips) and the
2

inclusion of welding current upslope into the welding schedules for this steel type and hot-
dipped galvanized, electrogalvanized, zinc-5% aluminium coated and aluminium-45% zinc
coated steels are also studied. Chapter 3.0 also describes in detail, equipment used in this
thesis, including the spot welding equipment and its data acquisition system, the Rank
Taylor Hobson Form Talysurf for profilometry measurements of weld surfaces and the
Adept vision sensing equipment.
Chapter 4.0 outlines the procedure adopted for monitoring of various parameters
during the course of electrode tip life testing on 0.8 m m Z I N C A N N E A L G 3 N ZF80.
Results are presented in both tabular and graphical form for carbon paper impression
measurements taken from the degrading electrode tips, profilometry measurements of
impression width left on the sheet surface by the electrodes, vision system measurements of
the impression width, X-ray and ultrasonic measurements of nugget diameter and peel and
tensile-shear testing on welds.
Chapter 5.0 discusses the trends that were evident from the measurements taken and
examines the relationships between each of these and those of the vision system. From
these relationships, the optimum vision system welding window is defined, the boundaries
of which are linked to weld nugget size and tensile-shear strength.
Chapter 6.0 draws firm conclusions from the results of this thesis, while Chapter 7.0
offers directions for future work, including improvements to the experimental vision system
set-up to provide more appropriate illumination to the test piece and the incorporation of
microprocessor controls to establish a closed-loop feedback, weld-quality monitoring and
control system.
3

CHAPTER 2.0
LITERATURE SURVEY
4

2.0 LITERATURE SURVEY
2.1 Resistance Spot Welding
Resistance spot welding belongs to a group of resistance welding processes including
projection welding and seam welding. The heat to form a weld via this process, is generated
by resistance to the flow of electrical current through the parts being joined. In the case of
resistance spot welding, a pair of electrodes held by the welding machine conduct the
electrical current to the workpiece under a force usually supplied by an air actuated cylinder
as shown in Figure 1. Since the electrodes are made of a copper alloy and are mostly water
cooled, heat is quickly extracted away from the surfaces in direct contact with the electrodes,
thus avoiding the possibility of the electrodes being welded to the sheet surface. The
greatest resistance, /?/, to the flow of current takes place at the faying surface (sheet to sheet
interface) and is constrained by the electrode contact area. Heat is not as easily extracted
from this area and so a weld is formed.
Weld Temperature
Figure 1: The resistance spot welding process [8]
Rj = contact resistance of the faying surface /?2 = contact resistance of electrode/material surfaces R3 = electrical resistance of the material.
5

While rapid developments are being made in other welding and adhesive bonding
processes, it is the resistance spot welding technique that remains the most widely used sheet
metal joining technique. Its ease of operation, cost effectiveness and flexible nature in that it
can be integrated with automated and robotic facilities, makes it desirable, particularly for
high volume welding such as that found in the automotive and domestic/household appliance
manufacturing industries. In addition to the author's experiences in this field, it has been
noted that at the shop floor level this process is one of the most widely ill-used joining
techniques. This is influenced by the many process variations available, the industrial
environment in which this process operates, the material surface quality (metallurgical
cleanliness, chemical composition) and characteristics (surface roughness, oiliness) of the
steel sheet, the type of the joint geometry and configuration, electrode type and geometry,
welding machine type and capabilities and operator performance. Each of these effects can
affect weld quality levels.
While many of these can be controlled through good management of steel processing
lines and shop floor welding process, it is the operators' abuse of the procedure that is
difficult to control. This is exacerbated in cases where weld monitoring and control devices
are not in place. Proper maintenance of electrodes is a critical issue in the resistance spot
welding process and without suitable electrode tip redressing tools and standard operating
procedures in place, some operators employ rough cut files and emery cloths to repair
damaged or worn electrode surfaces. This normally manifests itself as poor weld quality
since electrodes invariably become misaligned and their working faces irregular in shape, if
mistreated.
Also, there exists a mentality in high volume welding industries that resistance spot
welds, which show visual evidence of metal expulsion during welding, are good welds and
so welding currents are set exceptionally high. Expulsion is the term given to the spraying
of molten metal out from either the faying surface or the point of contact between the
electrode face and the sheet surface (Figure 2). This usually indicates that the welding
current setting is too high and can occur through the action of the electrode force and the
electromagnetic fields generated during welding. The author has noted a predominance of
6
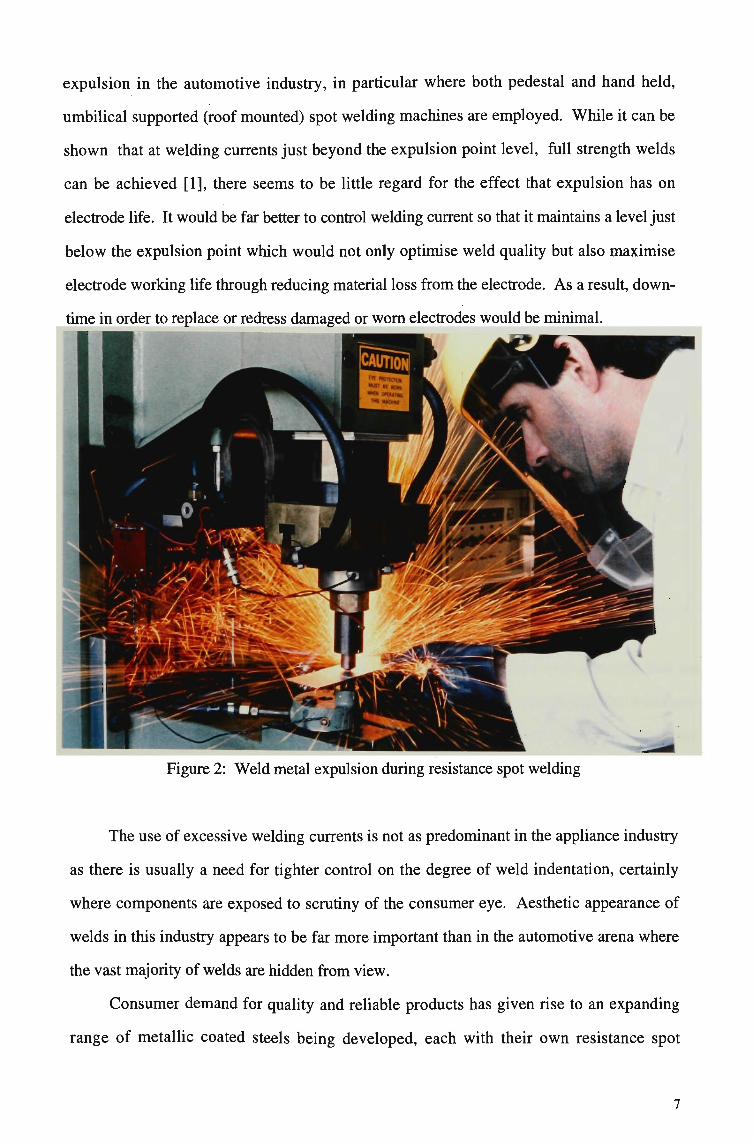
expulsion in the automotive industry, in particular where both pedestal and hand held,
umbilical supported (roof mounted) spot welding machines are employed. While it can be
shown that at welding currents just beyond the expulsion point level, full strength welds
can be achieved [1], there seems to be little regard for the effect that expulsion has on
electrode life. It would be far better to control welding current so that it maintains a level just
below the expulsion point which would not only optimise weld quality but also maximise
electrode working life through reducing material loss from the electrode. As a result, down
time in order to replace or redress damaged or worn electrodes would be minimal.
The use of excessive welding currents is not as predominant in the appliance industry
as there is usually a need for tighter control on the degree of weld indentation, certainly
where components are exposed to scrutiny of the consumer eye. Aesthetic appearance of
welds in this industry appears to be far more important than in the automotive arena where
the vast majority of welds are hidden from view.
Consumer demand for quality and reliable products has given rise to an expanding
range of metallic coated steels being developed, each with their own resistance spot
7

wcldability characteristics. As can be seen from Table I, there is quite a broad range of
coated steel types available in the market-place, presenting the fabricator with even further
problems not normally encountered during spot welding of uncoated steels.
Table 1 — Types of Metallic Coated Steels
Steel Type Coating
Hot Dipped Galvanized
Electrogalvanized
Others
: zinc : zinc-iron : aluminium : zinc-iron + iron-zinc electrogalvanized flash coat
: zinc-55% aluminium : zinc-5% aluminium : lead-tin
: zinc : zinc-iron : zinc-nickel : zinc-nickel + iron-zinc flash coat : zinc-iron + iron-zinc flash coat : zinc-nickel + iron phosphorus flash coat tin chrome zinc-iron + iron-phosphorus flash coat
: electrogalvanized zinc-nickel + organic overlay : metallic/organic film (coil coated spot weldable primers)
It has been recognised by others and also from the authors o w n research, that the
various metallic coated steels can react in different ways to certain welding parameter
changes [2] creating some confusion for the sheet metal fabricator. Only an experienced
operator is capable of selecting optimum welding parameters for a particular steel type.
Studies have shown for example that electrode geometry [2], electrode chemistry [3,4] and
the introduction of weld current ramping techniques into the welding schedule [2,5] can have
dramatic effects on electrode life and while many thousands of spot welds can be produced
on uncoated steels without redressing or replacing the electrodes, as little as 250 welds may
only be possible on some metallic coated steels.
The resistance welding behavioural difference between uncoated and metallic coated
steels is best explained in the following way.
8
As stated previously, in any resistance welding operation (be it spot, projection or
scam welding), the formation of the weld is dependant on the heat generated due to the
electrical resistance of the materials being joined. The total heat generated (H) in joules is
given by the expression:
H = I2Rt (1)
where, / = welding current in amperes
R = sum of the electrical resistances in the system in ohms. This includes
resistances of the electrodes, contact surfaces and metal substrates..
t = time for which current is allowed to flow (seconds or cycles).
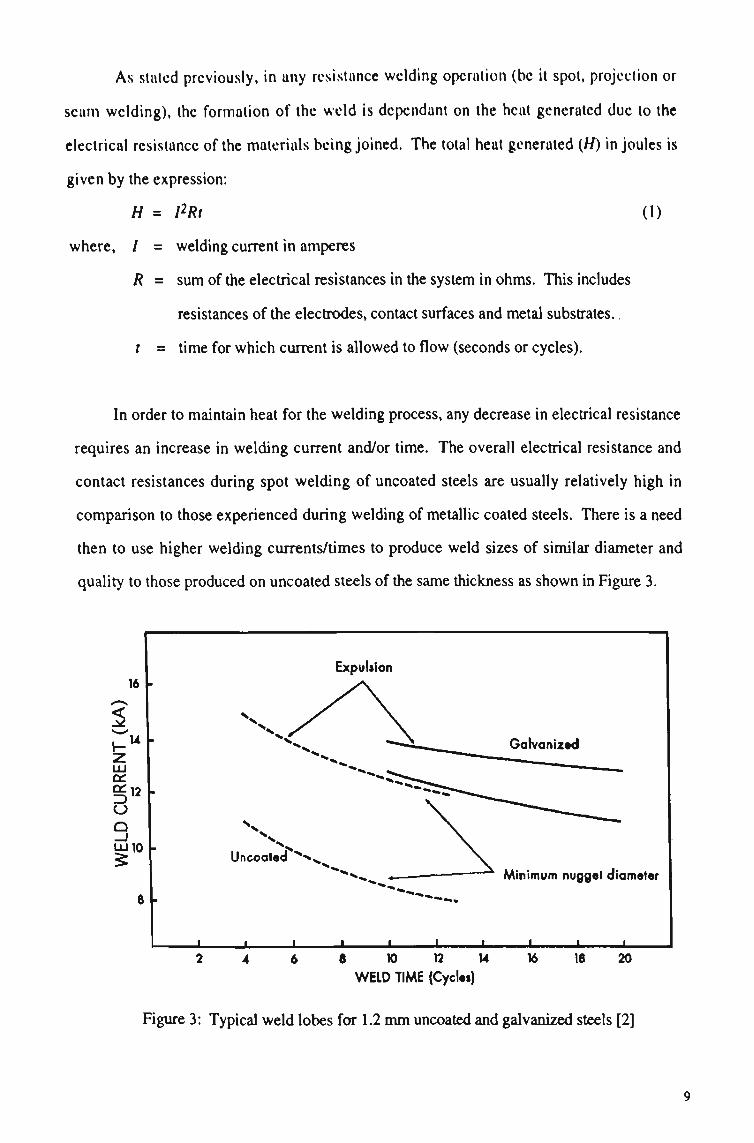
In order to maintain heat for the welding process, any decrease in electrical resistance
requires an increase in welding current and/or time. The overall electrical resistance and
contact resistances during spot welding of uncoated steels are usually relatively high in
comparison to those experienced during welding of metallic coated steels. There is a need
then to use higher welding currents/times to produce weld sizes of similar diameter and
quality to those produced on uncoated steels of the same thickness as shown in Figure 3.
16
UJ
cn
U
UJIO
Expulsion
Uncoated "^^
Minimum nugget diameter
J I I L J L
2 4 6 8 10 12 14 16 18 20 WELD TIME (Cycles)
Figure 3: Typical weld lobes for 1.2 m m uncoated and galvanized steels [2]
9

The heat generated at the electrode-sheet interface provides the driving force for
alloying to occur between the metallic coating of the sheet and the copper electrodes. This
alloying behaviour has two effects on weldability. Firstly, there is a tendency for alloy to
build up around the periphery of the electrode tip. This occurs when using either truncated
cone or radiused electrode profiles as shown in Figure 4. Because of this, as welding
progresses, the electrode tip diameter effectively increases leading to a decrease in current
density and subsequent production of smaller and smaller welds of inferior quality. The
radiused electrode would not normally be recommended for spot welding coated steels as
even the smallest amount of alloying rapidly changes the contact area of the electrode. These
are being used however, where part fit-up is a problem, such as where two curved surfaces
meet, and are usually used in conjunction with hand held spot welding guns which are
employed in a number of different orientations in a production line.
Included Angle
Diam.
TRUNCATED RADIUSED
Figure 4: Truncated cone and radiused spot welding electrode tip profiles
Secondly, direct alloying with the electrode face causes erosion or pitting of the face,
thus constantly changing the contact area between the electrode and the sheet surface. It has
been shown by the author that the wear rate of electrodes can be directly related to the
composition of the metallic coating [6]. While employing Resistance Welder Manufacturers
Association ( R W M A ) Class 2 (Cu-0.8% C r ) truncated cone electrodes to weld metallic
coated steels high in coating aluminium, the erosion rate is rapid. However, the erosion rate
is less rapid during welding of metallic coated products which are rich in iron. Alloy layers
10

built up on electrodes used to weld the latter product, tend to be more resistant to
delamination from the electrode surface. O n the other hand, pockets of aluminium in high
concentrations in built up alloy layers can be easily stripped away from the electrode surface
when it is pulled away from the sheet. This is attributed to the brittleness and relatively high
hardness of these pockets. As the erosion process continues, the electrode working face
becomes larger in diameter. Without periodically increasing the welding current to
counteract the associated drop in current density, weld quality will naturally deteriorate and
size will decrease.
Monitoring of spot weld quality in the past, meant laborious, time consuming and
often very costly destructive testing of welds, most of which have tests proved to be
unreliable indicators of welding performance. Weld nugget diameter, measured via vernier
callipers after peel or hammer and chisel tests are performed on selected welds, is generally
accepted as the most appropriate way of examining weld quality [7]. The peel test relies on
peeling a weld apart and determining the nugget size (sometimes referred to as a plug) which
is pulled from one side of the joint, as shown in Figure 5. Nugget sizes must be no less
than (in most cases) 8 0 % of the original electrode tip diameter employed in order to be
considered satisfactory welds. Thin gauge steel sheet however, during peel tests usually
pull with a tail remaining on the nugget as shown in Figure 5. This makes accurate
measurement of nugget size difficult since the callipers cannot easily reach the edge of the
nugget. Even if a weld under testing has not reached the minimum size requirement,
isolating the parameter at fault can be quite difficult. The hammer and chisel test relies on
driving a chisel between two close welds as shown in Figure 6. The welds are considered to
be of good quality if nuggets do not pull out of the sheet under the action of the chisel.
Many still use these quality checking procedures, but there has been an ongoing search
for more cost effective and more stringent quality control procedures in recent times. A s a
result, there has been an upsurge in the development of resistance welding monitoring and
control devices. These, fundamentally provide routine checking of the basic welding
parameters and condition of the welding equipment and can also adjust selected process
input parameters including welding current, through feedback control loops. With the aid of
ll

these devices, electrode life can be optimised and weld quality assured after suitable welding
conditions have been established.
Figure 5: Peel test for determining weld nugget diameter and penetration [62]
Figure 6: The hammer and chisel test [8]
12
2.2 Monitoring and Control Devices
The literature offers a number of definitions for weld process monitoring all of which
relate to acceptable weld quality control. Dickinson [8] defines the monitoring process as
"one which gives information about the quality of the product". Beatson [9] states that "any
simple monitor or correction system must look at some phenomenon or characteristic which
occurs or changes as a result of the start and growth of a weld and whose output bears a
definite relationship to the weld diameter, this usually being taken as a production criterion
of weld quality".
A control or correction system can be defined as a unit which monitors one or more
critical parameters during the weld cycle in an attempt to maintain weld quality under varying
external conditions by automatically processing these parameters and using the output to
automatically adjust the welding conditions.
Available resistance welding monitors do not solve welding problems, they simply
highlight them by providing a track record of every spot weld made. It is then up to the
operator to recognize any anomalies present and in the absence of any control devices,
manually adjust the process accordingly.
The characteristics of the ideal monitor and the exact parameter which gives the best
indication of weld quality, has been debated by many, however, most systems display the
magnitude of the monitored parameter on some form of analogue or digital measurement.
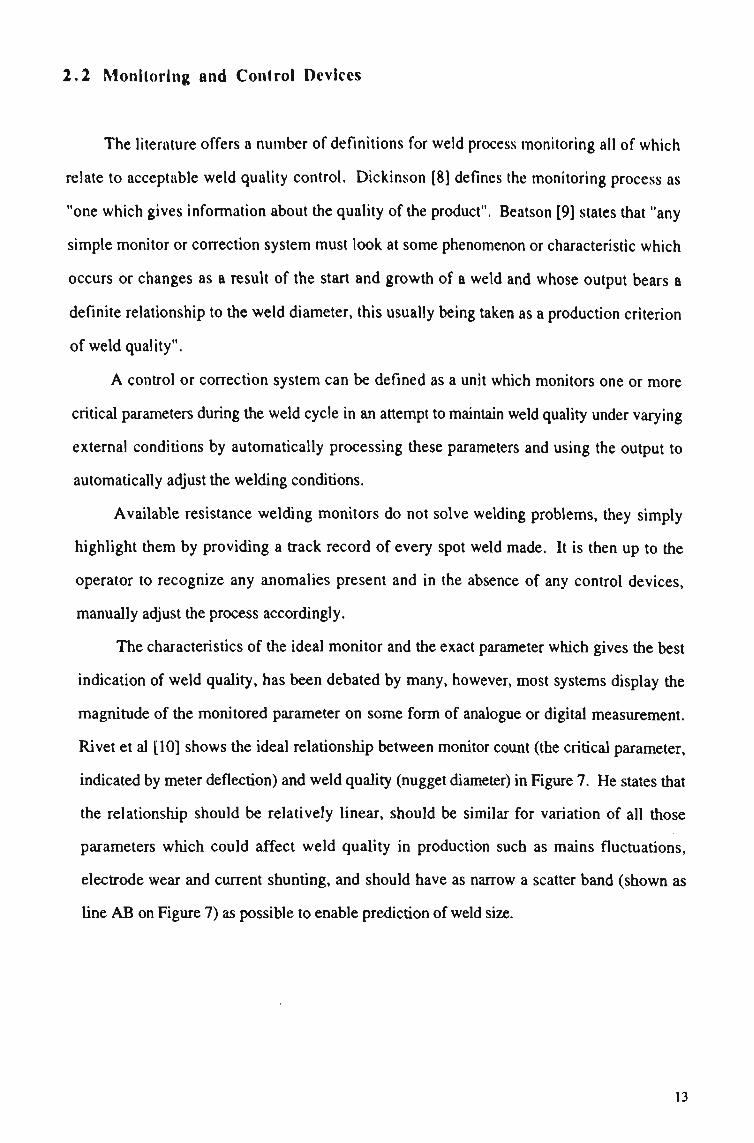
Rivet et al [10] shows the ideal relationship between monitor count (the critical parameter,
indicated by meter deflection) and weld quality (nugget diameter) in Figure 7. H e states that
the relationship should be relatively linear, should be similar for variation of all those
parameters which could affect weld quality in production such as mains fluctuations,
electrode wear and current shunting, and should have as narrow a scatter band (shown as
line A B on Figure 7) as possible to enable prediction of weld size.
13

(J oc
I Z O
N U G G E T D I A M E T E R
Figure 7: Typical relationship between monitor count and nugget diameter [10]
The literature also indicates a number of process parameters which have been used in
monitoring of the spot welding process, most of which can be used in a closed loop
feedback control system [8]. They all provide a non-destructive means for assessing weld
quality and either totally eliminate, or at least reduce, the need for destructive testing of
welds. These parameters include:
a) electrical parameters
b) nugget temperature
c) infra-red radiography
d) weld expansion and contraction
e) acoustic emissions and
0 ultrasonic signals (reflection, attenuation and velocity).
Each technique is discussed below.
14

2.3 Electrical Parameters — General
Monitoring and control of electrical parameters has received the greatest amount of
attention and the devices manufactured for this purpose have been considered the most
successful [11], This is mainly attributed to the ease of attachment to the welding machine
of such devices to measure current, voltage and time. N o sophisticated sensing equipment is
required to examine these parameters. There are however, some reported disadvantages,
these being: a) their general confinement to uncoated mild steels, since there have been poor
correlations between weld size and voltage on metallic coated or uncoated materials, b)
degradation of electrodes can cause misleading results, and c) the vulnerability of voltage
clips due to their need to be in close proximity to the weld zone.
2.3.1 Welding current
AC spot welding machine controls do not have facilities to control the current directly.
The machine can only control the amplitude and shape of the voltage produced at the
secondary transformer [12]. This voltage applied across the transformer's total secondary
impedance (comprising of resistance and inductance) including the machine throat and
workpiece, causes the current to flow. Therefore, the welding machine controls the current
indirectly by the transformers secondary impedance.
Current can be adjusted on most spot welders through a primary tapping switch which
adjusts the current level by changing the ratio of primary to secondary turns. Another
current control is the "phase shift" or "heat" setting dial. The heat value (or raw value) of the
current can be altered through this control.
Because the transformer of spot welding machines is connected directly to the power
line by the control circuits, current and therefore weld quality can be affected by voltage
fluctuations. Without suitable monitoring equipment, this cannot be detected.
Welding current can also be affected through "current upslope" and "downslope"
controls which are available on more modern spot welding machines. These can be used to
15

alter the phase shift automatically from some small value of current to the preset phase shift
value over a nominated period of time (upslope). In summary, welding current is affected
by line voltage fluctuations, phase shift, transformer tapping and slope controls.
Appleby [13] states that the accurate measurement of rms value of weld current is one
of the most difficult welding parameters to measure, but at the same time it is one of the most
important in determining weld quality and reliability.
The literature details two procedures for measurement of spot welding current, through
the use of a toroidal coil [13] or through Hall-effect probes [14].
The toroidal coil placed around the primary or secondary of the spot welding machine
is the more commonly used method. This measures voltages induced by the changing
magnetic fields surrounding the weld current carrying conductors of the welder and is only
useful for measuring A C currents. The voltage signal can be electronically integrated to
provide an indirect measurement of the welding current as indicated by Faraday's Law:
V = dl/dt A cos 6 (2)
where, V is the measured voltage, dl/dt is the change in current with respect to time, A is the
area of the toroidal loop and 9 is the angle of the loop to the magnetic field. The output is
displayed as a peak current on a meter calibrated in rms units. A portable, battery operated
electronic weld current meter has been developed by British Federal Works [14]. Studies
have shown, however, that with this method, current values can change with position and
orientation of the toroid. Errors as large as 5 % have been noted [14]. A similar machine is
also available from Hirst Electronic Industries Limited [15].
The Hall-effect probe is recognised as an accurate but expensive technique for
measuring current. This technique measures the voltage across a semiconductor due to
surrounding magnetic fields. It is therefore an indirect method for measuring welding
current. Equation (2) also applies to the Hall-effect probe but the value of A is different.
The technique is also sensitive to changes in orientation and position of the probe.
16

2.3.2 Voltage
Voltage measurements can be used to measure weld quality. These can be obtained by
attaching voltage probes to either top or bottom surfaces of the materials being welded or to
both spot welding electrodes (upper and lower). Voltage traces as shown in Figure 8 can be
obtained [8]. M a x i m u m voltage has been related to the growth of the spot weld nugget in
plain carbon steels [16,17] and ultimately, nugget tensile shear strength (tensile strength
increases with maximum voltage). Similarly, nugget diameter can be related directly to the
voltage drop at expulsion point, occurring after the peak voltage [18]. This system is
reported to be reliable only when welding mild steel, stainless steel, titanium and fully iron-
alloyed galvanized steels, normally referred to as galvanneal. Figure 9 shows the typical
relationship between voltage drop and nugget diameter.
Figure 8: Schematic of dynamic electrical parameters during spot welding of mild steel [8]
17

REDUCTION IN ELECTRODE VOLTAGE, V%
Figure 9: The relationship between weld diameter and voltage drop during resistance spot welding [8]
O interface failure • nugget pull-out • expulsion
The system is not suited for monitoring spot welding when using free zinc coated (hot-
dipped galvanized) steels [18,19] and aluminium [18], since there is no drop in voltage up to
the expulsion point for these materials. The voltage drop system could be employed to
obtain full size, expulsion welds in free zinc coated steels, but there is the disadvantage of
accelerated electrode wear due to the fact that electrode sticking to the sheet surface is more
prominent at the higher current levels required to produce the weld expulsion condition.
Dickinson [3] has also reported that a relationship can be found between nugget
diameter and heat input into the weld (area under the voltage-time curve shown in Figure 8).
This relationship depicted schematically in Figure 10 can be used to pin-point a weld
termination point, ie welding can be stopped prior to the nugget reaching the minimum
nugget diameter. Ganbowski et al [20] have suggested that this method could be used
during spot welding of metallic coated steels.

NUGGET DIAMETER
Figure 10: The relationship between nugget diameter and the area under the voltage curve produced during resistance spot welding [8]
2.3.3 Time
Welding time in Equation (1) is simply controlled by the number of cycles of 50 Hz
(Australia) or 60 H z current allowed to flow through the materials being welded.
2.3.4 Resistance
There are a number of variables controlling resistance heating in spot welding. The
conductivity of the material, surface condition of the material, material thickness and
electrode condition and diameter are the most important. Bourtorwick [21] points out that
electrode force, electrode alignment with respect to each other or with respect to the
workpiece itself, and poorly made electrical connections can also change resistance and
therefore affect weld quality.
The total resistance of the workpiece is governed by the material, electrical
conductivity and thickness, and also the resistance at the contact surfaces between the
electrode and sheet and the faying surfaces. The electrode diameter determines the area
through which the current flows and hence the resistance that the workpiece presents.
19
W h e n the electrodes are brought into contact with the workpiece and current is applied,
there is an initial high contact resistance at the electrode/sheet interface. This is attributed to
the presence of high spots on the electrode and/or sheet surface. High power (PR) is
generated at these points and they are brought rapidly to a temperature at which they can
collapse. The process continues, with the electrodes then, bedding into the sheet surface and
spreading the heat more evenly over the surfaces of the sheet. If either electrode, or sheet
surface, is badly contaminated or oxidized, initial surface contact resistance will be abnormal
and this will affect the bedding in process and subsequent weld quality.
2.3.5 Monitors for welding voltage and current
The Welding Institute (TWI) in UK has developed a simple control unit for measuring
and controlling voltage during resistance spot welding [22]. The voltage signal is received
from two sensing leads attached to the arms of the welding machine and is fed through a
filter to minimise induction and noise pick-up. The signal is then passed on to a voltage
drop comparator so that when the voltage drop across the electrode decreases from the
minimum level by an amount greater than the preset level, the welding current is terminated.
Special controls have been inbuilt so that sudden drops in mains voltage do not prematurely
cease the welding current. A weld timer also functioning in parallel with the control system
ensures that welding can be terminated after a preset time if the voltage control does not
operate. The system is said to be suitable for both pedestal and portable gun welding
machines.
Johnson [23] states that several monitor and automatic correction systems have been
commercially available for resistance, spot, seam and projection welding but the most
c o m m o n in use are those which control current and voltage automatically. Automatic voltage
regulators can also be employed to compensate for mains voltage fluctuations as is automatic
current regulators for cases where impedance in the throat of the welding machine changes
during welding. One U K manufacturer (not identified) has built a unit that has combined
voltage and current regulators which can automatically adjust phase-shift. M a x i m u m
20
response time for voltage or current control to within 5 % of the final value is stated as 3
cycles (60 Hz).
Johnson [23] also mentions that some commercially available monitors work on the
system of indicating weld quality by integrating either the voltage drop above a minimum
threshold value across the welding electrodes during welding, or the welding current.
Accept and reject levels are established firstly through welding trials and performing peel
tests to determine nugget diameter. The output of the monitor is displayed on a meter which
operates accept or reject indications.
The Digimetrics NDT-700 direct A C / D C weld monitor developed in the United States
of America [24] is a state of the art micro-processor based system for non-destructive testing
of resistance spot welds. This unit detects changes in material composition, electrode wear
or pressure, current, resistance and weld cycles. Only two pick-up cables are required, one
for voltage (connected across the electrode holder) and one for current (a current coil placed
around one of the welding cables). The operator needs to conduct some welding trials in
order to determine the materials optimum welding schedule ie. minimum and maximum
current levels, then the monitor is adjusted to set "peak amps", "amp seconds" and "volt
seconds". A poor weld is indicated by an activated L E D and this suggests that the unit
provides only monitoring and not feedback control.
A number of similar machines have also been developed as a result of co-operation
between The Welding Institute and the A R O Machinery Company Limited (UK) under the
"Spotrite" trade name [25,26]. These give both visual and audio alarms when welds are
outside quality control preset limits.
Variations in voltage and current among other changing parameters are also accounted
for with the British Federal, Weldmatic M P 1 6 P unit, incorporating microprocessor
technology [27].
21
2.3.6 Resistance measurement and monitoring of dynamic resistance
Resistivity can be used to detect poor weld quality. The output from resistance
measurement, usually digital, is considered easy to interpret and the instrumentation easy to
apply. Resistivity is computed by injecting a current into the weld area, measuring the
resulting voltage drop and converting that drop to a resistivity reading. It has also been
shown that increasing weld shear strength can be directly related to a decrease in resistivity
in the weld fusion zone [28].
The only problem noted with this test is that cold welds may be detected as good
welds. This can be overcome by impacting the weld prior to testing in order to break the
weld and thus cause the resistivity measurement to be high.
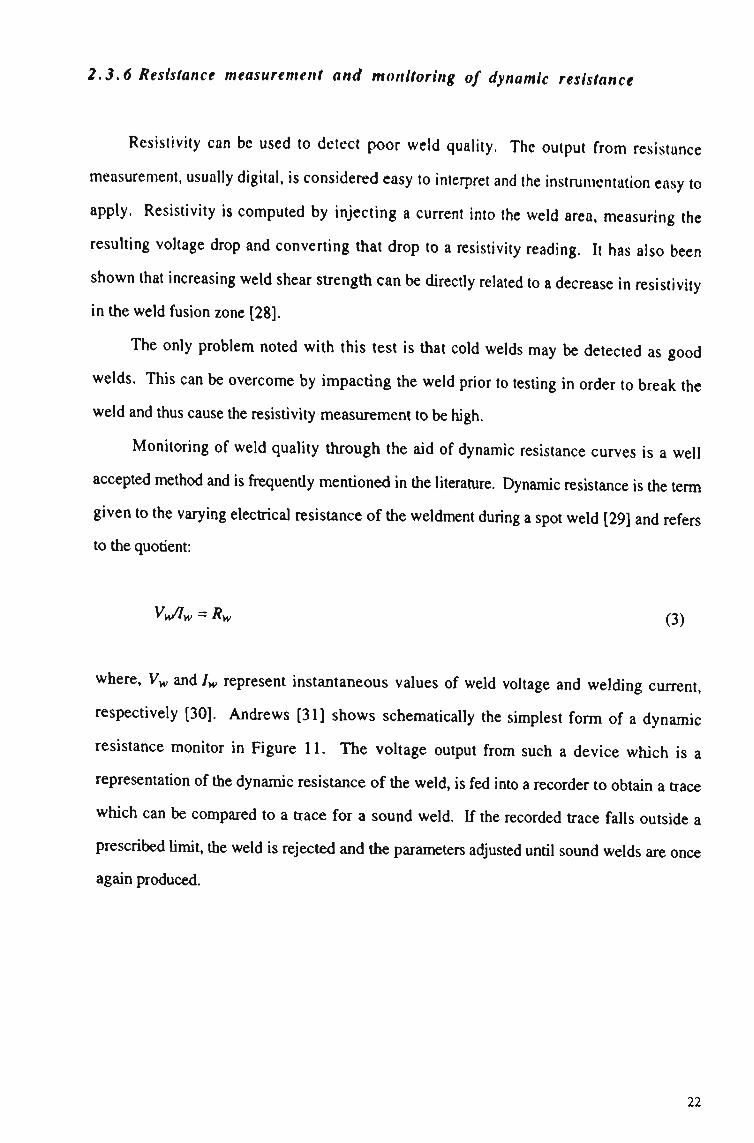
Monitoring of weld quality through the aid of dynamic resistance curves is a well
accepted method and is frequently mentioned in the literature. Dynamic resistance is the term
given to the varying electrical resistance of the weldment during a spot weld [29] and refers
to the quotient:
Vw/Iw = Rw Q)
where, Vw and Iw represent instantaneous values of weld voltage and welding current,
respectively [30]. Andrews [31] shows schematically the simplest form of a dynamic
resistance monitor in Figure 11. The voltage output from such a device which is a
representation of the dynamic resistance of the weld, is fed into a recorder to obtain a trace
which can be compared to a trace for a sound weld. If the recorded trace falls outside a
prescribed limit, the weld is rejected and the parameters adjusted until sound welds are once
again produced.
22

Weld Amps
Rectification Amplifier
oCM>C>C>1 Isolation IntegratlonVarlable Torold Gain
Divider
"Smp3
Low Pass Filter
Tip Volts
)—uy Isolation Variable Gain Rectifier
Figure 11: Andrews' model of the simplest form of a dynamic resistance monitor [31]
Many dynamic resistance curves or traces for different materials are shown throughout
the literature, but they are all basically of the configuration shown in Figure 12, which is
said to be "typical" of a single pulse weld on an uncoated mild steel [32]. A brief description
of the various curves and their stages follows.
Figure 12: A typical dynamic resistance curve for a single pulse resistance spot weld on an uncoated mild steel [32]
23

Stage 1
Resistance is high due to the surface roughness of the electrodes and material being
welded. The resistance is lowered rapidly as the electrodes bed in to the sheet surface and
the contact area increases. The resistance reaches a minimum when the contact is greatest.
This is shown by the valley in Figure 12.
Stage 2
As resistivity increases through heating of the workpieces, the resistance curve rises to
a peak. At the peak, the faying surface is nearing the molten state.
Stage 3
O n reaching the peak of the curve, the electrodes move into the sheet surface and the
current path becomes shortened. The weld nugget begins to grow such that the path over
which the current flows is also broader. Subsequently, the resistance curve falls off. If
expulsion has taken place, then the resistance curve falls off quite sharply and this can be
easily recognised.
T o control weld quality, the operator can either stop the welding procedure when a
particular drop in resistance is seen relative to the resistance at the peak of the curve
(uncoated steels), or stopping at a time beyond the valley and the peak of the curve. The
latter method is more commonly employed with galvanized steels.
There is no information in the literature to suggest that this method is being used in a
closed loop feedback control mode during spot welding, but it is being utilised widely as a
quality monitoring system.
2.4 Nugget Temperature
During the growth of a spot weld nugget, the surrounding sheet metal is heated.
Various methods have been employed to relate the temperature of the heated surfaces to the
temperature at the centre of the nugget, thus providing an indication of whether or not full
24

growth has occurred. Thermocouple attachment to either the sheet surface in close proximity
to the weld [33], or to one of the electrodes, were the earliest methods used. Data was
usually presented as a graph of temperature versus time.
These techniques were not acceptable to production since considerable time was
necessary to install the thermocouple correctly. Additionally, electrode temperature is
dependent upon the current level and welding time, each of which cause variations in
electrode temperature gradients. This could make control of spot weld quality difficult.
2.5 Infra-Red Radiography
Measurement of sheet surface temperature radiation to indicate weld quality has also
been considered for many years. Continuous monitoring of the intensity of infra-red
radiation emitted from the sheet surface immediately adjacent to the electrode has
theoretically been related to the weld nugget size and the tensile shear strength [9]. The
advantages of this technique over the thermocouple attachment method are twofold. Firstly,
there is no need for the detectors to be in direct contact with the heat source. Some detectors
can be mounted permanently to the sides of a welding machine, well out of the operators
way. Secondly, the response time of a suitable detector element can be very short and the
process time presents no limitations.
Infra-red emission from the sheet surface can be sensed through either a fibre optic
cable [9,32] mounted in the welding electrode and transmitting radiation to an external
detector as shown in Figure 13, or through infra-red detectors focused at spots on the sheet
surface immediately adjacent to the electrode [9,10]. Sensing through the fibre optic method
is considered impractical for most applications because of the interference to electrode
construction and because electrode wear may produce misleading results. The second
method is deemed more appropriate. Researchers have employed both one and two detector
units positioned at a 45 degree angle to the surface of the work [34]. W h e n two detectors
are used, these are placed on opposing sides of one of the electrodes as shown in Figure 14.
While this method is more practical, the positioning of delicate sensors in close proximity to
25

the weld zone could make it difficult to use, particularly when many different types of
components of various shapes need to be welded.
Material
Electrode
LIGHT GUIDE
Figure 13: Positioning of an infra-red emission detector shown as a fibre optic cable 'light guide' for monitoring of spot weld quality. The upper electrode is not shown [9].
yv /.' / "~\ .\< z- LIGHT PIPE LIGHT PIPE SILICONE FILTER
PHOTOCELL
Figure 14: The positioning of dual infra-red emission detectors outside of the welding electrodes and at 45* to the surface of the workpiece [8]
26
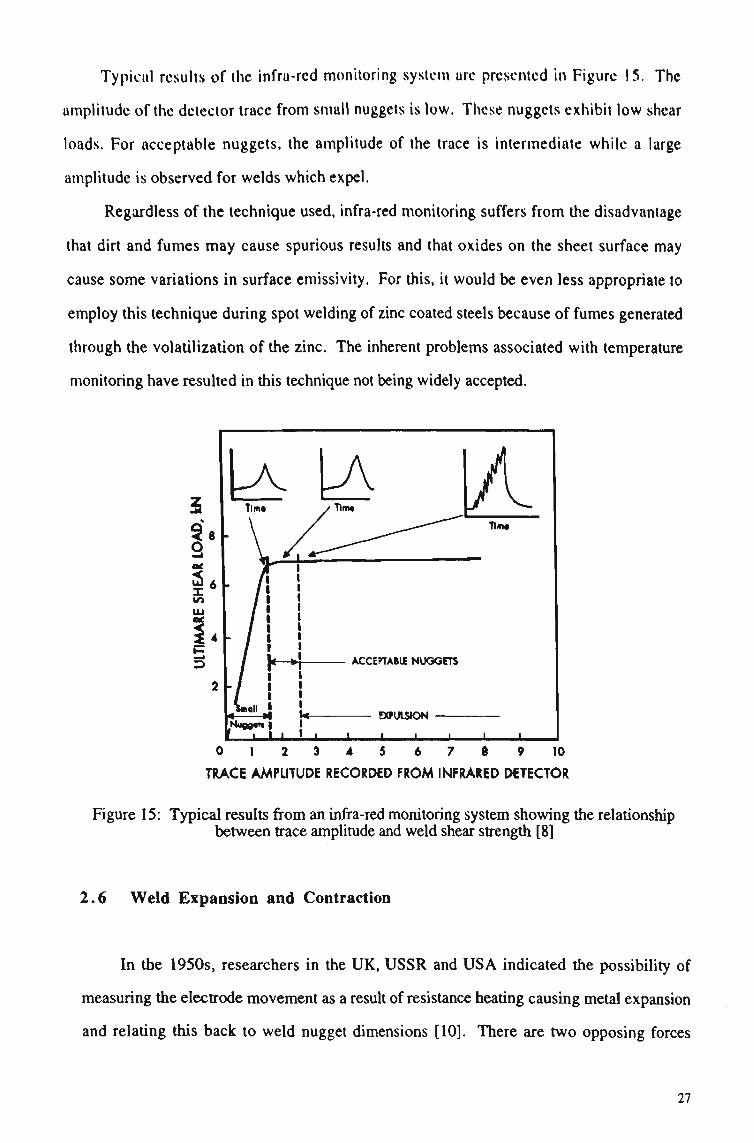
Typical results of the infra-red monitoring system arc presented in Figure 15. The
amplitude of the detector trace from small nuggets is low. These nuggets exhibit low shear
loads. For acceptable nuggets, the amplitude of the trace is intermediate while a large
amplitude is observed for welds which expel.
Regardless of the technique used, infra-red monitoring suffers from the disadvantage
that dirt and fumes may cause spurious results and that oxides on the sheet surface may
cause some variations in surface emissivity. For this, it would be even less appropriate to
employ this technique during spot welding of zinc coated steels because of fumes generated
through the volatilization of the zinc. The inherent problems associated with temperature
monitoring have resulted in this technique not being widely accepted.
IK \A
0 1 2 3 4 5 6 7 8 9 10
TRACE AMPLITUDE RECORDED FROM INFRARED DETECTOR
Figure 15: Typical results from an infra-red monitoring system showing the relationship between trace amplitude and weld shear strength [8]
2.6 W e l d Expansion and Contraction
In the 1950s, researchers in the U K , U S S R and U S A indicated the possibility of
measuring the electrode movement as a result of resistance heating causing metal expansion
and relating this back to weld nugget dimensions [10]. There are two opposing forces
27
during spot welding. Firstly, there is the natural inward movement of the electrodes due to
the applied force from the welding machine and the fact that as the material becomes molten,
the electrodes are more free to move towards each other. Opposing this movement is the
force generated on the electrodes through thermal expansion of the weld and surrounding
material [35]. The degree of separation of the electrodes can be related to the volume of
molten metal and can therefore be used as an indication of nugget growth. Electrode
separation is monitored by measuring the piston rod travel of the air cylinder in the welding
machine via displacement transducers.
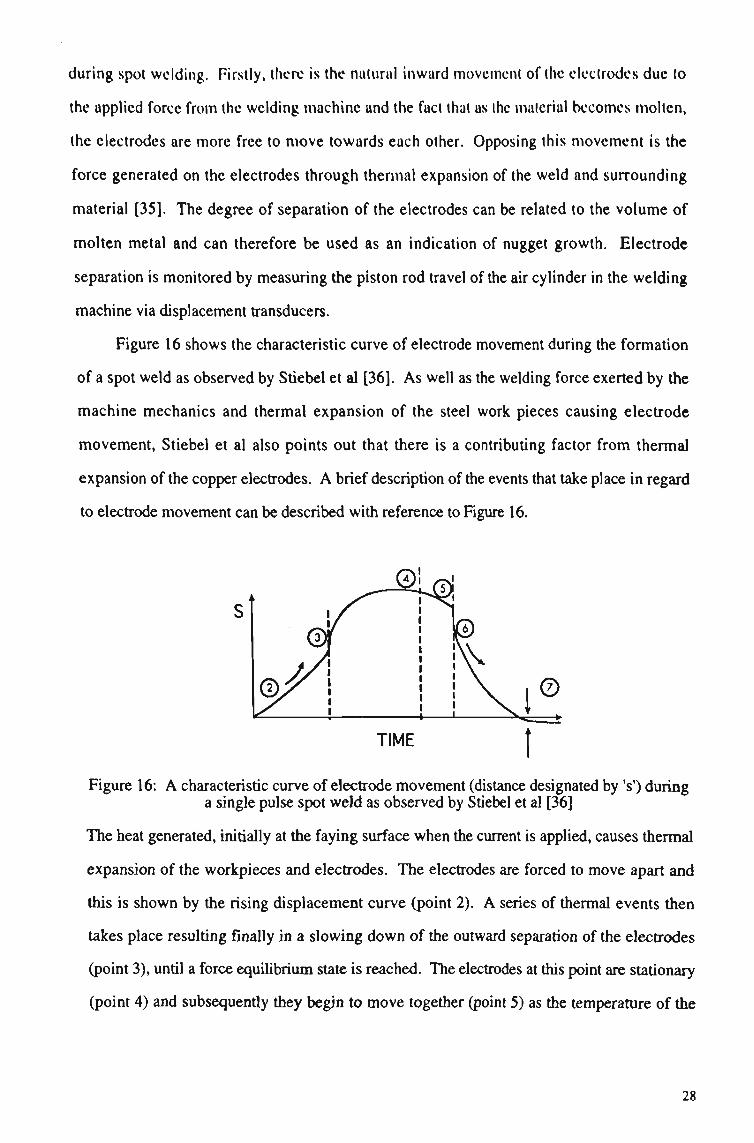
Figure 16 shows the characteristic curve of electrode movement during the formation
of a spot weld as observed by Stiebel et al [36]. As well as the welding force exerted by the
machine mechanics and thermal expansion of the steel work pieces causing electrode
movement, Stiebel et al also points out that there is a contributing factor from thermal
expansion of the copper electrodes. A brief description of the events that take place in regard
to electrode movement can be described with reference to Figure 16.
Figure 16: A characteristic curve of electrode movement (distance designated by's') during a single pulse spot weld as observed by Stiebel et al [36]
The heat generated, initially at the faying surface when the current is applied, causes thermal
expansion of the workpieces and electrodes. The electrodes are forced to move apart and
this is shown by the rising displacement curve (point 2). A series of thermal events then
takes place resulting finally in a slowing down of the outward separation of the electrodes
(point 3), until a force equilibrium state is reached. The electrodes at this point are stationary
(point 4) and subsequently they begin to move together (point 5) as the temperature of the
28

fusion zone increases. O n terminating the welding current, the fusion zone cools and
therefore contracts with the electrodes following this movement under the action of the
welding force (point 6). The final separation of the electrodes is less than the initial
separation because of the indentation into the sheet surfaces. Stiebel et al concluded from
this type of analysis on a large number of spot welds, that good quality welds are assured if
the electrodes move into the sheet surfaces after the point of force equilibrium.
Johnson [23] has suggested that a good weld will expand at an optimum rate and to an
optimum level. Weld current control can then be adjusted to track these optimum levels.
Welds made with high heat input are associated with rapid expansion and weld expulsion
causing rapid electrode closing. Welds made with too low a heat input have slow expansion
and do not attain full electrode separation. Johnson et al [37] have based a monitoring
device on this principle. Monitoring and control devices based on thermal expansion
systems have also been established by Janota [38,39] and Taylor et al [40]. From these
works it is evident that there are some drawbacks with the use of thermal expansion as a
weld quality monitoring device. The method can normally only be used in conjunction with
pedestal (free-standing) welders which are quite rigid and which have low friction cylinders.
It is not adaptable to gun welding machines and is not suitable on welds close to edges
where part fit-up is a problem. In this case, excessive weld expulsion could take place
resulting in misleading signals in the load control systems.
2.7 Acoustic Emission
Acoustic emission is said to arise from the transient elastic energy that is
spontaneously released when materials undergo deformation, fracture, or both [35]. There
are a number of stages in the formation of a spot weld during which acoustic signals are
emitted all of which can be detected by a piezo electric transducer mounted to the electrode
holders of the welding machine. Signals detected include those from initial electrode contact
and at electrode separation, expansion, recrystallization, solid state transformations, plastic
deformation, melting, vaporization, solidification, and on occasions, weld cracking. A
29

typical acoustic emission trace is shown schematically in Figure 17. Because the amplitude
is highest at the expulsion point, it has been possible to determine the weld at the onset of
expulsion through feedback current control. Expulsion represents the point of m a x i m u m
nugget growth. Havens [41] points out that electrode mushrooming (plastic deformation of
the tip face) is reduced through this method because electrode heating is lowered. This
would only lead to improved electrode life. The method has been successfully used on both
metallic coated and uncoated materials; however, a major drawback of the procedure lies in
the fact that signal processing can become cumbersome when multiple spot welds are made.
W h e n using this procedure on metallic coated sheet steels, the signal emitted when the zinc
coating boils has been employed to control the welding process [42],
Figure 17: Schematic output data of acoustic emission during resistance spot welding [8]
Acoustic emission adaptive control is finding use in the automotive industry with
General Motors ( G M ) in the United States leading the way [43]. GM's Wilmington
Delaware plant is using an acoustic feedback control unit developed by the Trodyne
Corporation of Teterboro, N e w Jersey to control resistance spot welds on galvanized steel,
valance panels for their Chevette vehicle. The system is being used along with the resistance
drop method described previously to improve the overall weld quality.
30

2.8 Ultrasonic Signals
Ultrasonics is high frequency sound above the range of hearing (20-25 kHz per
second). Monitoring ultrasonic signals emitted during the formation of a weld is another
method in use to examine weld quality. Basically, the weld pool behaviour, comprising of
both melting and solidification, affects the amplitude of the ultrasonic signals emitted from
the weld, ie the ultrasonic sensor placed in the vicinity of the weld pool can act as a
temperature probe. It is possible then to relate indirectly the changes of the ultrasonic signal
to the time of cooling of the weld nugget to some predefined temperature [35].
There are a number of ultrasonic techniques mentioned in the literature for spot weld
monitoring. The most c o m m o n procedure involves mounting a transmitter crystal on the
water cooled opening of one of the spot welding electrodes and placing a receiver on the
other [9]. Ultrasonic signals are then passed through the weld zone as welding takes place.
Nugget growth can be monitored through observation of the change in signal height during
the weld time. British Aerospace in conjunction with the National N D T Centre (AEA), U K ,
has developed a technique based on this principle for monitoring spot weld quality in
titanium steels [44]. Through changing weld pitch (distance between welds), electrode tip
diameter, plate surface condition and plate thickness, correlations between parameter
variations and ultrasonic signals were studied. Ultrasonics easily distinguished nugget size
and electrode tip diameter. It was reported that these correlations can be used as a basis for
producing a feed-back system.
Hain [45] has developed a method which generates short bursts of high energy which
are transmitted via a probe tip through the weld zone. Echoed signals of decreased intensity
reflected off the front and back surfaces of the weld are received by the probe and are
displayed on a cathode ray tube screen as vertical spikes. The thickness of the weld is
indicated by the separation between two successive spikes, as this distance represents the
time for the signal to travel between the front and back weld surfaces.
31

Allen [46] reports that Budd Canada Incorporated have developed a technique known
as the Water Column Pulse-Echo Technique, which has been used in various applications
including thickness measurement, flaw detection, materials differentiation and spot weld
quality testing. The technique is unique in that a contained column of pressurized water is
sustained between the crystal of the transducer mounted within one electrode and the object
being tested rather than the usual method of placing gel, oil or water directly onto the object
surface. The transducer is both the transmitter and receiver with the returned or echoed
signals entering a flaw detector unit. From there the signal is amplified, rectified and sent to
an oscilloscope display. Interpretation of data is similar to that previously described.
Ultrasonic monitoring does have some problems, most of which need to be overcome
before the technique is fully accepted. These include:
i) the need for good surfaces to ensure adequate coupling,
ii) lack of signal resolution from thin material welds,
iii) the need to be able to interpret the oscillographic traces in real-time,
iv) the inability of thin and quite often fragile transducers to cope with the rigours of
high volume production welding and
v) extraneous signals sometimes emitted from zinc surfaces.
2.9 New Monitoring Approaches
The work in this thesis evaluates further non-destructive, weld quality monitoring
techniques not yet examined. These include profilometry (tactile sensing) and machine
vision (remote sensing). The basic approach taken to the study was to collect resistance spot
weld samples during electrode tip life testing on a commonly used metallic coated steel type
and then to establish the relationships existing between weld nugget size, measured through
various means and the diameter of the weld impression made on the sheet surface, measured
via the profilometer and vision system.
32

The objective was to establish the feasibility of utilising the vision system only for on
line weld quality monitoring and if possible, at a later stage incorporate this into a feedback
control loop to maintain quality in almost real-time. The profilometer was used essentially as
a check on measurements obtained through the vision equipment. Profilometry would be far
too slow for consideration as a monitoring system and would not be readily accepted as an
on-line monitoring system.
33

CHAPTER 3.0
EXPERIMENTAL PROCEDURES
AND
PRELIMINARY RESULTS
34

3.0 EXPERIMENTAL PROCEDURES AND PRELIMINARY RESULTS
3.1 Materials Used in This Study
3.1.1 Metallic coated sheet steel
The steel sheet used in this study was BHP Steel — Sheet and Coil Products
Division's Z I N C A N N E A L ® * G 3 N Z F 8 0 of 0.8 m m base thickness. This is a galvanneal
type product processed along the conventional hot-dipped galvanized steel route but the zinc
coating on the strip after emerging from the zinc bath, is kept molten for a short time by a
furnace placed around the strip. This gives the coating on the strip time to completely alloy
with the iron in the substrate. The strip is then cooled in a similar way to normal zinc
spangled finished materials. Unlike the traditional hot-dipped spangle zinc coating, which
generally has a relatively rough surface and can be a problem for producing high quality
paint finishes, the Z I N C A N N E A L surface is considerably smoother and spangle free,
facilitating an excellent surface for paint adhesion and finish.
Due to its iron rich coating, this type of product is generally characterised by excellent
resistance spot weldability and is employed widely in the Australian automotive industry as
inner door and floor panels, wheel housings, firewalls, side sill outers and other areas of
application.
Within the product name, "G" represents a galvanized steel product, "3" designates the
material's level of formability (in this case a high level), "N" a non-ageing grade, "ZF"
represents an alloyed coating of zinc and iron and "80" the total coating mass in grams per
square metre (nominally 40 grams per square metre each side).
The composition and properties of this steel, obtained through submission of samples
to chemical and mechanical test laboratories at B H P Steel — Slab and Plate Products
Division and Sheet and Coil Products Division, are given in Table 2. The product data sheet
for this steel is shown in Appendix 6.
* ZINCANNEAL is a registered trade mark of BHP Steel (JLA) Ply Ltd
35

Tabic 2 — Composition and Propcrtlei of ZINCANNEAL G3N ZF80 Sttcl
Substrate Chemical Contposilion_£%i' C
.07
p
.017
Mn
.17
Si
.010
s
.013
"
Top Surface Bottom Surface
Top Surface Bottom Surface
Test Direction
longitudinal transverse
m
Ni
.022
Cr
.015
Mo
.005
Cu
.012
sol Al
.054
Sn
.006
Nb
.008
Ti
.086
V
.003
total B
.0003
Couting Composition (%) Al
0.16 0 1 6
Pb Fc
0.05 9.33 0.06 9.75
(Zn obtained by difference) Average Coating Mass
(tJmh
43 43
Ca
.0005
Zn
90.46 90.00
N
.0054
O
.0055
Tensile Properties Hardness (HR30T)
42 42
PS (MPa)
159 170
TS (MPa)
322 325
UE (%)
22.9 20.0
TE
39 37
3.1.2 Electrode selection
While various resistance spot welding electrode compositions are employed
throughout the world, eg Cu/Cr, Cu/Zr, Cu/Cr/Zr and AI2O3 dispersion strengthened, the
Resistance Welder Manufacturers Association Class II (Cu/0.8%-1.0%Cr) electrode
composition was used in this study due to its commonality throughout Australian sheet metal
fabrication industries. This alloy is also referred to as J47 alloy, the technical data sheets of
which are shown in Appendix 7 and Appendix 8. Refer only to data on J47 rod.
For a prolonged electrode life, a truncated cone profile was chosen. However, due to
conflicting arguments presented in the literature, it was necessary to examine the effects of
various electrode geometries for resistance spot welding on the Z I N C A N N E A L product.
Optimum conditions were then applied during electrode tip life testing during which specific
data and weld samples were collected for submission to the profilometer and vision systems.
Further to examining the Z I N C A N N E A L product, free zinc coated, hot-dipped galvanized
steel, electrogalvanized steel, zinc-5% aluminium coated (Galfan) and aluminium-45% zinc
coated (sometimes referred to as zinc-55% aluminium coated) steel were also examined.
36

3.2 Preliminary Experimental W o r k
3.2.1 Identification of optimum weld parameters
There has been some argument presented in the literature over the effects of weld
current upsloping, electrode tip diameter and electrode tip angle (to be referred to as included
angle), on the resistance spot weldability of metallic coated steels. It is apparent that certain
claims have been made after trials have been conducted on one material type only and that the
observed effects have been assumed to hold true for other metallic coated steel types. In
order to examine these effects, a short study involving tip life testing was conducted on
another galvanneal product, namely Z I N C A N N E A L G 2 ZF100 of 0.6 m m base thickness,
also a B H P Steel product. The actual composition and properties of this are shown in Table
3, while the product data sheet is shown in Appendix 9. It was possible to use this material
for this trial since trends only were being identified, eg does decreasing the tip included
angle improve electrode life? From the results, some insight into selection of these more
critical parameters for welding galvanneal type steels would be possible and these could be
employed during weld trials on the Z I N C A N N E A L G 3 N ZF80 material, more the subject of
this thesis. Material properties of the hot-dipped galvanized, electrogalvanized, zinc-5%
aluminium coated and aluminium-45% zinc coated steels also of 0.60 m m base thickness are
presented in Tables 4, 5,6 and 7 respectively.
37
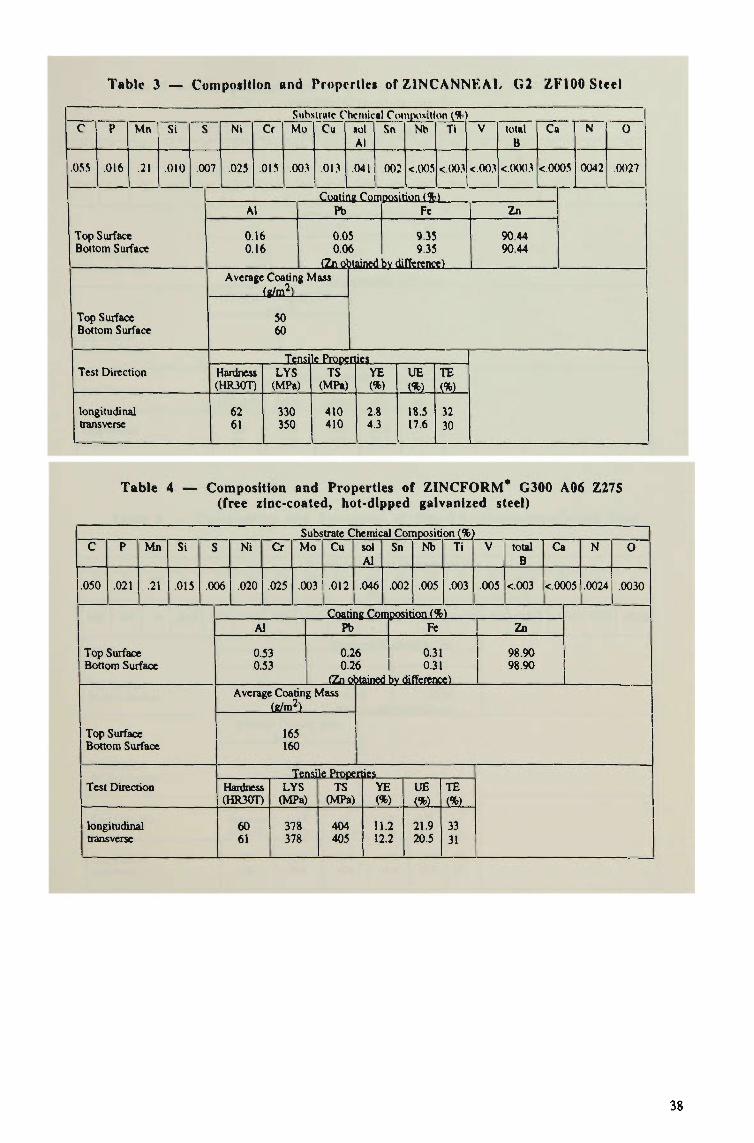
Tabic 3 — Composition and Propcrtlei of Z I N C A N N E A L G 2 ZF100 Steel
Substrate Chemical Composition (*) C
.055
P
.016
Mn
.21
Si
.010
S
.007
Top Surface Bottom Surface
Top Surface Bottom Surface
Test Direction
longitudinal transverse
Nl
.025
Cr
.015
Mo
.003
Cu
.013
sol Al
.041
Sn
oo:
Nb
<.005
Ti
<.003
V
<003
total B
<.0003
Ca
<0005
Coatina ComDosition <%) Al
0.16 0.16
Pb
0.05 0.06
(Zn obtained Average Coating Mass
(f/rnh
50 60
Fe
9.35 9.35
bv difference)
Zn
90.44 90.44
N
0042
O
.0027
Tensile ProDerties Hardness (HR30T)
62 61
LYS (MPa)
330 350
TS (MPa)
410 410
Y E (%)
2.8 4.3
UE
TO
18.5 17.6
TE (%)
32 30
Table 4 — Composition and Properties of Z I N C F O R M (free zinc-coated, hot-dipped galvanized si
* G300 A06 Z275 teel)
Substrate Chemical Composition (%) C
.050
P
.021
Mn
.21
Si
.015
S
.006
Top Surface Bottom Surface
Top Surface Bottom Surface
Test Direction
longitudinal transverse
Ni
.020
Cr
.025
Mo
.003
Cu
.012
sol Al
.046
Sn
.oo:
Nb
.005
Ti
.003
V
.005
total B
<.003
a
<.0005
Coatine Composition (%) Al
0.53 0.53
Pb
0.21 0.2<
fZnot Average Coating Mass
(R/m2)
165 160
TensiltPjoce, Hardness (HR30T)
60 61
LYS (MPa)
378 378
TS (MPa)
404 405
5 5 Most
Fe
0.31 0.31
bv difference)
Zn
98.90 98.90
N
.0024
0
.0030
rues YE (%)
11.2 12.2
UE (%)
21.9 20.5
TE (%)
33 31

Tabic 5 — Composition and Properties of ZINCSKAL* CA3SN-E FZ10 (electrogalvanized steel)
Substrate Chemical Composition (%) C
.070
P
.016
Mn
.23
Si
.015
S
.015
Top Surface Bottom Surface
Top Surface Bottom Surface
Test Direction
longitudinal transverse
Ni
.017
Cr
.013
Mo
.004
Cu
.014
sol Al
.038
Sn
.002
Nb
.005
Tl
.003
Coatina Composition (%) Al
<0.01 <0.01
Pb
<0.0l <0.01
(Zn obtained Average Coating Mass
(a/m2)
5 6
Fe
0.23 0.28
bv difference)
V
<.003
total B
<.0003
Ca
<0005
N
.0019
O
.0034
Tensile Properties Hardness (HR30T)
48 43
PS (MPa)
195 190
TS (MPa)
340 335
UE (%)
22.8 22.7
TE (%)
39 39
Table 6 — Composition and Properties of Zinc-5% Aluminium-Coated Steel (Galfan)
Substrate Chemical Composition (%) C
.050
P
.010
Mn
.31
Si
.015
S
.010
Top Surface Bottom Surface
Top Surface Bottom Surface
Test Direction
longitudinal transverse
Ni
.014
a
.026
Mo
.007
Cu
.019
sol Al
.062
CoatinE Cor Al
5.9 5.9
Fe
0.1 0.1
fZnot Average Coating Mass
(g/m2)
147 128
Tensile Prooe Hardness (HR30T)
55 56
LYS (MPa)
355 389
TS (MPa)
399 406
i tained
Sn
.OW
Nb
<.005
Ti
<.002
nposition (%) Zn
93.92 93.92
bv difference)
V
<.002
total B
<.0003
Ca
<.0005
N
.0045
O
.0039
rties YE (%)
6.3 14.4
UE
TO
19.9 18.8
TE
TO
32 33
* ZINCFORM, ZINCSEAL and ZINCALUME are registered trade marks of BHP Steel (JLA) Pty Ltd
39

Table 7 — Composition and Properties of ZINCAI.UME G300 AZI50 (aluminium-45% ilnc-coatcd s(ccl)
Substrate Chemical Composition (%) C
.055
P
Oil
Mn
.23
Si
.015
S
.014
1
Top Surface Bottom Surface
Top Surface Bottom Surface
Test Direction
longitudinal transverse
Ni
.026
Cr
.022
Mo
.004
I
Cu
.021
sol Al
.054
Sn
.003
Nb
.007
Ti
.003
V
<O02
total B
<0003
Ca
<.O0O5
Coating Composition {%) Al
52.8 52.8
Fe Si
1.37 0.47 1.37 0.47
(Zn obtained by difference) Average Coating Mass
(a/m2)
75 75
Tensile Prope Hardness (HR30T)
59 58
LYS (MPa)
358 391
TS (MPa)
415 415
Zn
45.30 45.30
N
,0025
O
.0027
rties YE (%)
5.1 12.3
UE
TO
17.8 18.1
TE
TO
27 27
Background information on the effect of current upslope
Upslope control is the gradual increase of the weld current magnitude during the
initial period of current flow in each weld as shown schematically in Figure 18. The rate of
current change during this initial period and the time interval involved are readily adjustable
on control panels of spot welders equipped with upsloping facilities. This technique assists
in melting and displacing the metallic coating, thus enabling the spot welding electrodes to
gradually seat before the m a x i m u m welding current is reached. This is believed to minimise
the heating between the electrode and workpiece thereby retarding alloying diffusion rates,
which are heat dependent, between the metallic coating and the copper in the electrodes.
Williams [47] and Freytag [48] have concluded, from laboratory studies on hot-dipped
galvanized steel, that there was no advantage in using the current upsloping technique. They
argue that zinc coated steel possesses a natural inbuilt upslope condition resulting from the
longer time to form a weld nugget because of the need to remove zinc from the weld zone.
The addition of current upslope would only result in inefficient heating and the necessity for
much longer weld times.
40

UJ
oc DC O
WELD CURRENT
TEMPER CURRENT,
UPSLOPE DOWNSLOPE
SQUEEZE TIME WELD TIME OFF TIME (QUENCH)
\mm -A*/ —1^ f — t—[^ I tm\m « fj* *—»
T E M P E R H O L D TIME
Figure 18: Schematic of current input into a resistance spot weld [8]
Similarly, tests conducted by Schueler [49] on hot-dipped galvanized steel have
indicated that current upsloping would not improve electrode life since he observed that the
electrode to electrode resistance is lower during the early part of the weld heating period.
This would indicate that higher current is required before zinc can be removed from the weld
faying surface through volatilization. In contrast to this, Gedeon et al [50] showed that,
when using truncated cone electrodes, upsloping (and downsloping) widen the weld lobes
of hot-dipped galvanized steels which have a free zinc layer. Johnson [51] also observed
that upsloping is beneficial during spot welding of galvanized plain carbon steel sheet in that,
not only tip life is extended, but welds also became more consistent. There is no
information in the literature on the effect of current upslope on the resistance spot weldability
of Zn-Fe alloy, metallic coated steels such as Z I N C A N N E A L .
Background information on the effect of electrode tip diameter
Selection of the electrode tip diameter (refer to Figure 4) depends upon the weld size
desired and the resulting strength of the weld, on the sheet thickness and in many cases
41

design of the component. In the latter case, tip diameters (and shape) may be constrained to
fit with minimum component flange widths for example.
Gould [52] demonstrated that when resistance spot welding hot-dipped galvanized
steel, increasing the electrode tip diameter results in a decrease in electrode tip life. O n the
other hand, Nealon and Lake [53] have demonstrated that an increase in tip diameter extends
the life of electrodes used to weld zinc-55% aluminium coated steel. It is possible then that
the various steel types react in different ways to changes in tip diameter. The usual electrode
tip diameter selection criteria for truncated cone profiled electrodes is based on 5/t where t is
the thickness of a single sheet to be welded. Again, there is no literature information on the
effects of tip diameter when resistance spot welding Zn-Fe alloy coated steels.
Background information on the effect of electrode tip angle
The truncated cone electrode is generally accepted as the optimum configuration for
spot welding zinc coated steels. In the past, a 120 degree included angle (refer to Figure 4)
has been used on electrodes for spot weldability studies at BHP's Research and Technology
Centre, while a majority of U S A research establishments and auto manufacturers employ an
included angle of 90 degrees for spot welding zinc coated steels up to approximately
1.50 m m single sheet thickness.
Bowers and Eager [54] conducted a study to determine the effect of non-uniform
current distribution across the electrode face as a factor influencing electrode wear. The
study of various electrode geometries revealed specific trends between the current density
profile at the electrode face and the shape of the electrode. The effect of geometry on current
distribution was determined through computer modelling, which was employed to produce a
voltage m a p of each electrode shape as shown in Figure 19. From the voltage map, the
current density profile at the electrode face was calculated. The ratio of the current density
at the electrode shoulder (face edge or periphery) to the density at the face centre was found
to decrease with increasing included angle as shown in Figure 20. As the current density
distribution approaches unity, electrode erosion/wear became more evenly
42

distributed across the face, thus promoting longer electrode life. These results suggest that
the 90 degree included angle tip should outperform the 120 degree included angle tip. O n
the other hand, in Europe, the general belief is that the 120 degree included angle improves
tip cooling by dispersing heat over a larger electrode area and therefore improved electrode
life [55].
Greenwood [56] and Nied [57] have also modelled the temperature distribution during
the spot welding process and have recognised that most of the current that enters the weld
does so near the shoulder of the electrode, thus causing a current concentration at that point.
Greenwood's model of temperature generated in spot welding only takes into account
electrode geometry. Nied however, has taken into account the deformation of the sheet
when electrode pressure is applied and noted that current localization may be due, at least
partially, to higher pressures at the electrode shoulder. Nied also noted that heat production
is a function of current density and because this could be highest at the periphery of the
electrode, it can be assumed that alloy growth/wear is greatest at this region.
a.76
a.sa
B.2S
e ee
8 00 8.18 8.28 8.38
Scale in inches
L 9 C •
0
r\ 9 0>
•
-3
O H H < QC
4
3
2
1
—
1
A
A A
' 1 9 38
A A
A
' 1 ' 1 60 88
Electrode Included Angle
Figure 19: Finite element analysis used to Figure 20: The ratio of current density (J) measure voltage points within a truncated cone at electrode face edge (or shoulder) to electrode profile (half-section shown) [54] current density at face centre in a truncated
cone electrode profile [54]
43

3.2.2 Electrode life testing procedure
In order to assess the effects of including current upslope in the welding schedule and
changing the electrode tip diameter and included angle, the materials were subjected to
electrode tip life testing. Although there are many minor variations on the way in which
electrode tip life testing is performed, this type of test is recognised world-wide as a
resistance spot weldability, qualification test.
A n electrode life test identifies the point at which spot welding electrodes fail to
produce a weld nugget of acceptable size during continuous welding at preset conditions and
without any change to welding current in order to compensate for growth in tip diameter
through wear or alloy build-up. The procedure adopted for electrode tip life testing in this
study was as follows:
i) Strips from the test material were sheared to 40 mm wide, transverse to the rolling
direction of the material. In this case, the sheets provided for this work were 1 m
wide, thus the test strips were 40 m m wide by 1 m long;
ii) Electrodes were machined with the specified tip diameter (designated by sheet
thickness) and included angle. Machining of electrodes used in this work was
carried out on a bench lathe with diameters being machined to an accuracy of
±0.05 m m ;
iii) A pair of electrodes were placed in the upper and lower electrode holders of the
welding machine, bedded into place by applying air to the upper cylinder of the
machine, and bringing the electrode faces together under a small force. Electrodes
were then checked for accurate alignment of the tip faces.
iv) Alignment was achieved by closing the electrodes down onto a sheet of carbon
paper inserted between two sheets of blank paper. This was done without the
44

application of welding current. The diameter of the imprint left on the blank paper
from the carbon paper was then measured in two directions with a graduated
eyepiece for eccentricity. The eyepiece used in this work was a Peak eyegauge,
graduated to 0.05 m m and with a 7 x magnification;
v) Two strips were placed between the spot welding electrodes as shown in Figure 21
and after setting a weld counter to zero, setting "electrode squeeze time", "weld
time" and "off time" on the welder control unit, the first weld was made 20 m m
away from one end of the strips. This avoided any strip edge effects such as
excessive edge build-up of metallic coating, a c o m m o n occurrence in the
processing of metallic coated steel sheet. Welds were then made down the
centreline of the strips with a separation of approximately 10 m m . The last 20 m m
of the strips were also avoided;
vi) During the initial few welds, welding current was gradually increased until a weld
expulsion point was reached. The welding current was then turned back to a point
just below this expulsion point level for the next weld. The remainder of the
electrode tip life test was then conducted at this level;
vii) Periodically, a spot weld was removed from the strips by shearing the strips either
side of the weld. These welds were then subjected to a peel test by gripping the
sample in a vice and prying the weld apart to reveal the weld nugget;
viii) The weld nugget was measured in two directions 90 degrees apart across the
nugget diameter with vernier callipers and the average diameter was recorded. This
process was then continued periodically until a point was reached at which the
average weld nugget size reached a diameter equal to 8 0 % of the original electrode
tip diameter employed in the test. At this point, the effective electrode tip life was
said to be over. A minimum of three electrode tip life test runs were performed
45
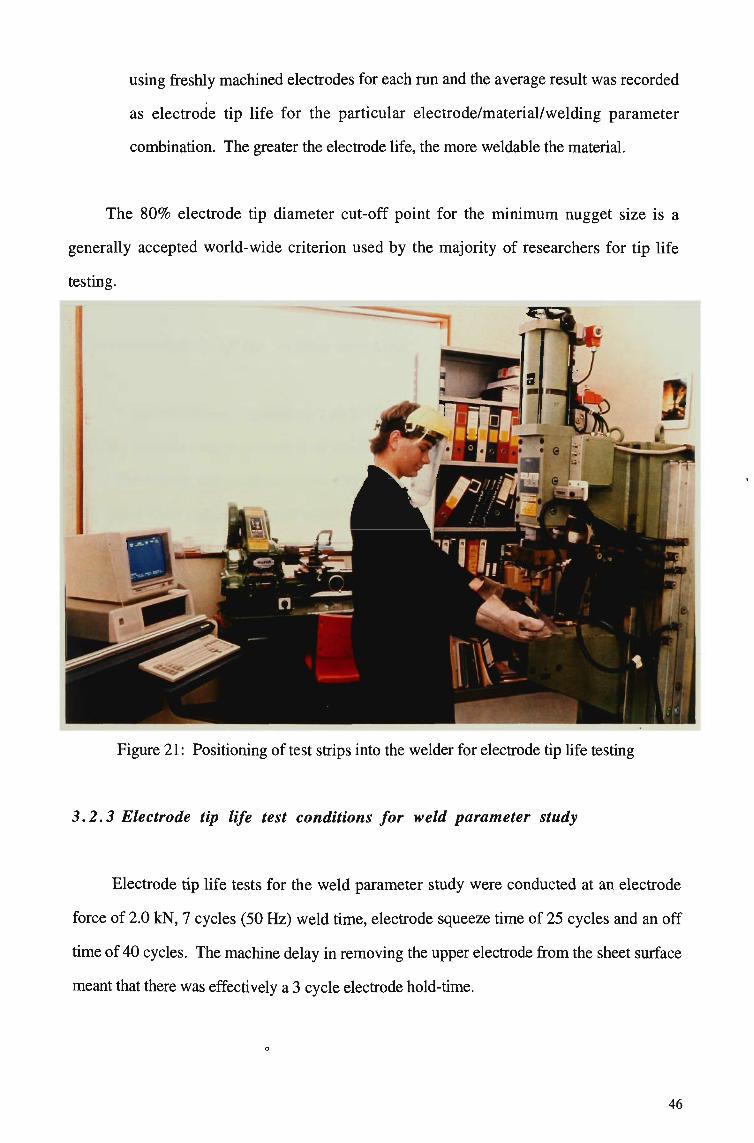
using freshly machined electrodes for each run and the average result was recorded
as electrode tip life for the particular electrode/material/welding parameter
combination. The greater the electrode life, the more weldable the material.
The 8 0 % electrode tip diameter cut-off point for the minimum nugget size is a
generally accepted world-wide criterion used by the majority of researchers for tip life
testing.
Figure 21: Positioning of test strips into the welder for electrode tip life testing
3.2.3 Electrode tip life test conditions for weld parameter study
Electrode tip life tests for the weld parameter study were conducted at an electrode
force of 2.0 kN, 7 cycles (50 Hz) weld time, electrode squeeze time of 25 cycles and an off
time of 40 cycles. The machine delay in removing the upper electrode from the sheet surface
meant that there was effectively a 3 cycle electrode hold-time.
o
46

Truncated cone electrode configurations of 120 and 90 degree included angles were
tested at tip diameters of 5 m m , 5 m m plus a 4 cycle current upslope in the welding schedule
and 7 m m . The 4 cycle current upslope period was arbitrarily chosen as a time suitable for
use in high volume production welding and is in line with that used by Lynch and Goodwin
[58] in looking at the effects of current upslope on the weldability of zinc-5% aluminium
coated steel. Welding time and force were selected from in-house welding schedules
developed for hot-dipped zinc-coated steel sheet.
3.2.4 Description of the welding machine
A microcomputer controlled, 120 kVA, Schlatter Selecta, pedestal, resistance spot
welding machine, was employed in all welding experimental work.
The welder was connected to an I B M X T computer equipped with a Data Translation
DT2801-D data acquisition board which is capable of monitoring the weld tip force, welding
voltage and welding current throughout each weld of the tip life tests. The tip force signal
was generated by a piezo-electric transducer, the tip voltage was obtained directly from a set
of contacts fixed to the welder electrode holders, and the current signal was developed
across a known low resistance in series with the workpiece.
The software for the computer is written in Microsoft compiled B A S I C [59]. This
system provides menu driven facilities for monitoring, displaying, archiving and producing
hard copies of graphical or tabulated data. A block schematic of the welder and ancillary
equipment is provided in Appendix 10. A general view of the equipment including welder
and control unit, computer facility and lathe for machining of electrodes is shown in
Figure 22.
47

Figure 22: General view of resistance spot welding facility including data acquisition system and lathe for machining electrodes
3.2.5 Electrode tip life test results — weld parameter study
Table 8 shows actual tip life test results while average results from Table 8 are
represented graphically in Figures 23 and 24.
48

Table ti
1
Tip Angle Test No.
5 m m tip
7 m m lip
5 m m tip plus upslope
Tip Angle Test No.
5 m m tip
7 m m tip
5 m m tip plus upslope
Tip Angle Test No.
5 m m tip
7 m m tip
5 m m tip plus upslope
— Electrode Tip Life Test Results — Weld Parameter Study
ZINCANNEAL
120' 1 2
6131 4902 Ave 568(
2003| 2313 Ave 208
7327
1 7985 ve766
I
3
6008 )
1932
7692 7
90* 1 2
4795 5213 Ave 536*
3
6096 1
2197 3190 2553 Ave 2646
8231
1 7902 7848 ve7993
I
Hot-Dipped Gulvtmizcd 120'
1 2
550 575 Ave 56"
3
575 !
690 650 550 Ave 630
700 620 Av62]
550
90* 1 2 3
520 700 700 Ave 640
860 810 600 Ave 757
700 675 630 Ave 668
Electrogalvanized 120*
1
6093 A
5524 /
2
4849 .ve 533
5821 w e 58:
1
3
5055 2
Nor
6114 >0
1
90* 1
3498 A
esult
3385 /
2
3982 ive 35C
3628
jve 35:
3
3042 7
3572
f Aluminium-45% Zinc
120' 1
230
1050
225
2
270 Ave 2.
975 Ave 91
275 Ave 2
1
3
250 >0
920 52
240 47
1
90* 1
340
1380 4
325
2
360 Ave y.
1000 \vel3
345 Ave 3
1
3
280 »7
1570 17
270 13
1
Zinc-5% Aluminium 120'
1
310
650
551
2 3
280 345 Ave 312
710 800 Ave 720
675 1 700 Ave 642
1 1
90* 1
350
1050
450
2 3
300 310 Ave 320
840 1010 Ave 967
610 567 Ave 542
! 1

FIGURE 23. AVERAGE TIP LIFE TEST RESULTS
KEY: A:6mm TIP, B:7mm TIP, C: 6mm TIP plus UP8L0PE
ELECTROGALVANIZED ZINCANNEAL
E>3 120% 0O°tlp K * 3 i20°tip ^ » o %
NO RESULT
B C TIP CONDITION TIP CONDITION
AI-45%Zn COATED Zn-5%AI
E 2 120°tlp ^ wftlp K * 3 120°tlp M «(AiP
Ul IL Ul Q O
I a ui
1400
1200
1000
800
600
400
200
UJ
o o o a Ul
1400
1200
1000
800
600
400
200
B C TIP CONDITION
B C TIP CONDITION
50
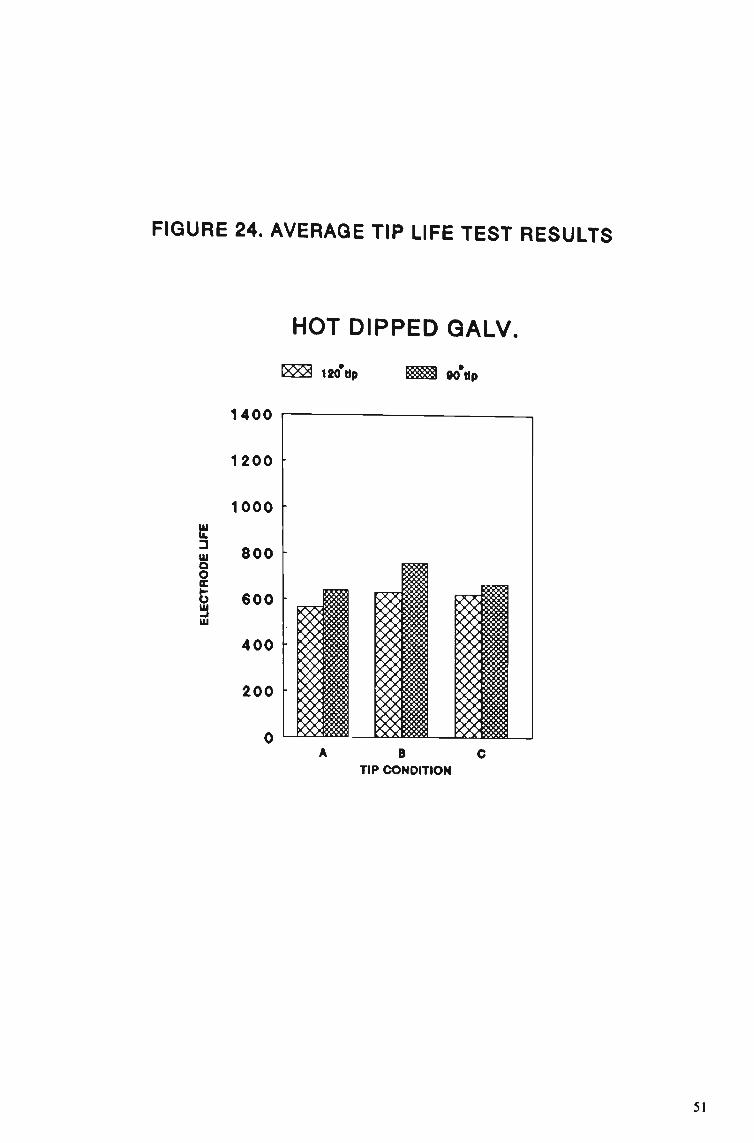
FIGURE 24. AVERAGE TIP LIFE TEST RESULTS
HOT DIPPED GALV.
&S3 120% WrJp
ui
a o E
d Ul
1400
1200
1000
800
600
400
200
A B C TIP CONDITION
51

Electrode tip diameter
Increasing the tip diameter from 5 m m to 7 m m proved difficult with the
electrogalvanized steel when all other parameters were fixed. Weld sizes were well below
the minimum level of 8 0 % of the electrode tip diameter even at the start of the life test and at
a current level just below the expulsion point. A number of attempts were made with 7 m m
diameter fresh electrodes and in each case poor weld sizes were developed. Irregular
expulsion from the sheet outer surfaces was thought to be the major cause for this
inconsistency. It could be that the small zinc coating mass of approximately 5 g/m2 either
side is quite sensitive to even small electrode misalignment. That is, if the electrode is not in
firm contact with the strip surface over the full 7 m m tip diameter, then the electrogalvanized
coating is easily expelled. Energy expended in doing this would mean less energy was
available for weld nugget development at the faying surface.
Due to this effect, no results were obtained for electrogalvanized steel at 7 m m tip
diameter. A result may be obtained if electrode force is increased to 2.5-3.0 k N to assist the
electrode bedding in process. A result may also be obtained if electrode tip diameter is
decreased to 6 m m while leaving the electrode force at the original setting of 2.0 kN.
However, these suggestions could be the subject of future work.
Increasing the tip diameter from 5 m m to 7 m m when welding Z I N C A N N E A L
resulted in a fairly substantial decrease in electrode life (approximately 2500 welds)
regardless of electrode tip included angle. Surface expulsion was not observed during
welding of mis material at 7 m m tip diameter as was observed with the electrogalvanized
steel. It is thought that even if small electrode misalignment had taken place, the heavier
coating mass of Z I N C A N N E A L (100 g/m2 total) would be more difficult to volatilize and
remove prior to the electrode bedding in to the sheet surface. The majority of energy is
therefore transferred quickly to the faying surface for nugget development.
Both the 120 degree and 90 degree included angle tips produced approximately a
4-fold increase in tip life with the increase in tip diameter during welding of the aluminium-
4 5 % zinc coated steel. The zinc-5% aluminium coated steel reacted similarly to the
52

aluminium-45% zinc coated steel producing a 2.5-fold and 3-fold increase respectively for
the 120 degree and 90 degree electrode tips. The results indicate that even low levels of
aluminium in the coating can rapidly degrade the electrode face. It is envisaged that an
electrode degradation mechanism, similar to that found for the aluminium-45% zinc coated
steel [6] also applies to electrodes used to weld the zinc-5% aluminium coated steel. That is,
the aluminium-rich areas in the outermost alloy layer formed on the electrode are hard and
brittle and are quite easily stripped away from the surface, thus leaving voids.
There was little improvement in electrode life for increased tip diameter when welding
the hot-dipped galvanized steel. This is in direct contrast to the results obtained by Gould
[52].
Electrode tip angle
Reducing the electrode tip included angle from 120 degree to 90 degree had a marked
effect in reducing the life of electrodes to weld the electrogalvanized steel. This reduction
occurred for both conditions of 5 m m tip diameter with and without the introduction of
current upslope. In contrast, there was little variation in results obtained between the two
included tip angles over the various conditions examined for welding of Z I N C A N N E A L ,
and there was some improvement in electrode life with decrease in included tip angle during
welding of the aluminium-45% zinc coated, zinc-5% aluminium coated and hot-dipped
galvanized qualities. The only exception to this was a decrease in tip life when welding the
zinc-5% aluminium coated steel with a 5 m m electrode and incorporating the current upslope
period. This result, however, may be attributed to local variations in surface characteristics
on the product used in this study. In general, the theories put forward by Bowers and Eager
[54] hold true for only some metallic coated steel types.
53
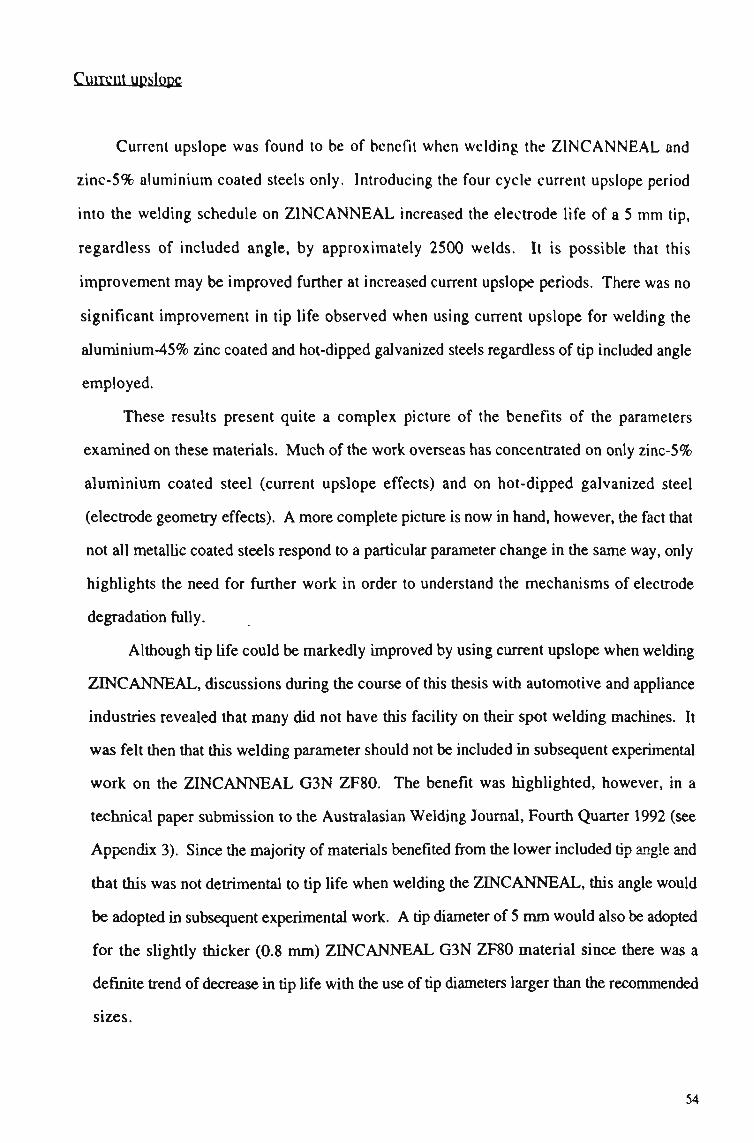
Current upslope
Current upslope was found to be of benefit when welding the ZINCANNEAL and
zinc-5% aluminium coated steels only. Introducing the four cycle current upslope period
into the welding schedule on Z I N C A N N E A L increased the electrode life of a 5 m m tip,
regardless of included angle, by approximately 2500 welds. It is possible that this
improvement may be improved further at increased current upslope periods. There was no
significant improvement in tip life observed when using current upslope for welding the
aluminium-45% zinc coated and hot-dipped galvanized steels regardless of tip included angle
employed.
These results present quite a complex picture of the benefits of the parameters
examined on these materials. M u c h of the work overseas has concentrated on only zinc-5%
aluminium coated steel (current upslope effects) and on hot-dipped galvanized steel
(electrode geometry effects). A more complete picture is now in hand, however, the fact that
not all metallic coated steels respond to a particular parameter change in the same way, only
highlights the need for further work in order to understand the mechanisms of electrode
degradation fully.
Although tip life could be markedly improved by using current upslope when welding
Z I N C A N N E A L , discussions during the course of this thesis with automotive and appliance
industries revealed that many did not have this facility on their spot welding machines. It
was felt then that this welding parameter should not be included in subsequent experimental
work on the Z I N C A N N E A L G 3 N ZF80. The benefit was highlighted, however, in a
technical paper submission to the Australasian Welding Journal, Fourth Quarter 1992 (see
Appendix 3). Since the majority of materials benefited from the lower included tip angle and
that this was not detrimental to tip life when welding the Z I N C A N N E A L , this angle would
be adopted in subsequent experimental work. A tip diameter of 5 m m would also be adopted
for the slightly thicker (0.8 m m ) Z I N C A N N E A L G 3 N ZF80 material since there was a
definite trend of decrease in tip life with the use of tip diameters larger than the recommended
sizes.
54

3.3 Description of Profilometer and Vision Sensing Equipment
3.3.1 Profilometer
The profilometer employed in this study was a Rank Taylor Hobson Form Talysurf
120 machine. The profilometry technique relies on dragging a fine tipped stylus across the
surface to be measured, in this case the indented weld surface after removal from the welder,
as shown in Figure 25, to map the surface profile of the specimen. Correlation of the
vertical and horizontal movements of the stylus provides a direct record of the surface profile
limited in resolution primarily by the geometry of the stylus tip dimensions [60].
Figure 25: Profilometer pick-up arm and stylus drawn across indented resistance spot weld surface
The components of the profilometer system are indicated in Figure 26 and a brief description
of each follows.
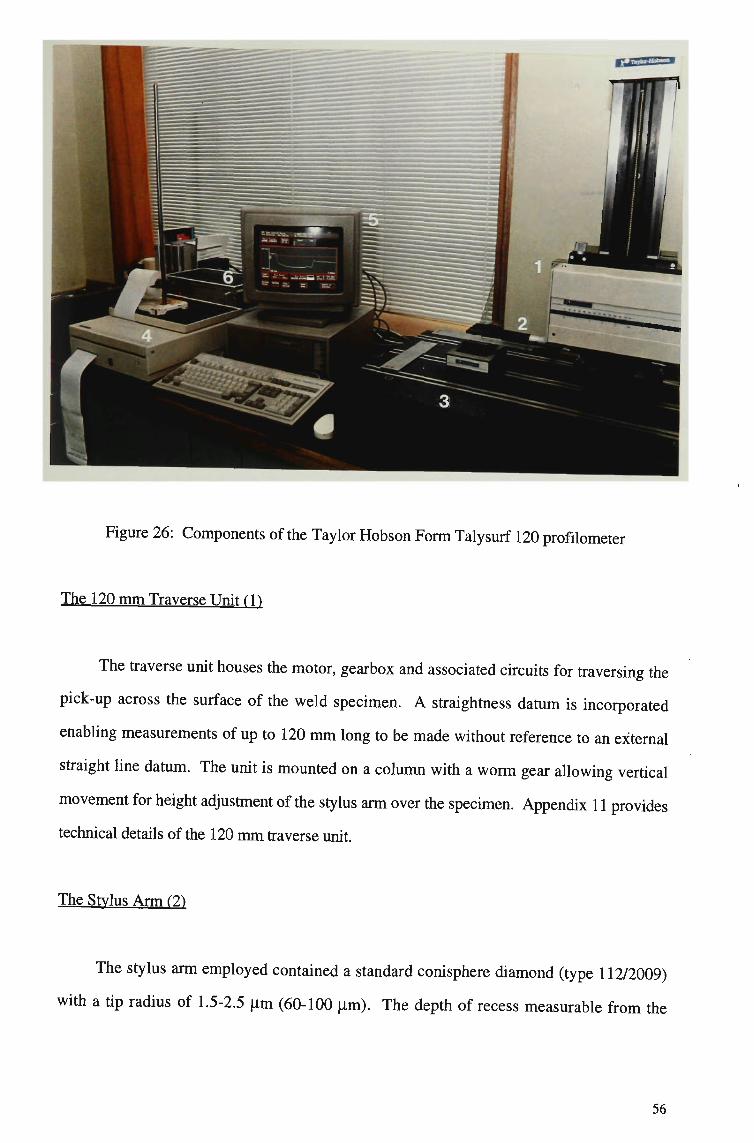
Figure 26: Components of the Taylor Hobson Form Talysurf 120 profilometer
The 120 mm Traverse Unit (\ 1
The traverse unit houses the motor, gearbox and associated circuits for traversing the
pick-up across the surface of the weld specimen. A straightness datum is incorporated
enabling measurements of up to 120 m m long to be made without reference to an external
straight line datum. The unit is mounted on a column with a worm gear allowing vertical
movement for height adjustment of the stylus arm over the specimen. Appendix 11 provides
technical details of the 120 m m traverse unit.
The Stylus Arm m
The stylus arm employed contained a standard conisphere diamond (type 112/2009)
with a tip radius of 1.5-2.5 jam (60-100 um). The depth of recess measurable from the
56

stylus is 0.76 m m (0.03 in). This adequately covers any impression depth left during the
adopted spot welding technique.
Epoxv Granite Base (3)
The base is an epoxy granite construction on anti-vibration mounts. This provides a
firm support for the column and the test specimen.
The Electronic Interface Module (4)
The electronic interface module forms the link between the measuring system and the
host computer, providing data link and interfacing circuits for the system and the power
supply to the traverse unit. The module also includes a thermal sensitive printing facility for
producing hard copies of the specimen surface profile.
The Computer (5)
The computer performs the control and calculation functions. This is an Olivetti M300
P C with high resolution V G A graphics (full colour). The software is mouse driven. The
computer contains a single 1.4 M B 3.5 in floppy disk drive and a 60 M B hard disk.
Motor Controller (6)
The motor controller is a Taylor Hobson CD4 controller. This provides the interface
between the computer and motor operation for the traverse unit.
57
3.3.2 Vision sensing
W h e n used with robots, vision systems can recognise and locate objects which are
randomly placed in a work area. The robot can then pick them up for further processing. In
addition to this facility of providing robotic guidance, vision systems can be utilised to
measure component positioning and dimensions [61]. It is the latter feature that is of interest
in resistance spot welding monitoring and control, lf a vision system placed in close
proximity to a resistance spot welding machine can measure the diameter of a weld
impression left on the workpiece surface and relate this dimension to the actual weld nugget
size, then it is possible to utilise vision sensing for on-line monitoring and weld quality
control. In this set-up, if a weld impression is sensed to be wider than a preset value, then it
will be recognised that the electrode working face is worn to the level at which current
density is insufficient to produce weld nuggets above the minimum diameter requirement.
The microprocessors can then be employed to adjust the welding current level automatically
in order to continue welding at optimised conditions.
In order to assess this vision sensing concept, an A D E P T VISION A G S (advanced
grayscale system) was employed to monitor welds taken during electrode tip life testing.
The system essentially comprises of a camera (Pulmic C C D , TM-540) mounted on a
tripod directly over the weld sample, a monitor (NEC/Multi Sync 30) and a controller or
central processing unit. A schematic of the system is shown in Figure 27.
The Adept Vision A G S uses a solid-state camera with a rectangular C C D (charged
couple device) sensor array. The output of the camera is a standard RS-170 video signal: 60
frames/second, with 2:1 interlace. The vision system grabs a single camera frame of data (in
1/30* second), digitizes it into greyscale and edge or binary images, and then processes the
image accordingly.
58

VISION SENSING (REMOTE SENSING)
LIGHT SOURCE
WELD SAMPLE
Figure 27: Schematic of vision system experimental set-up
In binary mode, the system extracts boundaries from the camera image by a process
called thresholding, into black regions and white regions. Thresholding is the process of
considering all shades of grey darker than a specified level to be black and all lighter shades
of grey to be white. In the greyscale system, 'edges' are processed. A n edge is a region
where the brightness is changing very rapidly (in this case the edges of the weld
impression). These edges are extracted from the camera image by computing a cross-
gradient (or Sobel) edge operator in each 3 pixel high x 3 pixel wide portion of the image.
The vision system applies the edge operator at all the pixel locations in the image and then
thresholds the magnitude of the edges so that weak edges disappear. This process is
necessary for data reduction because almost all of the pixels have a non-zero edge strength in
their neighbourhood. All the pixels with edge magnitudes above the threshold are the edges
that are processed further. Subsequent processing of edges is like binary image processing.
The regions of high contrast are processed like black and white regions.
Greyscale vision was employed in this work because of its advantages over binary
vision. Interior surface features of objects are visible with greyscale vision when an object's
surface appears to have different brightness. This is a critical feature in identifying the edges
of the weld indentation or impression. The interior of the impression appears darker than the
59

outside sheet surface and is therefore depicted on the monitor as a well defined circle through
which line measurements can be taken over two impression diameters, 90 degrees apart.
The greyscale vision system also does not rely heavily on uniform lighting. The
contrast between surfaces does not change as much as the absolute brightness of the surfaces
when lighting gets brighter or dimmer. Lighting sometimes may change over time or could
be non-uniform over the area of interest. If the contrast between the area of interest and its
background is not high, then non-uniform lighting over the area of interest can make binary
image processing impossible.
In the experimental set-up a desk lamp was used as the light source. The 60 watt
globe provided sufficient lighting for a clear image production. The camera was mounted
perpendicular to the weld surface and focused onto the impression. This focus remained
unchanged for all welds examined to avoid having to recalibrate the vision system.
60

CHAPTER 4.0
EXPERIMENTAL RESULTS
61

4.0 EXPERIMENTAL RESULTS
The following is a broad outline of the experimental procedure adopted in order to
assess the feasibility of employing vision sensing as a new resistance spot welding quality
monitoring and control device.
(a) A weldability lobe was constructed to characterise the resistance spot weldability of
Z I N C A N N E A L G 3 N ZF80.
(b) An electrode tip life test was conducted on this material at selected welding conditions
determined from the preliminary experimental work and from the weldability lobe
assessment.
(c) During the course of the tip life test, degradation of the electrode tips was tracked via
carbon paper impressions taken at selected intervals.
(d) Weld samples were taken at near identical intervals for
(i) profilometer measurement of weld impression diameter;
(ii) vision measurement of weld impression diameter;
(iii) X-ray measurement of internal weld nugget diameter;
(iv) ultrasonic measurement of internal weld nugget diameter, and
(v) peel testing for manual measurement of weld nugget diameter with vernier
callipers.
62

(c) Since tensile shear strength is of prime importance, a second tip life test was conducted
and further samples were collected for
(i) vision measurement of weld impression diameter, and
(ii) tensile-shear testing of weld nugget strength.
(0 Relationships were then studied between the vision system results and those obtained
from alternative measurement techniques for monitoring actual weld nugget size and
strength, tip degradation and weld impression diameter.
4.1 Weldability Lobe
In order to characterise the resistance spot weldability of the 0.8 mm ZINCANNEAL
G 3 N ZF80 and to select a suitable welding current level for electrode life testing on this
material, a weldability lobe was constructed.
A lobe is constructed over a range of weld cycle times and determines the current range
over which weld nuggets of a satisfactory size can be produced. T w o lines are normally
displayed, a line representing the current level at which minimum weld nugget size is
achieved (generally 8 0 % of the electrode tip diameter chosen) and a line representing the
current level at which metal expulsion will occur. A third line, referred to as 'nominal' is
sometimes shown which represents the current level at which a mid-sized weld nugget is
achieved.
The following conditions were employed to construct the lobe using R W M A Class II
truncated cone electrodes of 5 m m tip diameter and 90 degree included angle.
63

Electrode squeeze time: 25 cycles (50 Hz)
Weld times: 5, 7,9,11 and 13 cycles
Electrode hold time: 10 cycles
Welding force: 2.5 kN
The electrode squeeze time was the time necessary for the pneumatic cylinders of the
welding machine to reach the preset welding force level of 2.5 kN. The welding force level
was set at 0.5 k N higher than that employed in the preliminary work on 0.6 m m thick
material to account for the slight increase in material thickness of the Z I N C A N N E A L G 3 N
ZF80.
At each set weld cycle time, current levels to produce minimum weld size and
expulsion point were determined by averaging the current recordings of three welds. Each
current recording in itself was an average weld current (kA R M S ) calculated by the computer
program [59] over the duration of an individual weld period. The results obtained directly
from the computer data acquisition system are shown in Table 9, while Figure 28 shows the
plotted weld lobe. Note that minimum weld size was determined through peel testing and
measurement of average nugget diameter, while the expulsion point was determined by
further increasing the current level from the minimum point until there was visual evidence
of expulsion.
64

Table 9 — Current Level Recordings for Welding Lobe Construction
mln. current
Weld Time (cycles)
5
7
9
11
13
Minimum Weld Nugget Diameter Current Level (ave kA R M S )
7.40, 7.33. 7.33 ave 7.35
6.93, 6.87, 6.97 ave 6.92
6.52, 6.50, 6.57 ave 6.53
6.39, 6.30, 6.35 ave 6.34
6.23, 6.24, 6.26 ave 6.24
Expulsion Current Level (ave kA R M S )
8.17, 8.34, 8.29 ave 8.27
7.76, 7.80. 7.77 ave 7.78
7.41, 7.50. 7.67 ave 7.53
7.05, 7.15. 7.14 ave 7.11
6.79, 6.81, 6.84 ave 6.81
Lobe Width (k amps)
0.92
0.86
1.00
0.77
0.57
expulsion
E
< St.
c 9
O c
7 9 11
Weld Time (cycles)
Figure 28: Resistance spot weldability lobe for 0.8 m m thick Z I N C A N N E A L G 3 N ZF80
4.2 Tracking of Electrode Tip Degradation Through Carbon Paper Impressions
Utilising the weldability lobe, a welding current/welding time combination was
selected to produce an optimum weld nugget size. This condition was then employed for an
electrode life test (using the 5 m m tip diameter, 90 degree included angle electrode) on the
Z I N C A N N E A L G 3 N ZF80 during which electrode tip growth and wear was tracked and
65

weld samples were collected for submission to the profilometer and vision sensing
equipment, and for X-ray and ultrasonic examination.
The weld time chosen was 9 cycles, representing the midpoint of the lobe length and a
current level just below that which resulted in metal expulsion. Welding force and squeeze
time as per those employed to construct the lobe were used for the life test and an off time of
40 cycles (time between welds) was used to simulate high productivity welding. At no time
during the course of the electrode tip life run was the current adjusted.
Degradation of electrodes through alloying and erosion was initially tracked via the
carbon paper impression method described in Section 3.2.2 for selected welds over the
effective life of the electrodes. The life of the electrodes was deemed to be over after
completing 4600 welds (ie weld size had reached 4 m m in diameter). Figure 29 shows the
impressions obtained.
The diameter of the electrode tip impressions was measured in two directions
90 degrees apart using the Peak eyegauge, the results of which are shown in Appendix 12.
Average results from these are presented graphically in Figure 30.
66

SO -7S
Q too
%
SSo
o ns
%
*too
e /50
«
4 So
9 17?
9 SOd
9 2oo
9 sso
•
2SO
m eSOO
•
Joo
•
4>SO
• • • • • • • loo 7So 2oa 2So <fco 9sa /ooo
II0O-
*
/ffoo
© :asoo
iZOO
#
/ft>o
e
/30o
*
/too
m-lOOO
2.600
9 X?oo
*
suoo
9
fSoo
0 SLmmOO
2-300
%
/rn-rnOd
m 23CO
.3900
/70t
»
24.00
•
3COtO 3?<>3
• *, • t ® ® Q
34 Oo 3600 3SOO 4ooo AZoa 44CO 46GO
Figure 29: Carbon paper impressions taken during the course of an electrode tip life test on Z I N C A N N E A L G 3 N ZF80
67

E
UJ 6
LU
2 **t tt t
Q ,,?• t '•• UJ % M
QC UJ > <
t t t
• t» t t*.
' i ' ' ' ' ' ' ' i ' i i i i i i i i i i i i i i i i i i i i i i i i i i i i i i i i
1000 2000 3000 4000 5000
NUMBER OF WELDS
Figure 30: Average tip diameter results obtained from carbon paper impressions
68

4.3 Tracking of Weld Impression Diameter Through Profilometry
During the initial electrode tip life test, weld samples were removed for submission to
the profilometer in order to monitor the change in weld impression diameter. For the
purpose of this study, weld identification is identical to that used in the carbon paper
impression check on electrode degradation, however, actual weld samples were taken
immediately after each carbon paper impression test was taken. A scanning length of 10 m m
was chosen for the profilometer to cover both a 'run-on', 'run-off section on the parent
strip and all envisaged growth of the electrode. T w o profilometer traces were taken on each
selected weld. These were taken normal to each other and the average weld impression
diameter recorded. Traces taken parallel with the strip length were referred to as
'longitudinal' while those taken at 90 degrees to the longitudinal were referred to as
'transverse'.
A typical trace output from the profilometer is shown in Figure 31. The relatively
horizontal portions of the trace outside of the two major peaks represents the undamaged
surface of the test material. The undulating valley region between the two peaks represents
the portion of strip indented during spot welding, by the truncated cone electrodes, hence the
slightly tapered side faces leading up to the high peaks. The peaks (and those shown in
Figure 31 are just two points on the periphery of a circle) represent the highest points of
material build-up on the strip surface adjacent to the indented surface.
The horizontal distance between the two highest peaks was chosen for measurement of
weld impression diameter (shown as x-x) as the apex of each peak was the clearest and most
consistent reference point for measurement on each recorded trace. The peak to peak
distance was obtained via the distance measurement software in the computer facility. Valley
distance could not be chosen as a measure of weld impression diameter as there was some
degree of uncertainty over points of inflection that could be considered as consistent
reference points. There was sufficient yariation in the profile shapes over the electrode life
in this region due to the electrode degradation process. A measurement between the outside
of the m a x i m u m peaks near the sheet surface was also not chosen since it was difficult on
69

! !
R i
•a x
88
8*b oo «
I s 3
r§
B-'g §J
*t 8£
S's
< a <o £ tt © a J3
E
• •
O l I K I H I lOM <:|Nin.l llliOHH n «
J O
• •
* i r>
„ , f,
.„3 -3
.... <M« BOO BOO
«H<-. l . t
B/. mjt\
B O O
BOO
et 0
« ni
m
WW
1 J " V " M l » ' d
• H I u»»u | a j | t inA
" I " " . I ' M H » ( 1 , I jS.y | • |<IU) | IO|| »I«'S | • lin » i ...||
111 ...«.< .in ii'KHl l U W U ' l l
70

• •
t 3
\ \ i • • •
S S I
tt
s a
osiNiaj j ON siNiod n i * w j n« ONIHUUII
1 *
1 m
1 «
I *>
' c ll"
B .nd
B .nd
M M
MM.
MM' Mn Bl M n
see BOB
BBS
BBII
Bl B-
. M
IVBs
P<*3 "I IJ» 'd >-"»>S •! I JiJd
IOIHJ|j|u6.u l«»l>'»A •I »»S I »'l .-"•is j... I i « J I j I u t . y | « 1 '. o / i . f n n I •'S |»»-*o/| 10||
llllil'l.l 'HI IMiiu 11 IMUi.:i
71

many traces to clearly identify points of inflection over which to measure. A n example of
these uncertain measurement reference points can be seen on the second trace, Figure 32.
Points which were rejected as reference points for measurement of weld impression diameter
are shown arrowed.
Appendix 13 details results from peak to peak measurements (weld impression
diameters) throughout the initial tip life test. Averages of longitudinal and transverse peak to
peak measurements for each weld tested are presented graphically in Figure 33.
100J^ 2000 3000 4000 5000
NUMBER OF WELDS
Figure 33: Average profilometer impression diameter results
72

4.4 Tracking of Weld Impression Diameter Through Vision Sensing
The Adept AGS vision system was used on the same welds subjected to profilometry
measurements. The line measurement function was employed to measure impression
diameter again in the longitudinal and transverse directions but in pixel spacings which were
later converted to distance in millimetres. The circular function was also employed to
determine the percentage of edges found on the periphery of the impression. Appendix 14
details results from the vision system analysis. Averages of longitudinal and transverse
impression diameter for each weld tested are presented graphically in Figure 34.
E E cc LU h LU 5 < 0 UJ 0 < cr UJ > <
y : .
8
WEAR-IN
• •
t
7 L . < * , < |
6
5
(
t • • •
- 9
• • • •
•
* i i i i i • • . i i
HALF-LIFE
t |
,• V M. •«
1 i i i i i i i i i _
I MATURITY TERMINATION
• -•"•] ttt * 9
9 9 l •
i • i i i i i < i i i < i i i i i i i
• • •
i i i i i i i i i
1000 2000 3000 4000 5000
NUMBER OF WELDS
Figure 34: Average vision system impression diameter results
73

4.5 Measurement of Nugget Diameter Through X-Ray Analysis
In an effort to obtain a more accurate indication of nugget diameter prior to peel testing
of the selected welds and manual measurement of the diameter through vernier callipers, X-
ray and ultrasonic examination of the welds were conducted. For X-ray examination, a fine
grain film type D 4 was used. Focus to film distance was 760 m m . Emitter current was
4 m A and emitter voltage 85 kVA.
Figure 35 shows representative X-ray points from actual negatives taken throughout
the life of the electrodes. Longitudinal and transverse nugget diameters were measured
using the Peak eyegauge after placing the negatives on a light box to illuminate the X-ray.
Appendix 15 details the results of these measurements. Averages of longitudinal and
transverse nugget diameters are presented graphically in Figure 36.
74

Figure 35: Representative X-ray prints of welds taken throughout the initial electrode life test
75

9
I 8 vw
GC UJ
2 <
Q UJ 6 0 < II UJ
I 5
. . . . • • • • • • , , •
' ' ' ' ' ' ' ' ' I ' ' ' ' ' ' ' ' ' I ' 1 ' ' ' ' ' I ' I t I ' ' I I I I I I I I I I I I 1 I.J.
1000 2000 3000 4000 5000
NUMBER OF WELDS
Figure 36: Average nugget diameter results from X-ray analysis
4.6 Measurement of Nugget Diameter Through Ultrasonic Technique
Ultrasonic testing can be employed to detect a number of discontinuities in weldments
including cracks, laminations, shrinkage cavities, porosity, slag inclusions, incomplete
fusion or bonding and incomplete joint penetration. In the case of this work the technique
was employed to measure the fused, resistance spot weld boundary at the faying surface in
an attempt to predict weld nugget size.
76

In this non-destructive measurement technique, beams of high frequency sound waves
are directed into the test piece on a predictable path. When a discontinuity lies in the path of
the beams, reflection occurs which can be detected and analysed on a cathode ray tube.
The equipment used in this work was supplied by the Australian Nuclear Science and
Technology Organisation ( A N S T O ) at Lucas Heights Research Laboratories, N S W ,
Australia. The flaw detector was a Krautkramer USIP 12 unit with a D T M 12 digital
thickness meter. To emit the sound waves, an Accu-Tron 75 M H z transducer with a focal
length of 12.7 m m was employed. The scanning tank (tank in which sample sits immersed
in fluid) was constructed by A N S T O . A personal computer controlled movement of the
transducer which had a minimum step size of 0.12 m m .
Amplitude of ultrasonic signals returned from each sample was recorded on a 256
colour/64 grey scale PC display screen, each amplitude represented by a colour.
The procedure adopted was to immerse each weld sample, which was previously X-
rayed, into the water tank and onto a levelling jig. In order to avoid rusting through ingress
of water at the weld interface prior to peel testing, each weld sample was protected with a
silicon sealant around the edges of the steel strip. The sealant was allowed a number of days
to fully cure prior to sample immersion. After the weld sample was in place on the levelling
jig, the ultrasound transducer was focused on the surface of the sample and normalised to
the surface to obtain a m a x i m u m return echo from the reflected sound waves. The
transducer was then lowered so that the focal point was at the centre of the spot weld
thickness. This positioning allowed a 20 m m x 20 m m C-scan to be possible with the spot
weld being approximately central in the image recorded by the personal computer. The C-
scans were conducted with a step size of 0.24 m m . Actual scan size was 19.92 m m x
19.92 m m .
Images from C-scans were stored on floppy disc for subsequent measurement of
nugget size, as depicted by the weld boundary in each image, in both longitudinal and
transverse directions.
Figures 37, 38 and 39 show representative ultrasonic C-scan images from selected
welds taken during the initial electrode tip life test. It was evident from the images that two
77
boundaries could be measured which could reflect the weld nugget, an outer circular
boundary designated in red and an inner boundary designated by white which, during the
course of the electrode life, changed shape considerably and became more difficult to define.
Appendix 16 details longitudinal and transverse measurements obtained from both
boundaries while average results are presented graphically in Figure 40.
78
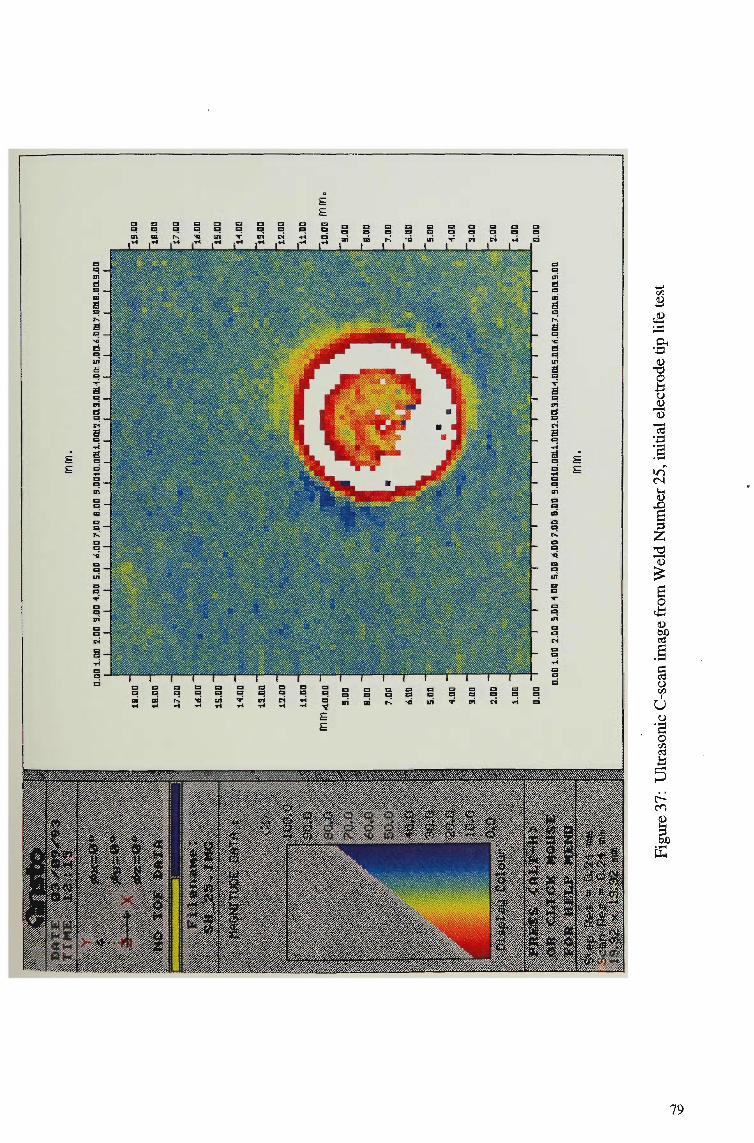
^lfSv3&rvSw^m0^y^^MV'X*i-^.y1>,^S^
o o • a o a a a a a a a ai a. r-. *-B in T
l^nr2 a a a a pi n
T a a TH
•t f
r% •« in
79
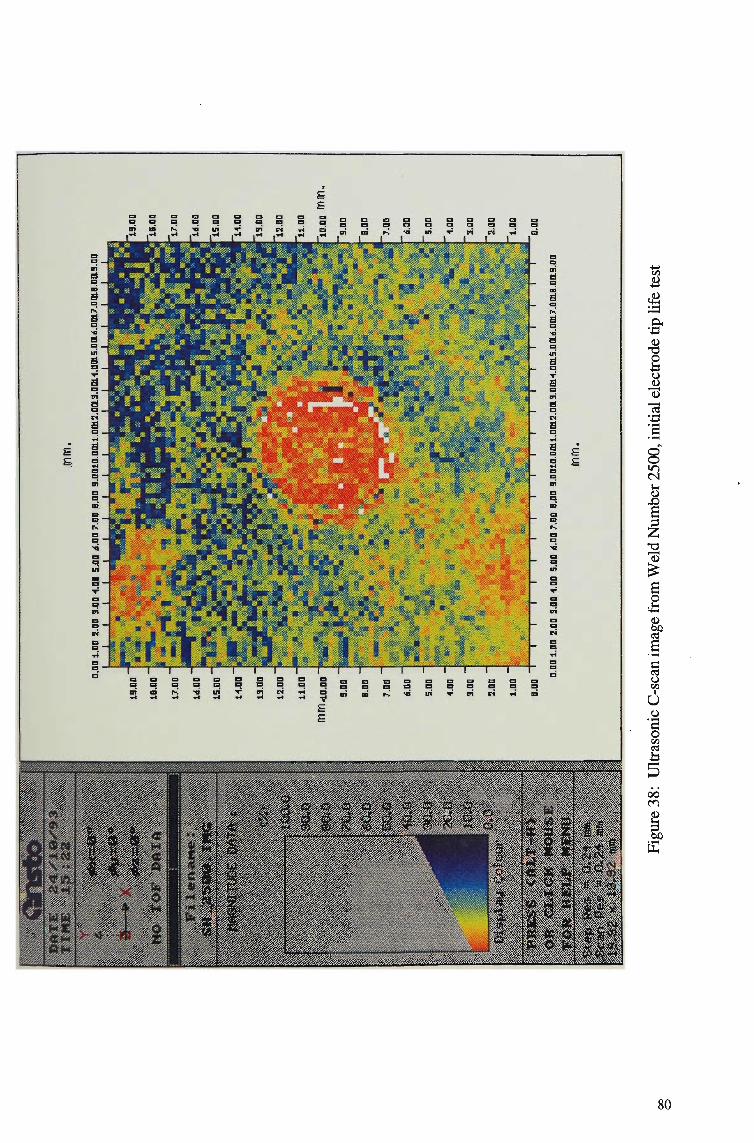
a a
el a ri
n a --i
a
80
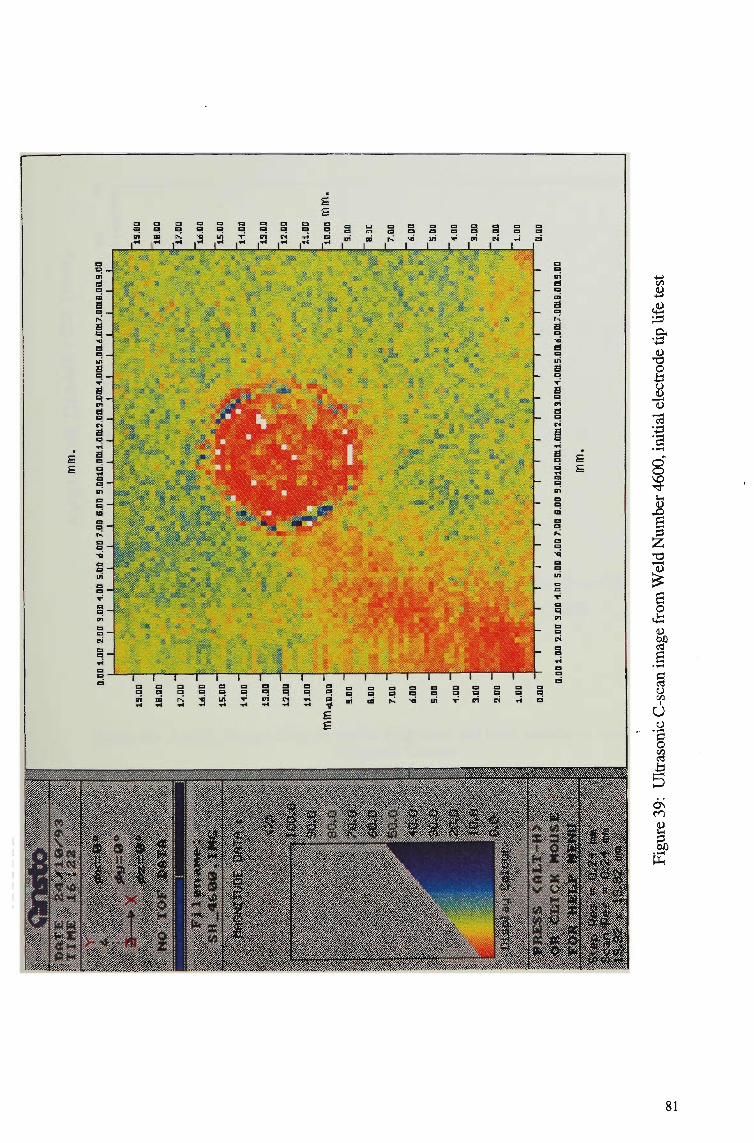
£ £
a a a
"W
Q n m i x - o w i T e n c . ^ a ^ J L
T ffl
L „ ,IIU1
T — r - i — i " ' i , r i — r ~ r ~ a a a a • a a a a a a a a a a a D i o i t s i i u i V n r J
- . . . | 1 .
a a pi
d a pi
a 2=
s 1 Ml Ul
:V'J
81

o Inner t outer
9
8
E t § 7 QC
UJ
• • • • •
L * - • • • » • rv * • i
< 5.^0 Ot
tt
0
t t t t
Q
UJ A
(5 * <
UJ 3 > <
2
o
P o\ 0
: I I I I 1 I I I I I I ' • I I I I • ' I < ' I ' ' I ' ' ' I ' ' I I ' I ' ' I I ' ' ' ' ' I ' ' I
1000 2000 3000 4000 5000
NUMBER OF WELDS
Figure 40: Average nugget diameter results from inner and outer boundaries measured from ultrasonic C-scans
4.7 Measurement of Nugget Diameter Through Conventional Vernier
Calliper Method
O n completing weld measurements through profilometry, vision sensing, X-ray and
ultrasonic techniques, welds were subjected to peel testing with resulting nuggets being
measured again in both longitudinal and transverse directions with a vernier calliper.
Appendix 17 details results obtained through this technique, while averages of longitudinal
82

and transverse weld nugget dimensions from each peel test are presented graphically in
Figure 41.
9 F
8 *-«i
E £ 7 n UJ ?
< 5 5 o 4 < OC m.
UJ 3 > <
2
• • • • • • • •
t t # ' t #
. . . . . t . . . t t • • • • 1 1 1 1 • i 1 1 1 1 1 1 1 1 1 1 1 1 1 1 1 _J 4 M i l l
0 1000 2000 3000 4000 5000
NUMBER OF WELDS
Figure 41: Average nugget diameter results measured via vernier callipers after peel testing
83

4.8 Tensile-Sheur Strength Testing of Weld Nuggets
The tensile-shear strength of resistance spot welds is of prime importance, particularly
in the automotive industry where spot welds are constantly subjected to stresses imparted
during vehicle movement and could be subjected to severe impact loading during vehicle
collision. Tensile-shear tests are used for quality assurance testing of production welds
(along with conventional peel testing) due to the fact that they are relatively inexpensive to
perform. Rather than destructively testing a formed and welded component, the tensile-
shear test can be conducted on specially prepared samples as shown in Figure 42. Weld
strength can be established at any time during the course of production welding, although
this is time-consuming, and can be used as a direct check on electrode degradation if so
desired.
The test is performed in a load frame and in the case of steel sheet thickness less than
approximately 1.0 m m , eccentric loading on the weld causes bending and rotation of the
weld to take place. This results in failure occurring around the periphery of the weld nugget.
EDGES AS SHEARED
L
DIRECTION OF ROLLING (PREFERRED)
SPOT-WELD CENTERED AS S H O W N
Figure 42: Tensile-shear test specimen configuration showing location of spot weld [71
84

In order to assess the vision system's ability to monitor reducing tensile-shear strength
as a direct result of electrode degradation, a second electrode tip life was conducted on the
0.8 m m Z I N C A N N E A L G 3 N ZF80 using identical conditions as those employed in the
initial electrode life test run. During the course of this second test, tensile-shear test samples
were prepared at selected weld intervals, the weld impression diameters being assessed on
these prior to subjecting the samples to testing on a load-frame at BHP's Research and
Technology Centre.
Tensile-shear samples were prepared in accordance with Figure 42, each half being 50
m m x 150 m m with an overlap region of 50 mm.
With the inherent variability which is common between individual electrode tip life
tests, it was surprising to obtain an electrode life on this second run of 4601 welds. This
similarity in result to the initial run (4606 welds) indicates the exactness of conditions
applied to each of the two runs.
Vision system results are tabled in Appendix 18 while average results are presented
graphically in Figure 43.
9 r
E 8 E rr
i-UJ 5 <
5 LU
CD < CC LU > <
1000 2000 3000 4000 5000
N U M B E R OF W E L D S
Figure 43: Average vision system impression diameter results, second electrode tip life test
85

Tensile-shear testing on welds was conducted on an Instron load frame, Model 1341,
servo-hydraulic, with a loading capacity of 100 kN (resolution of 1 N). Cross-head speed
for testing was 3 x 10"3 mm/second. Tensile-shear test results are tabled in Appendix 19,
while average results are presented graphically in Figure 44.
CB Q.
I
0 Z UJ
cc h (0
cc < UJ X (0 UJ .J CO
z UJ h lil
0 <
cc LU > <
500
• • • t . • . t
•;
400 t t
300 i i i i i i i i • ' i ' ' ' ' ' • ' ' ' < ' i i i i i i i i i i i i i i i i i i
1000 2000 3000 4000 5000
NUMBER OF WELDS
Figure 44: Average tensile-shear test results
86

CHAPTER 5.0
DISCUSSION OF RESULTS
87

5.0 DISCUSSION OF RESULTS
In order to study trends that may exist during the effective working life of a resistance
spot welding electrode and to have these trends also recognised by the proposed vision
system, a metallic coated steel needed to be chosen which imparted extended life to the
electrode. BHP's Z I N C A N N E A L G 3 N ZF80 is one such steel.
The additional heat treatment process imparted to Z I N C A N N E A L (and other
galvannealed steels), immediately after it exits the galvanizing, metal coating pot, generates
an iron-rich zinc coating (approximately 9.3-9.8% Fe) that is ideally suited to the resistance
spot welding process. Under optimum welding parameters, industries employing spot
welding as the preferred sheet metal joining technique, can take full advantage of this coating
by way of minimising the frequency of stoppages required to replace or redress worn
electrodes.
As a direct result of the high concentration of iron in coating, when compared to other
metallic coated steel types examined in this study (see Tables 4, 5, 6 and 7), contact
resistances between the electrode working face and at the faying surface during welding, are
generally lower for Z I N C A N N E A L . This translates into a welding lobe which encompasses
a lower welding current band than that seen on free zinc-coated, hot-dipped galvanized steels
and on aluminium-zinc coated steels when spot welded under identical conditions (Appendix
5). The lower heat input requirement to produce welds of acceptable size, retards the
deterioration of the electrode caused through accumulation of the metallic coating both
around the periphery of the electrode tip and across the actual working face in direct contact
with the workpiece. Through this retardation, current density (applied welding
current/contact area) can be maintained at a higher level for longer periods with subsequent
weld size being also kept larger.
Studies of electrode degradation mechanisms by Finlay, Samandi, and Howes
(Appendix 5) and by Howes and Lake [2] have revealed that the iron-rich metallic coating of
Z I N C A N N E A L is transferred during welding onto the electrode face in distinct and uniform
88

alloy layers. These layers are quite different in comparison to layers formed on electrodes
used to weld other coated steel types.
Through scanning electron microscopy, elemental compositions of alloy layers have
been determined. In the case of Z I N C A N N E A L , the composition of the very stable layers
formed on the electrode were found to be constant through the layer thickness. A total of
four layers was evident. The innermost layer was found to be a ductile beta (P) brass of
approximate composition 5 2 % zinc, 4 8 % copper. Immediately adjacent to this lies a brittle
g a m m a (y) brass layer of 6 3 % zinc, 3 6 % copper. Separating the outermost layer of brittle
zinc oxide and the inner brasses is a zinc-iron alloy layer of varying composition, depending
on the electrode composition used. This layer is quite thick (30-60 u.m) when Cu/Cr or
Cu/Cr/Zr electrodes are used and is quite thin (5 uni) and severely cracked when Cu/Zr
electrodes are used.
The nature of the zinc-iron alloy layer produced on the Cu/Cr and Cu/Cr/Zr electrodes
imparts a resistance to fracture and would not be easily eroded away. In contrast, the
cracking observed through this layer on Cu/Zr electrodes would promote erosion of the tip
face. W h e n an electrode is removed from the workpiece, a fracture line must occur across a
plane of greatest weakness. Since the layers formed on Cu/Cr and Cu/Cr/Zr electrodes are
uniform and crack-free, it can be expected that this fracture line would also be uniform and
relatively parallel with the electrode face. The electrode face after each removal would be
relatively smooth in comparison to that which would occur with the Cu/Zr electrode with its
cracked zinc-iron layer. These differences are clearly evident in the photomicrographs
presented in Appendix 5. The smoother electrode surface after each weld on
Z I N C A N N E A L , using either the Cu/Cr or Cu/Cr/Zr electrode, would mean that with each
successive weld, a more uniform current density across the electrode face is maintained.
Nied [57], as mentioned in 3.2.1, has demonstrated the importance of uniform current
density in maximising electrode life.
In contrast, the irregular surface produced on the Cu/Zr electrode when welding
Z I N C A N N E A L would be expected to promote non-uniform current density across the tip
face and could generate an out-of-control, electrode wear pattern. High spots on the
89

irregular face come into contact with the sheet surface initially during each weld, with the
passage of welding current being localised through these. Further alloy will build up at
these locations and will freeze during the "hold time'. These points on the face are then more
susceptible to stripping away from the electrode when the electrode is removed from the
workpiece. This erosion process repeats itself with each successive weld with high spots
now at new locations coming into contact with the sheet surface. The irregular or eroded
surface constantly changes and the wear is far more rapid down the axis of the tapered face
of the electgrode. The truncated conical configuration of the electrodes means that an
increasing, electrode tip surface area is being presented to the sheet with each weld. This
coincides with a gradual reduction in current density and therefore the formation of smaller
and smaller welds at the faying surface.
The electrode tip life data presented in Appendix 5 has reflected this erosion analysis
with the Cu/Zr electrode composition giving the least electrode life when welding the
Z I N C A N N E A L (shown as galvanneal) steel. While the Cu/Cr/Zr electrode, with its
combined attributes of high hardness and good electrical conductivity, proved to be the best
performer in regard to.electrode life, the availability and lower cost of the Cu/Cr electrode
and its current extensive use in Australia, made it the obvious choice for the purpose of this
study.
The initial experimental work on Z I N C A N N E A L G 2 ZF100 has proved beneficial in
establishing appropriate welding conditions on zinc-iron metallic coated steels and has
clearly demonstrated the superior spot weldability of the metallic coating. At the same base
steel thickness of 0.60 m m and identical welding conditions, the Z I N C A N N E A L coating
gave rise to electrode life even higher than that obtained when welding the electrogalvanized
steel which had a total coating mass of only 11 g/m2 (Table 3). The higher concentration of
iron in the coating of the Z I N C A N N E A L , combined with the low level of aluminium is
thought to be responsible for the improvement.
Electrode life was, under most conditions examined, enhanced through the use of a
lower electrode tip included angle. Only the electrogalvanized steel consistently produced
lower electrode tip life with the reduction of included angle from 120 degrees to 90 degrees.
90
Electrogalvanized steel has been observed by the author to be more susceptible to metal
expulsion from the sheet surface during spot welding. This is most likely to be a function of
the low coating mass. It could be that the 120 degree included angle tip, shields the alloy
being accumulated around the periphery of the electrode as it indents the sheet surface,
thereby minimising the tendency to expel the coating outwards, away from the indenting tip.
The sharper angle of incidence subtended between the sheet surface and the tapered face of
the 90 degree included angle tip, means that less shielding is available to the accumulating
alloy. Since the current density would be higher, at a preset current input, with the 90
degree included angle tip, due to the less electrode surface area being in contact with the
sheet surface, then it could be expected that the accumulating alloy would be at a higher
temperature. In the case of the 90 degree included angle tip then, surface expulsion, with the
low coating mass, would occur more easily.
It is understood that the coating building up around the electrode tip periphery could be
a combination of molten coating not alloyed with the copper electrode, and this would be
furthest away from the electrode, and coating which has alloyed directly with the copper
electrode. Any surface expulsion then would mean that some electrode material is being
removed or eroded from the periphery. It is this action that is responsible for the
behavioural difference between the electrogalvanized steel welded with the 90 degree
included angle tip and the other steels examined in the initial part of this study.
In order to obtain m a x i m u m tip life test results on the Z I N C A N N E A L G 3 N ZF80,
accurate electrode tip alignment to the sheet surface was necessary. Accurate alignment
would ensure uniform current density across the electrode face and therefore a more uniform
wear pattern. The carbon paper impression method used in this work provided a check on
initial electrode alignment and snapshots of the electrode wear pattern during the course of
electrode tip life testing.
The carbon paper method has indicated an intricate electrode wear and recovery
procedure throughout the course of the electrode tip life test. The electrode impressions
shown in Figure 29, together with the impression diameter results of Appendix 12, indicate
that no electrode contact face erosion had taken place on weld 1. Alloy had accumulated,
91

however, around the periphery of the electrode, as indicated by the average impression
diameter of 5.30 m m . This accumulation was uniformly dispersed around the periphery of
the original 5.0 m m electrode as the impression was found to be circular. It should be noted
that there may be some minimal contribution to impression diameter through the carbon
paper wrapping around the taper of the electrode. This is thought to occur since the carbon
paper could be seen to distort vertically upwards around the upper electrode during the
taking of each impression. The distortion is considered to be constant, however, since
electrode force remained constant throughout the tip life test.
B y the time weld 50 was reached, two features relating to the electrode wear were
apparent. Firstly, the impression indicated that a major cavity had formed at approximately
the 1 o'clock position and secondly, through measurement of the impression diameter, it
was found that the electrode diameter had become smaller (5.05 m m ) . The cavity formed,
slowly repaired itself by the time the 250th weld was made. The impression diameter results
showed that from the 50th to the 200th weld there was some growth in electrode diameter.
This growth could be a combination of alloy accumulation around the tip periphery and
gradual weld by weld erosion at the electrode face increasing the tip diameter by wearing the
electrode down through its central axis. Since the electrode is tapered (90 degree included
angle), naturally the diameter would be observed to increase. It is this second mechanism
that would have been responsible for repair of the cavity. Minor face erosion would have
occurred across the electrode face still coming into contact with the sheet surface, the only
region not in contact being the area of the cavity. The erosion continues until the full depth
of the cavity is reached, at which point the electrode face is once again in uniform contact
with the sheet. There was another major cavity formed by the 75th weld at the 6 o'clock
position, however this was quickly repaired as there was no sign of it by the 100th weld.
Removal of the accumulated alloy around the tip periphery is the only explanation for
the reduction in the diameter of the 50th weld. It could be argued that erosion at the
periphery could be responsible, however the 50t h weld was still quite circular. Other
impressions did indicate that peripheral erosion did occur at times (impressions 1600 to
2400) but in the case of the 50th weld, there is more likelihood that either expulsion of the
92

accumulated alloy had occurred, and as indicated earlier, this is more a feature of metallic
coated steels with very light coating masses, or it could be that through the action of the
electrode indenting the sheet surface, the alloy had been sheared off.
M i n i m u m impression diameter was reached at around the 2200th weld. At this point,
peripheral erosion was the main feature. In general, electrode growth occurred from this
point on until the 4600th weld. S o m e electrode recoveries did occur where again, alloy
could have been sheared away bringing the electrode diameter back smaller. Other cavities
also began to form which were repaired through the process described previously. At the
4600th weld, electrode growth was such that the current density was now insufficient to
sustain a weld nugget (measured through peel testing) above the minimum requirement of
4.0 m m ( 8 0 % of the electrode tip diameter). Exacerbating the growth in tip diameter to
5.90 m m and its subsequent effect on weld size, was the large central cavity at the 4600th
weld. Without this region being in contact with the sheet surface, there was little chance for
uniform resistance heating at the faying surface.
The electrode growth and recovery process appears quite cyclic as indicated in Figure
30, but non-uniform in frequency. This cyclic behaviour, together with the major reduction
in electrode diameter at around the 2200th weld, served as key focal points for determining
the ability of the vision system to identify major changes to the electrode and subsequent
weld size.
The profilometer technique was used as a preliminary check on measurements obtained
through the vision system, as was also the carbon paper impression method. Although the
profilometer technique measured peak to peak distance across the impression left by the
electrode on the sheet surface, as shown in Figure 45, it indicated a similar growth and
recovery pattern that was found from the carbon paper impressions. A major reduction in
electrode tip diameter was still detected in the vicinity of the 2000th weld, as shown in
Figure 33.
The only difference occurring between these two measurement systems was the overall
increase of approximately 0.5 m m on each diameter measured from the profilometer traces
over that measured from the carbon paper impressions. This was not an unexpected result
93

since the carbon paper measured the tip face diameter (Figure 45) while the profilometer
measured across the highest points on the sheet surface. These peaks are located on coating
that had been forced radially outwards from the tapered electrode as it indented the sheet
surface.
VISION SYSTEM
PROFILOMETER
— ^
WELD NUGGET
3 STEEL SHEET
CARBON IMPRESSION
Figure 45: Schematic showing the measurement positions through the carbon paper impression method, profilometer and vision system
The cavities found on the electrode face through the carbon paper technique were
reflected on the indented sheet surface and were accurately revealed through the profilometer
traces.
At the 350thweld, for example, the carbon paper impression of the electrode face
showed that a small cavity had developed at the 3 o'clock position (Figure 29). Although
94
difficult to sec, the carbon paper impression also showed a 'pin-hole' cavity jusl to the right
hand side of the central position. For the profilometer technique to be considered accurate, it
would need to detect both of these cavities on the sheet surface, which in reality is the mirror
image of the electrode face. Since longitudinal and transverse traces were taken through the
centre of each indentation, in the case of the 350th weld, the longitudinal trace should reveal
both cavities while the transverse trace should reveal only the smaller 'pin-hole' cavity.
Obviously, it would be quite easy to miss the 'pin-hole' through the profilometer technique
since the diameter of the stylus covers only a small area as it is dragged across the
indentation. Figure 46, the longitudinal trace from the 350th weld and Figure 47, the
transverse trace from the same weld show that for this weld at least, the cavities were not
missed. If multiple traces were taken, a complete 3-D picture could be obtained of the
cavities as well as the orientation of the electrode face to the sheet surface.
95

s 8 •
I S m.
h X
. i .. . H >tlft H C u il bu.;
« 3
a
3
E 3
a a N
i 3
a a a
E 3
a a 03
E 3
a a it
E 3
a a v
E 3
8
a fl
E 3
a a .
i 3
a a .N
E 3
a a »
E 3
a a IS
E 3
a a «
O •a IA
a w> c
n o -C W3
2 rn) a
i/->
cn •5
o 8 r3 b I-I <u 6 o E3 2 D. -a c •a 3 T3
t/5 C o 5b
H
s •8 b
g "0 o bO c =5 c
8. ss g o O
Mi
5? p
tu
rl 1 | N I JW LON '.111-1 I" 104,- ' 1H ">NIN»«».I\
i* • 1
"1 ' BB0
BBS
at 0-
ei *.
mv.
M i. . ••
I r. i
i • i i *
! M l '1 1'
•» , 1
' ' 1 '
f J3 i 11* : ~
1 »•
11.1
•' 1
» •
)
1 i° 'd
' 1 '
96
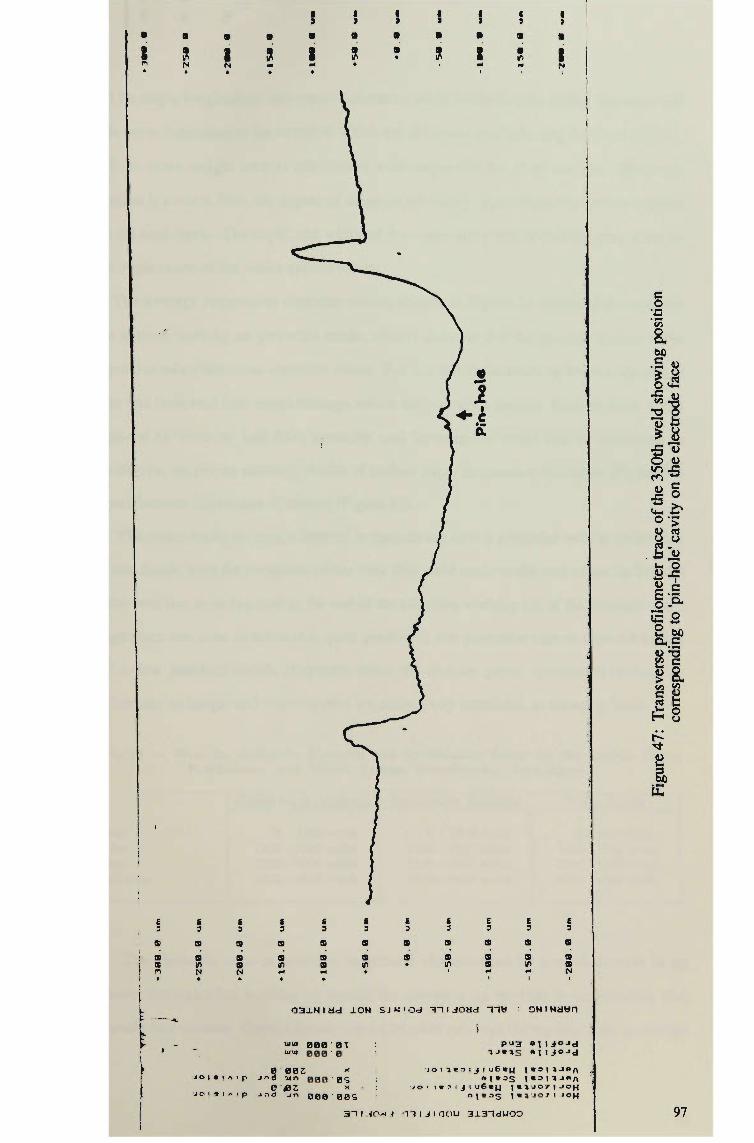
•
s n .
i
>
E 3
a s
i a
f n •
i .. ; !•
*• »
i
'
a a N .
E 3
a • in N •
-«.
~
J O
JO
m
I «
E 3
a s a M *
l ] i M p
» 1 r- 1 p
I ! 1 1 1 f I i i i 1 i i » | • • • • • • • •
si i si ? si i i i M M « m m S . • i i .
\
J
J ^
I
E E E E E E E E 3 3 3 3 3 3 3 3
a o s s a a a s a s a a s a a s i A B i n » i n a i f t 8 M M * 1 M M M . * I I I
oaiNiad ION sjsiod 3~i i joad m w i ONiNawn i 1
«"• BOB BT P u 3 »Ild>OJel »» BOB B »J«»S » I ! i O J d
B 00Z * IOI »«3| J)l uE«u I « O U J » H J"d mn BBB BS »l» J S l«'U J»ll
0 0Z * 'Jei i r M jiuBiy | « ) J O 7 | J O H -ind jn 000 BBS <M» 3 S I " 1 J O " '°H
3~l 1 IC-t i m i J I O O U 3±3-|dUOO
c o ;c "v5
ometer
trace of the 350th weld
showing po
'pin-hole' cavity on
the electrode face
Figure 47: Transverse
profil
corresponding to
1 1
97

The single longitudinal and transverse traces taken on each weld during this work did
provide some indication of the extent to which the electrode was indenting the sheet surface,
as well as some insight into its orientation with respect to the sheet surface. Electrode
orientation is evident from the degree of slope on the valley region between the two highest
points on each trace. The depth and width of the indentation and orientation play a major
role in explanation of the vision system results.
The average impression diameter results shown in Figure 34, obtained through the
vision system working on greyscale mode, clearly indicate that the system can detect the
changes that take place as an electrode wears. For this initial electrode tip life run, the vision
system has indicated four zones through which the electrode passes. Each of these zones
designated as 'wear-in', half-life', 'maturity' and 'termination' could also be identified, to
some degree, on graphs showing results of carbon paper impression diameters (Figure 30)
and profilometer impression diameters (Figure 33).
The zones are by no means distinct, ie they do not have a particular weld at which they
start and finish, with the exception of the very first weld made at the start of the tip life test
and the very last weld depicted as the end of the effective working life of the electrode. The
change from one zone to the next is quite gradual in this particular case and can take place
over a few hundred welds if results from the carbon paper impression technique,
profilometer technique and vision system are collectively examined, as shown in Table 10.
Table 10 — Wear-In, Half-Life, Maturity and Termination Zones for the Carbon Paper, Profilometer and Vision System Measurement Techniques
Wear-in Half-life Maturity Termination
Carbon Paper Technique
0 - 1200 welds 1200 - 2200 welds 2200 - 4000 welds 4000 ~ 4600 welds
Profilometer Technique
0 - 1000 welds 1000-2100 welds 2100 - 4000 welds 4000 - 4600 welds
Vision System
0 - 1000 welds 1000 - 2000 welds 2000 - 4000 welds 4000 - 4600 welds
The electrode wear-in period is in general characterised by a rapid increase in tip
diameter through alloy building up around the electrode tip working in combination with
electrode face erosion. Current density would be relatively high during this initial period but
98
decreases as the build-up progresses. After approximately 1000-1200 welds, the alloy
build-up around the top has reached a level at which it can no longer be supported by the
tapered geometry and an electrode recovery phase begins. During this phase, the build-up is
removed. Electrode face erosion continues but at a much slower pace than the rate of
removal of alloy from around the tip. The recovery process continues until the electrode
reaches its half-life stage (2000-2200 welds). At this point, the electrode tip diameter has
recovered to a level where the increased current density begins to dictate that once again,
rapid electrode growth should occur and at a similar rate, if not faster than that experienced
during the wear-in period. The rate of growth appears to stabilise up to the point of
termination with minor electrode recovery taking place on a number of occasions. After
approximately 4000 welds, the extent of alloy build-up and erosion is such that the current
density can no longer sustain welds above the pre-selected minimum value. At 4600 welds,
electrode life is considered as over with no further recoveries taking place.
It is interesting to note that the initial value recorded at the commencement of the tip life
test from the vision system is well below that of the 5.0 m m original tip diameter and yet
after the wear-in period, the average diameter is approximately 1.5 m m larger than those
diameters recorded by the previous two methods. This anomaly can be explained through
the vision system's characteristic to measure from reference points based on lighting
contrast.
There is evidence from the profilometer traces to indicate that the depth of impressions
left on the sheet surface during welding by the indenting electrode, is greater at the
commencement of the electrode wear-in period. With little electrode face erosion and alloy
growth taken place at this time, current density is high. The higher the current density, the
greater the volume of molten metal generated at the faying surface and therefore the greater
the opportunity for the opposing welding electrodes to move towards each other. It is this
inward movement of the electrodes attempting to displace the molten interface, that is
responsible for the high level of indentation at the commencement of the electrode life test.
Making this indentation appear deeper to the vision system is the peak (or ridge)
formed around the electrode on the sheet surface. The greater the indentation depth, the
99

higher the peak. Figure 46, a profilometer trace of the 350th weld shows one such example
of a deeply indented sheet surface in combination with a high surface peak. Because of the
vision system's requirement to be situated directly over the impression, the lighting source,
in this case a single lamp, was placed close by but on one side of the impression. It is
thought that due to the depth of impression and the surface peak, shadows have been cast
across a portion of the base of the impression. Since the vision system relies on depicting
boundaries between zones of differing contrast (grey scale monitoring), the final
measurement may have been smaller than the true diameter of the impression base (the weld
diameter).
A s welding proceeded, the electrode diameter grew through the mechanisms
previously explained. Because the applied electrode force was unchanged throughout the
life test, the depth of impression became less and less and the surface peak subsequently
became gradually less predominant. The impression diameter increased as a function of the
growth of the electrode tip. The vision system is now no longer influenced by shadows
across the base of the impression but depicts boundaries of high contrast closer to the
periphery of the impression at the sheet surface.
For comparing the results from the vision system and profilometer, it is evident that
the region of highest contrast in the latter period of electrode life testing (beyond 500 welds)
is located around the outside of the surface peak. The vision system would therefore always
record a large diameter than the profilometer which recorded distance between the apex of
the peak across the impression.
The circular function results for the vision system (see Appendix 14) revealed that, on
average 8 1 % of the weld impression boundary could be depicted. The variation in circular
function results over the course of the tip life test may be attributed to the shadowing effect.
X-ray results revealed the smallest degree of scatter of any of the measurement
procedures adopted in this work. A n unexpected outcome of these results, however, is the
increasing diameter of the weld nugget over the tip life test (see Figure 36). While the
results clearly showed the oscillating behaviour associated with periodic electrode recovery
and the radical shift that occurred at around 2000 welds, the increasing diameter contravenes
100
the expected result. The weld diameter should decrease with increasing electrode tip
diameter as was seen from the peel test results shown in Figure 41. It is thought that a
contribution had been made to the X-ray diameter results by a lightly fused zone around the
actual weld nugget, the diameter of which increases with increasing tip diameter. This
lightly fused zone, seen as a dark ring around each weld X-ray (Figure 35) is likely to be
just the metallic coating bonding at the faying surface and being of low strength does not
contribute to the weld nugget size revealed during peel testing.
Although the C-scan, ultrasonic test results followed the expected trend of decreasing
weld size with increasing tip diameter (see Figure 40), measurement of nugget diameter
through this process relied heavily on interpretation of the images presented.
While all of the welds in the wear-in period produced C-scan images with well defined
boundaries, these boundaries became less defined as the electrode matured. After the wear-
in period, it became necessary to estimate the location of the boundary in many instances, as
the white regions, ie the regions of greatest fusion became scattered over the weld image.
Figure 37 (Weld Number 25), for example, clearly showed a well-defined white boundary
which could be easily measured. In contrast, Figure 38 (Weld Number 2500) and Figure
39 (Weld Number 4600) relied on the interpreter to define the boundary, thereby introducing
a variable into the measurement. This explains the degree of scatter in the results shown for
the inner boundary in Figure 40. Unfortunately it is this inner boundary result that
represents the true weld nugget. Due to the scatter however, these results cannot be relied
upon to indicate the change in weld nugget diameter over the tip life test The outer diameter
results have far less scatter and like the X-ray results, indicate a major recovery at around
2000 welds. These results are again higher than the actual peel test results shown
graphically in Figure 41, indicating as in the X-ray results, some contribution
(approximately 1.5 m m ) from a lightly fused zone around the nugget. In general then,
neither the X-ray method or ultrasonic method provided an accurate picture of the weld
nugget diameter. They did, however, support the findings of the vision system in that they
depicted the major changes that took place over the course of the tip life test
101

O n examining the results from peel testing, three distinctive peaks (or rises in weld
nugget diameter) could be seen. These occurred at around 1000 welds, 2000 welds and
3000 welds. It could be expected that if the electrode had recovered at these points during its
service life, then the impression left on the sheet surface would be decreased and the vision
system would see these. This was in fact the case as Figure 34, a graphical representation of
the vision system results, shows a decrease in surface impression diameter at 1000, 2000
and in the vicinity of 3000 welds. The rapid rise in impression diameter after 2000 welds
which continued up until approximately 2500 welds was also clearly associated with a
marked drop in weld nugget size from peel testing over the same period.
The oscillation in average weld impression diameter as seen by the vision system was
also evident in the results of the second tip life test (Figure 43) but the amplitude of the
oscillation was less than that seen in the first run (0.6 m m first run, 0.1 m m second run).
Major electrode tip diameter recoveries were not a feature of the second run, nor was the
initial rapid increase in impression diameter. Instead, the impression diameter grew steadily
to the point of termination. In contrast to the initial run, the electrode used in the second ran
appears not to have indented the sheet surface heavily over the first few hundred welds. It
may be that during the initial few welds where optimum weld current was being established,
a welding current slightly lower than that employed in the initial run was chosen, ie further
below the expulsion point. If the optimum current was lower in the second run, then it is
feasible that less indentation would take place. With less indentation, there would be less
height on the peaks formed around the indented sheet surface and therefore the vision system
would not be reading diameters as large as that seen in the initial run. The actual recorded
difference between the initial and second run, not taking into account the wear-in period of
the initial run, is approximately 1.5 to 2.0 m m . Other variables such as quality of the
machined electrode face (surface roughness) and coating mass variations across or along the
rolling direction of the Z I N C A N N E A L sheets used in the second run m a y have played some
minor role in generating the difference.
Direcdy associated with the increase in impression diameter over the tip life test was a
decrease in tensile shear strength of the welds as shown by the results in Figure 44. The
102
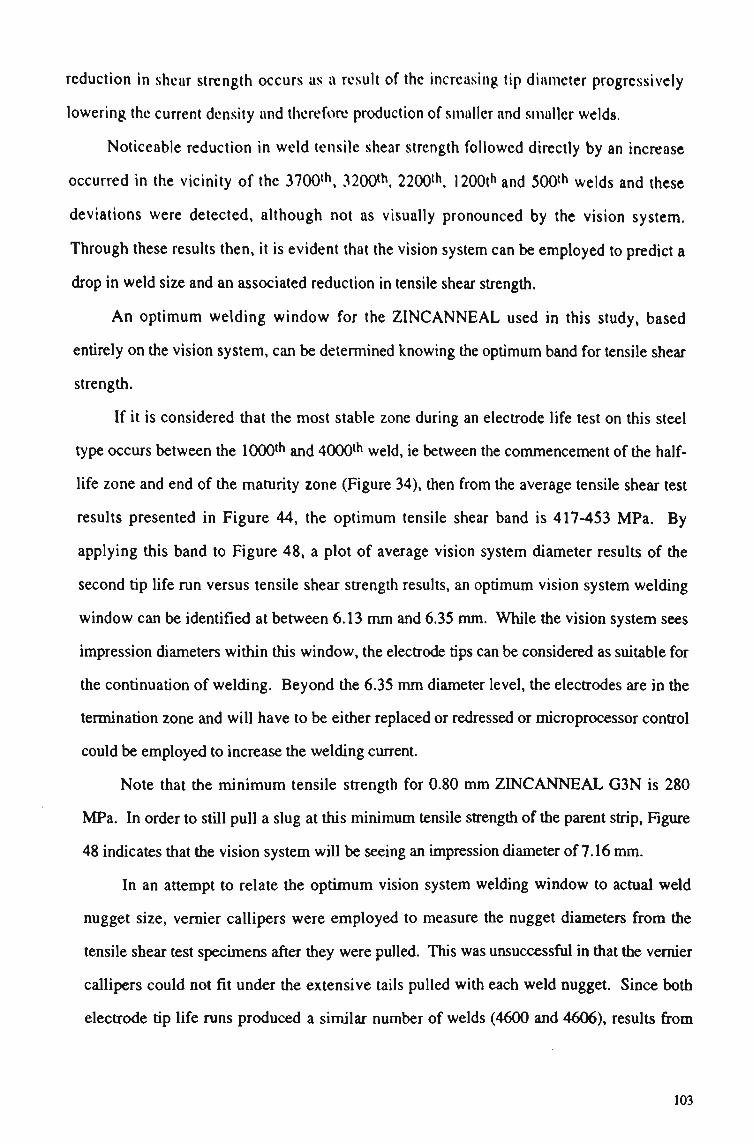
reduction in shear strength occurs as a result of the increasing tip diameter progressively
lowering the current density and therefore production of smaller and smaller welds.
Noticeable reduction in weld tensile shear strength followed directly by an increase
occurred in the vicinity of the 3700th, 3200th, 2200th, 1200th and 500th welds and these
deviations were detected, although not as visually pronounced by the vision system.
Through these results then, it is evident that the vision system can be employed to predict a
drop in weld size and an associated reduction in tensile shear strength.
A n optimum welding window for the Z I N C A N N E A L used in this study, based
entirely on the vision system, can be determined knowing the optimum band for tensile shear
strength.
If it is considered that the most stable zone during an electrode life test on this steel
type occurs between the 1000th and 4000th weld, ie between the commencement of the half-
life zone and end of the maturity zone (Figure 34), then from the average tensile shear test
results presented in Figure 44, the optimum tensile shear band is 417-453 M P a . By
applying this band to Figure 48, a plot of average vision system diameter results of the
second tip life run versus tensile shear strength results, an optimum vision system welding
window can be identified at between 6.13 m m and 6.35 m m . While the vision system sees
impression diameters within this window, the electrode tips can be considered as suitable for
the continuation of welding. Beyond the 6.35 m m diameter level, the electrodes are in the
termination zone and will have to be either replaced or redressed or microprocessor control
could be employed to increase the welding current.
Note that the minimum tensile strength for 0.80 m m Z I N C A N N E A L G 3 N is 280
MPa. In order to still pull a slug at this minimum tensile strength of the parent strip, Figure
48 indicates that the vision system will be seeing an impression diameter of 7.16 m m .
In an attempt to relate the optimum vision system welding window to actual weld
nugget size, vernier callipers were employed to measure the nugget diameters from the
tensile shear test specimens after they were pulled. This was unsuccessful in that the vernier
callipers could not fit under the extensive tails pulled with each weld nugget. Since both
electrode tip life runs produced a similar number of welds (4600 and 4606), results from
103

peel testing and vision system results from the initial run were plotted against each other over
which the optimum vision system welding window was placed to determine nugget size.
The results shown in Figure 49 indicate that weld nuggets of between 5.26 m m and 5.40
m m diameter will be produced with the vision system working within the optimum welding
window. This represents an increase of 5.2% to 8.0% over the initial electrode tip diameter
of 5.0 m m , not unreasonable since the molten zone forming the weld nugget is generally not
just constrained at the faying surface over the contact area of the electrode face but is free to
move outwards some small distance between the sheets being joined.
104

8.00
7,80
7.60
7.40 r
7.20
7.00
6.80
6.60
6.40
6.20
6.00
5.80
REGRESSION EQUATION
Y-0.0059X • 0.814
R*- 0.4514
IINIMUM TENSILE STRENGTH
VISION SYSTEM WELDING WINDOW
. i i i i i i i i » i i i i i i l i i i i i » i I . i i i i
• • •
5,60 ' " ' 280 320 360 400 440 480
TENSILE SHEAR STRENGTH (Mpa)
Figure 48: Optimum vision system welding window as a function of tensile shear strength
105

9.00
8.50
8.00
7.50
7.00
6.50
6.00
5.50 "
5.00 -
4.50 -
4.00
• •
s •
• ••X VI810N SYSTEM WELDINQ WINDOW \
•
REGRESSION EQUATION
Y--0.413iA 275Q3X • 1M78
R*- 0.2738
• i i . • • i • • 1 i • • i • i • • • 1 • • i i i . • i • 1 • • •
r
•
_, _._! 1 1 1 1
6
Av. NUGGET DIAMETER (mm)
Figure 49: Optimum weld nugget diameter operating under the vision system
106

The vision system is not designed to operate in real time such as the dynamic
resistance method or weld expansion and contraction method described in the Introduction.
Instead it relies on examining the weld made previously and offers the major advantage of
allowing the weld, time to cool and contract prior to measurement of the impression
diameter. This ensures a higher degree of accuracy in relaying and predicting weld nugget
size.
107

CHAPTER 6.0
CONCLUSIONS

6.0 CONCLUSIONS
The feasibility of the Adept Vision system to monitor and control resistance spot weld
quality on metallic coated steel sheet during simulated production welding, has been
assessed during the course of electrode tip life testing. To provide the vision system with a
sufficient number of welds over which trends in weld quality and hence electrode condition
could be depicted, Z I N C A N N E A L , a zinc-iron-rich metallic coated steel, used primarily in
automotive and appliance industries, has been welded using commonly employed Cu/0.8%
Cr truncated cone electrodes. The results of this work have revealed the following.
1. During an initial weld parameter study conducted using electrogalvanized steel,
Z I N C A N N E A L , Al-45% zinc coated steel, Z n - 5 % Al coated steel and hot-dipped
galvanized steel, only electrodes used to weld the Z I N C A N N E A L and Zn-5% Al coated
steels benefited to any extent through the addition of current upslope into the welding
schedule.
2. In general, a truncated cone electrode tip profile with an included angle of 90 degrees
rather than 120 degrees produced an increase in electrode life with the exception of
electrodes used to weld the electrogalvanized steel.
3. An increase in electrode tip diameter over the recommended size was detrimental to
electrode tip life when welding electrogalvanized and Z I N C A N N E A L steels.
4. Measurements taken from carbon paper impressions of an electrode tip used to weld
0.80 m m thick Z I N C A N N E A L G 3 N ZF80 steel showed that the electrode diameter
oscillated over the effective life of the electrode.
109

5. Profilometer traces taken across the indented sheet surface over the course of the
electrode life indicated similar trends to that of the carbon paper measurements and that
electrode indentation was greatest at the commencement of welding.
6. The vision system accurately depicted the oscillating trends associated with electrode tip
diameter recovery, the actual measurements being closely associated with weld
illumination and depth of electrode impression on the sheet surface.
7. X-ray and ultrasonic C-scans taken from welds prior to peel testing failed to produce
accurate weld nugget sizes but assisted in establishing confidence in the vision systems
ability to depict changing weld quality.
8. The vision system results correlated fairly well with tensile shear strength of the weld
nugget and if maintained through feedback control, to produce impression diameters of
between 6.13 m m and 6.35 m m , optimum tensile shear strength would result.
9. The optimum vision system welding window produced weld nugget diameters between
5.2% and 8.0% greater than the 5.0 m m electrode tip diameter employed in this study.
110

CHAPTER 7.0
FUTURE WORK
111

7.0 FUTURE WORK
During the course of this work and from the author's previous experience, it has been
noted that on separation of the welding electrode from the workpiece after the weld cycle has
been completed, a relatively smooth fracture plane is left on the sheet surface of
Z I N C A N N E A L . The vision system assessed appears to have little difficulty in visualising
the base of the impression left by the indenting electrode due to this surface. The only
interference in obtaining an accurate measurement across the base is the surface ridge or peak
on the sheet surface casting shadows, the contrast changes being points that the vision
system focuses on. In the case of Al-45% Zn coated steel, electrode/workpiece separation
planes are quite rough as brittle alloy pockets formed on the electrode working face are
stripped off and are frozen on the sheet surface. Even if the electrode indentation depth is far
less towards the end of the electrode life, accuracy of the vision system may be hampered by
the roughened weld surface. It is proposed then, that the vision system be employed on this
steel type in order to assess its effectiveness in predicting weld nugget size.
The lighting source appeared to play an important role in the vision system's ability to
very accurately monitor weld impression size and hence predict nugget size. By positioning
a number of lamps around the vision system camera, more accurate results may have been
achieved. Fibre optic lamps attached to the camera may provide better illumination as these
would shed light in a more normal direction to the weld surface thereby minimising or totally
illuminating shadows. Future work should then include an assessment of more efficient
lighting of the vision zone. This m a y also address the problem of welding the Al-45% Zn
coated steel.
Also, better illumination can be provided by employing a low power laser beam, since
monochromatic light would help bring out the details of the weld nugget area and its
periphery when focused on the weld spot.
A grey scale camera and frame grabbing facility are adequate for extracting relevant
features from the weld nugget impressions thus alleviating the need for expensive colour
image processing hardware and software. Grey scale images are also much simpler to
112

process in real-time. Indeed with the advent of the new pcndium microprocessor and its
immediate predecessor, the grey image processing: task of single frames containing spot
weld nugget impressions can be achieved in milliseconds. This real-time capability allows
sufficient time for the pre-programmed microprocessor to alter the combination of process
input parameters, if needed, in between two successive spot welds in order to obtain the
desired spot size that provides the needed strength and appearance. This way, the process
will conform to the workpiece following predetermined acceptable spot weld standards that
have been evaluated through this thesis.
In this work the correlation between spot size, measured using machine vision and
weld strength was established. A method, or rather a procedure for feeding back the
monitored process output to the system and adjusting the input parameters accordingly, is
necessary. In this situation, adaptive process control can be achieved by selecting a new set
of primary process input parameters, ie parameters that their magnitude can be changed
during the process, eg weld force and current levels. Selection of these parameters will
depend on their cumulative effect on weld nugget size, since they are coupled. Closed loop
control can then materialise by simply comparing the size of a freshly made weld nugget to
the desired one stored in the microprocessor's memory as an area array having certain
dimensions, ie radius (or diameter), that maximises weld strength. Image differentiation
algorithms already exist, especially for regular shapes, as is the case of weld nuggets, and
are capable of image subtraction. This subtraction is usually performed by superimposing
the actual and desired images and the difference in magnitude of their respective radii can be
correlated to the required change of magnitude of process input parameters.
Subsequent to this work, a control algorithm with a stepped function needs to be
developed in order to increase or decrease the input parameters as appropriate and the system
to perform the next spot weld with the aim of maximising its quality characteristics,
specifically strength and appearance. It is important to note however, that the control system
needs to observe the life cycle of the truncated cone electrode and distinct regions that have
been identified in this thesis. In other words, it will be pointless to attempt to alter any
process input parameters during Stage 1 (wear-in) and Stage 4 (termination) for obvious
113

reasons. Therefore, efforts to adaptivcly control the process should concentrate in Stages 2
and 3 (half-life and maturity respectively), where the useful life of the electrode lies. It is
also imperative to set tolerance limits that are acceptable within these stages and with regard
to the minimum and m a x i m u m desirable weld nugget size. These limits can be easily
obtained from the data presented in this thesis, relating weld nugget size and strength in the
designated Stages 2 and 3. In addition, the control system must be able to distinguish weld
nugget size variations due to material imperfections. Such imperfections will depict larger or
smaller weld nugget sizes to the ones obtained under controlled laboratory conditions. To
overcome this challenge, control software that accounts for such variations can be developed
using thresholding or quality band techniques which can be incorporated in the form of
simple subroutines.
Following the above mentioned proposed future work, a machine vision system
capable of monitoring and controlling the spot welding process by measuring the direct
outcome of the process prior to performing the next spot weld can be fully developed and
applied to any industrial environment that warrants the employment of automated spot
welding facilities. However, the harshness of this environment may necessitate the need for
maintenance, ie cleaning of the machine vision lens protector.
Finally, the concept of controlling the spot welding process using machine vision can
be taken further and applied also for path following and positioning of the electrode surfaces
parallel to parent material surfaces of the lap joint, eg contoured paths encountered on car
bodies. Additional control algorithms for path generation and following are required in this
case, together with a decision-making ability or to the exact location of the spot weld in the
path and its strategic importance at that location. However, to accomplish these high levels
of intelligence tasks, an artificial intelligence system is necessary. It is proposed, that in this
case, a neural network is used to provide spot weld pattern recognition and subtraction, ie
low intelligence level decisions, whilst an expert system with real-time inference engine
provides the high intelligence level decisions including path following and spot weld
placement. Such a hybrid intelligence system is feasible and there are already software
packages available that can help develop the autonomous spot welding tasks.
114

REFERENCES
[1] Nealon, C.S., Lake, J.S.H. Conditions for acceptable resistance spot welding of
Z 1 N C A L U M E coated qualities. B H P Research and Technology Report No 912,
November 1986.
12] McGregor, G. Resistance spot welding of metallic coated steels. Paper presented at
the Australian Welding Institute and Australian Institute of Metals Seminar, Resistance
Welding, Adelaide, 1982.
[3] Assel, M.D., Nadkarni, A.V. Non-dressing dispersion strengthened copper electrode
designs for galvanized steel welding. Conference Paper N o 9, Sheet Metal Welding
Conference III, American Welding Society, Detroit, October 1988.
[4] Kimchi, M., Gould, J.E. The evaluation of resistance spot welding electrode
materials for welding galvanized steels. Conference Paper N o 8, Sheet Metal
Welding Conference m , American Welding Society, Detroit, October 1988.
[5] Howes, S.W. The resistance spot weldability of Weirton Steel Corporation Zn-5%
aluminium coated steel. B H P Steel Research and Technology Laboratory Report N o
1060, July 1989.
[6] Howes, S.W., Lake, J.S.H. Degradation of electrodes when resistance spot welding
metallic coated sheet steels. Conference Paper N o 10, Sheet Metal Welding
Conference UJ, American Welding Society, Detroit, October 1988.
[7] A W S Welding Handbook, Welding Technology, Eighth Edition Volume 1.
[8] Dickinson, D.W. Welding in the automotive industry. Report on AISI Project N o
1201-4O9C, Republic Steel Corporation, August 1981.
[9] Beatson, E.V. A n introduction to quality control systems in resistance welding.
Paper presented at the Resistance Welding Control and Monitoring Seminar, T W I
1977.
[10] Rivett, R.M., Johnson, K.I. Quality control for resistance welding — A review.
Conference Paper N o 4, Sheet Metal Welding Conference I, American Welding
Society, Detroit, 1984.
115

[11] Tsai, C.L., Dai, W.L., Dickinson, D.W., Paritan, J.C. Analysis and development of
a real-time control methodology in resistance spot welding. Welding Research
Supplement, December 1991, pp 339-s to 351-s.
[12] Natzler, P.J. The monitoring and in-process control of resistance welding.
Advanced Welding Systems. Proceedings of 1st International Conference, London,
November 1985, Paper No 48, pp 513-519.
[13] Appleby, G.W. Recent developments in resistance welding controls to improve
standards of welding quality and reliability. Conference Paper No 23, Welding
Institute Conference on Steel Sheet and Strip Welding, Kenilworth, March 1972.
[14] Gedeon, S.A., Sorenson, CD., Ulrich, K.J., Eager, T.W. Measurement of
dynamic electrical and mechanical properties of resistance spot welds. Welding
Journal, December 1987, pp 378-385.
[15] Publicity Brochure, Hirst weld current meter M K V I , Hirst Electric Industries Ltd,
Sussex, England.
[16] Nakata, S., Nishikawa, M., Kurozumi, Y., Okuna, H. Monitoring of spot weld
quality by measurement of voltage between electrode tips. Transcript of The Japan
Welding Society, April 1979, pp 58-66.
[17] Nakata, S., Nishikawa, M., Horie, J., Kawasaki, M . Quality assurance in spot
welding by detecting voltage between electrode tips. JJW Document 111-639-80,
1980.
[18] Johnson, K.I. Automatic spot weld correction. Metal Construction, February 1977,
pp 70-71.
[19] Rivett, R.M. In-process spot weld control. Metal Construction, May 1980, pp 230-
234.
[20] Ganbowski, F.J., Williams, N T . Advantages in resistance spot and seam welding
of zinc coated steel strip. Sheet Metal Industries, November 1972, pp 692-705.
[21] Bourtorwick, M.J. Weld quality monitoring of resistance welding. Conference
Paper N o 14. Sheet Metal Welding Conference HI, Detroit, October 1988.
116

[22] Broomhead, J.H.W., Dony, P.H. Resistance spot welding quality assurance.
Welding and Metal Fabrication, July 1990, pp 309-314.
[23] Johnson, K.I. Resistance welding quality control techniques. Metal Construction
and British Welding Journal, May 1973, pp 176-181.
[24] Digimetrics NDT-700 Publicity Brochure, N.H. Elliot Electronic Enterprises Pty Ltd,
N S W , Australia.
[25] Spotrite 2030 Monitor Control Unit. Publicity Brochure, A R O Machinery Co Ltd,
Castelnau, London.
[26] Spotrite 2043 Monitor Control Unit. Publicity Brochure, A R O Machinery Co Ltd,
Castelnau, London.
[27] Weldamatic MP16P Publicity Brochure, British Federal Ltd, Castle Hill Works, West
Midlands.
[28] Hain, R. Resistivity testing of spot welds challenges ultrasonics. Welding Journal,
May 1988, pp 46-50.
[29] Bhattacharya, S., Andrews, D.R. Significance of dynamic resistance curves in the
theory and practice of spot welding. Welding and Metal Fabrication, September
1974, pp 296-301.
[30] Andrews, D.R., Bhattacharya, S. Resistance weld monitoring for production. Metal
Construction and British Welding Journal, May 1993, pp 172-175.
[31] Andrews, D.R. Spot and projection welding quality assurance. Sheet Metal
Industries, July 1978, pp 781-784.
[32] Hawkins, I.L. Superior quality production spot welding using adaptive control.
Conference Paper N o 22. Sheet Metal Welding Conference I, Detroit, November
1984.
[33] Beevers, A. Temperature measurement to determine post weld heat treatment
conditions for spot welds. British Welding Journal, April 1963, pp 173-183.
[34] Snee, R.K. Infrared monitoring of resistance spot welding. Metal Construction and
British Welding Journal, April 1972, pp 142-148.
117

[35] Broomhead, J.H.W., Dony, P.H. Resistance spot welding quality assurance.
Welding and Metal Fabricator, July 1990, pp 309-314.
[36] Stiebel, A., Ulmer, C , Kodrack, D., Holmes, B.B. Monitoring and control of spot
weld operations. Conference Paper No 4. Sheet Metal Welding Conference II,
Detroit, 1986.
[37] Johnson, K.I., Hannah, M.D., Roswell, S.L., Dinsdale, W . D . Properties of
splashed resistance welds. Metal Construction and British Welding Journal,
November 1973, pp 401-406.
[38] Janota, M . Adaptive system of resistance welding control. Conference on Advances
in Welding Processes, Harrogate 1978.
[39] Janota, M . Adaptive control for assurance of quality in resistance welding. Welding
Research Institute, Batislava, Czechoslovakia. Source unknown.
[40] Taylor, J.L., Xie, P. A new approach to the displacement monitor in resistance spot
welding of mild steel sheet. Metal Construction, February 1987, pp 72-75.
[41] Havens, J.R. Controlling spot welding quality and expulsion. S M E Paper AD76-
279, 1976.
[42] Vahaviolos, S.J. Applications of acoustic emission to factory automation and process
control. Materials Evaluation, December 1984, pp 1650-1655.
[43] Wrigley, A.L. G M using acoustic-type adaptive welding controls. American Metal
Market/Metal working News, March 21st, 1977, p 18.
[44] Bull, C.E., Stacey, K.A., Calcraft, R. On-line weld monitoring using ultrasonics.
British Journal of N D T , Vol 35, N o 2, February 1993 pp 57-64.
[45] Hain, R. Resistivity testing of spot welds challenges ultrasonics. Welding Journal,
May 1988, pp 46-50.
[46] Allen, L.A. Ultrasonic inspection of resistance spot welds. Conference Paper N o 3.
Sheet Metal Welding Conference II, Dearborn, Michigan, 1984.
[47] Williams, N.T. Recent developments in the resistance welding of zinc coated steels.
British Steel Corporation Report SM/881/D.
118
[48] Freytag, N.A. Spot welding galvanized steel. 7th International Conference on hot-
dip galvanizing, Paris 1964.
[49] Schueler, A.S. Welding steels with thin metal coatings. Welding Journal, August
1963, pp 378-384.
[50] Gedeon, S.A., Schrock, D., LaPointe, J., Eager, T.W. Metallurgical and process
variables affecting the resistance spot weldability of galvanized sheet steels. S A E
Technical Paper Series 840113, February 1984.
[51] Johnson, I.W. Spot welding of carbon steel. Welding Journal, March 1960, pp 89-
96.
[52] Gould, J.E. The effect of welding time and electrode diameter on electrode life when
resistance spot welding galvanized steel. Conference Paper N o 12, Sheet Metal
Welding Conference II, American Welding Society, Detroit, October 1986.
[53] Nealon, C.S., Lake, J.S.H. Resistance spot welding tip lives for Z I N C A L U M E
coated qualities. B H P Steel Research and Technology Report N o 950, January 1987.
[54] Bowers, R.J., Eager, T.W. Non-uniform current distribution in spot welding.
Conference Paper N o 15, Sheet Metal Welding Conference II, American Welding
Society, Detroit, October 1986.
[55] Lake, J.S.H. B H P Sheet and Coil Products Division overseas trip report, May 1989.
[56] Greenwood, J.A. Temperatures in spot welding. British Welding Journal 8 (6),
1961, pp 316-322.
[57] Nied, H.A. The finite element modelling of the resistance spot welding process.
Welding Journal, 63 (4) 1984, pp 123s-132s.
[58] Lynch, R.F., Goodwin, F.E. Galfan coated steel for automotive applications, S A E
Technical Paper Series 860658 (Feb 1986).
[59] Taylor, R., Morrison, B.R. Microcomputer controlled spot welder instrumentation.
B H P Sheet and Coil Products Division, Research and Technology Centre, Report No
910, September 1989.
119

[601 Maddrell, E.R. A review of the techniques and applications of surface roughness
measurement. B H P Sheet and Coil Products Division, Research and Technology
Centre, Report N o 1039, January 1991.
[61] Adept Vision Reference Guide, Version 10.1. Adept Technology Inc. San Jose,
California USA, February 1991.
[62] Welding Zinc Coated Steel. Handbook of the Australian Zinc Development
Association/John Lysaght (Australia) Limited.
120

A P P E N D I C E S
1. Howes, S.W. Electrode Erosion During Resistance Welding of Metallic Coated
Steels. Paper presented at the Institute of Engineers Australia, Fifth International
Conference on Manufacturing Engineering 1990, Wollongong 11-13 July 1990.
2. Howes, S.W., Siores, E. Resistance Weld Design and Product Quality. Paper
presented at the International Mechanical Engineering Congress, Sydney 8-12 July
1991.
3. Howes, S.W. Improving Resistance Welding of Coated Steels. Paper presented in
the Australasian Welding Journal, Fourth Quarter 1992.
4. Howes, S.W., Siores, E. Resistance Welding — Refurbishing a Mature
Technology. Paper presented at the W T I A Conference, University of Wollongong,
1993.
5. Finlay, R., Samandi, M., Howes, S. Optimising Resistance Spot Weldability of
Metallic Coated Steels Through Electrode Chemistry. Paper presented at combined
WTIA/AINDT Conference, Melbourne, October 1994.
6. Product Data Sheet for ZINCANNEAL G3N.
7. Technical Data Sheet 1 for J47 Copper Alloy.
8. Technical Data Sheet 2 for J47 Copper Alloy.
9. Product Data Sheet for ZINCANNEAL G2.
10. Block schematic of BHP Research and Technology Centre's Resistance Spot Welder
and ancillary equipment
11. Technical specification for Form Talysurf 120 m m Traverse Unit.
12. Electrode Tip Carbon Paper Impression Diameter Results.
13. Profilometer Weld Impression Diameter Results — Initial Electrode Tip life Test
14. Vision System Weld Impression Diameter Results - Initial Electrode Tip Life Test
15. X-Ray Weld Nugget Size Results — Initial Electrode Tip Life Test
16. Ultrasonic C-Scan Weld Nugget Size Results — Initial Electrode Tip Life Test
17. Peel Test Results Measured Through Vernier Callipers.
121

18. Vision System Weld Impression Diameter Results - Second Electrode Tip Life Run.
19. Tensile Shear Test Results.

APPENDIX I
123

Tr* Institution ol Engineer* Auttrata Fifth International Conference on Manufacturing Engineering iggn Wollongong 11 -13 July 1890
Electrode Erosion During Resistance Welding of Metallic Coated Steels
SW HOWES Research Officer, BHP Coated Products Division. Research & Technology Centre, Port Kembla
S U M M A R Y Rapid erosion of electrodes is an Inherent problem facing sheet metal fabricators engaged in the resistance ipot welding of metallic coated steels. The rate of degradation is closely linked to the composition of the metallic coating of each steel type but can be controlled to some extent through optimisation of welding parameters. Some parameters are found to be unique to a particular material. This study examines the influence of electrode tip geometry, and current upsloping on the weldability of AI-*»5% Zn coated and galvanized steels. Reducing electrode tip included angle was associated with an Improvement in electrode life on both steels. An increase in tip diameter produced a marked increase in electrode life on the AI-*»5% Zn coated steel but not the galvanized steel. The addition of current upsloping to the welding schedule of these steels did not improve their weldability.
I. I N T R O D U C T I O N
The formation of a weld in any resistance welding operation is dependent on the heat generated due to the electrical resistance of the materials being joined. The total heat generated (H) in joules, is given by the equation:
H = l2Rt
where 1 = welding current (amperes) R = electrical resistance (ohms) t = time for current flow (seconds or cycles).
To maintain sufficient heat for welding, any decrease in electrical resistance requires an increase in welding current and/or welding time. The overall electrical resistance and contact resistances during resistance spot welding of uncoated steels are usually quite high in comparison to those experienced during welding of metallic coated steels. This is represented schematically in Figure I. There is a need then to use higher welding currents/times to achieve weld sizes of acceptable quality similar to those produced on uncoated steels of similar thickness. This is easily achieved but at great expense to electrode life. The heat generated at the electrode sheet surface interface provides the driving force for alloying to occur between the metallic coating of the sheet and the copper electrode. This causes erosion or pitting of the electrode face, an initial rapid increase in electrode tip diameter due to build-up of alloy at the periphery of the face and a subsequent deterioration in weld quality as welding progresses [ll High volume Industries joining large tonnages of metallic coated steels are then faced with having to frequently stop production at welding stations in order to redress or replace worn electrodes. Also indicated in Figure 1 is the much smaller temperature difference between the electrode/material interface and faying surface (material/material interface) for the metallic coated steeL This translates to a narrow welding range for these steels and a higher chance of metal expulsion at the surface.
To improve the weldability of these steels and to make them more acceptable to fabrication industries, it is necessary to examine resistance spot welding parameters and to determine their effects on electrode life. It is important also to determine if the various metallic coated steels react similarly to any one parameter or a change in parameters. Corrective steps can then be
taken in order to reduce the frequency of electrode redressing.
Figure I Schematic representation of resistance spot welding showing the points of electrical resistance and the resulting temperature profile R j - contact resistance of faying surfaces R 2 - contact resistance of electrode/material interface R 3 - electrical resistance of material
This study examines the effects of welding current upslope, electrode tip diameter, and electrode tip angle on the wettability of Al-45% Zn coated and hot dipped galvanized (HDG) steels.
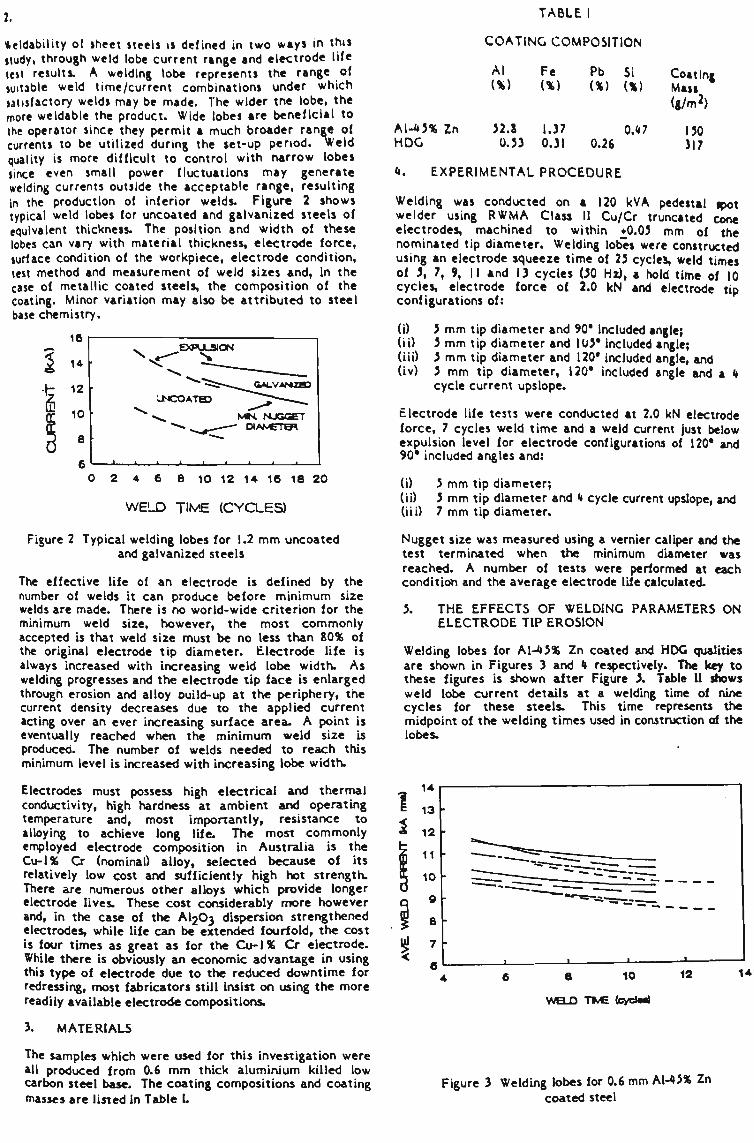
2. TABL E I
Voidability of sheet steels is defined in two ways in this study, through weld lobe current range and electrode life test results. A welding lobe represents the range of suitable weld time/current combinations under which satisfactory welds may be made. The wider tne lobe, the more weldable the product. Wide lobes are beneficial to the operator since they permit a much broader range of currents to be utilized during the set-up period, weld quality is more difficult to control with narrow lobes since even small power fluctuations may generate welding currents outside the acceptable range, resulting in the production of interior welds. Figure 2 shows typical weld lobes for uncoated and galvanized steels of equivalent thickness. The position and width of these lobes can vary with material thickness, electrode force, surface condition of the workpiece, electrode condition, test method and measurement of weld sizes and, in the case of metallic coated steels, the composition of the coating. Minor variation may also be attributed to steel base chemistry.
C O A T I N G COMPOSITION
16
14
i;:
_E»>ULSION
MH NUGGET DiA cTen
O 2 4 6 8 10 12 14 16 18 20
WELD TIME (CYCLES)
Figure 2 Typical welding lobes for 1.2 mm uncoated and galvanized steels
The effective life of an electrode is defined by the number of welds it can produce before minimum size welds are made. There is no world-wide criterion for the minimum weld size, however, the most commonly accepted is that weld size must be no less than 80% of the original electrode tip diameter. Electrode life is always increased with increasing weld lobe width. As welding progresses and the electrode tip face is enlarged through erosion and alloy ouild-up at the periphery, the current density decreases due to the applied current acting over an ever increasing surface area. A point is eventually reached when the minimum weld size is produced. The number of welds needed to reach this minimum level is increased with increasing lobe width. Electrodes must possess high electrical and thermal conductivity, high hardness at ambient and operating temperature and, most importantly, resistance to alloying to achieve long life. The most commonly employed electrode composition in Australia is the Cu-l% Cr (nominal) alloy, selected because of its relatively low cost and sufficiently high hot strength. There are numerous other alloys which provide longer electrode lives. These cost considerably more however and, in the case of the AI2O3 dispersion strengthened electrodes, while life can be extended fourfold, the cost is four times as great as for the Cu-lX Cr electrode. While there is obviously an economic advantage in using this type of electrode due to the reduced downtime for redressing, most fabricators still insist on using the more readily available electrode compositions. 3. MATERIALS The samples which were used for this investigation were all produced from 0.6 m m thick aluminium killed low carbon steel base. The coating compositions and coating masses are listed in Table L
Al-45% Zn HDG
Al
52.3 0.33
Fe (%)
1.37 0.3I
Pb Si (%) (%)
0.26 0.47
Coating Mass (g/m2)
130 3I7
4. E X P E R I M E N T A L P R O C E D U R E
Welding was conducted on a 120 kVA pedestal ipot welder using R W M A Class II Cu/Cr truncated cone electrodes, machined to within +0.03 m m of the nominated tip diameter. Welding lobes were constructed using an electrode squeeze time of 23 cycles, weld times of 3, 7, 9, 11 and 13 cycles (30 Hz), a hold time of IO cycles, electrode force of 2.0 kN and electrode tip configurations of:
(i) 5 mm tip diameter and 90* included angle; (ii) 3 m m tip diameter and 105* included angle; (iii) 5 m m tip diameter and 120* included angle, and (iv) 5 m m tip diameter, 120* included angle and a 4
cycle current upslope.
Electrode life tests were conducted at 2.0 kN electrode force, 7 cycles weld time and a weld current just below expulsion level for electrode configurations of 120* and 90* included angles and:
(i) 3 mm tip diameter; (ii) 5 m m tip diameter and 4 cycle current upslope, and (iii) 7 m m tip diameter.
Nugget size was measured using a vernier caliper and the test terminated when the minimum diameter was reached. A number of tests were performed at each condition and the average electrode life calculated.
5. THE EFFECTS OF WELDING PARAMETERS ON E L E C T R O D E TIP EROSION
Welding lobes for Al-45% Zn coated and HDG qualities are shown in Figures 3 and 4 respectively. The key to these figures is shown after Figure 5. Table U shows weld lobe current details at a welding time of nine cycles for these steels. This time represents the midpoint of the welding times used in construction of the lobes.
8 10
WBJ3 TtvtH Ccyctoei
12
Figure 3 Welding lobes for 0.6 m m Al-45% Zn coated steel

8 10
WELD TIME (cyclM)
14
Figure 4 Welding lobes for 0.6 m m H D G steel
Key: 120* included angle electrode tip 103* included angle electrode tip 90* included angle electrode tip 120* included angle electrode tip plus current upslope
TABLE 11
vVELD LOBE CURRENT DETAILS AT 9 CYCLES
Electrode tip angle
120*
105*
90*
120* plus upslope
V.P R \7
V.P R W
MP R W
MP R
nl-45%Zn Coated
10.3 9.7-10.9 1.2
10.0 9.4-10.6 1.2
9.7 9.0-10.4 1.4
9.5 8.9-10.1 1.2
HDG
10.5 9.6-11.3 1.7
10.0 9.4-10.6 1.2
9.7 9.0-10.3 1.3
10.5 9.9-11.1 1.2
Key:
MP R W
- welding lobe midpoint in k amps - welding lobe range in k amps - welding lobe width in k amps
rapid electrode degradation (2). It is generally ttrttH mat the uuncateo cone electrode profile (Figure J) *an an included angle between %' and 140*, is the optin-.um shape lor weloing metallic coated steels [)] and was therefore used in this study.
5.1 Electrode Tip Geometry
The search for an electrode shape which exhibits long life, has good mechanical strength and is easily maintained is still continuing. From a previous study at the BHP Research and Technology Centre, the life of the extended tip or pimple tip electrode shown in Figure 5, when welding steel with from 5 to 100% aluminium in the coating was found to be superior over that of the more commonly used truncated cone electrode- It could also be expected to perform in a similar manner on any other metallic coated steel, however, this profile lacks mechanical strength and can create welding difficulties if misalignment occurs. This eliminates the extended tip electrode from industrial use. When electrode alignment or part fit-up is a problem, radiused electrodes can be used. Zinc build-up on these is quite rapid however, changing the shape of the electrode face leading to
RADIUSED TRLNCATBD PIM=LE
Figure 5 Resistance spot welding electrode tip profiles
Previous research on the truncated cone profile has suggested that the ratio of current oensity at the electrode face edge to that at the face centre is a strong function of the cone angle I H Figure 6 indicates that the lower the included angle, the more uniform the current distribution across the electrode face. It follows that alloying across the face and hence erosion woula also be more uniform. This should retard the electrode degradation process and extend electrode life since a non-uniform current distribution would more rapidly change tne shape of tne electrode.
OJPttiKT DENS'TY VS ITJCUJDeD ANGLE
•
1
.,.., _J
si
.
* I * 4-W 3
o
I' 0 30 60 M 120 ISO
MO_UDED CONE ANGLE (degress)
Figure 6 Variation of the ratio of current density (3) at the electrode face edge to the current density at the face centre with included angle in truncated cone electrodes. Data from Bowers and Eager 1986 [21
Results from this study showed that changing electrode tip included angle had little effect on weld lobe width, but did affect both lobe position and electrode life. The results of electrode tip life tests are shown in Figure 7. Decreasing the included angle pushed the welding lobe to lower current levels for both Al-45% Zn and H D G steels (Figures 3 and 4 and Table II). Electrode life was also found to improve to varying degrees with lowering of the included tip angle. In conjunction with lowered included angle, the use of the larger tip diameter (7 m m ) produced the best improvement in electrode life on each steel type-Tip diameter selection usually depends only on the size of weld required, which can De limited by the design of a product such as flange widths and on sheet thickness. The results of this work however, have shown that the composition of the metallic coating also plays a role in the selection process.

Zn HOG
U!
i-
1400
1200
1000
800
600
400
200
0
•
•
' •EvH
A B C TIP CONDITION
KEY A:6mm TIP B:7mm TIP C:5mm TIP (4 CYCLE UPSLOPE)
A B C
TIP CONDITION
:90° INCLUDED ANGLE
:120° INCLUDED ANGLE
Figure 7 Electrode tip life test results
In this study, the 120* and 90* included angle tips produced approximately a 4-fold increase in tip life with the increase in tip diameter from 5 m m to 7 m m for welding Al-45% Zn coated steel (Figure 7). For the H D G steel, there was little difference in electrode life for increased tip diameter.
5.2 Welding Current Upslope
Upslope control is the gradual increase of the welding current magnitude during the initial period of current flow in each spot weld (Figure 8). The rate of current change and the time interval involved are readily adjustable on control panels of spot welders with this facility. Upsloping is said to assist in melting and displacing the metallic coating, enabling tne spot welding electrodes to gradually seat before maximum current is reached [51 This is believed to minimise the heating between the electrode and workpiece and therefore minimise the rate of alloying between the metallic coating and the copper electrodes. However, results from weld lobe construction and electrode life tests showed that not all metallic coated steels benefit from upsloping.
TIME
Figure 8 The location of current upslope (u/s) in the resistance spot welding schedule
Lobe width did not change with the addition of current upslope for Al-45% Zn coated steel (Figure 3) but narrowed for H D G (Figure 4) steel and there were no appreciable changes in electrode life. The welding lobe
for Al-45% Zn coated steel, however, was shifted to a slightly lower current range, offering the possibility of some saving in power cost to tne faoricator.
6. COMMENTS
Extended electrode life on both steels with reduction in electrode tip included angle may oe attriouted to more uniform erosion over the electrode face and possibly more easily detached alloy buila-up at the electrode periphery. This could be due to the higher angle of incidence made Detween tne electrode shoulder and sheet surface. By periodically removing the build-up, current density is kept high and wela size maximised for the surface condition of the electrode at any given time during welding, nlso for a given amount of electrode erosion increase in tip diameter is less for an included angle of 90*, so the decrease in current density is less than it would be for an included angle of 120*. On the strength of the results presented, preference should be given to the use of the 90* electrode tip. Research is continuing into possible causes for the difference in welding performance of n D G steel over Al-45% Zn coated steel with increasing tip diameter. Certainly, no oenefit can be seen in using larger than currently recommended tip diameters for welding h D G steels. Employing larger Diameters, while not affecting electrode life, would only result in the need to use higher welding currents at cost to the faoricator. It is highly recommended however, that for the Al-45% Zn coated steel, consideration oe given to the use of slightly larger tip diameters if the design of the components to be joined allows it. Special care should then be taken to accurately machine and align the electrode faces, as obtaining uniform electrode/sheet surface contact becomes more difficult with increasing tip diameters.
7. CONCLUSIONS Optimum conditions for resistance spot welding of Al-45% Zn coated and H D G steels have been established through the construction of welding lobes and electrode tip life tests. The results have shown that:
(i) electrode life is greatest for the Al-45% Zn coated steel welded with electrodes of 7 m m tip diameter and an included angle of 90*;

(I() the use\-ni tru,ncatevi cone electrode* with an included angleof 1(J" iill#ri " improvement in weldability over the 120* electrode profile on both steels;
(ii!) the use of larger up diameters proves beneficial in improving the life of electrodes used to weld M - U 3 % Zn coated steel but not H D G steel;
(iv) the addition of current upslope to the welding schedules did not improve the weldability of these steels.
J. ACKNOWLEDGEMENTS
The author wishes to thank the management of BMP Steel Coated Products Division for permission to publish the information contained in this paper and Dr J.S.H. Lake for his suggestions during its preparation.
*. R E F E R E N C E S
I. Williams, N.T. "Recent Developments in U* Resistance Welding ol 2inc Coated Steels". Bntjvr. Steel Corporation Report No. SM/8S1/D.
2. Freytag, N.A. "Spot Welding Calvanized Ste*.-. Paper presented at the 7th IntcrnatioMi Conlerence on Hot Dip Galvanizing, Paris 1964.
). Schueller, A.W. 'Welding Steels with Thin Metal Coatings", welding Research Supplement, August 1963.
i*. Bowers, RJ. and Eager, T.W. "Non-Uniform Current Distribution in Spot welding". Conlerence Proceedings, Sheet Metal Welding Conference II. Detroit, USA October 1986.
3. Lynch, R.F. and Goodwin, F.E. "Galfan Coated Steel for Automotive Applications". S A C Technical Paper Series 860658, February 1986.

APPENDIX 2
124
international Mechanical Engineering Congress Sydney 8-12 July 1991
Resistance Weld Design and Product Quality
S.W. HOWES Senior Research Officer, BHP Coated Products Division
E. SIORES Mechanical Engineering Department, The University of Wollongong
ABSTRACT
Resistance welding is the most widely used joining process which is currently experiencing a resurgence in today's ouality-conscious environment The process appeals to production engineers, designers and equipment specifiers in many industries because of its process record of consistent quality production at high speeds. For this it is considered to be the most cost-effective way of joining light-gauge sheet metal and especially high strength coated steels and aluminium. L o w volume industries (eg aerospace) employ resistance welding together with sensing means for both monitoring and feedback control purposes. O n the other hand mass production industries (eg automotive) have yet to implement such adaptive control facilities. Recently, however, the strive for increasingly higher productivity and quality levels has forced mass production industries to turn to such in-process control facilities. These requirements have led to the development of sophisticated but simple to use microprocessor controlled systems capable of both monitoring and controlling the process input and output parameters during the welding cycle. This article describes the various approaches and equipment available today. The aim is to encourage medium size rnanufacturing industries in Australia to implement such alternative cost effective production solutions for the sake of their survival in the market place.
1. INTRODUCTION
The increasing demand of consumers for quality welded products has seen a resurgence in the resistance spot welding technique with n e w and innovative methods being developed to ensure spot weld integrity. This technique, normally used to join thin gauge sheet steel has been ill-used for many years, more than likely because of the relatively forgiving nature of uncoated materials. Even now, it is not uncommon to observe sheet-metal fabricators, involved in high volume welding industries, spot welding with excessively high welding currents with subsequent weld metal expulsion taking place. While this is a visual sign that at least a weld is occurring, there appears to be little regard for the damage caused to electrodes. If a watchful eye is not kept on electrode condition then as welding progresses weld quality will deteriorate. Exacerbating this effect is the conversion by many to the range of metallic coated steels with their inherent anti-corrosion properties. It has been shown that alloying takes place between the metallic coating of the steel and the copper electrodes and depending on the composition of the coating, the degradation of the electrodes through erosion of brittle alloy layers formed, can be quite rapid (1). The rate of diffusion of alloying elements into the electrodes is heat dependent It is therefore even more important to optimise the spot welding Eammeters to extend the electrode life when using these steels. : is also worthy to note that each metallic coated steel can have
its o w n unique set of welding parameters and that a parameter such as current upslope m a y not be beneficial during welding of some steels (2). Current upslope, available on most modern spot welding machines is simply used to ramp the welding current up to a rr»«T"f"""' point and is said to aid the electrodes to bed-in to the sheet surface (3).
The simple shop floor tests performed on spot welds are no longer considered a satisfactory means by which weld quality can be examined and maintained. Tests such as the peel and chisel test are considered by many to be unreliable indicators of weld quality and require time-consuming and costly destructive testing in order to obtain a result Material on which spot welds are found to fail by face-fracture mode for example, can be shown to possess quite a high Ductility Ratio (D.R.) this being a more accurate measure of weld strength (notch sensitivity of spot welds). This test too however, is quite time consuming both in test sample preparation and testing time and has not been widely adopted. Low volume industries such as the aerospace industry have for some time realised the benefits of employing resistance spot weld monitoring and in many cases feedback control devices to streamline production welding without the need for destructive testing of weld joints. Recemly however, the strive for increasingly higher productivity and quality levels has forced higher volume welding industries such as the automotive and appliance industries to do likewise.
This paper describes the various approaches and equipment available today with the hope that it will aicourage medium sized manufacturing industries in Australia to implement such alternative, cost effective production solutions for the sake of their survival in the market place.

I, PROCESS MONITORING AND CONTROL SYSTEMS
There are a number of definitions for monltcrina but all basically relate back to weld quality. Dickinson (4) defines the monitoring process as "one which gives Information about the quality of the product". Beatson (5) states "any sample monitor must look at some phenomenon or characteristic which occurs or changes as a result of the start and growth of a weld and whose output bears a definite relationship to the weld diameter, this usually being taken as a production cirterion of weld quality". A resistance welding monitor does not solve welding problems, it simply highlights them by providing a track record of every spot weld made. It is then up to the operator to recognise any anomaly and In the absence of a control device, adjust the process accordingly. The characteristics of the ideal monitor and the exact parameter which gives the best Indication of weld quality, has been debated by many, however, most systems display the magnitude of the monitored parameter on some form of meter. The ideal relationship between monitor count (the critical parameter indicated by meter deflection) and weld quality (nugget diameter) is shown in Figure 1. The relationship should be relatively linear, should be similar for variation of all those parameters which could affect weld quality in production such as mains fluctuations, electrode wear and current shunting and should have as narrow a scatter band as possible (line A B on Figure 1) to enable prediction of weld size.
With regard to a 'control or correction system', this is defined as a unit which monitors one or more of the critical welding parameters during the weld cycle in an attempt to maintain weld quality under varying external conditions by automatically processing these parameters and using the output lo autjomatically adjust the welding conditions.
Z
O
o cc o \-
z O
s
These parameters include:
(i) electrical parameters
(ii) nugget temperature
(iii) infrared radiometry
(iv) weld expansion and contraction
(v) acoustic emissions, and
(vi) ultrasonic signals
3. ELECTRICAL PARAMETERS
In any resistance welding process, the formation of a weld relies on resistance heating. The total heat generated (H) in joules is given by the expression:
H-I^Rt
where I is the welding current (amperes),
R is the sum of the electrical resistances (ohms) in the system (material/material interface, material/electrode interfaces and bulk material), and
t is the time for current flow in seconds or cycles (50 or 60 Hz).
The electrical parameters can be measured through various means. Maintaining the welding current (I) is extremely important for good quality welds. Current density can fall on quite rapidly with wear of welding electrodes and/or alloy build up around the electrode face in the case of metallic coated steels or mushrooming of the face (plastic deformation caused through heat) observed when welding both uncoated and metallic coated steels. Current can be measured indirectly through measurement of voltage by either a toroidal coil placed around the primary or secondary of the welding machine, which is the most c o m m o n method or through the more accurate Hall-effect probe, which measures voltage across a semiconductor due to the surrounding magnetic fields. Instrumentation men electronically integrates the voltage signal to obtain current as indicated by Faradays Law: V = ^Acos8
where V is measured voltage.
dl dt
N U G G E T DIAMETER
is change in current with respect to
time,
is the area of the toxoid loop (different for Hall-effect method), and
Figure 1 Schematic representation of a typical monitor count/nugget diameter relationship
A number of process parameters have been identified as suitable for mora taring weld quality, most of which can also be employed in closed loop feedback control They all provide a non-destructive means for checking welds and either totally eliminate or at least reduce the frequency of destructive testing.
8 is the angle of the loop to the magnetic field.
The output is normally displayed as a peak current on a meter calibrated in rms units. Automatic 'current steppers' can then be employed to adjust welding current when a certain predefined minimum level has been reached however, most sheet-metal fabricators do not employ steppers. In most cases, a current meter is used only to initially set up a welding schedule and to periodically monitor the current

Direct readings of voltage are obtained through voltage probes attached to either top and bottom surfaces of the materials being welded or to both spot welding electrodes. Maximum voluge has been related to the growth of spot weld nuggets In plain carbon steels (6) and ultimately nugget tensile shear strength (tensile strength Increases with maximum voluge). Nugget diameter can also be related directly to the voluge drop to expulsion point occurring after the maximum or peak voluge (7). Weld quality monitoring through this method n not suiuble for aluminium or free zinc coated steels since there is no drop in voluge up to the expulsion point for these materials. A more appropriate method using measurement of heat input u shown by the area under a voluge-time curve in Figure 2 (3) has been suggested for metallic coated steels (8). The relationship shown in Figure 3 (3) between heat Input and nugget diameter can be used to pinpoint a weld termination point ie welding can be stopped prior to the nugget reaching a minimum nugget diameter.
There are several unlu developed in the U K and U S A for both monitoring and automatically correcting either current or voltage. The DIGIMETRICS NDT-700 developed In the U S A and S P O T R I T E developed by the British Welding Institute and A R O Machinery Co Ltd London are Just two examples of these microprocessor uniu.
Measurement of dynamic resistance appears to be one of the most widely accepted procedures as a means to control spot weld quality. Dynamic resistance li the term given io the varyingelectrical resistance of the weldment during a spot weld. The simplest form of a dynamic resistance monitor is shown in Figure 4 (9) while a typical output from spot welding on uncoated mild steel is shown in Figure 5 along with a schematic representation of the nature of the sheet/sheet surface during a single pulse weld. Through feedback control, the monitor will reject the weld and adjust the welding parameters if the trace falls outside of that prescribed as an optimum trace. To control weld quality, welding can be stopped when a particular drop in resistance is seen relative to the resistance at the peak of the curve (used for uncoated steels) or stopping at a time beyond the peak which is proportional to the time between the valley and the peak of the curve. The latter method is more commonly employed on galvanized steels.
toctiftciiia,
IkOlMfcO InMftlion VuitM* m— > » •
Umm.
i~X^—O1 stuitbl* C M I lUdilitf
TIME Figure 4 Andrews et al (9) model of the
simplest form of a dynamic resistance monitor.
Figure 2 Schematic of dynamic electrical parameters during spot welding of mild steel.
i
>
> K 3 U Ol
a S e
>
< •
ACCEPTABLE
forciuTiNa RANOE
MIN MUOGCT OU
NUSGCT DIAMETER
Figure 3 T h e relationship between weld nugget diameter and the area under the voltage curve produced during resistance spot welding.
Figure 5 A typical dynamic resistance curve for a single pulse resistance spot weld on uncoated mild steel

4. NUGGET TEMPERATURE
There have been attempts to relate the temperature of the heated surfaces to the temperature at the centre of the nugget providing an Indication of whether full growth had occurred. Thermocouples attached to either the sheet surface or electrodes provided graphical data of temperature vs time. Attachment of the probes is time consuming however. This together with the fact that electrode temperature is dependent upon the current level and welding time, each of which causes variations in electrode temperature gradients has given rise to the non-acceptance of this method in high volume welding esublishments.
S. INFRARED RADIOMETRY
Monitoring of Infrared radiation intensity emitted from the sheet surface adjacent to welding electrodes is more suitable than the temperature method as there is no need to have detectors in direct contact with the heat source. The intensity has been shown to be related to weld nugget size and tensile shear strength (5). Detectors employed are fibre optic cables mounted either in the welding electrode and transmitting radiation to an external detector or through infrared detectors focused at spots on the sheet surface immediately adjacent to the electrode. This is considered to be the more appropriate method. Typical results from this method are presented in Figure 6 (4). The amplitude of the detector trace from small nuggets is low. These nuggets possess low shear loads. High amplitude traces indicate weld metal expulsion while uuermediate trace height represents accepuble welds. Tjifrared monitoring systems suffer from the major disadvantage of being affected by dirt and fumes essentially eliminating the method for use with metallic coated steels.
az
TRACE AMPLITUDE RECORDED FROM INFRARED DETECTOR
Figure 6 Typical results from an infrared monitoring system showing the relationship between trace amplitude and weld shear strength.
6. WELD EXPANSION AND CONTRACTION
There are two opposing forces during spot welding, the natural inward movement of electrodes due to tne applied force from the welding machine and the fact that as the material becomes molten, the electrodes are free to move in closer to each other and opposing this is the force generated on the electrodes througn thermal expansion of the weld and surrounding material. The degree of separation of the electrodes, tracked through displacement transducers can be related to the volume of molten metal and can therefore be used as an indication of nugget growth. A typical trace is shown in
Figure 7 (10), along with a brief description of the events that lake place. Good welds are said to expand at an optimum rate and to an optimum level. Weld current control can then be adjusted to track these optimum levels. The main disadvantages with this method are that it can only be applied to pedestal and not gun welding machines because machine rigidity is required and it is not suiuble on welds close to edges of where pan fit-up is a problem
Figure 7 A characteristic curve of electrode movement(s) during a single pulse spot weld.
Area 2-3 Thermal expansion of workpieces causing electrodes to move apart
Point 4 Force equilibrium obtained, electrodes stationary.
Area 4-5 Temperature of fusion zone increases, electrodes moving together.
Area 5-6 Termination of weld current cooling of fusion zone leading to contraction, electrodes moving together.
7. ACOUSTIC EMISSION
There are a number of stages in the production of a spot weld during which acoustic signals are emitted, all of winch can be detected by a piezoelectric transducer mounted to the electrode holders of the welding machine. Initial electrode contact and separation, expansion, recrystaQization, solid state transformations, plastic deformation, melting, vaporization, solidification and on occasions weld cracking can all be detected. A schematic representation of an acoustic emission trace is shown in Figure 8 (4). Because the signal is highest at weld expulsion (maximum nugget growth), it is possible to terminate the weld just prior to the onset of expulsion through feedback control, controlling current There is an obvious advantage in this of maximised electrode life. General Motors, Wilmington Delaware plant in the U S A has led the way in utilizing a system developed by the Trodyne Corporation of N e w Jersey to control resistance spot welds on galvanized steels valence panels for their Cbevette vehicle.

IX PUL HON
/
Ll'iHiii U
i i i " " - " iiti.iiiiiitiinuuiiii •TIME
SL'.CTROOl / a*MP0ov»N ,-.'. / NUOOIT
IT««T J FORMATION
POST WELO »iST -... 0 ILICTROOI
WCLO TIME
Figure 8 Schematic output data of acoustic emission during resistance spot welding.
8. U L T R A S O N I C S I G N A L S
Ultrasonics is high frequency sound above the range of human hearing (2Q-25kHz per second). Spot weld pool behaviour comprising of both melting and solidification has an effect on the amplitude of ultrasonic signals emitted from the weld. An ultrasonic sensor placed in the vicinity of a weld pool can therefore act as a temperature measuring device. It is possible then to relate indirectly, the changes of the ultrasonic signal to the time of cooling of the weld nugget to some predefined temperature (11). The most common method involves mounting a transmitter crystal in the water cooled opening of one of the spot welding electrodes and mounting a receiver in the other. Ultrasonic signals are then passed through the weld zone as welding takes place. Nugget growth is then monitored through observation of the change in signal height during the weld time (5).
Ultrasonic monitoring does have some drawbacks most of which will have to be overcome before the method is fully accepted. These include the need for good surfaces to ensure adequate coupling, lack of signal resolution from thin material welds, the need to be able to define from the traces a good from a poor weld, the inability of rather fragile transducers to stand up to high volume welding and confusion of signals from extraneous signals emitted during welding of zinc coated steels.
R E F E R E N C E S
I Howes, S.W. and Lake, J.S.H. "Degradation of Electrodes When Resisunce Welding Metallic Coated Sheet Steels". Sheet Metal Welding Conference m Detroit USA, October 1988. Paper No. 10.
2 Howes, S.W. "Electrode Erosion During Resistance Welding of Metallic Coated Steels". The Fifth International Conference on Manufacturing Engineering 1990. The University of Wollongong, July 1990, Vol
3 Lynch, R.F. and Goodwin, F.E "Galfon Coated Steel for Automotive Applications". SAE Technical Paper Series 860658, February 1986.
4 Dickinson, D.W. "Welding In the Automotive Industry". Report on AISI Project No 1201-409C, Republic Steel Corporation, August 1981.
3 Beatson, E.V. "An Introduction to Weld Quality Control Systems in Resistance Welding". Paper presented at the Resistance Welding Control and Monitoring Seminar, TWI1977.
6 Nakata, S., Nishikawa, M., Kurozumi, Y., Okuna, H. "Monitoring of Spot Weld Quality By Measurement of Voluge Between Electrode Tips . Transcript of The Japan Welding Society, April 1979.
7 Johnson, I.K, "Automatic Spot Weld Correction". Metal Construction, February 1977.
8 Ganbowski, F.J., Williams, N.T. "Advances In Resisunce Spot and Seam Welding of Zinc-Coated Steel Strip". Sheet Metal Industries, November 1972.
9 Andrews, D.R., Batuchrya, S. "Resisunce - Weld Monitoring For Production". Metal Construction and British Welding Journal, May 1973.
10 Stiebel, A., Ulmer, C, Kodrack, D., Holmes, B.B. "Monitoring and Control of Spot Weld Operations". Sheet Metal Welding Conference II, Detroit USA, 1986.
11 Broomhead, J.H.W., Dony, P.H. "Resisunce Spot Welding Quality Assurance". Welding and Metal Fabrication, July, 1990.
9. C O N C L U S I O N S
The techniques described may be used for on-line monitoring of the resisunce welding process. Perturbations during the process can be detected employing these sensing devices and corrected in real-time using adaptive control techniques. The aim of such systems is to ensure that the process parameter inputs are regulated adequately during the course of welding thus, producing the required quality output This technology is now becoming commercially available. It is anticipated that these systems will penetrate production lines in the future and form an integral part of the automated/robotic welding cells in various manufacturing industries.

APPENDIX 3
125

PROCESSES
Improving resistance welding of coated steels
When spot welding metallic coated steel sheet, electrode life Is dramatically shortened compared with spot welding uncoated steel. However, Stephen Howes,
working In the Research and Technology Centre of BHP Sheet & Coil Products Division at Port Kembla, has
shown that by careful choice of welding parameters, In particular electrode tip diameter, electrode life can quite
easily be increased four-fold or more. C o n s u m e r demand for increased
corrosion protection in manufactured articles has forced m a n y sheet metal fabricators, including
those in the automotive and appliance industries, to move towards using metallic coated sheet While many advances have been made in joining sheet steel, such as laser welding, clinching and adhesives, resistance welding remains the most popular form of joining. It is a relatively forgiving process, and small deviations from optimum settings will not create disastrous results. It is also still economically viable. However, converting from uncoated steels to metallic coated steels requires re-education of both shop floor personnel and design engineers. T o achieve the quality of welds already possible with uncoated steels, resistance spot welding schedules need to be changed. The Sheet and Coil Products Divisions R T C is examining resistance spot welding to improve the weldability of its hot dipped and electrolytically coated galvanised steels. The RTC is also looking at what causes electrode degradation during spot welding. A 120 kVA pedestal spot welder linked to a computer which monitors each weld has been used, providing insights into the effects of various welding parameters. Electrode degradation
Many thousands of spot welds can be achieved from the one set of electrodes when employed to join uncoated steel sheet but a change to metallic coated steel sheet may mean as little as 200 welds from a pair of electrodes before
By Stephen Howes
Figure 1. Resistance spot welding electrode tip profiles.
redressing or replacement is necessary All zinc coated steels will rapidly degrade the electrodes to varying degrees depending on the composition of the steel coating. T h e increase in welding time and current required to spot weld galvanised steels provides the driving force for alloying to take place between the copper electrodes and the metallic coating of the steel.
The alloy layers developed for the electrode working faces are complex in nature but it is clear that the presence of aluminium, even in small quantities, in the metallic coating composition can have a detrimental effect on the life of electrodes. Aluminium can form brittle pockets on the electrode face and these pockets can be stripped from the face leaving voids on retracting the electrode away from the material being welded. This erosion process continues with each weld and weld quality progressively deteriorates. This is typical of Zn-55 per cent Al coated, hot dipped galvanised steel, but it will be seen that through careful selection of welding parameters, the life of electrodes employed to weld
this steel can be markedly improved. A similar erosion process takes place
on electrodes used to weld other galvanised steel types — such as free zinc coated, hot dipped galvanised, fully iron alloyed (galvanneal), hot dipped galvanised and electrolytically zinc coated steel — but the small amount or total absence of aluminium in the steel coating of these steels means the erosion rate is much slower. The rate of electrode degradation is most rapid for Zn-55 per cent Al coated steel followed by free zinc coated, hot dipped galvanised steel and is least for galvannealed and electrolytically zinc coated steels. The high iron content of the galvannealed steel coating contributes to the lowering of the electrode degradation rate when welding this steel type.
In addition to this erosion process is the gradual build-up of alloy around the periphery of the electrode tip. As the build-up progresses, the tip diameter of the conventionally used truncated cone electrode (Figure 1) increases. In the absence of automatic current stepper devices, the current density progressively decreases and again weld quality deteriorates. The use of radiused or domed electrodes should be avoided on galvanised steels as the rate of diameter change with alloy build-up is most rapid with this type of electrode. They should only be employed where part fit-up is quite poor.
Parameters under study The parameters — and their effects
on spot weldability — under study at the R T C are electrode tip diameter, current upslope and electrode tip angle, all of which have been the subject of some controversy.
AUSTRALASIAN WtlDING JOURNAt, fOUTCTH QUARTER 1992

PROCESSES
The selection of electrode tip diameter dependa on a number of factors, including the size of the weld required, the sheet thickness and the design of the component being welded — eg, minimum flange widths may be desirable.
Current upslope is the gradual increase of the weld current magnitude during the initial period of current flow in each weld. Introducing this into the welding schedule assists in melting and displacing the metallic coating, enabling the electrodes to gradually bed into the sheet surface before m a x i m u m current is reached. This technique is believed to reduce alloying rates between the metallic coating and electrode as electrode/ workpiece heating is minimised. While the truncated cone electrode profile is generally accepted as the optimum configuration for spot welding galvanised sheet, there has been considerable interest in the effect of electrode angle on weldability. Bowers and Eager (Non Uniform Current Distribution in Spot Welding. Conference Proceedings, Sheet Metal Welding Conference II, Detroit, US, October 1986) through their stud
ies of current distribution ncnmtt an electrode face suggest that aa electrode angle gets smaller, tip life improves.
Bowers and Eager found that current density was progressively more uniform across the working face of the electrode with decreasing angle, and hence electrode wear was more uniformly spread across the face. It will be seen, however, that this is not the case for all metallic coated steels.
Experimental procedure The materials examined in the R T C
study were all of a 0.60 m m base thickness. The electrodes used were R W M A Class II (Cu-0.8 per cent Cr) truncated cone type. T h e effect of parameter change on weldability was measured through electrode life testing conducted at 2.0 k N electrode force, seven cycles (50 Hz) weld time and a weld current just below the expulsion level for electrode configurations of 120 and 90 (shown as x in Figure 1) and (i) 5 m m tip diameter, (ii) 5 m m tip diameter and four cycle current upslope and (iii) 7 m m tip diameter.
A number of life tests were conducted at each setting using freshly
machined electrodes and the average result was determined. The end point of each life test was determined by periodically measuring the weld nugget size across major and minor axes and calculating the average diameter. When the nugget size diminished to a diameter equal to 80 per cent of the original electrode tip diameter employed, the life of the electrode was deemed to be over. The four cycle current upslope was arbitrarily chosen as an acceptable time for high volume welding. Determining the expulsion point for each life test took approximately 10 to 15 welds. These were included in the weld count.
Results The results are presented graphically
in Figure 2. While maintaining the same electrode force and welding time, a change in tip diameter from 5 to 7 m m when welding the galvannealed and elec-trogalvanised materials produced detrimental results. In particular, the elec-trogalvanised material could not be welded successfully at a 7 m m tip diameter. Weld nugget sizes were well below the minimum level of 80 per cent of the electrode tip diameter even at the start
CHECK-OUT
CEMIG 35 3-phase MIG unit with separate wire feeder. Automatic wire speed control — plus interval timer. 350A at 5 0 % duty cycle.
POWER PLASMA PL5S • Uses compressed air as plasma
gas for high economy. • Cuts mild steel up to 16mm. • Cutting current — 50A. Call n o w for your nearest supplier:
Broadway Welding Supplies
E* FOR PERFORMANCE E* FOR VALUE IE* FOR RELIABILITY
From C E M — one of Italy's leading manufacturers of welding and plasma cutting equipment — a full range of models designed to cover every need — from panel repair shops to medium and heavy fabrication shops. Value-engineered throughout to provide m a x i m u m performance per kilo. Offering proven relaibility.
TO CHECK-OUT CEM ON PERFORMANCE AND PRICE
CALL NOW!
21 Meeks Road Marrickville Sydney Phone (02) 517 2133 Fax (02) 516 2161
23 Market Street Sunshine Melbourne Phone (03)311 8011 Fax (03) 311 8799
Cnr Kerry & Beaudesert Rd, Coopers Plains Brisbane Phone (07) 875 1122 Fax (07) 274 0014
Unit 8/400 Grand Junction Rd Mansfield Park Adelaide Phone (08)3472003 Fax (08)3470576
AUSTRALASIAN WE10ING JOURNAL, FOURTH QUARTER 1992

PROCESSES
HOT DIPPED GALV.
iss i2o-i.p ma vo*up
Zn-55% Al COATED
IW 120'Hp Hi 90'iip
1400
1200
1000
800
600
400
1400
1200
1000
800
600
400
200
A S C TIP CONOITION
ELECTROGALVANIZED
A B C TIP CONOITION
GALVANNEALED
120*tip vO'tip l20Mip 90'lip
9000
8000
7000
„ 6000 t 1 5000 o o I 4000 t 3000 2000
1000
TIP CONOITION TIPCONOmON
KEY: A:5mm TIP, B:7mm TIP. C.-5mm TIP & U/SIOPE.
Figure 2. Electrode lite test results.
of thejUe test and at a weld current just below the expulsion point. Irregular expulsion from the sheet outer surfaces is thought to be the major cause of this inconsistency. It could be that the small sine coating mass of approximately 5 g/ m' on either side is quite sensitive to even small electrode misalignment. That is, if the electrodes are not in firm contact with the sheet over the full 7 m m diameter (and electrode alignment becomes increasingly more difficult with increasing diameter), then the zinc coating is easily blown away. Energy expended in doing this would mean less energy was available for weld nugget development at the faying surfaces (sheet/sheet interface). If the electrode
force was increased to 2.5 to 3.0 kN to assist the electrodes to bed in, then far better results would be achieved.
Similarly, a decrease in tip diameter to 6 m m would produce better results. There was only a marginal improvement in electrode life with increasing tip diameter during welding of the hot dipped galvanised material but the same tip diameter change produced over a fourfold increase in electrode life during welding of the Zn-55 per cent Al coated material. This increase was observed regardless of the electrode tip angle employed.
Current upslope was found to be beneficial only when welding the galvannealed material. This produced a 30 per
cent improvement in electrode life when usinK the name electrode lip diameter. No explanation can be offered as Ui why this is the only one of the material* to benefit from upslope but It could be associated with the relatively high iron content and low aluminium levels in the coating of this steel type.
It is possible that the four cycle time period chosen may not be optimum and that even greater improvements can be achieved with longer times. Productivity considerations would have to be taken into account when selecting upslope timing for use on the shop floor. While the introduction of upslope was not detrimental to electrode life when welding the remaining materials, the results indicate that there would be no benefit gained from employing it.
Bowers and Eagers findings were generally found to hold true in regard to lower electrode angles being the better performers except when welding the electrogalvanised steel. In this case, electrode life was found to deteriorate considerably when changing from electrodes with an included angle of 120 to 90 deg. This anomaly has no obvious explanation. It is obvious that during a life test, nugget size oscillates as the alloy builds up around the periphery of the electrodes, reducing current density and then shearing away when it can no longer be tolerated by the electrode. Current density then rises again and weld size recovers.
It is conceivable that electrodes with lower angles remove the build-up more easily due to the sharper angle of incidence with the sheet surface, and hence have longer life. This could explain why pimple tipped electrodes (Figure 1) with vertical sides are far superior to conventional truncated electrodes. It is unfortunate, however, that this configuration is not readily adaptable to production welding as it is easily damaged during set up and lacks mechanical strength. Discussion
Studies are continuing an the interaction of metallic coatings with other electrode compositions including Cu/Zr, Cu/Cr/Zr and aluminium oxide dispersion strengthened electrodes — all of which are currently available in the marketplace — and with other experimental compositions. Many of these studies will take place at the recently established Cooperative Research Centre for Materials Welding and Joining, using the facilities of the CSIRO Division of Manufacturing Technology, the University of Wollongong and BHP's Technology Cemtre at Port Kembla. Stephen Howes is senior research officer at BHP Steel, Sheet & Coil Products Division, Port Kembla.
AUSTRALASIAN WEIDING JOURNAl, FOURTH QUARTER 1992

APPENDIX 4
126

RESISTANCE W E L D I N G — REFURBISHING A M A T U R E T E C H N O L O G Y
by Stephen Howes BHP Steel — Sheet &. Coil Division — Research & Technology Centre
and Elios Siores
University of Wollongong — Department of Mechanical Engineering
A B S T R A C T
Resistance welding is the most widely used joining process for sheet steel and is currently experiencing a resurgence in today's quality conscious environment. The fact that it is relatively simple in operation is a cost effective technique and can be quality controlled even at the high welding rates employed in industries, such as the automotive and appliance industries, makes it appealing to production engineers, designers and equipment specifiers. The increasing trend towards employment of metallic coated steels however, presents problems not normally encountered in the past when resistance welding uncoated steels. Accelerated electrode degradation is the major concern and if left unchecked can result in inferior weld quality. The drive for higher productivity and quality levels has also forced high volume production industries to turn to in-process control facilities. These requirements have led to the development of sophisticated but user friendly microprocessor controlled systems capable of both monitoring and controlling the process input and output parameters. This paper concentrates on developing two distinct techniques for monitoring weld nugget size during resistance spot welding of metallic coated steels. These are surface profilometry (tactile sensing) and machine vision (remote sensing). The aim of this work is to encourage medium sized manufacturing industries in Australia to implement such alternative cost effective production solutions for gaining enhanced product quality through on-line process optimisation.
1. INTRODUCTION The resistance spot welding process in general, is a relatively forgiving joining technique with relatively small parameter changes not creating disastrous results. This is certainly the case for uncoated sheet steel where welding lobe widths can be quite broad and there is some degree of freedom in parameter choice. However this does not apply to the growing number of metallic coated steels. Welding parameter selection can be critical for optimum electrode life and some parameters are unique to certain metallic coated steels'". Welding lobes are characteristically narrower for this group of steels thus requiring more stringent quality monitoring and control. The tighter the lobe, the easier it is to exceed acceptable conditions.
Due to the lower contact resistance encountered
when spot welding metallic coated surfaces (galvanized steels), higher welding currents and welding times must be employed to produce welds of similar size to those being produced when uncoated steels of equal thickness are joined. These higher currents and times provide the driving force for alloy formation and build-up around the periphery of the electrode, consequently affecting current density and promoting the gradual erosion of the electrode's working face. The rate of this electrode degradation is dependent not only on parameter selection but also on the chemical composition of the metallic coating of the steel sheet*2), the electrode composition*3-4) and geometry*5). In the past it has been standard practice to monitor weld quality using destructive testing methods such as the peel, and hammer and chisel test. These are considered to be time consuming, cumbersome and unproductive techniques. When weld nugget sizes reach the predefined minimum (approximately 8 0 % of the electrode tip diameter employed), electrodes are redressed either by special redressing tools or in most cases by filing the electrode working faces to the flat position again. This latter practice is not conducive to the production of high quality welds as it often leads to misalignment of electrode faces. While the above quality monitoring procedures are still widely used, they can be grossly inaccurate and produce misleading results.
During peel testing, thin sheet steels, in particular, have a tendency to pull spot welds that have a tail. Because of this, vernier callipers cannot record a true measure of weld nugget diameter. Through this measurement technique, welding could be allowed to continue even though the minimum nugget size has already been reached. Too frequently, damage is caused to the welds using the hammer and chisel technique thus making nugget size measurement again difficult to observe. It is also worth noting that rather than destroy a component, some practitioners use scrap sheet to determine or assess weld size. Placing scrap in the welder of different size to the actual component can lead to inaccuracies as the effect of current shunting from other welds in the actual component needs to be accounted for as well as the effect of placing various dimensions of scrap in the throat of the welder.
Low volume high technology industries such as the aerospace industry have for some time realised the benefit

of employing resistance spot weld on-line monitoring devices and Tn many cases feedback control devices to sircnmlinc production welding without the need for destructive testing of weld joints. In recent times, the drive for increasingly higher productivity and quality levels has also forced higher volume industries such as ihe automotive and appliance industries to follow suit. Sonic of these are being used successfully overseas, but many arc unsuitable for metallic coated sheet steels for one reason or another as discussed below.
2. ON-LINE MONITORING TECHNIQUES DURING SPOT WELDING
On-line monitoring techniques during spot welding have taken many forms but all basically look at some phenomenon or characteristic which occurs or changes as a result of the start and growth of a weld and whose output bears a definite relationship to the weld diameter, (his being taken as a production criterion of weld quality*6). A number of process parameters and techniques have been identified as suitable for monitoring weld quality all of which provide a non-destructive means for checking welds. These parameters include:
(a) electrical parameters (voltage, current, resistance and energy)
(b) nugget temperature (c) infra-red radiometry (d) weld expansion and contraction (e) acoustic emission, and (f) ultrasonic signals (reflection, attenuation and
velocity)
Monitoring of electrical parameters has proved to be one of the most successful however these systems are generally used only on uncoated steels and for sensing the input variables of the process. Tsai et al*7) have reported that resistance or voltage characteristics of coated mild steel sheet have poor correlations to weld size. Attachment of thermocouples to the workpiece for measuring weld temperature, not only interrupts the welding procedure, but can be inaccurate due to temperature gradient variations in the electrodes resulting from periodic changes in current level and weld time*8). Also zinc fumes generated during welding of zinc coated steels con cause spurious results when infra-red detectors are employed to monitor process output. Displacement transducers used to monitor weld expansion and contraction phenomena and therefore weld volume, can only be employed on rigid pedestal type welding machines. Acoustic emission and ultrasonic based monitors have had some success on coated steels*^) but sensors are expensive and quite fragile. Incorporation of these sensors into the welding systems usually requires expensive redesign of the electrode assemblies.
3. NEW APPROACHES USING PROFILOMETRY AND MACHINE VISION TECHNIQUES
This work evaluates two further non-destructive, weld quality monitoring techniques, profilometry and vision sensing. The basic approach to the study was to
collect resistance spot weld samples during a single electrode life test on a metallic coated steel and then to establish the relationship existing between weld surface indentation or impression diameter measured by the two systems and actual weld nugget diameter, Carbon paper Imprints of the electrode tip lace were also taken to track electrode wear. The objective is to establish the feasibility of utilising the vision system only for on-line weld quality monitoring and at a later stage incorporate this into a feedback control loop to maintain weld quality In real time. The profilometer and carbon paper imprints were used essentially as a check on measurements obtained through the vision equipment. The profilometer was a machine in use at BHP's Research and Technology Centre, Port Kembla. The vision system was an advanced grey scale facility [irovided by the Illawarra Technology Corporation, ocated at the University of Wollongong.
The profilometer works on monitoring vertical movements of a stylus being dragged across a surface, in this case, the indented spot weld surface left after removing the electrode from the sheet surface. Correlation of horizontal and vertical movements of the stylus then provides a direct record of the surface profile limited in resolution primarily by the geometry of the stylus tip. The technique is quite slow in comparison with non-contact measuring systems but it does allow for a more critical look at the shape of the welded surface if needed. Measurements of indentation diameter were taken in two directions and the average diameter was recorded.
The vision system comprised of a CCD (charged couple device) camera, mounted on a tripod and placed directly over the welds for visual imaging on a monitor. Again, measurements in two directions were taken with the aid of inbuilt image analysis and processing software and the average diameter was recorded.
3.1 Experimental Procedures
The material chosen for this study was a galvannealed product of 0.80 m m base thickness and a coating mass of 80 g/m2. Composition of the base steel and coating are given in Table 1. The product is a hot dipped galvanized steel which, on leaving the coating bath, enters a furnace which keeps the zinc coating molten for some time to promote alloying of the zinc with iron in the substrate. This type of material, rich with iron in its coating, is generally characterised by excellent resistance spot weldability and is widely used in the automotive industry for inner door and floor panels, wheel housings, firewalls, and other areas of application. A typical welding lobe for this material is shown in Figure I.
The electrodes employed were of the RWMA Class II (Cu/0.8% Cr) truncated cone type machined to an included angle of 90* and a tip diameter of S.O m m .

TABLE I— CHEMICAL COMPOSITION O F TEST MATERIAL
Base Chemistry
c .07
P
.017
Mn
.17
Si
.010
s .013
Ni
.022
Cr
.015
Mo
.005
Cu
.012
SolAI
.054
Sn
.006
Nb
.008
Ti
.086
Coating Composition
Top surface Bottom surface
%A1
.16
.18
%Pb
.05
.06
%Fe
9.33 9.75
%Zn
90.4 90.0
A 120 kVA pedestal welder was used interfaced with a computer for continuous monitoring of process input parameters including voltage, welding current, electrode force and energy input.
W»id Tim* (cyclit)
Figure 1: Weld lobe 0.8 mm ZINCANNEAL® G3N ZF80
Monitoring of welding conditions, electrode wear and the collection of weld samples for submission to the profilometer and vision equipment took place during an electrode life test run. Welding took place at a current just below the metal expulsion point and at a weld time of nine cycles (50 Hz). An electrode force of 2.5 kN was employed with a squeeze time of 25 cycles and an off time of 40 cycles (time intervals between welds). Welding current was not adjusted during the run and no electrode conditioning procedures were applied prior to commencement of the life test. At selected points throughout the test, electrode wear was tracked by placing carbon paper between the electrodes and applying the weld force without the welding current turned on. Tip diameter was then measured from the impressions left by the carbon paper using a graduated eyepiece. Weld samples taken at these points were then used to collect indentation profile measurement using the abovementioned two pieces, of apparatus, namely profilometry and vision sensing, prior to undergoing a peel test for manual measurement of weld size using conventional vernier callipers.
3.2 Results Obtained
The electrode useful life was considered to be over when weld nugget diameter reached a size equivalent to 8 0 % of the original electrode tip diameter, ie when the nugget size diminished to a diameter of 4.0 mm. This occurred after approximately 4600 welds were made on strips, 1 m long by 40 m m wide. Results from carbon paper impressions left by the electrodes are presented graphically in Figure 2. Degradation of the electrodes took place rapidly up to approximately 500 welds. During the period up to the failure point, electrode diameter measurements oscillated between a low of approximately 4.3 m m and a maximum of 5.9 mm, the period of oscillation being approximately equal to 500 welds. After 4400 welds, electrode diameter grew rapidly to 5.9 mm, at which point nugget size reached the minimum acceptable diameter.
E
5
1000 2000 3OO0
Numb*r of W*Mi
4000 5000
Figure 2: Carbon paper impression diameter results
3.2.1 Profilometer Measurements
The stroke of the stylus was adjusted to scan 10 m m across each weld impression in both the longitudinal and transverse directions. A typical trace is shown in Figure 3 (weld 450 transverse direction).

I
LL nil it
II li ; l:1: *:
1
Hi m i* • mS • « k
1 --1* 1« I • • •«
ii": :i i M * " u;: a I — • -
i
Figure 3: Typical profilometer trace
Peak to peak impression diameters were measured from both longitudinal and transverse directions on each weld and the average diameter for each was calculated. The variation in average impression diameter over the duration of the life test is presented graphically in Figure 4.
1000 2000 3000
Humb.f el W.ldt
4000 5000
Figure 4: Profilometer impression diameter results
3.2.2 Vision Measurements
Longitudinal and transverse weld impression measurements were recorded in pixel spacings and then converted to distances in millimetres. The average diameter for each impression was then calculated. The results again are represented graphically in Figure 5.
4. DISCUSSION AND CONCLUDING REMARKS
Over the effective life span of an electrode used to resistance spot weld galvanneal of the type used in this study, distinctive electrode life phases could be identified. Depending on the monitoring or measurement system applied, the position of these phases, although all recognisable, vary to some extent. These phases can be referred to as a 'wear-in' phase, a 'half-life' phase, a
'maturity' phase and a 'termination' phase.
_ • E E,
I 7 s E > <
•• • • •
,INN|H
1000 2000 3000 4000 5000
Number ol Welds
Figure 5: Vision system diameter results
The vision system appeared to provide the clearest indication of these phases with a wear-in phase between 0-750 welds, half-life between 750-2000 welds, maturity between 2000-4000 welds and termination between 4000-4600 welds.
During wear-in, a rapid acceleration of tip diameter growth is observed as alloy is quickly accumulated around the electrode tip periphery. This acceleration can also be observed from carbon paper impressions of the electrode working face (wear-in period of 500 welds) and from profilometer measurements (wear-in period of 300 welds). The most consistent feature in this case, regardless of the system applied is the point of half-life, ie the point at which the average tip diameter reduces to some minimum point. This was recorded at 2200 welds using carbon paper imprints, 2100 welds using the profilometer and 2000 welds using the vision system. Maturity is represented by the period of recovery after this half-life minimum and runs for approximately the same duration as the half-life. Even in this period, cyclic growth and recovery oscillations take place as is

observed over the half-life period. These oscillations are thought lo be associated with removal and build-up of alloy at the electrode tip.
While it is evident that there is some scatter between the systems, it is difficult to determine the system which is the most accurate in predicting actual weld nugget size as each has unique measurement difficulties.
When using the carbon paper method, any alloy build-up at the tip periphery would also be imprinted and therefore would be included in the measurement of tip diameter. However, these imprints are taken in the absence of welding power and it is possible that with the power applied to make subsequent welds, the build-up could be removed. A false indication then of resulting weld nugget size may be recorded. The profilometer on the other hand can only measure peak to peak heights across the weld impression diameter left on the sheet surface and therefore does not record the actual welding face diameter. Similarly, the vision system relies on measurements taken across the line of highest contrast. This occurs on the outer periphery of the weld impression and so once again, a false impression of actual nugget size may be recorded.
Further light will be shed on the accuracy of these techniques once ultrasonic measurements and X-ray measurements on the welds have been conducted and actual weld nugget sizes have been measured with callipers after peel testing. Further research will also attempt to correlate the size and shape of the nugget measured using the vision sensing and spot weld shear strength during the abovementioned electrode life phases as this is a critical requirement in design of many spot welded components.
In summary, from these early results, it appears that the vision system could be used for on-line measurements of electrode degradation and prediction of the useful life of electrodes. The ultimate aim is to develop a vision system that is capable of predicting electrode life and bond strength using image analysis techniques during the process of resistance spot welding. Used in conjunction with automatic electrode tip dressing tools, this will be a useful tool in removing the need for operator judgement while at the same time minimising downtime in order to replace or redress electrodes. Productivity and weld quality will then be enhanced.
REFERENCES
(I) Howes, S.W. Electrode Erosion during Resistance Welding of Metallic Coated Steels. 5th International Conference on Manufacturing Engineering. The Institute of Engineers, Australia. University of Wollongong II-13th July. 1990.
(2) Howes, S.W., Lake, J.S.H. Degradation of Electrodes when Resistance Spot Welding Metallic Coated Sheet Steels. Paper N o 10, A W S Sheet Metal Welding Conference III, Detroit, USA, October 1988.
(3) Assel, M.D., Nadkarni, A.V. Non-Dressing Dispersion Strengthened Copper Electrode Designs for Galvanized Steel Welding. Paper N o 9, A W S Sheet Metal Welding Conference 111, Detroit, USA, October 1988.
(4) Kimchi, M., Gould, J.E. The Evaluation of Resistance Spot Welding Electrode Materiols for Welding Galvanized Steels. Paper N o 8, A W S Sheet Metal Welding Conference N o III, Detroit, USA, October 1988.
(5) McGregor, G. The Resistance Spot Welding of Metallic Coated Steels. Paper presented at Australian Welding Institute and The Australian Institute of Metals Seminar, Resistance Welding, Adelaide 1982.
(6) Beatson, E.V. An Introduction to Quality Control Systems in Resistance Welding. Paper presented at the Resistance Welding Control and Monitoring Seminar, T W l 1977.
(7) Tsai, C.L., Dai, W.L., Dickinson, D.W., Papritan, J.C. Analysis and Development of a Real-Time Control Methodology in Resistance Spot Welding. Welding Research Supplement pp 339-S to 351-S, December 1991.
(8) Beevers, A. Temperature Measurements to Determine Post Weld Heat Treatment Conditions for Spot Welds. British Welding Journal, pp 173-183, April 1963.
(9) Gedeon, S.A., Sorenson, CD., Ulrich, K.J., Eager, T.W. Measurement of Dynamic Electrical and Mechanical Properties of Resistance Spot Welds. Welding Journal, pp 378-385, December 1987.

APPENDIX 5
127
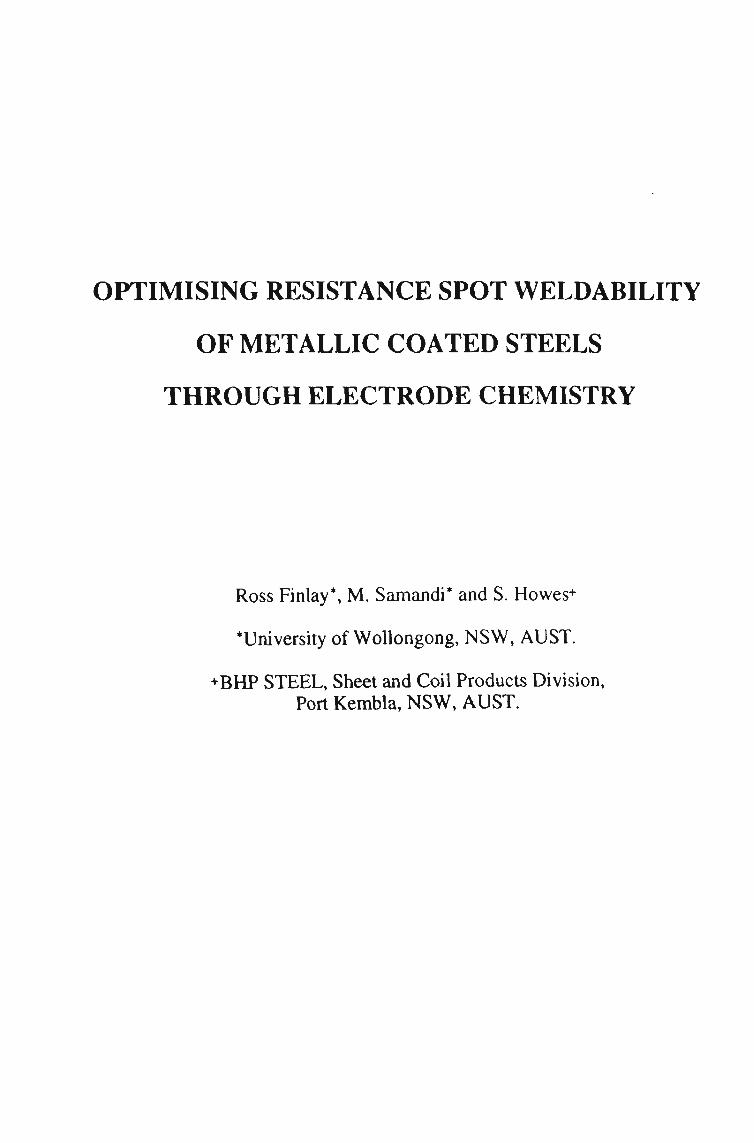
OPTIMISING RESISTANCE SPOT WELDABILITY
OF METALLIC COATED STEELS
THROUGH ELECTRODE CHEMISTRY
Ross Finlay*, M. Samandi* and S. Howes+
•University of Wollongong, NSW, AUST.
+BHP STEEL, Sheet and Coil Products Division, Port Kembla, NSW, AUST.

ABSTRACT
Resistance spot welding is the preferred joining technology in establishments producing high volume manufactured goods such as automobiles and uppliunces. Consumer demand for longer life products and extended warranties has resulted in steel suppliers developing a gamut of metallic coated steels with various coating compositions for use within these industries. Consequently, manufacturers now require a much broader knowledge on the optimum welding parameters for each steel type. This work examines the resistance spot weldability aspecLs of three c o m m o n metallic coated sheet steels namely aluminium - 4 5 % zinc coated, hot-dipped galvanised and galvanneal steels using commercially available electrode chemistries such as copper chromium (Cu/Cr), copper chromium zirconium (Cu/Cr/Zr), and copper zirconium (Cu/Zr). The aggressive nature of the erosion process encounicrcd for aluminium-45% zinc coated and hot dipped galvanised steels masks any influence the alloying elements have on electrode life. The benefit of alloying elements is apparent in life tests for galvanneal steel where the erosion process is more gradual. The composition of the Cu/Cr/Zr electrode is a compromise between the high hardness of Cu/Cr electrode composition and the increased conductivity of the Cu/Zr electrode composition and proved to be the most effective in obtaining maximum life. 1. INTRODUCTION 1.1 BACKGROUND
Resistance spot welding is a method of joining sheet steel by the passage of a high current through the workpieces to be joined, via a pair of clamping elecuodes resulting in a weld nugget at the point of highest resistance. This occurs at the sheet to sheet interface or 'faying surface'. Electrodes must possess high electrical conductivity to minimise electrode heating, and high thermal conductivity to extract heat from the contact area between the electrode tip and the workpiece. Electrodes should also exhibit high hot strength to resist softening caused by high welding forces, temperatures and compressive stresses. In addition to maximise electrode life, no alloying reaction should occur between electrode and sheet metal.
The significant increase in the usage of metallic coated steels has raised new concerns over electrode deterioration. The increased welding currents and times required to weld metallic coated steels over those employed on uncoated steels results in alloying of the metallic coating with the copper electrodes. This alloying frequently causes non uniform pitting of the electrode face as well as electrode edge alloy build up. Generally, the shape, dimensions and surface condition of the electrode tips deteriorate when welding these steels. Current density and distribution during welding are greatly affected by such variations in electrode condition which affects nugget development. The tip life of electrodes used to weld metallic coated steels may be as little as 250 welds, while electrodes used for welding uncoated steels may exhibit a life in excess of 50,000 welds. The composition, geometry, operating temperature, welding force and tip condition of the electrode plays a critical role in the spot welding of metallic coated steels, since the alloying reactions that occur between the coating and the electrode ultimately determine electrode life.
In an effort to combat the rapid deterioration of electrode tips, numerous new electrode materials have emerged to weld metallic coated steels. These include Cu/Cr, Cu/Zr, Cu/Cr/Zr and aluminium oxide dispersion strengthened copper.
1.2 WELDABILITY TESTS
The weldability of sheet steel is altered by changes in welding parameters and electrode set up and can therefore be characterised by a welding lobe which displays the range of welding time and current settings within which satisfactory welds may be made.

16
2 M •m^* mmt
e
E " 9
u "5
Kxpulslon
Minimum Nugget Dlunivtcr
6 8 10 12 14
Weld Time (cycles)
16 18
Figure 1 Typical welding lobes for 1.2mm thick uncoated and galvanised steels [1].
The lower curve represents the conditions at which a specified minimum nugget diameter will form while the upper curve represents the conditions at which metal expulsion will occur. A wider lobe is more useful since it allows a greater range of currents to be used. Welding lobes which display low current values are also beneficial in that, lower currents result in lower power consumption and hence reduced welding costs. In addition, lower heat input reduces the rate of electrode degradation. Generally welding lobes of metallic coated steels are higher than those of uncoated steels due to the increased currents and welding times because of the lower contact resistances. The exact position and size of welding lobes is dictated by electrode geometry, electrode tip condition, electrode force, sheet and coating thickness, coating composition, test method and analysis of results.
An electrode life test aims to define the point at which weld quality deteriorates to an unacceptable level, ie., when the electrode needs to be redressed or replaced. Although there is no universal standard, it is commonly accepted that a weld nugget diameter which falls below 8 0 % of the initial electrode tip diameter is unacceptable.
1.3 ELECTRODE COMPOSITION
The most commonly used electrode composition in Australia is Cu-0.8%Cr (J47 Alloy) since it exhibits the best all round properties. There is however, a growing tendency to use different types of electrode material to increase electrode tip life. The traditional Cu/Cr material has high hardness and moderate electrical conductivity. The Cu/Zr material has lower hardness but increased electrical conductivity. The alloy addition is about 0.3 w t % Zr which is present as small precipitates of a Cu-Zr intermetallic. The zirconium is thought to have the effect of inhibiting pick up on the electrode surface as well as reducing the grain boundary penetration [2].The Cu/Cr/Zr material has a hardness value and electrical conductivity which lies midway between Cu/Cr and Cu/Zr. The alloy addition is about 1.0 w t % Cr and 0.05 w t % Zr which are present as small intermetallics.
Aluminium oxide dispersion strengthened copper has a higher strength than the standard spot welding electrode materials which reportedly lessens electrode tip deformation. Dickinson [3] and Jud [4] report electrode lives of four times that of standard electrodes at elevated temperatures. The major disadvantage with this type of electrode is a four to five times increase in cost over Cu-Cr electrodes. Refractory based metal inserts including powder composites of molybdenum copper or tungsten copper containing a discontinuous refractory phase in a copper

matrix are reported lo increa.se electrode life, although at substantially greater cost |5.6|. Sailo el al |71 trialed a compound electrode with an insert. The core of the compound electrode was made from a conventional chromium containing copper base alloy and was covered with pure eopper of lower strength. This type of electrode was found lo last twice as long as conventional eopper base alloy electrodes, used to weld zinc vapour deposited sheet sieel. The electrode tip was characterised by a convex wear profile which maintained u relatively small face diameter and extended electrode life.
Many of the reported improvements in tip life due to changes in electrode material are for particular conditions and as a result they are rarely achieved in other environments, especially in industry (8J.
2. EXPERIMENTAL PROCEDURE
2.1 ELECTRODES
The electrodes used in this program were 90-degree (included angle) truncated cone type electrodes each with a tip machined to 5.0 ± 0.1mm diameter. This type of electrode was utilised for both weld lobe construction and electrode life tests. The composition and properties of the electrodes tested are typically
ALLOY HARDNESS ELEC. COND. Cu - 0.8%Cr 174Hv20 80% IACS Cu - 0.3%Zr 152HV20 90% IACS
Cu - 1.0%Cr - 0.05%Zr 160Hv20 85% IACS Table 1. Electrode alloy composition and properties. Electrical conductivities expressed as a percentage of the conductivity of the International Standard for annealed copper (I.A.C.S.)
Induded Angle
Figure 2. Spot welding electrode and electrode tip configuration.
Electrode tips were aligned to maintain consistent current density across the working face of the electrode. Carbon paper imprints of the actual contact area were obtained by bringing the electrode tips into contact with the carbon paper in between.
22 MATERIALS
The materials used for this work were 0.8 mm base thickness, metallic coated steels, supplied by B H P S T E E L , Sheet and Coil Products Division. Three classes of coated steels were investigated, namely;
1. hot dipped galvanised 2. aluminium-45% zinc coated (hot dipped) 3. galvanneal (zinc/iron alloyed)
Chemical compositions and coating weights for each steel are presented in Table 2. The coating thicknesses are not consistent for all three samples. Kimchi[9] reports that differences of 2:1 in

thickness make only a small difference lo electrode life. It is however, acknowledged that increased coaling weight has a detrimental effect on electrode life and since hot dipped galvanised and aluminium-45% zinc coaled steel products are generally heavier in coating weight lhan galvanneal steel, the electrode tip life is indeed shorter with them.
2.3 SPOT WELDING APPARATUS
Weld lobe construction and electrode life testing was conducted on a Schlatter 120 kVA pedestal style, spot welder. The current values (RMS), electrode force, voltage and energy are monitored via an I B M personal computer which is interfaced with Ihe welding machine. The welding machine controller settings employed throughout this work were: squeeze time 25 cycles, hold lime 3 cycles and an off time period between welds of 40 cycles. Squeeze lime is the time allowed for the electrodes to reach maximum clamping force. Hold lime is ihe time for which electrodes remain in contact with the workpiece afler the current is turned off. The clamping force on the electrodes was 2.5 ± O.lkN. 2.4 WELD LOBE CONSTRUCTION
Triplicate tests were performed for each electrode material. The lobes are constructed between 5 and 13 cycles (1 cycle/sec = 1Hz) at 2 cycle increments. This represents the most practical and economical welding schedules for the steels to be used. At each weld time the current is stepped up in increments of approximately 0.2 - 0.3kA until the minimum acceptable weld nugget diameter is reached. The destructive peel tesl is used to assess average weld nugget diameter. Once the first minimum nugget diameter has been recorded two subsequent tests in four at the same current level must also display a weld nugget greater lhan or equal to the acceptable minimum. The recorded current value on the lobe is the average of the three current readings. The weld lobes plotted represent the average of three repeated lobes. The point of expulsion, for each weld time is located by increasing the weld current in increments of 0.2 - 0.3kA until molten metal is blown from the weld interface. Then at the same current level two subsequent tests in four must demonstrate expulsion. The recorded current value is the average of these three readings.
2.5 ELECTRODE LIFE TEST
An intermediate weld time of 7 cycles was chosen for all life tests as it produces optimum performance in each electrode. Long weld times create higher tip temperatures and increase the amount of coating metal diffusion into the electrode, while short weld times result in a more severe heating and cooling cycle increasing alloy build up which reduces current density. To avoid expulsion, which results in rapid electrode wear, the welding current was set just below the expulsion level for each steel sample. Triplicate life tests were carried out for each material. Each life test is carried out by spot welding strips lm long by 4 0 m m wide. Electrode degradation was monitored through peel tests conducted at 100 weld intervals. As the weld nugget diameter approaches 8 0 % of the original tip diameter, peel tests are conducted every 40 welds. Termination of the electrode life test is established once the averaged weld nugget diameter falls below the acceptable minimum.
2.6 METALLOGRAPHIC EXAMINATION
After 1000 welds three electrodes were sectioned along their axis, mounted and prepared metallographically. The alloy layers which had developed on the electrode tips were examined using a Leica S440 scanning electron microscope (SEM) and then analysed using energy dispersive spectroscopy (EDS). The analytical technique was standardless semi-quantitative analysis. Contaminants and trace elements were ignored and the results were normalised to a total of 100%.

3. RESULTS
3.1 WELD LOBES
Triplicate tests were performed to eliminate any unrelated scalier points. Figure 3 shows the weld lobes for hot dipped galvanised steel for each of the electrode compositions. The current values are an average of the three tests. Figures 4. and 5. display ihe same information for aluminium-45% zinc coated and galvanneal steel respectively. The lobes appearing in Figures 3, 4, & 5 all exhibited the conventional shape, ic. decreasing weld time required an increase in current and vice versa. Il was observed that the weld lobes exhibited a high degree of scatter. In some cases the scalier was over a range of approximately lkA.
The weld lobes constructed for hot dipped galvanised and aluminium-45% zinc coated steel were almost identical in terms of lobe position, width and current range (Figures 3 & 4). This is to be expected as both steels undergo similar hot dip coaling processes. The weld lobes for galvanneal steel however, lie approximately lkA below those of both aluminium-45% zinc coated and hot dipped galvanised. This coating is fully alloyed and has a high iron content which reduces the current required. This improves weldability of ihe product as lower currents, reduce power costs and decrease the amount of thermal cycling which reduces the rate of metal diffusion and alloy build up. The weldable current range for galvanneal sleel is very narrow, approximately 0.75kA, compared to approximately 1.2kA for hot dipped galvanised and aluminium-45% zinc coated steels. Comparison between the alternative electrode compositions show discernible difference in selecting one composition over another in terms of power consumption or welding times.
3.2 ELECTRODE LIFE DATA
The electrode life results shown in Figure 6 indicate that the life of electrodes used to weld galvanneal steel exceeds the life of both aluminium-45% zinc coated and hot dipped galvanised steels by a factor of 10 and 5 respectively. In addition, the life of electrodes used to weld aluminium-45% zinc coated and hot dipped galvanised steels is consistent regardless of the electrode composition. From these results it is obvious that no clear trend exists between the alternative electrode compositions for aluminium-45% zinc coated and hot dipped galvanised steels. These results provide no encouragement to utilise the alternative electrode compositions.
However, the life of a Cu/Cr/Zr electrode used to weld galvanneal steel exceeds that of Cu/Cr by 2 5 % and Cu/Zr by 36%. From an industrial viewpoint this is quite important as galvanneal steel is used extensively in automobile panel assembly and any improvements in electrode life will ultimately lead to reduced costs on the production line.
3.3 ELECTRODE TIP EXAMINATION
Electron micrographs from cross sections of each electrode composition after 1000 welds using galvanneal steel are shown in Figures 7 to 9. The elemental composition is shown in Table 3 and is the average of at least three analyses. The alloy layer boundaries are well defined and the composition of each layer is constant throughout the thickness of the layer. Figures 7,8 & 9 show the development of the alloy layers on the high conductivity copper substrate. The innermost layer is a ductile beta (B) brass of approximate composition 5 2 % zinc, 4 8 % copper. The adjacent layer is a brittle g a m m a (y) brass, 6 3 % zinc, 3 6 % copper. An iron zinc alloy layer of varying iron composition for each electrode composition separates the brasses from a very porous, brittle zinc oxide surface layer. Moritafll] conducted a similar study and by using X-ray diffraction identified the outer brass layer as a hard and brittle gamma (y) brass (Cu5Zn 8 ) and the inner brass layer a ductile beta (B) brass (CuZn). The surface layer was zinc oxide, adjacent to a porous iron zinc alloy (T phase: Fe3Zn7). The (B) and(y) brasses are stable for each electrode composition except Cu/Zr which displays cracking in the (y) brass layer which is

arrested at the brass interface. All samples exhibit alloy layers which are l5-20|jm thick. The Cu/Cr and Cu/Cr/Zr electrodes bolh exhibit a continuous, stable iron zinc alloy layer which is relatively thick between 30 and 60um. The Cu/Zr sample has a very ihin (5iUin) discontinuous iron zinc alloy layer which, judging by the cracking in ihe (y) brass layer, provides little or no mechanical protection to the underlying brass layers. This irend is continued in the zinc oxide surface layer. The Cu/Cr and Cu/Cr/Zr electrodes display stable zinc oxides which are ~6()|itn thick; ihe zinc oxide on the Cu/Zr electrode appears fractured, unstable and thin (30pm).
4. DISCUSSION
4.1 WELD LOBES
It was observed that the degree of scalier on the weld lobes of galvanneal steel is greater than for either hot dipped galvanised and aluminium-45% zinc coated steels. This is attributable to the narrowness of the welding window for galvanneal steel compared to hot dipped galvanised or aluminium-45% zinc coated steels. A wide window accommodates small fluctuations in power and machine set up (for a given welding time a larger range of current values will still produce an acceptable weld) while a narrow window will not. Even though great care was taken to ensure that electrode tip diameter was maintained at 5.0 ± 0.1mm, alignment was exact, and weld force was 2.5 ± O.lkN, scatter up to l.OkA was observed. Reproducing ihe results was extremely difficult. As a multi parameter system it is extremely difficult to maintain all variables exactly the same and hence this amount of scatter was not unexpected. Realistically, weld lobes only serve as a general guide to the weld time and current combinations which will produce a satisfactory weld.
Figures 3,4, & 5show that the weld lobes of galvanneal steel, for each electrode composition lie approximately lkA below that of both aluminium-45% zinc coated and hot dipped galvanised steels. D u e to the nature of the coating, the current levels for producing acceptable welds are higher for hot dipped galvanised (free zinc coating) and aluminium-45% zinc coated (Al-45%Zn coating) steels than for galvanneal (zinc/iron coatings) steel. Zinc/iron coalings display increased electrical resistivity, higher melting point and reduced shunting of the alloyed coating and as a result require less current. The situation is further complicated by the effect of coating weight. Natale [10] has explained that increased shunting at both the electrode/sheet interface and the faying plane, required increased currents as zinc coating weight increased. While Kimchi[9] has stated that differences of 2:1 in coaling weight make only small differences to current values and electrode life, it is inevitable that the current values required to weld galvanneal would be increased if the coating weight was increased.
4.2 ELECTRODE LIFE DATA
The improvement in electrode life achieved when welding galvanneal steel is largely due to the coating composition. The improvement in electrode life when welding galvanneal steel for all electrode compositions results from higher electrical resistivity of the coating (lower welding current), higher melting temperature of the coating (reduced electrode alloying) and lower thermal conductivity than unalloyed zinc coatings.
The extremely poor performance of aluminium-45% zinc coaled and hot dipped galvanised steels also relates to the composition of the coating and is primarily due to the addition of aluminium to the zinc coating to inhibit the growth of iron-zinc intermetallics during the hot dipped galvanising process and to improve adherence between the coating and the steel. Its presence, even in small quantities in the alloy layers which grow on the electrode tip as welding proceeds, alters the weldability of the coated steel and severely reduces electrode life. Brittle pockets containing aluminium form in the alloy layers which are easily broken away leaving a pitted electrode face. This is especially noticeable on electrodes used to weld aluminium-45% zinc coated steel and to a lesser extent hot dipped galvanised steel which displays a similar

erosion process, although the erosion rale is much slower due lo the much smaller amount of aluminium in ihe coating. Furthermore, the increased eurrenl requirements due lo the increased coating weighi combined with increased zinc pick up at the sides of the electrodes, results in reduced electrode life. Galvanneal steel has a similar aluminium content to hoi dipped galvanised steel yel the life is much longer. It is believed thai the high iron content of the galvanneal coating contributes to the lowering of the electrode degradation rate when welding ihis sleel type. It is suggested that iron may have a stabilising influence over the diffusion of both zinc and aluminium into the copper, or of the copper into the complex alloy layers.
Alloying elements are added to the copper electrode material to improve either the mechanical or electrical properties of the electrode, usually at ihe expense of the olher. The chromium is added to increase hardness which improves mechanical strength and increases tip life, although electrical conductivity is reduced. Zirconium is added to increase electrical conductivity, although mechanical strength and hence tip life is reduced. In ihe ease of aluminium-45% zinc coated and hot dipped galvanised steels the reaction which occurs during welding between the copper electrode and the metallic coating is so aggressive lhat electrode life is severely reduced. Hence, no trend is observed between each of the alternative electrode compositions. The degradation process for the electrodes used to weld galvanneal steel is more gradual and therefore the effect of additional alloying elements is more pronounced. The high hardness of the Cu/Cr electrode would appear to have a slightly stronger effect on improving electrode life than the increased conductivity of the Cu/Zr electrode which displays a shorter life. The Cu/Cr/Zr electrode however, which is a compromise of the high hardness of the Cu/Cr electrode and the increased conductivity of the Cu/Zr electrode displays the longest electrode life. This Cu/Cr/Zr composition offers the best all round properties and hence the longest life.
4.3 ELECTRODE TIP DEGRADATION
The formation of alloy layers on the tips of electrodes used to weld hoi dipped galvanised, galvannneal and aluminium-45% zinc coated steels has been studied by Howes[12J. He reported that there was a concentration of aluminium and iron in the electrode alloy layers for each steel type, although the iron was not distributed uniformly across the tip face except for the galvanneal steel. It was concluded that the areas of rapid erosion are those where there is substantial aluminium but little iron present in the alloy layer. This occurred for the galvanised and in particular for Al-45%Zn steels, but not for the galvanneal steel. The galvanneal coating has a lower aluminium content than hot dipped galvanised steels and increased iron content which is believed to have a stabilising influence over diffusion and the formation of intermetallics. The interest in this work lies in the variation of electrode life for each electrode composition used to weld galvanneal steel.
The cross sections of each electrode composition (Figures 7 to 9) show equally well developed brass layers of similar composition. The variation lies in the thickness and composition of the iron zinc alloy layers. The iron zinc alloy layer for the Cu/Zr (Figure 9) electrode is very thin, discontinuous and fractured whereas for Cu/Cr (Figure 8), and Cu/Cr/Zr (Figure 7) electrodes the iron zinc alloy layer is stable and relatively thick. Moritafl 1J found a similar result when spot welding galvanneal steel and observed that when the iron zinc layer is thick electrode life is relatively long. It is possible that iron in the alloy layers may influence electrode degradation by affecting the mechanical properties of the alloy layers, specifically its resistance to fracture. Alternatively, iron may have a stabilising influence over diffusion of zinc into copper or of copper into the complex alloy layers. It is apparent from Figure 9 thai when the iron zinc alloy layer is thin it provides no mechanical protection to the (y) brass layer underneath which appears cracked and spalled. As well as the variation in thickness of the iron zinc alloy layer is the variation in the composition of this layer. There is a corresponding increase in electrode life with an increase in iron content in the iron zinc alloy layer, (Table 3).

5. C O N C L U S I O N S
This work examined the characteristics of three electrode materials used for resistance spot welding metallic coated steels. The electrode materials evaluated were: Cu/Cr, Cu/Zr, and Cu/Cr/Zr. Steel samples used were galvanneal, aluminium-45% zinc coaled, and hot dipped galvanised. The electrodes were evaluated using standard weld lobe construction technique and conveniional electrode life tests. Results from ihese tests were analysed and the conclusions are summarised below.
(1) The weld lobes of galvanneal sleel (for each electrode composition) were observed lo lie approximately lkA below those of both aluminium-45% zinc coated and hot dipped galvanised steels. The galvanneal coating has increased electrical resistivity, higher melting point and reduced current shunting which reduces the current needed to obtain a satisfactory weld.
(2) In the conventional electrode life test for the aluminium-45% zinc coaled and hot dipped galvanised steels there is no clear indication that utilising the alternative electrode compositions will improve electrode life. In the case of galvanneal steel the Cu/Cr/Zr electrode displayed a marked improvement over ihe Cu/Cr and Cu/Zr electrode compositions.
(3) The aggressive nature of the erosion process encountered for aluminium-45% zinc coated and hot dipped galvanised steels masks any influence the alloying elements may have on electrode life. The benefit of alloying elements becomes apparent in life tests for galvanneal steel where the erosion process is more gradual. The composition of the Cu/Cr/Zr electrode is a compromise between the high hardness of Cu/Cr electrode composition and the increased conductivity of the Cu/Zr electrode composition and proved to be the most effective in obtaining maximum life.
(4) The inferior life performance of the Cu/Zr electrode compared to the Cu/Cr and then the Cu/Cr/Zr electrode is due to the lower concentration of iron in the iron zinc alloy layer and the reduced thickness of this layer.
It is clear that limited improvement can be achieved by altering the bulk composition of electrodes. Further addition of alloying elements to the base electrode is impractical because of the detrimental effect on other behaviour. However, deposition of thin, adherent coatings on the electrodes appears to be a logical way to modify the surface properties without compromising the bulk properties of the electrodes. This aspect is now being investigated and the suitability of a range of refractory coatings, deposited by physical vapour deposition technology, is currendy under examination. The early indications are that these coalings could significantly improve weldability and electrode life. The results of this investigation will be published elsewhere.
6. ACKNOWLEDGMENTS
This project has the support of BHP Research Port Kembla Laboratory. Substantial assistance has been provided with the allocation of personnel to supervise the project and the use of extensive facilities located at the site.

7. REFERENCES
I. HOWES, S.W. Electrode Erosion During Resistance Welding of Metallic Coated Steels. The Fifth International Conference on Manufacturing Engineering 1990, The University of Wollongong, July 1990.
2. NAT ALE, T.V., A Review of ihe Resistance Spot Welding Behaviour of Galvanised Steels. Sheet Metal Welding Conference III, Detroit, USA, October 1988, Paper No. 1.
3. DICKINSON, D.W., Welding in the Automotive Industry. A1S1 Report SG81 -5. August, 1981.
4. JUD, R.W., Joining Galvanised and Galvannealed Steels. SAE Technical Paper Series, No. 840285, 1984.
5. LAVERY, R.C. WILLIAMS, NT., Resistance Spot Welding of Galvanised Steels. Sheet Metal Industries, March, 1970. pp201.
6. KEY, J.F., COURTNEY, T.M., Refractory Metal Composite Tips for Resistance Spot Welding of Galvanised Steel. Welding Journal, Supplement June 1974, pp261 -266.
7. SAITO, T., NISHI, T., TAKAHASHI, Y., Electrode Tip Life in Resistance Spot Welding of Zinc and Zinc Alloy Coated Sheet Steels. Nippon Steel Technical Report No. 37 Apr. 1988.
8. NEAL'ON, C.S., LAKE, J.S.H., Resistance Spot Welding Tip Lives for Zincalume Coated Qualities. .BHP Steel Research and Technology Centre, Research Report No. 950, January 1987.
9. KIMCHI. M., GOULD, J. Effects of Coating Weight on the Resistance Spot Weldability of Galvanised Steel. SAE Technical Paper Series, No. 860535, 1986.
10. NAT ALE, T. V.., A Comparison of the Resistance Spot Weldability of Hot Dip and Electrogalvanised Sheet Steels. SAE Technical Paper Series No. 860435,1986.
11. MORTTA, A., INOUE, S., TAKEZOE, A, Spot Weldability of Zinc Vapour Deposited Steel Sheets. Journal of Metal Finishing Society, Japan. Vol. 39., No. 5., pp270-275.
12. HOWES, S.W., LAKE, J.S.H., Degradation of electrodes when resistance welding metallic coated sheet steels. B H P Steel Research and Technology Centre, Research Report No. 1002, December 1989.

Al-45%Zn
Galvanised
Galvanneal
TABLE NO. 2.
COATING COMPOSITION
Al
(%)
56.7
0.30
0.17
Fe
1.66
0.13
9.02
Pb
(%)
0.14
0.08
Si Coating (%) (g/m2)
1.39 150
275
80
TABLE NO. 3
COMPOSITIONAL ANALYSIS
Copper Chromium Electrode: Life 4880
Cu Zn Fe Al Cr
Copper Chromium Zirconium Electrode: Life 5990
Cu
99.4
0.6
(B)brass
51.7 47.6 0.4
0.3
(y)brass
38.4 59.7 1.7
0.2
Fe-Zn
5.2 42.4 51.6 0.6 0.9
ZnO
5.5 58.2 33.8
1.9
Cu
Cu Zn Fe Al Cr Zr
Copper Zirconium Electrode: Life 4410
Cu (B)brass (y)brass
Cu 99.3 Zn Fe Al Zr 0.7
(B)brass
99.6
0.3 ..0.1
(y)brass
51.5 47.9 0.3
0.2 0.1
Fe-Zn
33.2 64.8 1.4
0.5 0.1
ZnO
1.8 39.4 58.2 0.9 0.4 0.1
4.1 60.9 31.8
0.1 0.1
Fe-Zn ZnO
53.2 46.5 0.1
0.2
36.6 62.4 0.8 0.2 0.1
18.6 61.2 20.0 0.1 0.1
2.5 83.8 12.4 0.9 0.4

WEl.n L O B E S : M O T DIPPED GALVANISED Cu/Cr, Cu/Cr/Zr, Cu/Zr
3 e
£ 9
u 2 "55
11
io -
8-
7-
-r 6
-r 8 10
CuCr Weld Current (Min)
CuCr Weld Current (Exp)
CuZr Weld Current (Min)
CuZr Weld Current (Exp)
CuCrZr Weld Current (Min)
CuCrZr Weld Current (Exp)
—r-12
-| 14
Weld Time (cycles)
Figure 3 Weldability lobes for different electrode compositions used for spot welding of hot dipped galvanised steel
W E L D LOBES: AL-45%ZN C O A T E D Cu/Cr, Cu/Cr/Zr, Cu/Zr
e v u u S
U
11 n
10-
9-
7-
6
CuCr Weld Current (Min)
CuCr Weld Current (Exp)
CuZr Weld Current (Min)
CuZr Weld Current (Exp)
CuCrZr Weld Current (Min)
CuCrZr Weld Current (Exp)
8 10
Weld Time (cycles)
—r-12 14
Figure 4 Weldability lobes for different electrode compositions used for spot welding of Al-45% Zn steels.

WELD LOIIES: GALVANNEAL Cu/Cr, Cu/Cr/Zr, Cu/Zr
2 B V fc
9
2
11 -\
10-
9-
8-
-O-
6 -~t— 10
CuCr Weld Current (Mln)
CuCr Weld Current (Exp)
CuZr Weld Current (Min)
CuZr Weld Current (Exp)
CuCrZr Weld Current (Min)
CuCrZr Weld Current (Exp)
"T-12 14
Weld Time (cycles)
Figure 5 Weldability lobes for different electrode compositions used for spot welding galvanneal steel.
ELECTRODE LIFE TEST RESULTS
•J
va
8
6000
5000-
4000-
3000-
2000-
1000-
E3 Cu/Cr
U Cu/Zr
m Cu/Cr/Zr
GALVANNEAL AL45%ZN GALVANISED
C O A T E D STEEL
Figure 6 Electrode life data for all electrode compositions and all coated steels.
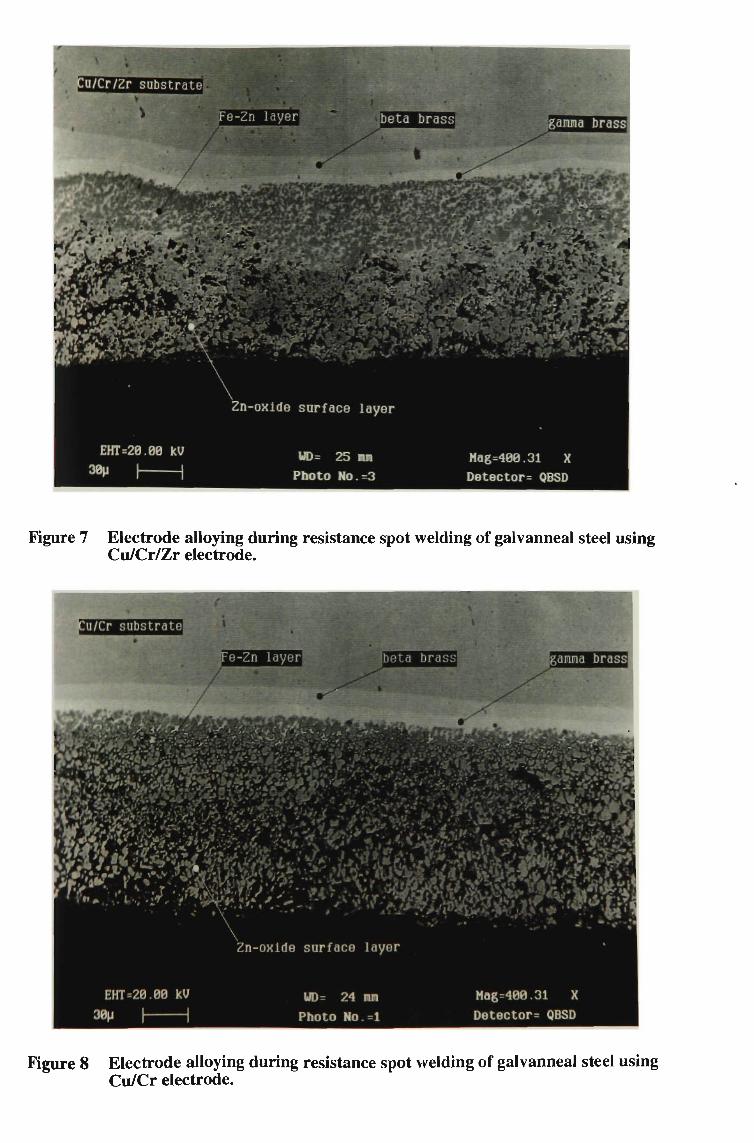
Figure 7 Electrode alloying during resistance spot welding of galvanneal steel using Cu/Cr/Zr electrode.
_ •Cu/Cr substrateH
> f r
R si
•
fmQ&'iMBb&Ui •'hm&mWm-il
»^Jj2?rtr£wrVyL£2rV(
rA^^TJfcfJpSviRKPjt
•Fe-Zn layerB
w
Jir •/• •ir "JV** & ! M L >ISK PB
n fniTrWT* tf ii r*ni all in iV^/zi /%' 'J^l
beta brass
%
& M S 9 B U 0 U k t i » J i
?0i Jffe *>» v/. J* - 3 r v *
y^*
&-rSf:
y V>rf
/
•
'.UIM.IJ.W--
feKif3^1b&T*Qr^T * J
" • r . . . . ^ . : , . ^ / ; ^ V.il"J •' >• \»J.*' • *' -VJ
!® ssfflsr«ra!i Zn-oxlde surface layer
EHT=20.00 kV WD = 2 4 mm
30u | 1 Photo No.=l
•
Mag=400.31 X
Detector^ QBSD
Figure 8 Electrode alloying during resistance spot welding of galvanneal steel using Cu/Cr electrode.

u/Zr substrate
e-Zn layer lM#H#i arama brass
Zn-oxide surface layer
EOT =20.00 kV 25 run Photo No.
Mag=400.31 Y Detector= QBSD
Figure 9 Electrode alloying during resistance spot welding of galvanneal steel using Cu/Zr electrode.

APPENDIX 6
PRODUCT DATA SHEET FOR ZINCANNEAL G3N
128
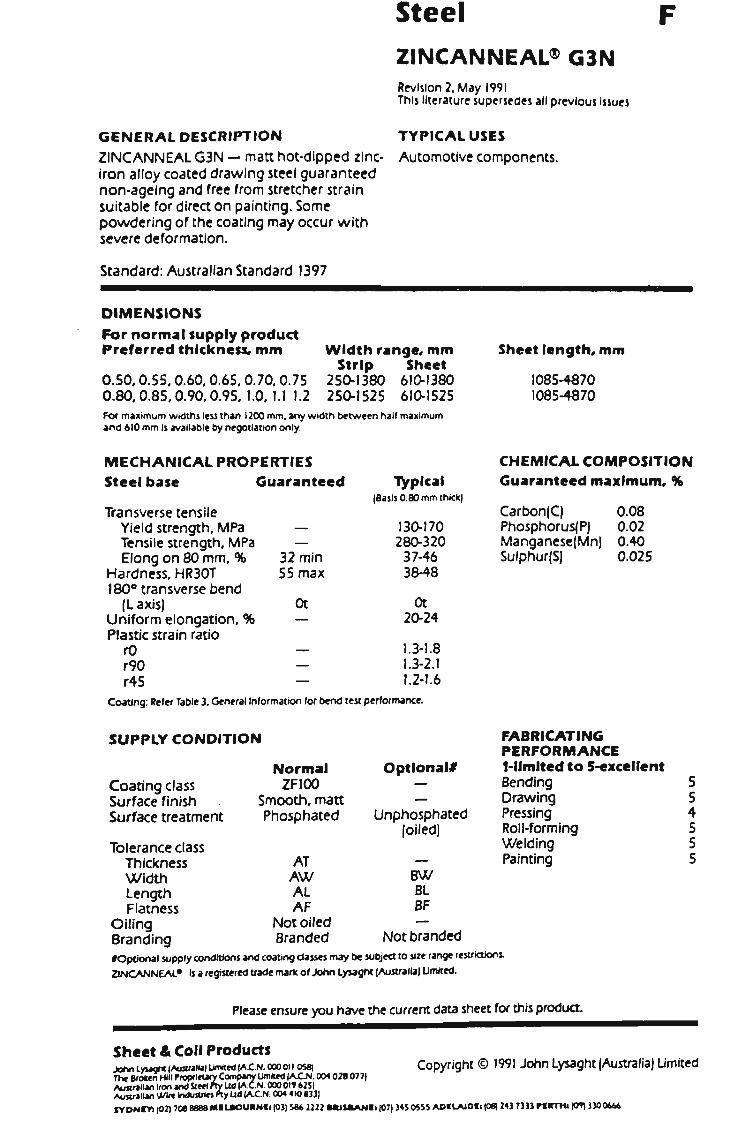
Steel ZINCANNEAL® G3N Revision 2. May 1991 This literature supersedes all previous Issues
GENERAL DESCRIPTION
Z I N C A N N E A L G 3 N — matt hot-dipped zinc-iron alloy coated drawing steel guaranteed non-ageing and free from stretcher strain suitable for direct on painting. Some powdering of the coating may occur with severe deformation.
TYPICAL USIS
Automotive components.
Standard: Australian Standard 1397
DIMENSIONS
For normal supply product Preferred thickness, m m Width range, m m
Strip Sheet 0.50.0.55.0.60.0.65.0.70,0.75 250-1380 610-1380 0.80.0.85,0.90,0.95.1.0.1.11.2 250-1525 610-1525 Fo» maximum widths leu than 1200 m m . any width between half maximum and 610 m m Is available by negotiation only.
Sheet length, m m
1085-4870 1085-4870
MECHANICAL PROPERTIES Steel base Guaranteed
Transverse tensile Yield strength. MPa Tensile strength. MPa Elong on 80 mm, %
Hardness, HR30T 180° transverse bend
(L axis) Uniform elongation. % Plastic strain ratio rO r90 r45
— —
32 min 55 max
Ot —
— — —
Typical (Basis 0.80 m m thick)
130-170 280-320 37-46 38-48
Ot 20-24
1.3-1.8 1.3-2.1 1.2-1.6
CHEMICAL COMPOSITION Guaranteed maximum, %
Carbon(C) 0.08 Phosphorus(P) 0.02 Manganese(Mn) 0.40 Sulphur(S) 0.025
Coating: Refer Table 3. General Information for bend test performance.
SUPPLY CONDITION
Coating class Surface finish Surface treatment
Tolerance class Thickness Width Length Flatness
Oiling Branding
Normal ZFJOO
Smooth, matt Phosphated
AT AW AL AF
Not oiled Branded
Optional* — —
Unphosphated (oiled)
—
BW BL BF —
Not branded
FABRICATING PERFORMANCE Mfmlted to 5-excellent Bending Drawing Pressing Roll-forming Welding Painting
tOptional supply conditions and coating classes m a y be subject to size range restrictions.
Z I N C A N N E A L 0 is a registered trade mark of John Lysaght (Australia! Limited.
Please ensure you have the current data sheet for this product.
5 5 4 5 5 5
Sheet & Coll Products Copyright © 1991 John Lysaght (Australia) Limited John Lysaght (/VutraM Limited |A£.N. 000 011 0S8|
The Broken Hill Proprietary Company Umlied |AJCJ\|. 004 028 077) AuSMltan Iron and Steel Fly Ud IA.C.N. 000 01162S| numtnlltn mVUt mduflflei «y Ud (AJC.N. 004 4K> 833) SYDNIYl |02] 708 8888 MILSOURNf J (03) SH* 2232 M I M A N d (07) 345 0SS5 AOILAJOIi (OB) 243 7333 KRTMt fCT) 330 0444

APPENDIX 7
TECHNICAL DATA SHEET 1 FOR J47 COPPER ALLOY
129

TECHNICAL DATA SHEET
NUMBER 1 JAMES COPPEU LEE PTY. LTD.
KM
If a Chromium Copper alloy, conforming to R W M A class (2)
specification. This rod material has a (2) stag* heat treatment
procedure, coupled with a work hardening process designed
specially for spot welding tips.
ROD gives you High Conductivity 80-85% IACS
Rockwell hardness 75-80B
Excellent bending properties
When these features are combined, then you have:
Longer life (more welds between dressing)
Single and double bends are possible.
Uniform high quality metal.
ALWAYS REMEMBER W e are the actual manufacturers and distributors of—\fl" •. That means w e alloy, cast, hot roll, draw, and heat treat the rod, all under our own personal supervision
Perhaps you require cast tips or some special type of clamp with cast in water tubes, castings up to 300-400 lb. have
been undertaken successfully.
PHYSICAL
Properties of
castings j .47
Conductivity 75 V. IACS
Rockwell hardness 65B
TRY 47. NOW and test it for yourself
For further information please contact:
JAMES COPPELL LEE PTY. LTD. 500 La Trobe Street, Melbourne. Phone: 328 26.*

APPENDIX 8
TECHNICAL DATA SHEET 2 FOR J47 COPPER ALLOY
130
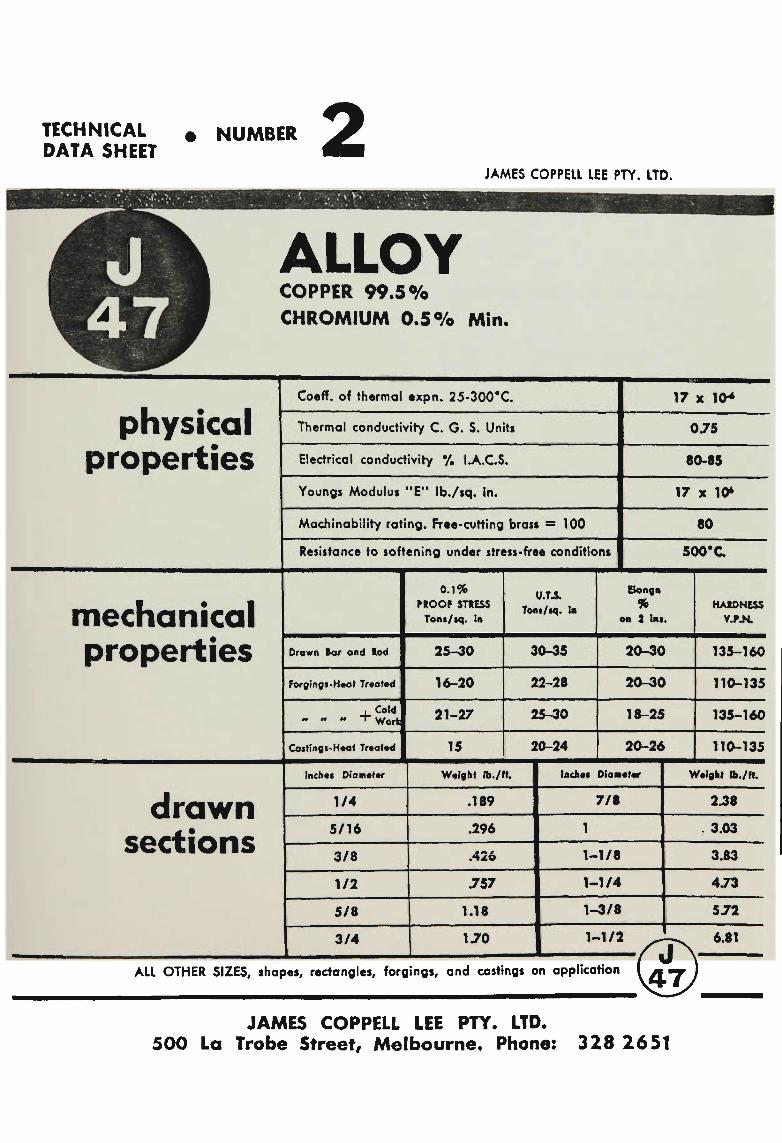
TECHNICAL DATA SHEET
NUMBER 2 JAMES COPPELL LEE PTY. LTD.
COPPER 99.5% CHROMIUM 0.5% Min.
1 • I
physical properties
mechanical properties
drawn sections
ALL OTHER SIZES, shaf
Coeff. of thermal expn. 25-300*C.
Thermal conductivity C. G. S. Units
Electrical conductivity % I.A.C.S.
Youngs Modulus "E" Ib./sq. In.
Machinabiliry rating. Free-cutting brass = 100
Resistance to softening under stress-free conditions
Drawn tar and tod
Forging>>H«o> Tr»ot»d
.Cold - - - "1" Work
Caitingt-Hw! Tr.at.d
Inch.i Diam.t.r
1/4
5/16
3/8
1/2
5/8
3/4
>es, rectangles, for{
0.1%
M O O f STIESS
Toni/tq. In
25-30
16-20
21-27
15
U.TA Toni/tq. In
30-35
22-28
25-30
20-24
Weight Ib./ff.
.189
.296
.426
J57
1.18
1.70
17 x 10-*
0.75
80-85
17 x 10*
80
500#C
Bongo
% on 3 Int.
2O-30
20-30
18-25
20-26
(achat Diamtlm*
7/8
1
1-1/8
1-1/4
1-3/8
HAtONESS
135-160
110-135
135-160
110-135
w.Johi a./ft.
2.38
. 3.03
3.83
4.73
5.72
1-1/2 JL. 6.81
lings, and castings on application ( m
JS JAMES COPPELL LEE PTY. LTD.
500 La Trobe Street, Melbourne. Phone: 328 2651

APPENDIX 9
PRODUCT DATA SHEET FOR ZINCANNEAL G2
131

Steel ZINCANNEAL® G2 Revision 4. May 1991 This literature supersedes all previous Issues
GENERAL DESCRIPTION
Z I N C A N N E A L G 2 — matt hot-dipped zinc-iron alloy coated commercial forming steel suitable for direct-on painting, and guaranteed for Pittsburg lock-seaming. Some powdering of the coating may occur with severe deformation.
TYPICAL USES
Acoustic ceiling tiles louvres, door frames, exterior signs, commercial refrigerators and freezers.
Standard: Australian Standard 1397
DIMENSIONS
For normal supply product Preferred thickness, m m
0.40, 0.42.0.45.0.48 0.50,0.55.0.60.0.65, 0.70, 0.75 0.80,0.85.0.90.0.95, 1.0,1.1 1.2. 1.3. 1.4, 1.5. 1.6 1.7 1.8 1.9 2.0
Width range, m m Strip Sheet
250-1300 610-1300 250-1525 610-1525 250-1525 610-1525 250-1525 610-1525 250-1435 610-1435 250-1355 610-1355 250-1285 610-1285 250-1220 610-1220
Where maximum widths are less than 1200 m m . any width between half maximum and 610 m m is available by negotiation only.
MECHANICAL PROPERTIES
Steel base
Transverse tensile Yield strength, MPa Tensile strength, MPa Elong on 80 mm, %
Hardness. HR30T 180° transverse bend [L axis)
Pittsburgh lockseam Coating: Refer Table 3. General Information for bend test performance.
27 min
Ot Pass
(Basis 0.80 m m thick|
260-360 340-440 30-40 50-60
Ot Pass
Sheet length, m m
1085-4870
CHEMICAL COMPOSITION
Guaranteed maximum, %
Carbon(C) 0.10 Phosphorus(P) 0.025 Manganese(Mn) 0.45 Sulphur(S) 0.03
SUPPLY CONDITION
Coating class Surface finish Surface treatment Tolerance class
Thickness Widtfi Length Flatness
Oiling Branding
Normal Optional* ZF100 —
Smooth, matt — Phosphated Unphosphated (oiled)
AT AW AL AF
Not oiled Branded
BW BL BF
Not branded
FABRICATING PERFORMANCE 1-llmlted to 5-excellent Bending Drawing Pressing Roll-forming Pittsburgh lock-seaming Welding Painting
f Optional supply conditions and coating classes may be subject to size range restrictions
ZINCANNEAL* is a registered trade mark of John Lysaght |Australia| Limited.
Please ensure you have the current data sheet for this product
Copyright © 199! John Lysaght {Australia} Limited Sheet & Coll Products John Lyiaght |Au«/alia| Umtted | ACM. 000 011 058| The Broken HJU Proprietary Company Limned (AJC.N. 004 028077| Ausralian Iron and Steel Ply lid (AJCJM. 000 019 62S| /Vusnllan Wire mduarm Ply Ltd (AJC.N. 004 410 833| fYONCYI |02J 708 8888 MILBOURNIi (03) 586 2222 M I S B A N b (07| 34$ 0555 AO*1_AJO«J (08) 243 7333 PMTm|09| 3300644
5 3 3 5 5 5 5
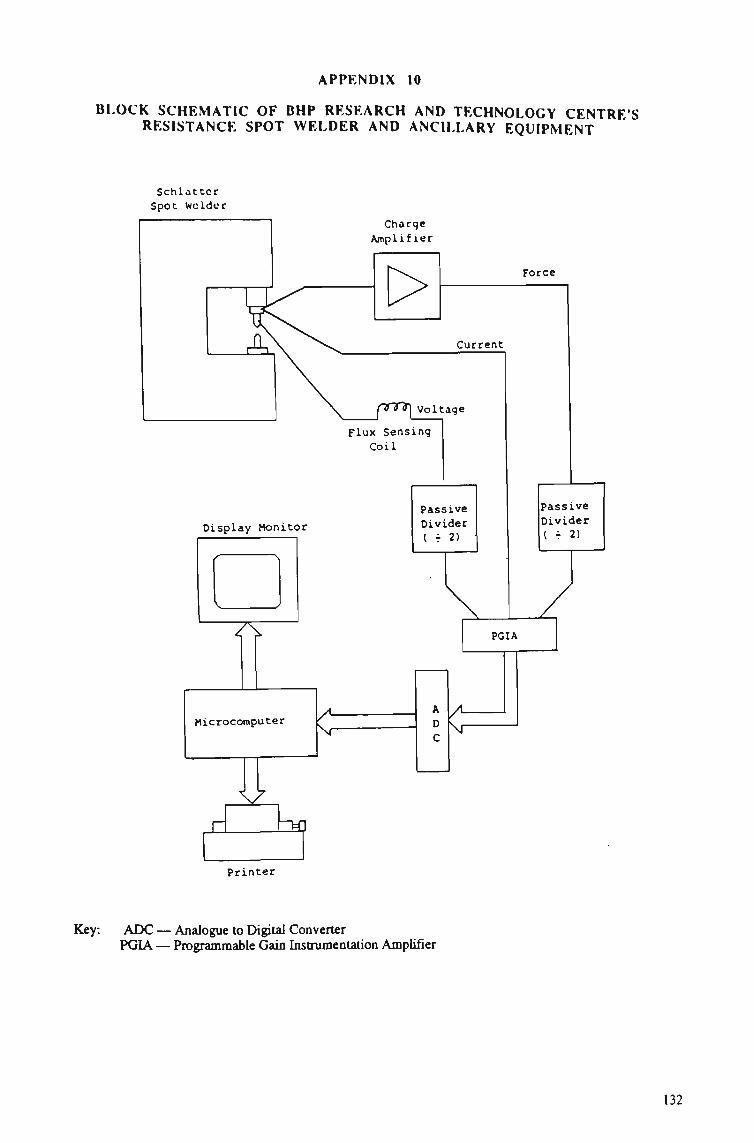
APPENDIX 10
BLOCK SCHEMATIC OF BHP RESEARCH AND TECHNOLOGY CENTRES RESISTANCE SPOT WELDER AND ANCILLARY EQUIPMENT
Schlatter Spot Welder
Xs
Display Monitor
Charge Amplifier
Force
Current
pffi^ voltage
Flux Sensing Coil
Passive Divider ( r 2)
J
Passive Divider i r 2)
Printer
Key: A D C — Analogue to Digital Converter PGIA — Programmable Gain Instrumentation Amplifier
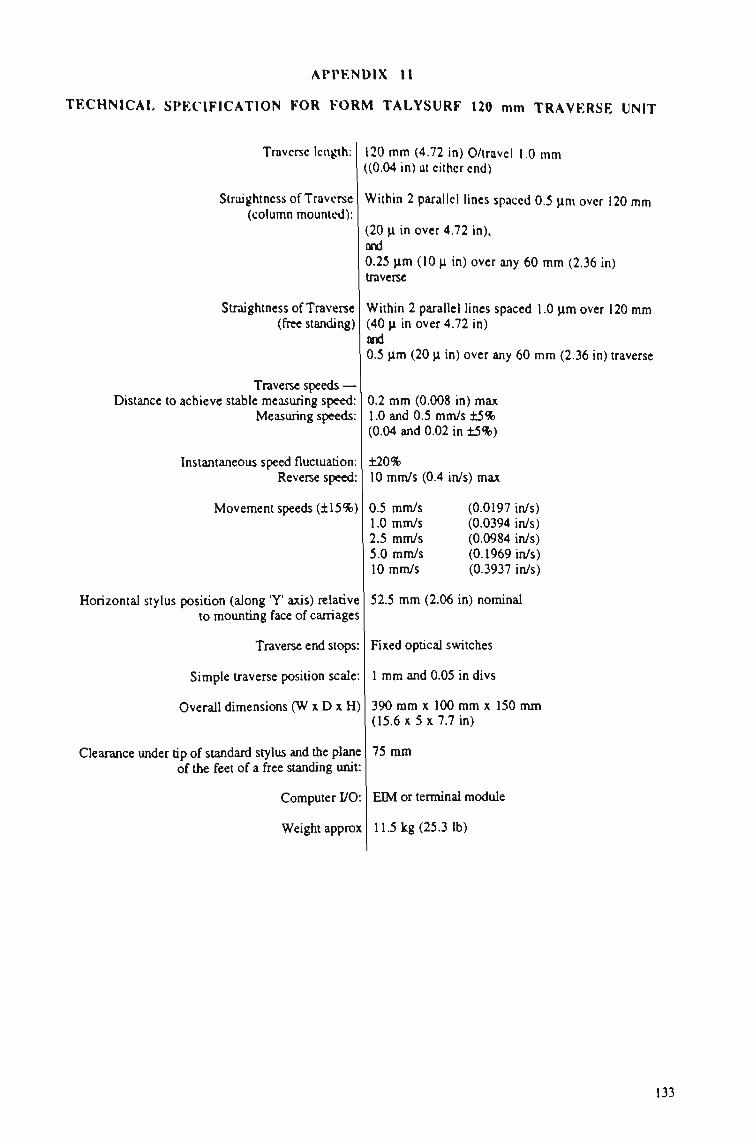
APPENDIX 11
TECHNICAL SPECIFICATION FOR FORM TALYSURF 120 mm TRAVERSE UNIT
Traverse length:
Straightncss of Traverse (column mounted):
Slraightness of Traverse (free standing)
Traverse speeds — Distance to achieve stable measuring speed:
Measuring speeds:
Instantaneous speed fluctuation: Reverse speed:
Movement speeds (±15%)
120 m m (4.72 in) O/travcl 1.0 m m ((0.04 in) at cither end)
Within 2 parallel lines spaced 0.5 urn over 120 mm
(20 LI in over 4.72 in). and 0.25 u m (10 LI in) over any 60 m m (2.36 in) traverse
Within 2 parallel lines spaced 1.0 urn over 120 mm (40 u in over 4.72 in) and 0.5 urn (20 u in) over any 60 m m (2.36 in) traverse
0.2 m m (0.008 in) max 1.0 and 0.5 mm/s ± 5 % (0.04 and 0.02 in ±5%)
10 mm/s (0.4 in/s) max
0.5 mm/s 1.0 mm/s 2.5 mm/s 5.0 mm/s 10 mm/s
(0.0197 in/s) (0.0394 in/s) (0.0984 in/s) (0.1969 in/s) (0.3937 in/s)
Horizontal stylus position (along 'Y' axis) relative to mounting face of carriages
Traverse end stops:
Simple traverse position scale:
Overall dimensions (WxDxH)
Clearance under tip of standard stylus and the plane of the feet of a free standing unit:
Computer I/O:
Weight approx
52.5 m m (2.06 in) nominal
Fixed optical switches
1 mm and 0.05 in divs
390 mm x 100 mm x 150 mm (15.6 x 5 x 7.7 in)
75 mm
ELM or terminal module
11.5 kg (25.3 lb)

APPENDIX 12
ELECTRODE TIP CARBON PAPER IMPRESSION DIAMETER RESULTS
Weld Number
I 50 75 100 125 150 175 200 250 300 350 400 450 500 550 600 650 700 750 800 850 900 950 1000 1100 1200
Impression Diameter (mm)
5.30/5.30 5.10/5.00 5.10/5.00 5.50/5.00 5.50/5.00 5.30/5.50 5.30/5.30 5.50/5.30 5.10/5.20 5.40/5.40 5.40/5.40 5.50/5.50 5.40/5.50 5.80/5.60 5.50/5.70 5.50/5.80 5.30/5.40 4.90/6.80 4.70/5.50 5.50/4.80 5.40/5.50 5.50/5.50 5.30/5.50 5.50/5.50 5.50/5.20 5.80/5.80
Average (mm)
5.30 5.05 5.05 5.25 5.25 5.40 5.30 5.40 5.15 5.40 5.40 5.50 5.45 5.70 5.60 5.65 5.35 5.85 5.10 5.15 5.45 5.50 5.40 5.50 5.35 5.80
Weld Number
1300 1400 1500 1600 1700 1800 1900 2000 2100 2200 2300 2400 2500 2600 2700 2800 2900 3000 3200 3400 3600 3800 4000 4200 4400 4600
Impression Diameter (mm)
5.50/5.20 4.80/5.10 4.50/5.00 4.50/4.60 4.70/4.70 4.50/5.00 4.50/4.60 4.20/5.00 4.20/4.80 4.50/4.10 4.20/5.50 5.60/4.30 5.80/5.50 5.50/5.70 5.50/5.80 5.50/5.90 5.60/5.80 5.50/5.50 5.10/5.40 5.50/5.90 5.00/5.90 5.40/5.90 4.50/5.90 5.50/6.00 5.80/5.90 5.80/6.00
Average (mm)
5.35 4.95 4.75 4.55 4.70 4.75 4.55 4.60 4.50 4.30 4.85 4.95 5.65 5.60 5.65 5.70 5.70 5.50 5.25 5.70 5.45 5.65 5.20 5.75 5.85 5.90
134
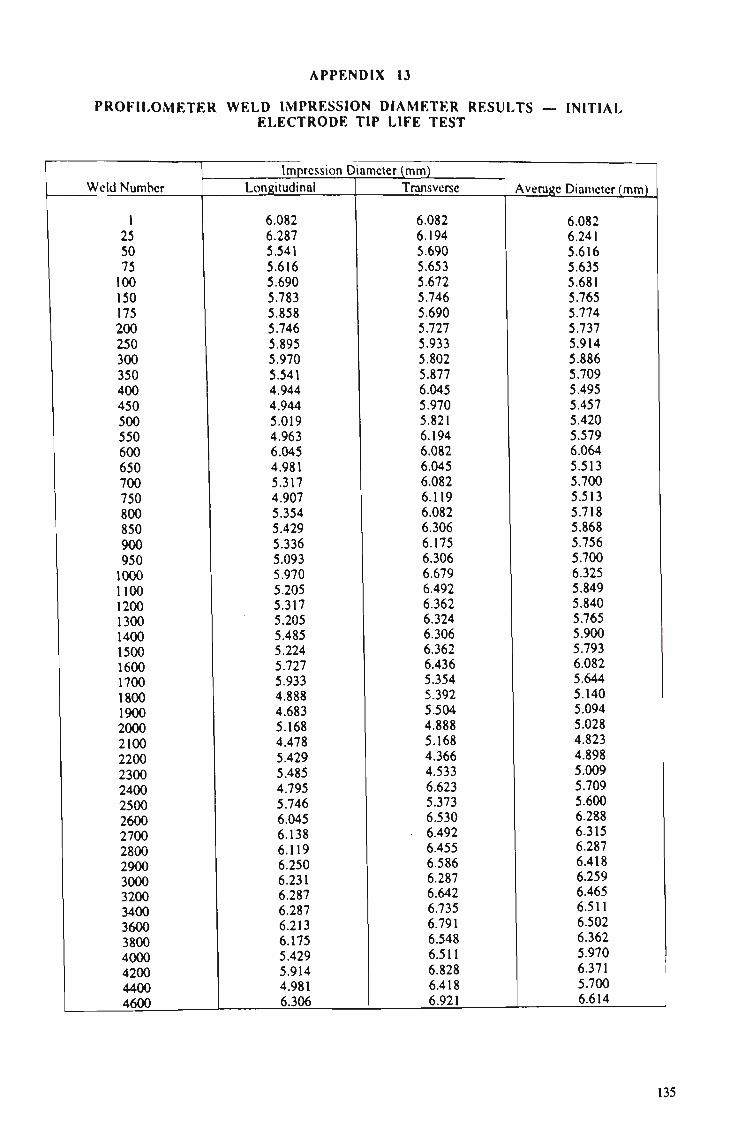
APPENDIX 13
PROFILOMETER WELD IMPRESSION DIAMETER RESULTS — INITIAL ELECTRODE TIP LIFE TEST
Weld Number
1 25 50 75 100 150 175 200 250 300 350 400 450 500 550 600 650 700 750 800 850 900 950 1000 1100 1200 1300 1400 1500 1600 1700 1800 1900 2000 2100 2200 2300 2400 2500 2600 2700 2800 2900 3000 3200 3400 3600 3800 4000 4200 4400 4600
Impression Diameter (mm) Longitudinal
6.082 6.287 5.541 5.616 5.690 5.783 5.858 5.746 5.895 5.970 5.541 4.944 4.944 5.019 4.963 6.045 4.981 5.317 4.907 5.354 5.429 5.336 5.093 5.970 5.205 5.317 5.205 5.485 5.224 5.727 5.933 4.888 4.683 5.168 4.478 5.429 5.485 4.795 5.746 6.045 6.138 6.119 6.250 6.231 6.287 6.287 6.213 6.175 5.429 5.914 4.981 6.306
Transverse
6.082 6.194 5.690 5.653 5.672 5.746 5.690 5.727 5.933 5.802 5.877 6.045 5.970 5.821 6.194 6.082 6.045 6.082 6.119 6.082 6.306 6.175 6.306 6.679 6.492 6.362 6.324 6.306 6.362 6.436 5.354 5.392 5.504 4.888 5.168 4.366 4.533 6.623 5.373 6.530 6.492 6.455 6.586 6.287 6.642 6.735 6.791 6.548 6.511 6.828 6.418 6.921
Average Diameter (mm)
6.082 6.241 5.616 5.635 5.681 5.765 5.774 5.737 5.914 5.886 5.709 5.495 5.457 5.420 5.579 6.064 5.513 5.700 5.513 5.718 5.868 5.756 5.700 6.325 5.849 5.840 5.765 5.900 5.793 6.082 5.644 5.140 5.094 5.028 4.823 4.898 5.009 5.709 5.600 6.288 6.315 6.287 6.418 6.259 6.465 6.511 6.502 6.362 5.970 6.371 5.700 6.614

APPENDIX 14
VISION SYSTEM WELD IMPRESSION DIAMETER RESULTS — INITIAL ELECTRODE TIP LIFE TEST
1v 1
Veld 1 dumber
I 25 50 75 100 125 150 175 200 250 300 350 400 450 500 550 600 650 700 750 800 850 900 950 1000 1100 1200 1300 1400 1500 1600 1700 1800 1900 2000 2100 2200 2300 2400 2500 2600 2700 2800 2900 3000 3200 3400 3600 3800 4000 4200 4400 4600
mprcssion Diameter (Pixel Spacing)
Longitudinal
53.641 60.516 55.266 56.484 59.797 56.844 87.891 68.031 67.797 68.000 73.797 65.391 66.344 77.469 78.828 82.891 80.156 95.922 74.313 73.609 82.547 72.938 77.016 78.984 78.313 81.688 90.953 88.563 87.359 84.625 86.469 89.609 86.922 79.594 81.234 83.547 75.500 77.391 82.859 86.797 83.688 89.844 91.344 90.828 92.219 87.313 98.875 94.297 89.609 88.359 85.984 86.063
j 86.781
Transverse
50.609 60.547 56.344 58.719 56.000 56.156 76.250 65.859 66.672 63.125 67.031 67.453 87.432 86.297 86.203 81.516 87.313 86.125 80.531 101.016 97.594 91.391 78.109 88.906 100.297 98.797 98.219 94.141 90.969 95.594 95.703 92.219 92.063 86.578 83.516 88.516 90.766 93.781 94.094 98.484 98.109 91.813 90.359 100.375 96.922 98.813 95.219 101.875 96.422 93.672 97.750 95.391 95.438
Average Diameter (Pixel Spacing)
52.075 60.532 55.805 57.602 57.899 56.500 82.071 66.945 67.235 65.563 70.414 66.422 76.888 81.883 82.516 82.204 83.735 91.024 77.422 87.313 90.071 82.165 77.563 83.945 89.305 90.243 94.586 91.352 89.164 90.110 91.086 90.914 89.493 83.086 82.375 86.032 83.133 85.586 88.477 92.641 90.899 90.829 90.852 95.602 94.571 93.063 97.047 98.086 93.016 91.016 91.867 90.727 91.110
Average Diameter (mm)
4.470 5.196 4.790 4.944 4.970 4.850 7.045 5.746 5.771 5.628 6.044 5.701 6.600 7.029 7.083 7.056 7.188 7.813 6.646 7.495 7.731 7.053 6.658 7.206 7.666 7.746 8.119 7.841 7.654 7.735 7.819 7.804 7.682 7.132 7.071 7.385 7.136 7.346 7.595 7.952 7.802 7.796 7.798 8.206 8.118 7.988 8.330 8.419 7.984 7.813 7.886 7.788 7.821
Circular Function
(%)
95 85 98 69 57 92 99 91 51 84 88 74 80 75 69 64 58 75 57 60 86 90 85 67 80 72 84 97 84 82 82 82 89 88 100 95 90 63 47 86 83 85 98 96 97 87 83 85 59 96 91 97 87
Note: Conversion 1 m m = 11.65 pixels
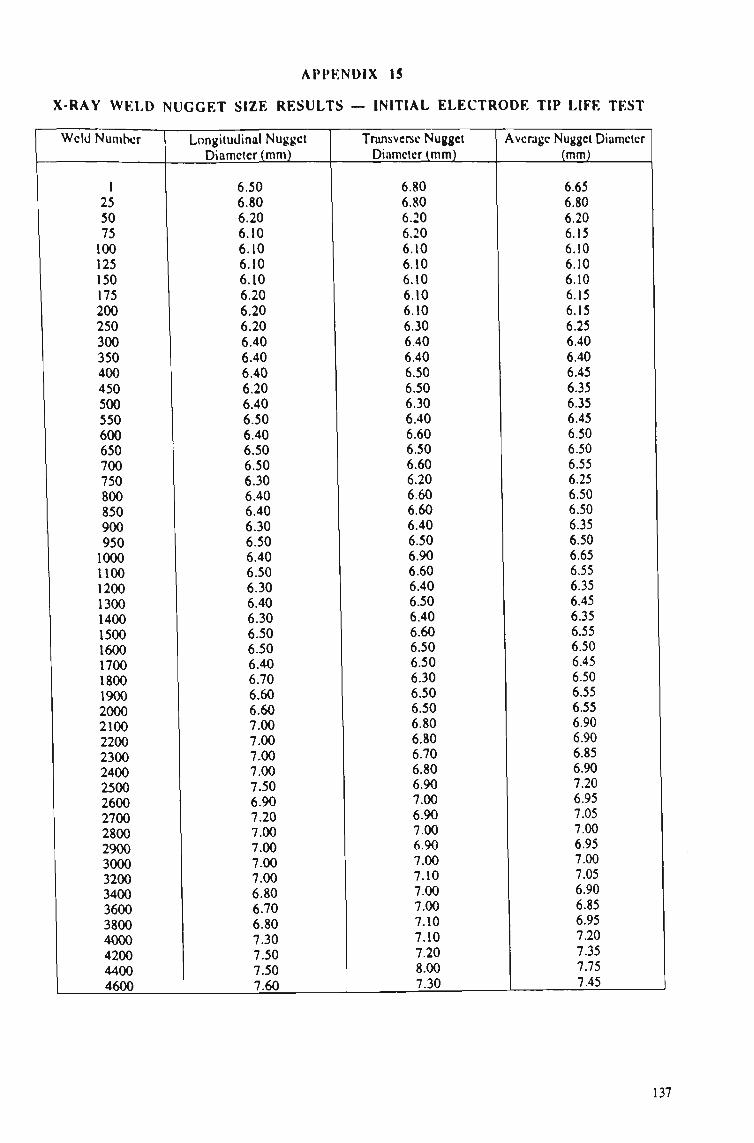
APPENDIX 15
X-RAY WELD NUGGET SIZE RESULTS — INITIAL ELECTRODE TIP LIFE TEST
Weld Number
1 25 50 75 100 125 150 175 200 250 300 350 400 450 500 550 600 650 700 750 800 850 900 950 1000 1100 1200 1300 1400 1500 1600 1700 1800 1900 2000 2100 2200 2300 2400 2500 2600 2700 2800 2900 3000 3200 3400 3600 3800 4000 4200 4400 4600
Longitudinal Nugget Diameter (mm)
6.50 6.80 6.20 6.10 6.10 6.10 6.10 6.20 6.20 6.20 6.40 6.40 6.40 6.20 6.40 6.50 6.40 6.50 6.50 6.30 6.40 6.40 6.30 6.50 6.40 6.50 6.30 6.40 6.30 6.50 6.50 6.40 6.70 6.60 6.60 7.00 7.00 7.00 7.00 7.50 6.90 7.20 7.00 7.00 7.00 7.00 6.80 6.70 6.80 7.30 7.50 7.50
1 7.60
Transverse Nugget Diameter (mm)
6.80 6.80 6.20 6.20 6.10 6.10 6.10 6.10 6.10 6.30 6.40 6.40 6.50 6.50 6.30 6.40 6.60 6.50 6.60 6.20 6.60 6.60 6.40 6.50 6.90 6.60 6.40 6.50 6.40 6.60 6.50 6.50 6.30 6.50 6.50 6.80 6.80 6.70 6.80 6.90 7.00 6.90 7.00 6.90 7.00 7.10 7.00 7.00 7.10 7.10 7.20 8.00 7.30
Average Nugget Diameter (mm)
6.65 6.80 6.20 6.15 6.10 6.10 6.10 6.15 6.15 6.25 6.40 6.40 6.45 6.35 6.35 6.45 6.50 6.50 6.55 6.25 6.50 6.50 6.35 6.50 6.65 6.55 6.35 6.45 6.35 6.55 6.50 6.45 6.50 6.55 6.55 6.90 6.90 6.85 6.90 7.20 6.95 7.05 7.00 6.95 7.00 7.05 6.90 6.85 6.95 7.20 7.35 7.75 7.45

APPENDIX 16
ULTRASONIC C-SCAN WELD NUGGET SIZE RESULTS — INITIAL ELECTRODE TIP LIFE TEST
Weld Number
1 25 50 75 100 125 150 175 200 250 300 350 400 450 500 550 600 650 700 750 800 850 900 950 1000 1100 1200 1300 1400 1500 1600 1700 1800 1900 2000 2100 2200 2300 2400 2500 2600 2700 2800 2900 3000 3200 3400 3600 3800 4000 4200 4400 4600
-ongiludinal/Transvcrsc Nugget Diameter (mm)
- Outer
N o result 7.44/7.44 6.24/6.48 6.48/6.26 6.24/6.48 6.48/6.48 7.20/6.72 6.24/6.24 6.48/6.48 6.48/6.48 6.24/6.48 5.76/5.76 6.72/6.72 6.48/6.48 5.52/6.24 5.76/6.48 6.48/6.48 7.20/7.44 5.76/6.48 5.28/5.76 5.28/6.96 6.48/6.24 5.52/6.48 5.76/6.72 6.48/8.16 6.48/6.96 6.48/7.20 6.96/7.20 6.96/6.96 N o result 5.04/6.24 7.20/7.68 6.24/6.72 6.72/6.96 5.28/5.52 5.28/5.28 6.48/6.00 5.52/5.58 6.96/6.96 6.00/6.24 6.24/6.72 6.24/5.76 5.28/6.72 7.20/6.96 6.24/6.48 6.96/6.72 6.24/7.20 6.48/6.72 5.76/6.48 5.52/6.72 5.76/6.48 5.28/6.48 5.76/6.48
Average Nugget Diameter (mm) -
Outer
N o result 7.44 6.46 6.36 6.36 6.48 6.96 6.24 6.48 6.48 6.36 5.76 6.72 6.48 5.88 6.12 6.48 7.32 6.12 5.52 6.12 6.36 6.00 6.24 7.32 6.72 6.84 7.08 6.96
N o result 5.64 7.44 6.48 6.84 5.40 5.28 6.24 5.55 6.96 6.12 6.48 6.00 6.00 7.08 6.36 6.84 6.72 6.60 6.12 6.12 6.12 5.88 6.12
Longitudinal/Transverse Nugget Diameter (mm)
- Inner
No result 5.04/4.80 5.04/4.80 4.32/3.84 4.80/4.80 5.28/5.76 4.56/5.28 1.68/2.16 -/-
5.04/4.80 4.80/4.80 4.342/3.36 5.28/4.80 4.80/3.60
-/--/-
3.84/4.08 4.56/3.12
-/--/-
4.80/5.52 5.04/5.76 5.28/5.52 4.80/5.76
-/-5.76/7.20 2.64/2.40
-/-1.20/0.72 N o result -/-
-f--/-
5.76/6.24 -/-
1.20/1.44 6.24/5.04
-/-4.32/4.80
-/-4.32/4.08 4.56/5.76 2.88/3.12
-/-4.56/4.08 4.80/5.04 4.80/4.32 4.32/4.08 3.36/4.80
-/-3.36/4.56
-/-3.84/2.88
Average Nugget Diameter (mm) -
Inner
N o result 4.92 4.92 4.08 4.80 5.52 4.92 1.92 -
4.92 4.80 3.84 5.04 4.20 --
3.96 3.84 --
5.16 5.40 5.40 5.28 -
6.48 2.52 -
0.96 N o result
---
6.00 -
1.32 5.64 -
4.56 —
4.20 5.16 3.00 —
4.32 4.92 4.56 4.20 4.08 -
3.96 —
3.36
138

APPENDIX 17
PEEL TEST RESULTS MEASURED THROUGH VERNIER CALLIPERS
Weld Number Longitudinal Nugget Diameter
1 25 50 75 100 125 150 175 200 250 300 350 400 450 500 550 600 650 700 750 800 850 900 950 1000 1100 1200 1300 1400 1500 1600 1700 1800 1900 2000 2100 2200 2300 2400 2500 2600 2700 2800 2900 3000 3200 3400 3600 3800 4000 4200 4400 4600
(mm)
5.54 5.46 5.32 4.90 4.92 4.60 4.64 5.16 4.58 4.34 4.66 4.58 4.54 4.14 4.52 4.46 4.12 4.18 4.44 4.26 4.38 4.62 4.26 4.42 5.44 5.14 4.82 4.74 4.58 4.18 4.06 3.84 3.80 4.44 4.56 3.68 3.64 3.24 3.20 2.44 3.54 4.20 4.00 4.36 4.68 4.54 4.24 4.42 4.82 4.16 2.50 3.34 3.24
Transverse Nugget Diameter (mml
6.10 5.92
Tail excessive 5.24 5.42 4.90 5.36 4.42 4.98 4.66 5.22 5.18 5.36 4.82 5.00 5.40 4.98 4.88 5.22 5.02 4.98 5.48 4.92 5.22 5.28 4.98 5.82 5.56 4.64 4.24 4.82 4.38 4.38 4.04 4.40 4.42 4.08 4.28 3.84 2.74 4.10 4.42 3.84 4.50 4.92 5.10 5.00 5.50 4.72 5.28 2.86 3.04 4.00
Average Nugget Diameter (mm)
5.82 5.69 5.32 5.07 5.17 4.75 5.00 4.79 4.78 4.50 4.94 4.88 4.95 4.48 4.76 4.93 4.55 4.53 4.83 4.64 4.68 5.05 4.59 4.82 5.36 5.06 5.32 5.15 4.61 4.21 4.44 4.11 4.09 4.24 4.48 4.48 3.86 3.76 3.52 2.59 3.82 4.31 3.92 4.43 4.80 4.82 4.62 4.96 4.77 4.72 2.68 3.19 3.62

APPENDIX 18
VISION SYSTEM WELD IMPRESSION DIAMETER RESULTS — SECOND ELECTRODE TIP LIFE RUN
Weld Number
1 2 3
249 250 251 499 500 501 749 750 751 999 1000 1001 1249 1250 1251 1499 1500 1501 1749 1750 1751 1999 2000 2001 2249 2250 2251 2499 2500 2501 2749 2750 2751 2999 3000 3001 3249 3250 3251 3499 3500 3501 3749 3750 3751 3999 4000 4001 4249
Impression Diameter (Pixel Spacing) Longitudinal Transverse
446.625 451.734 434.266 427.469 422.937 425.344 418.391 409.500 416.906 420.547 416.734 412.094 437.812 420.266 429.906 423.594 412.734 426.625 428.672 441.734 423.672 440.812 430.656 455.359 424.937 443.844 432.922 438.547 435.016 428.594 453.375 447.625 439.859 433.219 447331 470.734 458.453 435.859 451.453 442.937 450.656 454378 467331 444394 468316 458.687 446.656 436.406 464.719 464.344 459.187 466.672
439.750 429.1456 446.312 405.687 430.172 438.250 431.609 438.219 435.844 429.828 446.141 430.672 431.187 446.328 442.234 429.047 435.500 442.047 447.812 439.000 451.641 439.422 434.937 454.984 443.641 450.109 441.641 446.172 458.359 451.969 458.734
. 471.922 470.547 457.234 453.375 458.641 451.781 452.469 449.812 450.859 450.922 452.062 464.750 456.156 454.219 458.641 456.203 464.031 458.312 466.578 461.234 447.719
Average Diameter (Pixel Spacing)
443.188 440.445 440.289 416.578 426.555 431.797 425.000 423.860 426.375 425.188 431.438 421.383 434.500 433.297 436.070 426.321 424.117 434.336 438.242 440.367 437.657 440.117 432.797 455.172 434.289 446.977 437.282 442.360 446.688 440.282 436.055 459.774 455.204 445.227 450.453 446.688 455.117 444.164 450.633 446.898 450.789 453.320 466.141 450.375 461.368 458.664 451.430 450.219 461.516 465.461 460.211 457.1%
Average Diameter (mm)
6.211
5.981
5.983
5.996
6.117
6.027
6.175
6.230
6.186
6.236
6.338
6.382
6.333
6.338
6.464
6.382
6.508

APPENDIX 18 (Cont)
Weld Number
4250 4251 4499 4500 4501 4599 4600 4601
Impression Diameter (Pixel Spacing)
Longitudinal
471.641 465.531 466.234 465.094 467.656 485.312 472.000 481.906
Transverse
465.391 466.297 468.687 452.875 459.297 458.641 453.609 464.344
Average Diameter (Pixel Spacing)
468.516 465.914 467.461 458.985 463.477 471.977 462.805 473.125
Average Diameter (mm)
6.529
6.521
6.605
Note: Conversion 1 m m = 71.05 pixels
141
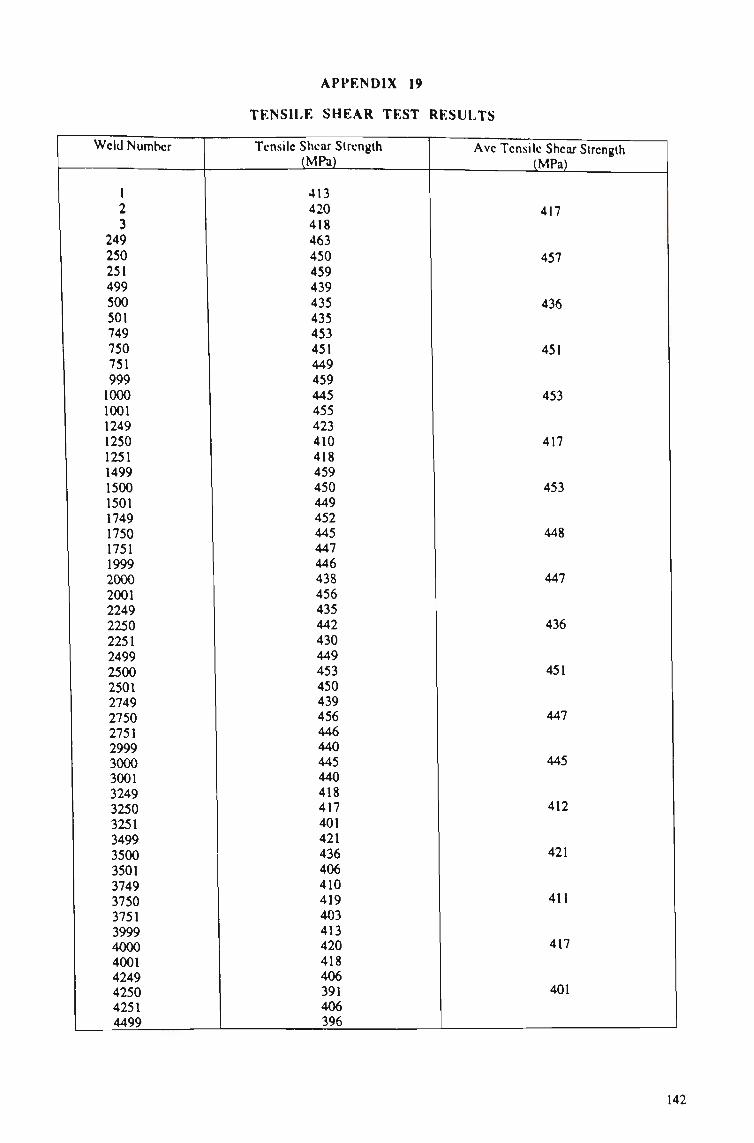
APPENDIX 19
TENSILE SHEAR TEST RESULTS
Weld Number
1 2 3
249 250 251 499 500 501 749 750 751 999 1000 1001 1249 1250 1251 1499 1500 1501 1749 1750 1751 1999 2000 2001 2249 2250 2251 2499 2500 2501 2749 2750 2751 2999 3000 3001 3249 3250 3251 3499 3500 3501 3749 3750 3751 3999 4000 4001 4249 4250 4251 4499
Tensile Shear Strength (MPa)
413 420 418 463 450 459 439 435 435 453 451 449 459 445 455 423 410 418 459 450 449 452 445 447 446 438 456 435 442 430 449 453 450 439 456 446 440 445 440 418 417 401 421 436 406 410 419 403 413 420 418 406 391 406 396
Ave Tensile Shear Strength (MPa)
417
457
436
451
453
417
453
448
447
436
451
447
445
412
421
411
417
401

APPENDIX 19 (Cont)
Weld Number
4500 4501 4599 4600 4601
Tensile Shear Strength (MPa)
384 402 395 374 386
Ave Tensile Shear Strength (MPa)
394
385
143