
Ouweneel 1996 - Away From Prying Eyes - Zapatista Revolt of 1994

United StatesDepartment ofAgriculture
Forest Service
PacificSouthwestRegion
StanislausNational Forest
March 1997
1994-19961994-1996Monitoring andMonitoring andEvaluation ReportEvaluation Report
Land and ResourceManagement Plan
Stanislaus National Forest


i
Executive SummaryThis report documents the results of monitoring and evaluation activities accomplished from October 1, 1993 toSeptember 30, 1996. It also presents the conclusions and recommendations based on those results. TheInterdisciplinary Team (IDT) reviewed the results in an integrated fashion, by asking the following questions.
n Does the Forest Plan work?
n What monitoring has been done and what does it mean?
n Does monitoring relate to Forest Plan goals?
n Do managers consider monitoring results when making decisions?
n Do we monitor the right things?
n What additional monitoring is needed?
n What have we learned from outside sources (SNEP, etc.)?
Results
The Forest Plan includes 93 individual monitoring items in 22 broad categories ranging from Air Quality to ForestStandards and Guidelines (S&Gs). Accomplishments also showed monitoring of 9 individual items not included inthe Forest Plan, bringing the total to 102. Monitoring activity occurred on 69 (74%) of the 93 Forest Plan items andon all 9 (100%) of the non-Forest Plan items. The Core Team reviewed the information pertaining to all 102 items,comparing conditions to monitoring limits of variability defined and established in Forest Plan Chapter V. Resultsshow the Core Team:
A. Determined conditions are within limits of variability on 19 (20%) of the 93 Forest Plan monitoring items.
B. Determined conditions are not within limits of variability on 20 (22%) of the 93 Forest Plan monitoring items.
C. Could not determine whether conditions are within, or not within limits of variability on 24 (26%) of the 93Forest Plan monitoring items.
D. Could not evaluate conditions because the Forest Plan does not include monitoring standards or limits ofvariability on 6 (6%) of the 93 Forest Plan monitoring items and 9 (100%) of the non-Forest Plan items.
E. Could not evaluate conditions because monitoring did not occur or, monitoring occurred but was not reportedon 24 (26%) of the 93 Forest Plan monitoring items.
Conclusions
While evaluating the specific results of each individual monitoring activity, the Core Team developed conclusionsand grouped them into the broad categories of Forest Plan Direction; and, Monitoring and Evaluation.
Forest Plan Direction
1. Applicable Forest Plan management direction and monitoring requirements are up-to-date and conditions arewithin limits of variability for 7 Forest Plan monitoring items.

ii
2. Conditions are not within limits of variability, however it is likely that conditions can meet limits of variabilitywith improved application of existing management direction, for 7 Forest Plan and 1 non-Forest Planmonitoring items.
3. Monitoring results did not show any items where applicable Forest Plan management direction is out-of-date.
4. Applicable Forest Plan S&Gs are out-of-date or do not provide specific management direction for 8 ForestPlan and 1 non-Forest Plan monitoring items.
5. Applicable Forest Plan management area allocations are out-of-date for 1 Forest Plan monitoring item.
6. Applicable Forest Plan projected outputs are out-of-date and do not accurately reflect recent or expected futureaccomplishments for 6 Forest Plan monitoring items.
7. Some conditions are not within limits of variability and several Forest Plan Amendments are needed. However,overall monitoring results indicate conditions are moving towards desired conditions as stated in the ForestGoals (see Appendix). In addition, the Core Team did not identify any items where applicable Forest Planmanagement direction, S&Gs, management area allocations and monitoring requirements are all out-of-dateor, of sufficient magnitude to warrant Forest Plan revision.
8. Some Forest Plan monitoring requirements are “accomplishments”, duplicates of other monitoring items,covered by project plans or, not feasible on a Forest scale.
a. Monitoring requirements reflect “accomplishments” for 20 Forest Plan monitoring items.
b. Monitoring requirements are duplicates of other monitoring items, covered by project plans or, notfeasible on a Forest scale for 16 Forest Plan monitoring items.
9. Monitoring requirements are out-of-date, no longer feasible as written or, do not include specific indicators ofresource conditions or measurable standards for 41 Forest Plan and all 9 non-Forest Plan monitoring items.
10. Not enough information exists and the information is needed to help answer questions for 10 Forest Planmonitoring items.
Monitoring and Evaluation
11. Completion of the Monitoring Report by November 30 each year is not feasible.
12. Monitoring occurs but is not consistently reported in a timely manner.
13. Managers consider monitoring information while developing and approving site specific projects.
14. Considering recent funding levels, it is impossible to achieve the full Forest Plan monitoring program.
15. The Forest Plan monitoring program is based on a much larger timber program than currently exists.
16. The Monitoring Program is not well integrated into the Forest’s annual Program of Work.
17. Although the Core Team could not determine conditions on 48 Forest Plan monitoring items (see results c ande), it is unlikely that trends could be established for most, over the short 5 years since Forest Plan approval,even with more information and unlimited monitoring budgets.

iii
Recommendations
The Core Team reviewed their conclusions and developed the following recommendations. These items arerecommended to the Forest Supervisor for any further action.
Forest Plan Direction
Short-termn No action needed (continue current monitoring) for 7 Forest Plan monitoring items.
n Improve application of management prescriptions for 7 Forest Plan monitoring and 1 non-Forest Planitems.
n Complete Forest Plan Amendments for the Emigrant Wilderness and Motor Vehicle Travel Management.
n Complete a minor Forest Plan Amendment separating the 57 Forest Plan resource monitoring items fromthe 36 accomplishment and duplicate items.
n Initiate the 5 year Forest Plan Review.
n Increase Monitoring/Reporting/Documentation for 10 Forest Plan monitoring items.
Long termn Amend Forest Plan Diversity and Wildlife S&Gs and, amend Forest Plan Management Area Allocations
for Bald Eagle Recovery Habitat, pending Regional direction for the California Spotted Owl.
n Amend Forest Plan Chapter V and the Schedule of Outputs pending the 5 year Forest Plan review.
Monitoring and Evaluation
Short-termn Complete annual Monitoring and Evaluation (M&E ) Report by March 31.
n Prepare a Forest Service Manual Supplement to establish tracking and reporting protocols and establishformal role of Forest and District Monitoring Coordinators.
n Develop annual monitoring programs, based on information contained in the previous M&E Report,incorporating into Programs of Work by assigning priorities and funding.
n Schedule and conduct reviews of Forest Plan Standards and Guidelines implementation.
n Add Monitoring Performance Element to manager’s performance evaluation. Consider monitoring part ofthe normal job and address monitoring in project planning. Consider Monitoring not complete withoutadequate documentation and reporting.
Long-termn Coordinate with other federal and state agencies on large scale monitoring.
n Expect a smaller overall program. Adjust monitoring and seek other funding sources to reflect reducedtimber targets and budgets. Prioritize monitoring activities and concentrate annual efforts to obtain resultson a watershed scale.
n Consider California Owl implications while developing future monitoring strategies.

1
IntroductionThe Regional Forester approved the Stanislaus National Forest Land and Resource Management Plan (ForestPlan) and Environmental Impact Statement (EIS) on October 28, 1991 (USDA 1991). The Forest Plan (as amended)and EIS are both incorporated here by reference. Chapter V of the Forest Plan includes a monitoring program. Asstated in the Forest Plan (page V-1) the purpose of monitoring is to:
1. Inform the decision maker of progress toward achieving Plan goals and objectives, and applying standards andguidelines.
2. Determine the costs and effects of Plan implementation.
3. Identify when Plan amendments/revisions are needed.
In addition to monitoring, the Forest Plan requires evaluation of results. Evaluation is the analysis and interpretationof monitoring data to determine whether changes in the Forest Plan, or in project implementation are necessary.Monitoring and evaluation are critical elements ensuring that the Forest Plan remains a dynamic and responsibletool for managing the Forest’s land and resources in a changing social and economic climate.
This report, prepared by the Interdisciplinary Team (IDT) for the Forest Supervisor, documents the results ofmonitoring and evaluation activities accomplished on the Stanislaus National Forest during federal fiscal years1994, 1995 and 1996 (October 1, 1993 to September 30, 1996). It also presents the Core Interdisciplinary Team’s(Core Team) evaluation of those results. While conducting this evaluation, the Core Team also considered theprevious monitoring information, conclusions and recommendations contained in the 1992-1993 StanislausNational Forest Monitoring and Evaluation Report (USDA 1993b). Therefore, this report addresses all monitoringinformation obtained on the Stanislaus National Forest since Forest Plan approval (October 28, 1991).
ProcessIn order to prepare this report, the Forest identified District Coordinators and an IDT consisting of Core Team andExpanded Team members (see List of Preparers). Their roles, along with criteria for selection, are shown below.
District Coordinators
1. Familiar with sub-unit Monitoring2. Coordinate input to Core Team3. Assign 1 of 4 to Core Team
Core Team
1. Forest Plan Knowledge and Experience2. Functional Expertise3. Review Accomplishments4. Evaluation and Recommendations
Expanded Team
1. Familiar with sub-unit Monitoring2. Functional Expertise3. Review Accomplishments4. Coordinate input to Core Team

2
Tracking FormThe IDT developed a tracking form (see Appendix) to facilitate its evaluation of monitoring results. Tracking formsinclude summary information such as the project name and location, monitoring activity, dates, results and filelocations. Persons responsible for monitoring activities completed tracking forms for each activity or each group ofsimilar activities. They submitted the forms to their respective District Coordinators, who then forwarded Districtpackages to the IDT. The IDT assigned numbers to each tracking form according to the resource and key numbersshown in Table 1 (form number 18-2-3 is the third form for item 18-2 which is Watershed S&Gs).
The accomplishments and results shown in this report are based on projects and activities reported on trackingforms and performed to the levels specified in the Forest Plan. Although more monitoring may occur, the IDT didnot show accomplishments for any items without a tracking form as documentation or, conducted at less thanForest Plan levels.
Purposes of the tracking form are outlined below.
n Tracks Monitoring and Evaluation Activities
n Allows Coordination with Clavey Watershed Review (see monitoring item 19-A)
n Serves as Central Database
n Responds to Questions
n Easy to Update Information
n Facilitates Core Team Evaluation
n Subject to Change
The entire IDT reviewed this information in light of Forest Plan Chapter V requirements. Later, the Core Teamcompleted its evaluation in an integrated fashion to develop the results, conclusions and recommendationscontained in this report.
FormatThe IDT compiled this report using the recently issued Forest Service Forest Plan Monitoring and EvaluationReport format shown below. This report is one of the first of to use the new format that is subject to furtherrefinement in the future.
1. Forest Supervisor(s) CertificationForest Supervisor's signed finding on whether plan amendments are needed based on monitoring andevaluation results.
2. Monitoring ActivitiesBrief summary of: reviews and other administrative activities undertaken during the reporting period as part ofthe Forest's monitoring and evaluation program; and, monitoring activities specified in the Forest Plan thatwere conducted during the reporting period.

3
3. Evaluation of monitoring results and conclusionsAn interdisciplinary evaluation (not single discipline viewpoints). What were the conclusions drawn from themonitoring data collected and evaluated?
4. Proposed Action PlanBased on the evaluation and conclusions, what additional monitoring activity is needed (or no longer needed)and/or what plan amendments or revisions are proposed?
5. Status of previous years recommendationsAdditional monitoring and or amendment/revision activity conducted during the reporting period as a result ofprior years' monitoring and evaluation conclusions.
6. Update of research needsSummary of significant research findings during the reporting period related to Plan monitoring, evaluation andimplementation.
7. List of PreparersDocument names and disciplines of report preparers or contributors.
8. Location of supporting documentation for monitoring activitiesForest or Province files, databases, etc. (Note that the report itself is not where monitoring data are found).
9. Public participation/disclosure planHow was the public involved in and going to be informed of the monitoring and evaluation report and itsconclusions (e.g. outreach, request, news releases, meetings)?
10. Appendix or reference to other records
Monitoring ActivitiesThe Forest Plan includes a total of 93 individual monitoring items in 22 broad categories ranging from Air Quality toForest Standards and Guidelines (S&Gs). Table 1 shows monitoring and evaluation accomplishments as reportedon tracking forms for fiscal years 1994, 1995 and 1996. It lists the 22 Forest Plan categories (Resource) and ashort description of each monitoring objective (Objective). The item number (Key), is used for tracking purposes(see Tracking Form). Monitoring activities or accomplishments are shown by fiscal year and by watershed (seeNational Forest System Watersheds Map). Items shown as not applicable under accomplishments in Table 1 donot occur or apply in that particular watershed.

4
Table 1: Monitoring and Evaluation Accomplishments; as reported on tracking forms; fiscal years 1994,
1995 and 1996; Stanislaus National Forest; page 1 of 3 (see legend at end of table).
AccomplishmentsResource Key Objective FY Location (Watershed Number)
94 95 96 1 2 3 4 5 6 7 8 9 10 11 12 13 14 15 16 17
1 Air Quality 1-1 Air quality related values
1-2 Smoke emissions
1-3 Air pollution (fugitive dust)
2 Cultural Resource 2-1 Cumulative effects; mitigation
3 Diversity 3-1 Acres major vegetative type*
3-2 Acres forest seral stage*
3-A Vegetation treatments
4 Fire and Fuels 4-1 Acre control objectives
5 Fish and 5-1 Wildlife: vegetation diversity*
Wildlife 5-2 Wildlife: special habitat
5-3 Wildlife: riparian areas
5-4 Wildlife: stream ecosystems
Spotted Owl 5-5 S&Gs for habitat
5-6 Population and habitat trend
5-7 S&Gs for viable populations
Goshawk 5-8 S&Gs for habitat
5-9 Population trend
Flycatcher 5-10 Population status and trend
5-11 S&Gs for habitat
Great Gray Owl 5-12 Population status and trend
5-13 S&Gs for habitat
Peregrine Falcon 5-14 Nesting and reproductive
Bald Eagle(wintering)
5-15 Population status and trend
5-16 Condition of recovery habitat
Gray Squirrel 5-17 Population status and trend
Woodpecker 5-18 Population status and trend
Mule Deer 5-19 Population status and trend
Fisher 5-20 Population status and trend
Marten 5-21 Population status and trend
Resident Trout 5-22 Population status and trend
Lahontan Trout 5-23 Population status and trend
Riparian Bird 5-24 Habitat capability trends
Conifer Bird 5-25 Habitat capability trends
Meadow Bird 5-26 Habitat capability trends
Oak Bird 5-27 Habitat capability trends
5-A Bald Eagle nesting
5-B Amphibian timed survey
5-C Forestwide amphibian
5-D Bats
6 Forest Pests 6-1 Problems and damage
7 Geology 7-1 Mitigation measures

5
Table 1: Monitoring and Evaluation Accomplishments; as reported on tracking forms; fiscal years 1994,
1995 and 1996; Stanislaus National Forest; page 2 of 3 (see legend at end of table).
AccomplishmentsResource Key Objective FY Location (Watershed Number)
94 95 96 1 2 3 4 5 6 7 8 9 10 11 12 13 14 15 16 17
8 Lands 8-1 Land adjustments
8-2 Landline location priorities
8-3 Right-of-way acquisition
8-4 Land occupancy and use
9 Range 9-1 Range condition and trend*
9-2 Permitted and actual AUMs
9-3 Allotment management
9-4 Administration and compliance
9-5 Range improvements
9-A Noxious Weeds
10 Recreation 10-1 ROS Classes
10-2 Condition of developed sites
10-3 Actual use of developed sites
10-4 Condition of dispersed camping
10-5 Effects of OHVs
11 Riparian Areas 11-1 Riparian maintained/improved
12 Sensitive 12-1 Selected populations
Plants 12-2 Changes to all populations
12-3 Viable populations
13 Soils 13-1 S&Gs for soil productivity
13-2 Soil moisture conditions
13-3 Tree, grass and shrub growth
13-4 Effects of OHVs
13-5 Soil resource improvements
13-6 Soil moisture regime
13-7 Soil hydrologic function
13-8 Soil environmental health
14 Special Areas 14-1 Botanic SIA conditions*
14-2 Cultural SIA conditions
14-3 Cave conditions
14-A Research Natural Areas
15 Timber 15-1 Allowable sale quantity
15-2 Forest regulation
15-3 Reforestation and TSI needs
15-4 Harvest unit size
15-5 Timber suitability
15-6 Reforestation
15-7 Burn area reforestation
15-8 Yield table projections*
15-9 Timber stand improvements
15-A Herbicides

6
Table 1: Monitoring and Evaluation Accomplishments; as reported on tracking forms; fiscal years 1994,
1995 and 1996; Stanislaus National Forest; page 3 of 3 (see legend at end of table).
AccomplishmentsResource Key Objective FY Location (Watershed Number)
94 95 96 1 2 3 4 5 6 7 8 9 10 11 12 13 14 15 16 17
16 Transportation 16-1 Roads closed to public vehicles
and Facilities 16-2 Average daily traffic
16-3 Road construction
16-4 Trail construction
17 Visual 17-1 Planned objectives
Resources 17-2 Trends in Scenic Corridors
17-3 Visual resource improvements
18 Water 18-1 Water quality standards (BMPs)
18-2 Watershed S&Gs
18-3 Water quality baseline
18-4 Watershed condition
18-5 Water yield predictions
19 Wild and 19-1 Wild and Scenic management *1
Scenic Rivers 19-A Wild and Scenic River values *1
20 Wilderness 20-1 Wilderness management
21 Economic 21-1 Cost of practices and activity
21-2 Values of goods and services
21-3 Return to counties
21-4 Local and area employment
22 Forest S&Gs 22-1 S&Gs reviews
Legend
Key Accomplishments Watersheds
19-1 Forest Plan Item Activities Occurred 1 North Fork Mokelumne River
19 Resource Number 2 Middle Fork Mokelumne River
1 Item Number None or Not Reported 3 South Fork Mokelumne River
* 10 Year Report Item 4 Calaveras River
19-A Non-Forest Plan Item Not Applicable 5 Stanislaus River
19 Resource Number 6 North Fork Stanislaus River
A Item Letter *1 The Sierra National 7 Lower Middle Fork Stanislaus River
Forest manages the 8 Upper Middle Fork Stanislaus River
AUMs Animal Unit Months Stanislaus portion of 9 South Fork Stanislaus River
BMPs Best Management Practices the Merced Wild and 10 Toulumne River
FY Fiscal Year (10-1 to 9/30) Scenic River 11 North Fork Tuolumne River
ROS Recreation Opportunity Spectrum 12 Clavey River
OHVs Off-Highway Vehicles 13 Cherry Creek
SIA Special Interest Area 14 Middle Fork Tuolumne River
S&Gs Standards and Guidelines 15 South Fork Tuolumne River
TSI Timber Stand Improvement 16 Merced River
17 North Fork Merced River

7

8

9
Evaluation of MonitoringThe IDT reviewed the results of monitoring and evaluation activities in an integrated fashion. In order to drawconclusions and make recommendations, the team identified these questions.
n Does the Forest Plan work?
n What monitoring has been done and what does it mean?
n Does monitoring relate to Forest Plan goals (see Appendix)?
n Do managers consider monitoring results when making decisions?
n Do we monitor the right things?
n What additional monitoring is needed?
n What have we learned from outside sources (SNEP, etc.)?
Table 2 shows a summary of the results of monitoring accomplished during the reporting period. Similar to Table1, it lists the Resources and Objectives along with the Core Team’s evaluation of results and theirconclusions/recommendations. The sections immediately following the table present more detailed explanations.Items shown as not applicable under results in Table 2 do not have standards or limits of variability established inthe Forest Plan.

10
Table 2: Monitoring and Evaluation Results, Conclusions and Recommendations; fiscal years 1994,
1995 and 1996; Stanislaus National Forest; page 1 of 3 (see legend at end of table).
Resource Key Objective Results Conclusions/RecommendationsA B C D E
1 Air Quality 1-1 Air quality related values 9 (not feasible as written)
1-2 Smoke emissions 9
1-3 Air pollution (fugitive dust) 1
2 Cultural Resource 2-1 Cumulative effects; mitigation 1 (natural events), 2 (management activities)
3 Diversity 3-1 Acres major vegetative type* 4 (California Owl direction), 9 (10 year report item)
3-2 Acres forest seral stage* 4 (California Owl direction), 9 (10 year report item)
3-A Vegetation treatments 4 (California Owl direction), 9
4 Fire and Fuels 4-1 Acre control objectives 8a
5 Fish and 5-1 Wildlife: vegetation diversity* 8b (cover in Diversity), (10 year report item)
Wildlife 5-2 Wildlife: special habitat 9 (California Owl direction)
5-3 Wildlife: riparian areas 9
5-4 Wildlife: stream ecosystems 10
Spotted Owl 5-5 S&Gs for habitat 4 (review territories), (California Owl direction)
5-6 Population and habitat trend 9 (California Owl direction)
5-7 S&Gs for viable populations 8b (not feasible at a Forest scale)
Goshawk 5-8 S&Gs for habitat 4 (review territories)
5-9 Population trend 9
Flycatcher 5-10 Population status and trend 9
5-11 S&Gs for habitat 2, 9
Great Gray Owl 5-12 Population status and trend 9
5-13 S&Gs for habitat 4 (review territories), 9, 10
Peregrine Falcon 5-14 Nesting and reproductive 1
Bald Eagle(wintering)
5-15 Population status and trend 1
5-16 Condition of recovery habitat 5 (review territories), 10
Gray Squirrel 5-17 Population status and trend 9 (habitat focus)
Woodpecker 5-18 Population status and trend 9 (habitat focus)
Mule Deer 5-19 Population status and trend 4 (Forest Plan appeal resolution)
Fisher 5-20 Population status and trend 9 (habitat focus)
Marten 5-21 Population status and trend 9 (habitat focus)
Resident Trout 5-22 Population status and trend 9
Lahontan Trout 5-23 Population status and trend 9
Riparian Bird 5-24 Habitat capability trends 9
Conifer Bird 5-25 Habitat capability trends 9
Meadow Bird 5-26 Habitat capability trends 9
Oak Bird 5-27 Habitat capability trends 9
5-A Bald Eagle nesting 9
5-B Amphibian timed survey 9
5-C Forestwide amphibian 9
5-D Bats 9
6 Forest Pests 6-1 Problems and damage 1
7 Geology 7-1 Mitigation measures 8b (project report)

11
Table 2: Monitoring and Evaluation Results, Conclusions and Recommendations; fiscal years 1994,
1995 and 1996; Stanislaus National Forest; page 2 of 3 (see legend at end of table).
Resource Key Objective Results Conclusions/RecommendationsA B C D E
8 Lands 8-1 Land adjustments 8a
8-2 Landline location priorities 8a
8-3 Right-of-way acquisition 8a
8-4 Land occupancy and use 8b (project report)
9 Range 9-1 Range condition and trend* 10 (10 year report item)
9-2 Permitted and actual AUMs 8a
9-3 Allotment management 8b (cover conditions in 9-4)
9-4 Administration and compliance 9
9-5 Range improvements 8b (cover conditions in 9-4)
9-A Noxious weeds 9
10 Recreation 10-1 ROS Classes 8b (project report)
10-2 Condition of developed sites 9
10-3 Actual use of developed sites 8a
10-4 Condition of dispersed camping 10
10-5 Effects of OHVs 4, 9
11 Riparian Areas 11-1 Riparian maintained/improved 2, 9
12 Sensitive 12-1 Selected populations 9, 10
Plants 12-2 Changes to all populations 9
12-3 Viable populations 8b (not feasible at Forest scale)
13 Soils 13-1 S&Gs for soil productivity 2, 9
13-2 Soil moisture conditions 8b (cover conditions in 13-1)
13-3 Tree, grass and shrub growth 8b (cover conditions in 13-1)
13-4 Effects of OHVs 8b (cover in Recreation 10-5)
13-5 Soil resource improvements 2
13-6 Soil moisture regime 9
13-7 Soil hydrologic function 9
13-8 Soil environmental health 1
14 Special Areas 14-1 Botanic SIA conditions* 9, 10 (10 year report item)
14-2 Cultural SIA conditions 9, 10
14-3 Cave conditions 9
14-A Research Natural Areas 2, 9
15 Timber 15-1 Allowable sale quantity 6, 8a
15-2 Forest regulation 8a
15-3 Reforestation and TSI needs 8a
15-4 Harvest unit size 8a
15-5 Timber suitability 8a
15-6 Reforestation 8a (standard not measurable with green and burn)
15-7 Burn area reforestation 6, 8a (standard not feasible)
15-8 Yield table projections* 8b (not feasible, growth faster than predictions)
15-9 Timber stand improvements 1
15-A Herbicides 9

12
Table 2: Monitoring and Evaluation Results, Conclusions and Recommendations; fiscal years 1994,
1995 and 1996; Stanislaus National Forest; page 3 of 3 (see legend at end of table).
Resource Key Objective Results Conclusions/RecommendationsA B C D E
16 Transportation 16-1 Roads closed to public vehicles 8b (project report)
and Facilities 16-2 Average daily traffic 8b (project report)
16-3 Road construction 8a
16-4 Trail construction 8a
17 Visual 17-1 Planned objectives 8b (project report)
Resources 17-2 Trends in Scenic Corridors 9
17-3 Visual resource improvements 8a
18 Water 18-1 Water quality standards (BMPs) 2, 9
18-2 Watershed S&Gs 2, 9
18-3 Water quality baseline 9
18-4 Watershed condition 9
18-5 Water yield predictions 8b (not feasible)
19 Wild and 19-1 Wild and Scenic management 10
Scenic Rivers 19-A Wild and Scenic River values 9
20 Wilderness 20-1 Wilderness management 4, 9
21 Economic 21-1 Cost of practices and activity 6, 8a
21-2 Values of goods and services 6, 8a
21-3 Return to counties 6, 8a
21-4 Local and area employment 6, 8a
22 Forest S&Gs 22-1 S&Gs reviews 9, 10
Legend
Key Results
19-1 Forest Plan Item A Conditions within limits of variability
19 Resource Number B Conditions not within limits of variability
1 Item Number C Not enough information
* 10 Year Report Item D Not Applicable (no standards)
19-A Non-Forest Plan Item E None Conducted or Reported
19 Resource Number Conclusions/RecommendationsA Item Letter 1 No action needed (continue current monitoring)
2 Improve application of management prescriptions
AUMs Animal Unit Months 3 Amend Forest Plan management prescriptions
BMPs Best Management Practices 4 Amend Forest Plan S&Gs
FY Fiscal Year (10-1 to 9/30) 5 Amend Forest Plan management area allocations
ROS Recreation Opportunity Spectrum 6 Amend Forest Plan schedule of outputs
OHVs Off-Highway Vehicles 7 Revise Forest Plan
SIA Special Interest Area 8 Amend (minor) Forest Plan Monitoring
S&Gs Standards and Guidelines a. Accomplishment
TSI Timber Stand Improvement b. Duplicate or Not Feasible
9 Amend Forest Plan Monitoring (and S&Gs if needed)
10 Increase Monitoring/Reporting/Documentation

13
ResultsThe Forest Plan includes a total of 93 individual monitoring items in 22 broad categories ranging from Air Quality toForest Standards and Guidelines (S&Gs). Accomplishments also showed monitoring of 9 individual items notincluded in the Forest Plan, bringing the total to 102. Monitoring activity occurred on 69 (74%) of the 93 ForestPlan items and on all 9 (100%) of the non-Forest Plan items. The Core Team reviewed the information pertainingto all 102 items, comparing conditions to monitoring limits of variability defined and established in Forest PlanChapter V.
This Section provides a summary of the results obtained from monitoring activities conducted on the Stanislausduring fiscal years 1994, 1995 and 1996. While conducting this portion of the evaluation, the Core Team alsoconsidered the monitoring results contained in the 1992-1993 Stanislaus National Forest Monitoring and EvaluationReport (USDA 1993b).
Results show each item falling into one of the following categories (see Table 2 for notes and legend).
A. Conditions Within Limits of Variability
The Core Team determined conditions are within limits of variability on 19 (20%) of the 93 Forest Plan monitoringitems:
4 Fire and Fuels 4-1 Acre control objectives 9 Range 9-2 Permitted and actual AUMs
5 Fish and Wildlife 5-5 Spotted Owl S&Gs for habitat 9-5 Range improvements
Peregrine Falcon 5-14 Nesting and reproductive 10 Recreation 10-1 ROS Classes
Bald Eagle (wintering) 5-15 Population status and trend 13 Soils 13-8 Soil environmental health
Mule Deer 5-19 Population status and trend 14 Special Areas 14-3 Cave conditions
6 Forest Pests 6-1 Problems and damage 15 Timber 15-4 Harvest unit size
8 Lands 8-1 Land adjustments 15-5 Timber suitability
8-2 Landline location priorities 15-9 Timber stand improvements
8-3 Right-of-way acquisition 16 Transportation 16-4 Trail construction
8-4 Land occupancy and use
B. Conditions not Within Limits of Variability
The Core Team determined conditions are not within limits of variability on 20 (22%) of the 93 Forest Planmonitoring items:
2 Cultural Resource 2-1 Cumulative effects; mitigation 14 Special Areas 14-2 Cultural SIA conditions
5 Fish and Wildlife 5-11 Flycatcher S&Gs for habitat 15 Timber 15-7 Burn area reforestation
9 Range 9-4 Administration and compliance 15-8 Yield table projections*
10 Recreation 10-2 Condition of developed sites 18 Water 18-1 Water quality (BMPs)
10-3 Actual use of developed sites 18-2 Watershed S&Gs
10-5 Effects of OHVs 18-4 Watershed condition
11 Riparian Areas 11-1 Riparian maintained/improved 21 Economic 21-1 Cost of practices and activity
13 Soils 13-1 S&Gs for soil productivity 21-2 Values of goods and services
13-4 Effects of OHVs 21-3 Return to counties
13-5 Soil resource improvements 21-4 Local and area employment
The following information provides some details for each item listed above.

14
2 Cultural Resource 2-1 Cumulative effects; mitigation
The limit of variability allows no visible degradation, although no definition exists for acceptable limits to damage orloss of cultural resources. Monitoring of 522 sites shows 58 (11%) with some form of degradation from both naturalcauses and management activities. The criteria of adverse effect in 36 CFR 800.3 and the implementingregulations for the National Historic Preservation Act, requires an evaluation for each site experiencingdegradation. This is an expensive and time-consuming proposition, rarely funded, especially for non-project relateddamage.
5 Fish and Wildlife 5-11 Willow Flycatcher S&Gs for habitat
Effects of grazing in Ackerson Meadow, a known repeated Willow Flycatcher nesting area, do not meet thelimit of variability for this activity.
9 Range 9-4 Range Administration and compliance
At times, 6 allotments were not in total compliance with the terms of their permits.
10 Recreation 10-2 Condition of developed sites
Due to budget limitations and a previously identified $12.5 million rehabilitation backlog, achieving the limit ofvariability for this activity is not feasible.
10 Recreation 10-3 Actual use of developed sites
Due to budget limitations and a previously identified $12.5 million need for new construction, achieving thelimit of variability for this activity is not feasible.
10 Recreation 10-5 Effects of OHVs
The limit of variability for this activity allows no unacceptable (not specifically defined) soil or resource damage.Approximately 20 miles of OHV trails needing major reconstruction are considered in “unacceptable” condition.These trails will be reconstructed or closed and relocated due to poor location or high erosion hazard.
11 Riparian 11-1 Riparian maintained/improved
Monitoring conducted using the Water Quality Best Management Practices Evaluation Program (BMPEP), aPacific Southwest Region protocol, indicates most projects are within the limit of variability. However, somegrazing, mining and vegetative manipulation projects are not within the limit of variability.
13 Soils 13-1 S&Gs for Soil productivity
This item includes four soil quality standards: Soil Cover, Soil Porosity, Soil Organic Matter, and SurfaceOrganic Matter. Contour tilling for some site preparation projects are not within the limit of variability for soilcover or soil organic matter. Due to wet soil conditions (winter logging), a Cut to Length project is not within thelimit of variability for soil porosity. Some areas do not meet the surface organic matter limits of variability,possibly due to older plantations, such as Wrights Creek or Granite Burn, that did not require retention of largewoody debris.
13 Soils 13-4 Effects of OHVs
Essentially the same as 10-5, the limit of variability allows no unacceptable (not specifically defined) soil orresource damage. Findings in the Middle Fork Mokelumne and Deer Creek indicate that most trails are infairly good condition. However, some trails are not within the limit of variability.
13 Soils 13-5 Soil improvement practices
In order to meet soil porosity limits of variability, tilling occurs on some compacted skid trails. This practicecauses unacceptable erosion on some soils.
14 Special Areas 14-2 Cultural SIA conditions
Similar to 2-1, the limit of variability allows no visible degradation, although no definition exists for acceptablelimits to damage or loss of cultural resources. Monitoring of cultural resource sites within several SIAs showssome form of degradation from both natural causes and management activities. The criteria of adverse effectin 36 CFR 800.3 and the implementing regulations for the National Historic Preservation Act, requires an
15
evaluation for each site experiencing degradation. This is an expensive and time-consuming proposition, rarelyfunded, especially for non-project related damage.
15 Timber 15-7 Burn area reforestation
Due to budget limitations, with only 23% of the 5 year goal of 70,000 acres complete, achieving the limit ofvariability is not feasible.
15 Timber 15-8 Yield table projections
Actual measured growth, from the Sawmill Project, is higher than the yield table projections. Similar results , ifobtained in other areas, would indicate that projections are too low.
18 Water 18-1 Water quality (BMPs)
Similar to 11-1, BMPEP monitoring indicates most projects are within the limit of variability. However, somegrazing, mining and vegetative manipulation projects are not within the limit of variability. Monitoringconducted with other protocols shows: herbicide application not impairing beneficial water uses; potable waterat administrative and recreation sites meets state water quality objectives; and, Burned Area EmergencyRehabilitation practices are effective.
18 Water 18-2 Watershed S&Gs
Similar to 11-1 and 18-1, BMPEP monitoring indicates most projects are within the limit of variability. However,some grazing, mining and vegetative manipulation projects are not within the limit of variability.
18 Water 18-4 Watershed condition
Although not significantly less than the limit of variability, most watersheds do not meet the current limit ofvariability.
21 Economic 21-1 Cost of practices and activity21-2 Values of goods and services21-3 Return to counties21-4 Local and area employment
Conditions are not within the limit of variability due to rising costs and reduced timber program.
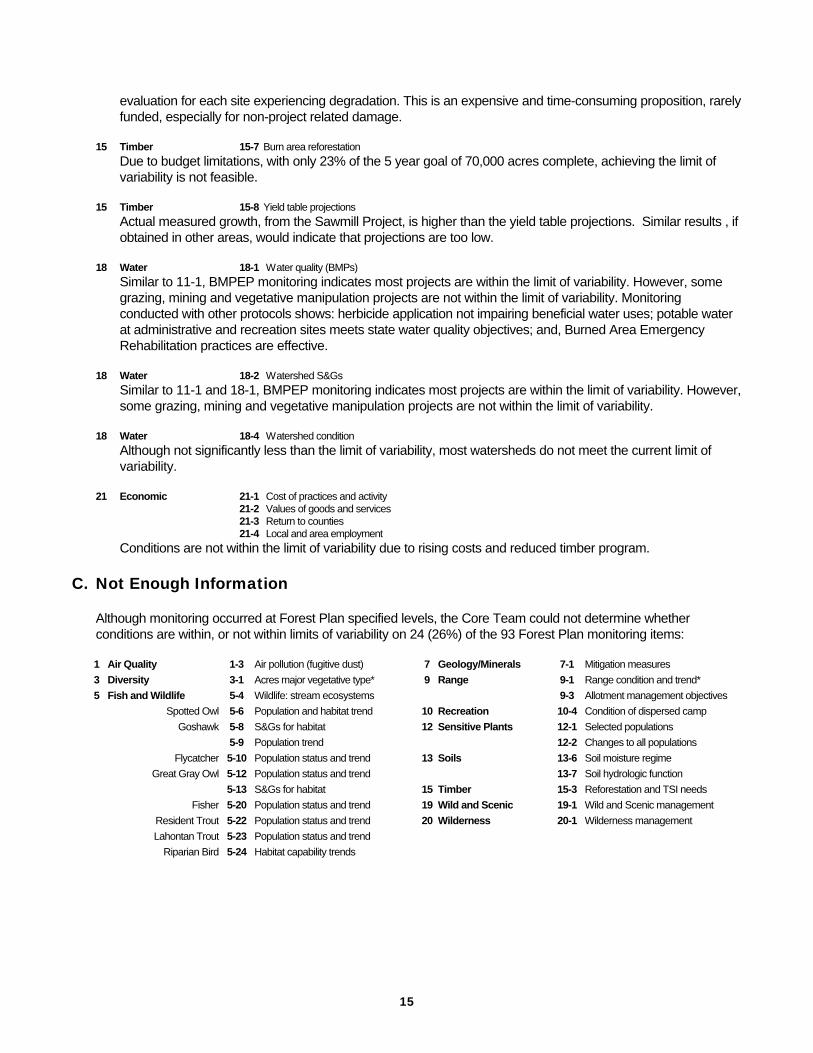
C. Not Enough Information
Although monitoring occurred at Forest Plan specified levels, the Core Team could not determine whetherconditions are within, or not within limits of variability on 24 (26%) of the 93 Forest Plan monitoring items:
1 Air Quality 1-3 Air pollution (fugitive dust) 7 Geology/Minerals 7-1 Mitigation measures
3 Diversity 3-1 Acres major vegetative type* 9 Range 9-1 Range condition and trend*
5 Fish and Wildlife 5-4 Wildlife: stream ecosystems 9-3 Allotment management objectives
Spotted Owl 5-6 Population and habitat trend 10 Recreation 10-4 Condition of dispersed camp
Goshawk 5-8 S&Gs for habitat 12 Sensitive Plants 12-1 Selected populations
5-9 Population trend 12-2 Changes to all populations
Flycatcher 5-10 Population status and trend 13 Soils 13-6 Soil moisture regime
Great Gray Owl 5-12 Population status and trend 13-7 Soil hydrologic function
5-13 S&Gs for habitat 15 Timber 15-3 Reforestation and TSI needs
Fisher 5-20 Population status and trend 19 Wild and Scenic 19-1 Wild and Scenic management
Resident Trout 5-22 Population status and trend 20 Wilderness 20-1 Wilderness management
Lahontan Trout 5-23 Population status and trend
Riparian Bird 5-24 Habitat capability trends
16
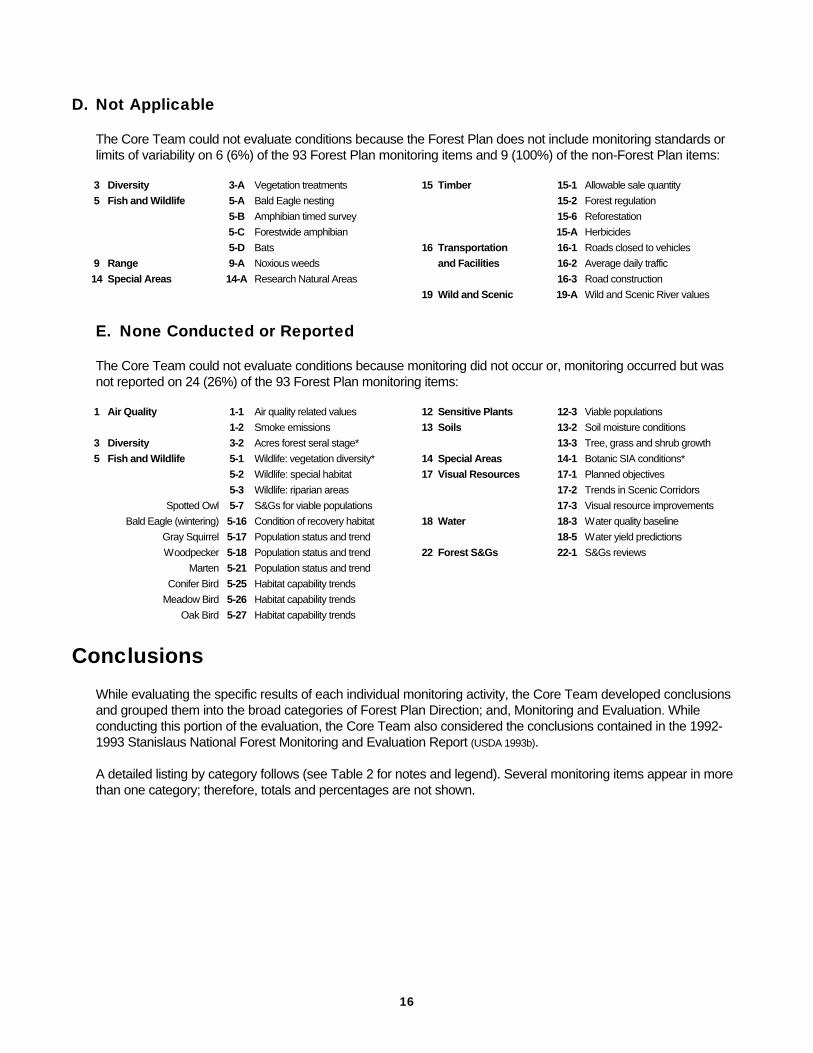
D. Not Applicable
The Core Team could not evaluate conditions because the Forest Plan does not include monitoring standards orlimits of variability on 6 (6%) of the 93 Forest Plan monitoring items and 9 (100%) of the non-Forest Plan items:
3 Diversity 3-A Vegetation treatments 15 Timber 15-1 Allowable sale quantity
5 Fish and Wildlife 5-A Bald Eagle nesting 15-2 Forest regulation
5-B Amphibian timed survey 15-6 Reforestation
5-C Forestwide amphibian 15-A Herbicides
5-D Bats 16 Transportation 16-1 Roads closed to vehicles
9 Range 9-A Noxious weeds and Facilities 16-2 Average daily traffic
14 Special Areas 14-A Research Natural Areas 16-3 Road construction
19 Wild and Scenic 19-A Wild and Scenic River values
E. None Conducted or Reported
The Core Team could not evaluate conditions because monitoring did not occur or, monitoring occurred but wasnot reported on 24 (26%) of the 93 Forest Plan monitoring items:
1 Air Quality 1-1 Air quality related values 12 Sensitive Plants 12-3 Viable populations
1-2 Smoke emissions 13 Soils 13-2 Soil moisture conditions
3 Diversity 3-2 Acres forest seral stage* 13-3 Tree, grass and shrub growth
5 Fish and Wildlife 5-1 Wildlife: vegetation diversity* 14 Special Areas 14-1 Botanic SIA conditions*
5-2 Wildlife: special habitat 17 Visual Resources 17-1 Planned objectives
5-3 Wildlife: riparian areas 17-2 Trends in Scenic Corridors
Spotted Owl 5-7 S&Gs for viable populations 17-3 Visual resource improvements
Bald Eagle (wintering) 5-16 Condition of recovery habitat 18 Water 18-3 Water quality baseline
Gray Squirrel 5-17 Population status and trend 18-5 Water yield predictions
Woodpecker 5-18 Population status and trend 22 Forest S&Gs 22-1 S&Gs reviews
Marten 5-21 Population status and trend
Conifer Bird 5-25 Habitat capability trends
Meadow Bird 5-26 Habitat capability trends
Oak Bird 5-27 Habitat capability trends
ConclusionsWhile evaluating the specific results of each individual monitoring activity, the Core Team developed conclusionsand grouped them into the broad categories of Forest Plan Direction; and, Monitoring and Evaluation. Whileconducting this portion of the evaluation, the Core Team also considered the conclusions contained in the 1992-1993 Stanislaus National Forest Monitoring and Evaluation Report (USDA 1993b).
A detailed listing by category follows (see Table 2 for notes and legend). Several monitoring items appear in morethan one category; therefore, totals and percentages are not shown.

17
Forest Plan Direction
1. Applicable Forest Plan management direction and monitoring requirements are up-to-date and conditions arewithin limits of variability for 7 Forest Plan monitoring items:
1 Air Quality 1-3 Air pollution (fugitive dust) 6 Forest Pests 6-1 Problems and damage
2 Cultural Resource 2-1 Natural events 13 Soils 13-8 Soil environmental health
5 Fish and Wildlife 5-14 Peregrine Falcon nesting 15 Timber 15-9 Timber stand improvements
Bald Eagle (wintering) 5-15 Population status and trend
2. Conditions are not within limits of variability, however it is likely that conditions can meet limits of variability withimproved application of existing management direction, for 7 Forest Plan monitoring items and 1 non-Forest Planitem:
2 Cultural Resource 2-1 Management activities 14 Special Areas 14-A Research Natural Areas
5 Fish and Wildlife 5-11 Flycatcher S&Gs for habitat 18 Water 18-1 Water quality (BMPs)
11 Riparian Areas 11-1 Riparian maintained/improved 18-2 Watershed S&Gs
13 Soils 13-1 S&Gs for soil productivity
13-5 Soil resource improvements
3. Monitoring results did not show any items where applicable Forest Plan management direction is out-of-date.
4. Applicable Forest Plan S&Gs are out-of-date or do not provide specific management direction for 8 Forest Planmonitoring items and 1 non-Forest Plan item. Forest Plan Amendments for OHVs and Wilderness are already inprogress. Detailed changes to Diversity and Wildlife S&Gs should occur only after completion of the CaliforniaSpotted Owl direction:
3 Diversity 3-1 Acres major vegetative type* 10 Recreation 10-5 Effects of OHVs
3-2 Acres forest seral stage* 20 Wilderness 20-1 Wilderness management
3-A Vegetation treatments
5 Fish and Wildlife 5-5 Spotted Owl S&Gs for habitat
Goshawk 5-8 S&Gs for habitat
Great Gray Owl 5-13 S&Gs for habitat
Mule Deer 5-19 Population status and trend
5. Applicable Forest Plan management area allocations are out-of-date for 1 Forest Plan monitoring item. Insectmortality, is causing major changes within established Bald Eagle territories. Possible resolution may includeboundary adjustments or relocations; however, detailed changes should occur only after completion of theCalifornia Spotted Owl direction:
5 Fish and Wildlife 5-16 Bald Eagle recovery habitat
6. Applicable Forest Plan projected outputs are out-of-date and do not accurately reflect recent or expected futureaccomplishments for 6 Forest Plan monitoring items; however, detailed changes should occur only aftercompletion of the 5 year Forest Plan review:
15 Timber 15-1 Allowable sale quantity 21 Economic 21-1 Cost of practices and activity
15-7 Burn area reforestation 21-2 Values of goods and services
21-3 Return to counties
21-4 Local and area employment
7. Some conditions are not within limits of variability and several Forest Plan Amendments are needed. However,overall monitoring results indicate conditions are moving towards desired conditions as stated in the Forest Goals

18
(see Appendix). In addition, the Core Team did not identify any items where applicable Forest Plan managementdirection, S&Gs, management area allocations and monitoring requirements are all out-of-date or, of sufficientmagnitude to warrant Forest Plan revision.
8. Some Forest Plan monitoring requirements are “accomplishments”, duplicates of other monitoring items, coveredby project plans or, not feasible on a Forest scale. Minor changes to these Forest Plan required monitoring itemscan occur almost immediately.
a. Monitoring requirements reflect “accomplishments” for 20 Forest Plan monitoring items. These“accomplishments are best addressed within existing “accomplishment” reports rather than in aninterdisciplinary monitoring report:
4 Fire and Fuels 4-1 Acre control objectives 16 Transportation 16-3 Road construction
8 Lands 8-1 Land adjustments 16-4 Trail construction
8-2 Landline location priorities 17 Visual Resources 17-3 Visual resource improvements
8-3 Right-of-way acquisition 21 Economic 21-1 Cost of practices and activity
9 Range 9-2 Permitted and actual AUMs 21-2 Values of goods and services
10 Recreation 10-3 Actual use of developed sites 21-3 Return to counties
15 Timber 15-1 Allowable sale quantity 21-4 Local and area employment
15-2 Forest regulation
15-3 Reforestation and TSI needs
15-4 Harvest unit size
15-5 Timber suitability
15-6 Reforestation
15-7 Burn area reforestation
b. Monitoring requirements are duplicates of other monitoring items, covered by project plans or, not feasible on aForest scale for 16 Forest Plan monitoring items:
5 Fish and Wildlife 5-1 Wildlife: vegetation diversity* 13 Soils 13-2 Soil moisture conditions
Spotted Owl 5-7 S&Gs for viable populations 13-3 Tree, grass and shrub growth
7 Geology/Minerals 7-1 Mitigation measures 13-4 Effects of OHVs
8 Lands 8-4 Land occupancy and use 15 Timber 15-8 Yield table projections*
9 Range 9-3 Allotment management objectives 16 Transportation 16-1 Roads closed to public vehicles
9-5 Range improvements and Facilities 16-2 Average daily traffic
10 Recreation 10-1 ROS Classes 17 Visual Resources 17-1 Planned objectives
12 Sensitive Plants 12-3 Viable populations 18 Water 18-5 Water yield predictions

19
9. Forest Plan monitoring items do not consistently identify specific indicators of resource conditions that aremeasurable or subject to change. Standards and limits of variability are not consistently defined or even identifiedfor several items. Some standards are not measurable, or not achievable; however, detailed changes and fullintegration of new monitoring requirements should occur only after completion of the 5 year Forest Plan review.Monitoring requirements are out-of-date, no longer feasible as written or, do not include specific indicators ofresource conditions or measurable standards for 41 Forest Plan and all 9 non-Forest Plan monitoring items:
1 Air Quality 1-1 Air quality related values 9 Range 9-4 Administration and compliance
1-2 Smoke emissions 9-A Noxious weeds
3 Diversity 3-1 Acres major vegetative type* 10 Recreation 10-2 Condition of developed sites
3-2 Acres forest seral stage* 10-5 Effects of OHVs
3-A Vegetation treatments 11 Riparian Areas 11-1 Riparian maintained/improved
5 Fish and Wildlife 5-2 Wildlife: special habitat 12 Sensitive Plants 12-1 Selected populations
5-3 Wildlife: riparian areas 12-2 Changes to all populations
Spotted Owl 5-6 Population and habitat trend 13 Soils 13-1 S&Gs for soil productivity
Goshawk 5-9 Population trend 13-6 Soil moisture regime
Flycatcher 5-10 Population status and trend 13-7 Soil hydrologic function
5-11 S&Gs for habitat 14 Special Areas 14-1 Botanic SIA conditions*
Great Gray Owl 5-12 Population status and trend 14-2 Cultural SIA conditions
5-13 S&Gs for habitat 14-3 Cave conditions
Gray Squirrel 5-17 Population status and trend 14-A Research Natural Areas
Woodpecker 5-18 Population status and trend 15 Timber 15-A Herbicides
Fisher 5-20 Population status and trend 17 Visual Resources 17-2 Trends in Scenic Corridors
Marten 5-21 Population status and trend 18 Water 18-1 Water quality (BMPs)
Resident Trout 5-22 Population status and trend 18-2 Watershed S&Gs
Lahontan Trout 5-23 Population status and trend 18-3 Water quality baseline
Riparian Bird 5-24 Habitat capability trends 18-4 Watershed condition
Conifer Bird 5-25 Habitat capability trends 19 Wild and Scenic 19-A Wild and Scenic River values
Meadow Bird 5-26 Habitat capability trends 20 Wilderness 20-1 Wilderness management
Oak Bird 5-27 Habitat capability trends 22 Forest S&Gs 22-1 S&Gs reviews
5-A Bald Eagle nesting
5-B Amphibian timed survey
5-C Forestwide amphibian
5-D Bats
10. Not enough information exists and the information is needed to help answer questions for 10 Forest Planmonitoring items:
5 Fish and Wildlife 5-4 Wildlife: stream ecosystems 12 Sensitive Plants 12-1 Selected populations
Great Gray Owl 5-13 S&Gs for habitat 14 Special Areas 14-1 Botanic SIA conditions*
Bald Eagle (wintering) 5-16 Condition of recovery habitat 14-2 Cultural SIA conditions
9 Range 9-1 Range condition and trend* 19 Wild and Scenic 19-1 Wild and Scenic management
10 Recreation 10-4 Condition of dispersed camp 22 Forest S&Gs 22-1 S&Gs reviews

20
Monitoring and Evaluation
11. Completion of the Monitoring Report by November 30 each year is not feasible. Much of the needed information iscompiled independently at the end of each calendar year to meet other agency reporting requirements. In othercases, additional time is needed after the end of the field season to compile results.
12. Monitoring occurs but is not consistently reported in a timely manner.
13. Managers consider monitoring information while developing and approving site specific projects.
14. Considering recent funding and staffing levels, it is impossible to achieve the full monitoring program as outlined inthe Forest Plan. Forest Plan monitoring program requirements are not fully implemented for several reasons: theprogram is overly ambitious and based on a much larger overall Forest program than exists; lack of funding andstaffing; and, other priorities and emergencies.
15. The Forest Plan monitoring program is based on a much larger timber program than currently exists. Even duringthe period covered by this report, the timber program funded most monitoring activities. This is unlikely to continuewith reduced timber targets and budgets.
16. The Monitoring Program is not well integrated into the Forest’s annual Program of Work. A greater commitment ofresources is needed as well as accountability by key staff.
17. Although the Core Team could not determine conditions on 48 Forest Plan monitoring items (see results c and e), itis unlikely that trends could be established for most, over the short 5 years since Forest Plan approval, even withmore information and unlimited monitoring budgets.
RecommendationsThe Core Team reviewed their conclusions, and the recommendations contained in the 1992-1993 StanislausNational Forest Monitoring and Evaluation Report (USDA 1993b), to develop the following recommendations. Theseitems are recommended to the Forest Supervisor for any further action. Table 3 (see Proposed Action Plan) liststhe specific actions needed to implement these recommendations.
Forest Plan Direction
Short-termn No action needed (continue current monitoring) for 7 Forest Plan monitoring items (see Conclusion 1).
n Improve application of management prescriptions for 7 Forest Plan monitoring items and 1 non-Forest Planitem (see Conclusion 2).
n Complete Forest Plan Amendments for the Emigrant Wilderness and Motor Vehicle Travel Management (seeConclusion 4).
n Focus monitoring program on resource conditions rather than accomplishments. Complete a minor Forest PlanAmendment separating the 57 Forest Plan resource monitoring items from the 36 accomplishment andduplicate items (see conclusions 8a and 8b).
n Initiate the 5 year Forest Plan Review (see conclusions 6 and 9).
n Increase Monitoring/Reporting/Documentation for 10 Forest Plan monitoring items (see Conclusion 10).

21
Long termn Amend Forest Plan Diversity and Wildlife S&Gs (see Conclusion 4) and, amend Forest Plan Management
Area Allocations for Bald Eagle Recovery Habitat (see Conclusion 5), pending Regional direction for theCalifornia Spotted Owl.
n Amend Forest Plan Chapter V (see Conclusion 9) and the Schedule of Outputs (see Conclusion 6) pendingresults obtained from the 5 year Forest Plan review.
Monitoring and Evaluation
Short-termn Complete annual Monitoring and Evaluation (M&E ) Report by March 31.
n Prepare a Forest Service Manual Supplement to establish tracking and reporting protocols and establishformal role of Forest and District Monitoring Coordinators.
n Develop annual monitoring programs, based on information contained in the previous M&E Report,incorporating into Programs of Work by assigning priorities and funding.
n Schedule and conduct reviews of Forest Plan Standards and Guidelines implementation.
n Add Monitoring Performance Element to manager’s performance evaluation. Consider monitoring part of thenormal job and address monitoring in project planning. Consider Monitoring not complete without adequatedocumentation and reporting.
Long-termn Coordinate with other federal and state agencies on large scale monitoring.
n Expect a smaller overall program. Adjust monitoring and seek other funding sources to reflect reduced timbertargets and budgets. Prioritize monitoring activities and concentrate annual efforts to obtain results on awatershed scale.
n Consider California Owl implications while developing future monitoring strategies.
Proposed Action PlanBased on the evaluation and conclusions, the Core Team developed a proposed schedule to implement theirrecommendations (see Table 3). The Proposed Action Plan identifies the additional monitoring needed (or nolonger needed) and the Forest Plan amendments proposed. . Full implementation depends on adequate funding,Forest Leadership approval, completion of the 5 year Forest Plan Review and, completion of Regional direction forthe California Owl. The National Environmental Policy Act (NEPA) process and regulations apply to all proposedForest Plan Amendments.

22
Table 3: Proposed Action Plan; Core Team Recommendations; Key refers to Conclusions;Stanislaus National Forest (see Table 1 or Table 2 for legend).
Key Action Who When1 Continue current monitoring District Rangers ongoing
2 Improve application of prescriptions:
2-1 Cultural Resource (management activities) District Rangers
5-11 Willow Flycatcher (Ackerson Meadow) Groveland District Ranger
11-1 Riparian maintained/improved District Rangers
13-1 S&Gs for soil productivity District Rangers on-going
13-5 Soil resource improvements District Rangers
14-A Research Natural Area (Bell Meadow) Summit District Ranger
18-1 Water quality BMPs District Rangers
18-2 Watershed S&Gs District Rangers
4 Amend Forest Plan Standards and Guidelines:
3-1 Acres major vegetative type* Resource Management Staff pending California Owl
3-2 Acres forest seral stage* Resource Management Staff pending California Owl
3-A Vegetation treatments Resource Management Staff pending California Owl
5-5 Spotted Owl Resource Management Staff pending California Owl
5-8 Goshawk Resource Management Staff pending California Owl
5-13 Great Gray Owl Resource Management Staff pending California Owl
5-19 Mule Deer Resource Management Staff pending California Owl
10-5 Motor Vehicle Travel Management Public Service Staff 9/30/97
20-1 Emigrant Wilderness Direction Summit District Ranger 12/31/97
5 Amend Forest Plan Management Area Allocation:
5-16 Bald Eagle designated recovery habitat Resource Management Staff pending California Owl
6 Amend Forest Plan Schedule of Outputs Core Team and Forest LeadershipTeam
pending 5 year review
6, 9 Initiate 5 year Forest Plan Review Core Team and Forest LeadershipTeam
7/1/97
8 Amend (minor) Forest Plan Monitoring Land Management Planning Prior to 1997 Report
8 Accomplishment Report Public Affairs 12/1 annual
9 Amend Forest Plan Monitoring Core Team and Forest LeadershipTeam
pending 5 year review
10 Increase monitoring and/or documentation:
5-4 Stream ecosystems District Rangers
5-13 Great Gray Owl S&Gs for habitat District Rangers
5-16 Bald Eagle designated recovery habitat District Rangers
9-1 Range condition and trend* District Rangers
10-4 Condition of dispersed camping District Rangers on-going
12-1 Sensitive plants selected populations District Rangers
14-1 Botanic SIAs* District Rangers
14-2 Cultural SIAs District Rangers
19-1 Wild and Scenic management (Tuolumne) Groveland District Ranger
22-1 S&Gs reviews Forest Leadership Team
11 Monitoring and Evaluation Report Core Team 3/31 annual
12 Manual supplement for tracking and reporting Land Management Planning 6/30/97
16 Incorporate monitoring into Programs of Work Forest Leadership Team 10/1 annual
16 Forest Plan S&Gs reviews Forest Leadership Team at least 4 per year
16 Monitoring element in performance ratings Forest Leadership Team Fiscal 1998

23
Previous RecommendationsWhile conducting this evaluation, the Core Team also considered the previous monitoring information, conclusionsand recommendations contained in the 1992-1993 Stanislaus National Forest Monitoring and Evaluation Report(USDA 1993b). That report identified the need for additional monitoring information and Forest Plan Amendmentsaddressed during the period covered by this report.
1. Previous evaluation recommended additional study for the items listed below. Additional monitoring completedand results are now known (see Evaluation).
n Peregrine Falcon
n Effects of Management Activities on the Soil Resource (Tilling for bear clover control)
n Water Quality Best Management Practices (BMPs) Monitoring
n Water Quality Cumulative Watershed Effects
n Herbicides in the Soil Environment
n Range Condition and Trend Surveys
n Permitted and Actual AUMs
n Allotment Administration and Permit Compliance
2. Previous evaluation recommended several Forest Plan Amendments that are now available in draft form.
n Emigrant Wilderness Direction (USDA 1996a)
n Mokelumne Wilderness Direction (USDA 1995)
n Motor Vehicle Travel Management (USDA 1996b)
Research NeedsThe Forest Plan (Appendix B) identified the following two research needs.
n Marketing Research for Recreation: determine public wants in terms of recreation activities andexperiences. Status: No activity.
n Bear Clover Research: increase knowledge of the physiological properties of this plant as an aid in control intree plantations. Status: Complete (see Wolfe Tract Herbicide Trials).

24
Research FindingsRecently completed research projects, with findings applicable on the Stanislaus, are shown below.
Vegetation Classification
Sampling and classification work completed on the upper montane forests for the central and southern SierraNevada (Potter 1994). Classifications underway for Giant Sequoia forests, mixed conifer forests, riparian vegetation,and forest succession. Baseline sampling and classifications form part of the basic information needed to managevegetation in forested settings for a variety of resources. They are used to provide detailed information on plantcommunities across the landscape as part of ecosystem management. Baseline sampling and classification workshould be included as a basic component of future Forest Plans. No other method currently provides a fine graineddescription of plant diversity across large areas.
Old Growth Study
Baseline sampling for, and definitions of, old growth completed for 7 major forest types in the central and southernSierra (Potter 1992). Definitions provide details on the range of variability for the large tree component of old growthstands. In conjunction with mapping efforts completed as part of the SNEP process, these definitions can be usedto make decisions regarding the number of large trees to maintain within specific stands. Old growth forests are asignificant resource to be managed as part of National Forest systems. The definitions should be included as acomponent of future Forest Plans.
Bourland Burn Fire Effects
Fire effects in the plant communities studied were consistent with patterns developed by examination of standstructures in other studies (Sugihara 1997). Hypotheses can now be formalized as to the effects of prescribed orwildfires on species composition and structure in upper montane forests. This information can be used indeveloping models of succession in these forests. Further detailed study is needed to formally establish fire effectsin upper montane forests. This study established a baseline from which to conduct such efforts. Future planningefforts should include this information.
Avalanche Study
Significant differences exist in cover and species richness between on site and off site avalanche paths (Russell
1995). No difference noted for seedling recruitment between sites. Avalanches covered between 10 and 46 percentof the slopes adjacent to transects established to examine frequency of avalanche paths on the landscape.Avalanche is an important disturbance element in regulating cover and species abundance in high elevation forestsof the central and southern Sierra Nevada. Knowledge of avalanche occurrence and frequency should be includedin discussions of plant community structures and species diversity of high elevation forests.
Wolfe Tract Herbicide Trials
All of the herbicides studied controlled bear clover to some degree (Potter 1997). A few were better than the others.The most important observation however, was the dynamics of population recovery for three major species groupsin the study area. In the majority of cases sites were dominated by bear clover, white leaf manzanita, and grassspecies at the end of the study. Single treatments of herbicides to control bear clover following site preparation arerelatively ineffective. Multiple treatments will be needed to control the species complexes in pine plantations atthese elevations. Effective control of bear clover requires adequate site preparation in conjunction with properlyapplied herbicides and follow-up treatments for several years early in the life of a plantation.

25
Fire History of Kings River Management Area
Fire return interval on a 2 acre plot in mixed conifer stands was 3.5 to 5.6 years during the time period of 1770 to1870 (Phillips 1997). Fire return interval on a 1 acre ponderosa pine plot was between 2 and 4 years. Fire frequencieswere the same between 1840 and 1870 as they were in pre-European times. Due to extensive logging activity, pre-European fire intervals in ponderosa pine could not be determined. Historic fire intervals were extremely short inboth mixed conifer and ponderosa pine. Re-introducing the same fire return interval would be extremely difficult.Incorporate, where appropriate, this information into ecosystem management and planning.
Sierra Nevada Ecosystem Project
The following items summarize important specific conclusions of the Sierra Nevada Ecosystem Project (SNEP 1996)
that relate to future management of the Stanislaus National Forest.
1. Climate Change: Recent climate is much wetter, warmer, and more stable than climates of the past 2,000years. Successful ecosystem evaluations and planning must factor climate change into analyses.
2. People and Resources: Between 1970 and 1990, population doubled in the Sierra. The 1990 population of650,000 will triple by 2040. Population growth and its accompanying effects are causing significant impacts onresources.
3. Fire and Fuels: Fire is a natural evolutionary force , influencing biodiversity, plant reproduction, vegetationdevelopment, insect outbreak and disease cycles, wildlife habitat relationships, soil functions and nutrientcycling, gene flow, selection, and, ultimately, sustainability. Fire suppression in concert with changing land-usepractices dramatically changed the fire regimes of the Sierra, altering ecological structures and functions inSierra plant communities.
4. Plants, Plant Communities, and Terrestrial Wildlife: About 50% of California’s 7,000 vascular plantspecies, occur in the Sierra. More than 400 plants grow only in the Sierra, and 200 are rare. About 300terrestrial vertebrate species (including mammals, birds, reptiles, and amphibians) use the Sierra as asignificant part of their range.
5. Late Successional and Old-Growth Forests: Late successional old-growth forests of middle elevationsconstitute 7% to 30% of the forest cover, depending on forest type. On average, national forests contain 25%of the amount contained in national parks, which is an approximate benchmark for pre-contact forestconditions.
6. Rangelands and Grazing: Historic unregulated grazing, which ended in the early 1900s, created widespread,profound, and, in some places, irreversible ecological impacts. Current livestock grazing practices continue toexert reduced but significant impacts on the biodiversity and ecological processes even though properlymanaged grazing can be compatible with sustainable ecological functions.
7. Watersheds and Aquatic Organisms: Aquatic and riparian systems are the most altered and impairedhabitats of the Sierra.
8. Air Quality: Some of the cleanest air in the nation, and even in the world, is found in the Northern Sierra andin most remote Sierra areas during the winter. Central Valley sources cause some of the nation’s poorest airquality in the westside Southern Sierra.

26
Current ResearchSeveral research projects, with potential application on the Stanislaus, are in progress.
n Amphibian Trout Relationships
n Fisher Distribution
n Goshawk Bio-region
n Mokelumne River Collaborative Watershed Study
n Spotted Owl Demographics
n Water Supply Forecasting
n Yosemite Toad
Future Research NeedsThe Core Team identified the following future research needs on the Stanislaus.
n Amphibian Life History
n Bat Habitat Relationships
n Cultural Resources and Fire
n Cultural Resources and Recreation
n Historic Site Evaluation Procedures
n Mokelumne River Archeologic District
n Small Mammals and Grazing
n Western Pond Turtle Demographics

27
List of PreparersTom Beck Core Team
Experience Forest Wildlife Biologist Stanislaus National Forest 1984 to PresentDistrict Resource Officer Stanislaus National Forest 1975 to 1984Forest Wildlife Biologist Stanislaus National Forest 1969 to 1975
Education CSU, Humboldt B.S. 1964
Mike Brown Core TeamExperience Forest Silviculturist Stanislaus National Forest 1986 to Present
Forest Logging Engineer Stanislaus National Forest 1983 to 1986District Timber Management Stanislaus National Forest 1980 to 1983Timber Sale Planner Willamette National Forest 1977 to 1980
Education Southern Illinois University B.S. 1969
Gary Cones Core TeamExperience Deputy Fire Management Officer Stanislaus National Forest 1995 to Present
District Fire Management Officer Stanislaus National Forest 1982 to 1995Fuels Specialist Stanislaus National Forest 1978 to 1982
Tom Durston Expanded TeamExperience Transportation Planner Stanislaus National Forest 1988 to Present
Timber Management Region 6 1986 to 1988Civil Engineer G. Pinchot National Forest 1980 to 1986Civil Engineer Technician Toiyabe National Forest 1975 to 1979
Education Oregon State University M.S. 1988UC, Davis B.S. 1980
Bill Ferrell Expanded TeamExperience Lands Assistant Stanislaus National Forest 1988 to Present
Forester Idaho Panhandle Nat. Forest 1979-1988Education Washington State University B.S. 1971
Gail Firebaugh Expanded TeamExperience Heritage Resource Manager Stanislaus National Forest 1992 to Present
Forest Archeologist Salmon National Forest 1989 to 1992Archeologist Ozark National Forest 1988 to 1989
Education University of Colorado M.A., Anthropology 1981University of Colorado B.S., Anthropology 1975
Jim Frazier Core TeamExperience Forest Hydrologist Stanislaus National Forest 1986 to Present
Hydrologist Stanislaus National Forest 1974 to 1986Education CSU, Humboldt M.S. 1973
CSU, Long Beach B.A. 1968

28
Alex Janicki Expanded TeamExperience Forest Soil Scientist Stanislaus National Forest 1992 to Present
Soil Scientist Stanislaus National Forest 1982 to 1992Soil Scientist Plumas National Forest 1980 to 1982
Education Cal Poly, San Luis Obispo M.S., Soil Science 1982University of Florida B.S., Geology 1970
John Maschi Team LeaderExperience Land Management Planner Stanislaus National Forest 1996 to Present
Assistant Recreation Officer Stanislaus National Forest 1991 to 1996Landscape Architect Stanislaus National Forest 1980 to 1990
Education University of Illinois M.L.A. 1978Rutgers University B.S., Landscape Architecture 1976
Katie Phillips Expanded TeamExperience Assistant Zone Ecologist Stanislaus National Forest 1996 to Present
RNA Ecologist Region 5 1993 to 1996Education UC, Berkeley M.S., Range Management 1993
CSU, Humboldt B.S., Range Management 1976
Jim Schmidt Core TeamExperience Land Management Planner Stanislaus National Forest 1995 to Present
Economist Stanislaus National Forest 1981 to 1995Education Oregon State University M.F. 1977
University of Santa Clara B.S. 1972
Tracy Stelman Core TeamExperience Timber Sale Planner Stanislaus National Forest 1996 to Present
Recreation Assistant Jefferson National Forest1993 to 1996Engineering Technician Jefferson National Forest1987 to 1993Forestry Technician National Forests in Florida 1985 to 1993
Education Virginia Polytechnic Institute B.S. 1993
Denise Van Keuren Expanded TeamExperience Forest Range Conservationist Stanislaus National Forest 1988 to Present
Range Conservationist Tonto National Forest 1985 to 1988Range Conservationist Coronado National Forest 1979 to 1985
Education Arizona State University B.S., Range Management 1979

29
Location of Supporting DocumentationSupporting documentation for this monitoring report is part of the Planning Records. Tracking and summaryinformation is on file at:
n Stanislaus National Forest Supervisor's Office19777 Greenley RoadSonora, CA 95370(209) 532-3671
Project specific files are located at the appropriate Ranger District office:
n Calaveras Ranger DistrictHighway 4P.O. Box 500Hathaway Pines, CA 95232(209) 795-1381
n Groveland Ranger District24525 Old Highway 120Groveland, CA 95321(209) 962-7825
n Mi-Wok Ranger DistrictHighway 108P.O. Box 100Mi-Wuk Village, CA(209) 586-3234
n Summit Ranger DistrictHighway 108#1 Pinecrest Lake RoadPinecrest, CA 95364(209) 965-3434
Public ParticipationThis report is available by request. The Forest will inform the public of its availability by:
n News Release
n Notice in the Forest’s Environmental Analysis Quarterly
n Notice on the Forest’s World Wide Web site (http://www.r5.pswfs.gov/stanislaus/stanhome.htm)
Comments received on this report will be considered in preparing future reports. Please submit comments to:
n Stanislaus National ForestAttn.: Monitoring19777 Greenley RoadSonora, CA 95370

A-1
Appendix
ReferencesPotter et al. 1992. Ecological characteristics of old growth Jeffrey pine, lodgepole pine, red fir, and mixed sub-alpine forests in California. Distributed by Regional Forester, June, 19, 1992.
Potter, D.A. 1994. Guide to forested communities of the upper montane in the Central and Southern SierraNevada. USDA Forest Service. R5-ECOL-TP-003.
Potter, D.A. 1997. Herbicide application in low elevation pine plantations. In: Proceedings of the vegetationmanagement conference, Sacramento, CA, January 1997.
Sugihara, N. et al. 1997. Draft Legend of Potential Natural Vegetation for the Central and Southern SierraProvince. Unpublished.
Russell, W. and A. Brazinski. 1995. Draft. The impact of snow avalanche on vegetation structure and compositionin the sub-alpine and red fir forest types of the Sierra Nevada.
Phillips, C.G. 1997. Fire intervals in mixed conifer and ponderosa pine forests of the Central Sierra Nevada. indraft.
SNEP (Sierra Nevada Ecosystem Project). 1996. Sierra Nevada Ecosystem Project Final Report. Sierra NevadaEcosystem Project; Davis, CA.
USDA Forest Service. 1981. Water Quality Management for National Forest System Lands in California: BestManagement Practices. Pacific Southwest Region; San Francisco, CA.
USDA Forest Service. 1991. Stanislaus National Forest Land and Resource Management Plan, EnvironmentalImpact Statement, Forest Plan and Record of Decision. Pacific Southwest Region; San Francisco, CA.
USDA Forest Service. 1992. Investigating Water Quality in the Pacific Southwest Region: Best ManagementPractices Evaluation Program. Pacific Southwest Region; San Francisco, CA.
USDA Forest Service. 1993. California spotted owl, Sierran Province Interim Guidelines EnvironmentalAssessment. Pacific Southwest Region; San Francisco, CA.
USDA Forest Service. 1993b. Unpublished. 1992-1993 Stanislaus National Forest Monitoring and EvaluationReport. Stanislaus National Forest, Sonora, CA.
USDA Forest Service. 1995. Proposed Mokelumne Wilderness Direction Environmental Assessment. EldoradoNational Forest, Placerville, CA.
USDA Forest Service. 1996a. Proposed Emigrant Wilderness Direction Draft Environmental Impact Statement.Stanislaus National Forest, Sonora, CA.
USDA Forest Service. 1996b. Proposed Motor Vehicle Travel Management Forest Plan AmendmentEnvironmental Assessment. Stanislaus National Forest, Sonora, CA.

A-2

A-3
Forest Goals(Forest Plan pages IV-3 to IV-6)
A. Social Environment
1. Community Stability: manage the Forest in an economically efficient and cost-effective manner while responding toeconomic and social needs of the public and local communities.
2. Urban Interface: private property holder and permittee needs will be taken into consideration in all planning andmanagement activities occurring adjacent to private lands. Effort will be made to communicate information aboutproposed Forest Service projects, during the initial stages of project development in order to be responsive to public issuesand concerns. Regular communication will be maintained with local County Planning Departments to insure long-termcoordination and understanding.
B. Economic Environment
1. Economic: manage the Forest in an economically efficient and cost-effective manner while responding to economic andsocial needs of the public and local communities.
C. Resource Environment
1. Air Quality: maintain air quality that complies with all applicable regulations. Carry out forest management activities ina manner consistent and compatible with the attainment of State and Federal air quality objectives.
2. Cultural Resources: inventory, evaluate, enhance and manage cultural resources to prevent loss of, or damage tocultural values; to integrate significant resources into multiple use management; to gain scientific knowledge andmanagement data about them; and to interpret for public benefit and appreciation.
3. Diversity: maintain or increase diversity of plants and animals, with a balance of vegetation types currently representedon the Forest which best provide for meeting the resource goals and objectives of the Forest Plan.
4. Fire and Fuels: provide a cost-effective fire management program to protect Forest resources, life and property, fromthe effects of wildfire. Maintain natural and activity fuels at levels commensurate with minimizing resource losses fromwildfire. In Wilderness, fire is allowed to play as nearly as possible its natural ecological role.
5. Fish and Wildlife: provide habitat for viable populations of all native and desired non-native wildlife, fish and plants.Maintain and improve habitat for Threatened and Endangered species and give special attention to sensitive species to seethat they do not become Federally listed as Threatened or Endangered.
6. Forest Pests: provide an integrated pest management program to prevent or control insect and disease attacks onforest and range resources.
7. Geology and Minerals: encourage mineral exploration and development in compliance with applicable laws,regulations and orders. In areas identified as susceptible to slope instability, analyze risks of management activities so asto avoid initiation or acceleration of slope movement and to protect human safety and Forest resources. Preventdegradation of groundwater quality and develop groundwater sources to meet domestic livestock and wildlife needs.
8. Lands: implement land adjustments that improve ownership patterns, to increase public benefit and the efficiency ofNational Forest management. Acquire rights-of-way needed to manage the resources. Consider special uses of the

A-4
National Forest where public needs cannot be met on private lands and where such uses conform to managementdirection for the area.
9. Range: manage livestock to utilize available forage while avoiding adverse impacts on soil, vegetation, water quality,wildlife, fisheries and riparian zones.
10. Recreation: provide a wide range of recreation opportunities directed at various experience levels to meet current andprojected demand, including campgrounds, hiking trails, picnic areas, OHV trails, etc. Develop recreation managementplans for existing and potential areas of concentrated public use. These plans shall address such aspects as: plannedmixes of summer and winter activities for public and private sector responsibility, development scales, site locations,number of units and PAOTs (people at one time), family and group facilities, existing or potential on-site problems, facilitiesneeded to serve dispersed activities, lake or reservoir surface activity management, as well as implementation and/orexpansion phasing. Develop and implement programs to inform Forest users about recreation opportunities. InterpretForest management activities and the forest environment for visitors. Provide a variety of off-highway vehicle (OHV)recreational opportunities in a manner consistent with protection of wildlife and other resources, and with non-motorizedrecreation.
11. Riparian Areas: manage riparian areas to protect or improve riparian area-dependent resources while allowing formanagement of other compatible uses.
12. Sensitive Plants: Manage sensitive plants to ensure continued population viability and prevent them from becomingFederally listed as Threatened or Endangered.
13. Soils: maintain and, where feasible, improve soil productivity.
14. Special Areas: preserve the integrity of the botanic, cultural, geologic, scenic, and recreation features for which theareas were established.
15. Timber: manage the timber resource to provide a sustained yield of commercial saw-timber, public fuelwood, andmiscellaneous wood products, while considering environmental factors and other resource values. Achieve a regulatedforest on lands managed for timber harvest.
16. Transportation and Facilities: provide facilities, including transportation system and administrative sites, needed toefficiently and safely manage the National Forest.
17. Visual Resources: meet adopted Visual Quality Objectives (VQOs) on all projects. Maintain high visual quality inareas of concentrated public use and in areas seen from major travel routes. Allow management activities in certain areasto dominate the surrounding characteristic landscape, but they shall borrow from natural forms and appear as naturaloccurrences when viewed from background distances. Consider private land concerns during the evaluation of proposedmanagement activities adjacent to privately developed subdivisions and recreation areas. Particular attention will be givento visual quality in the foreground view areas of these private developments as well as any other values relating to theirattendant use and enjoyment of the National Forest.
18. Water: maintain or improve water quality and watershed condition to meet applicable state and federal requirements.Realize feasible increases in the quantity of water yield and delays in the timing of runoff by including water yieldmodification as an objective in the design and manipulation of commercial and non-commercial vegetation.
19. Wild and Scenic Rivers: manage Wild and Scenic Rivers and their immediate environments to preserve their freeflowing condition and to protect their outstandingly remarkable values. Provide opportunities for public recreation and otherresources based on the classification of each river segment.
20. Wilderness: manage Wilderness to preserve its character and values and to allow recreational, scenic, scientific,educational, conservation and historic uses consistent with these objectives.
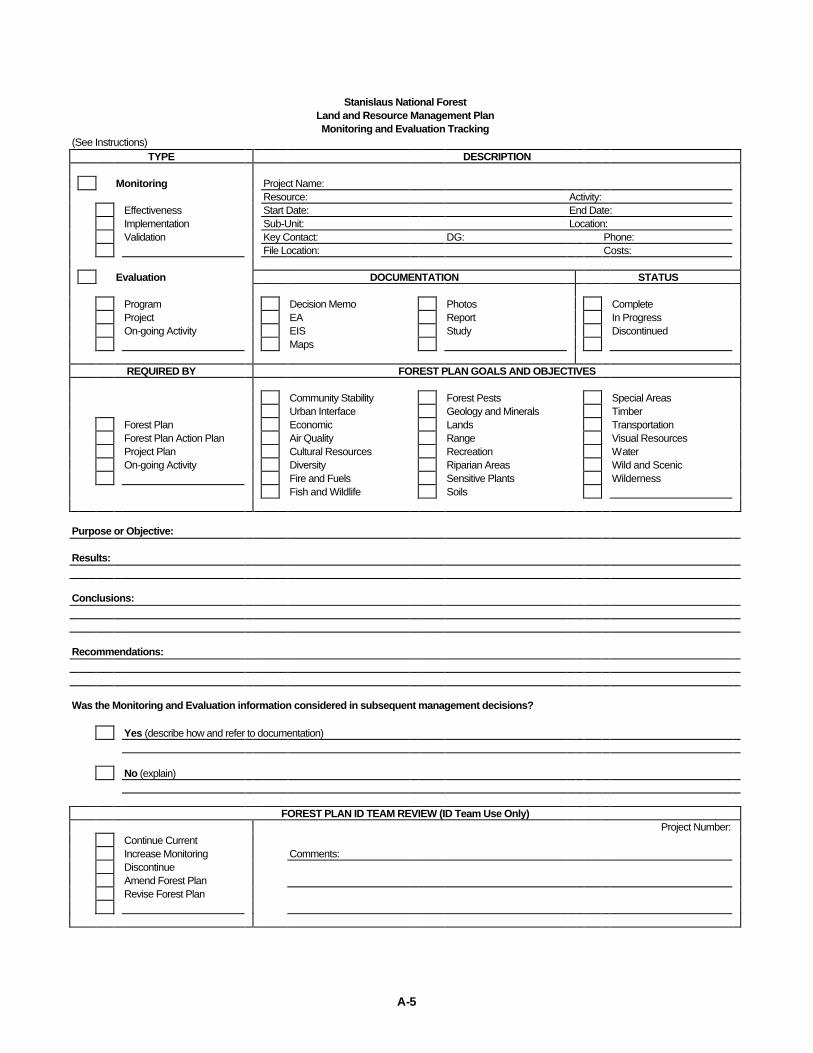
A-5
Stanislaus National ForestLand and Resource Management PlanMonitoring and Evaluation Tracking
(See Instructions)TYPE DESCRIPTION
Monitoring Project Name:Resource: Activity:
Effectiveness Start Date: End Date:Implementation Sub-Unit: Location:Validation Key Contact: DG: Phone:
File Location: Costs:
Evaluation DOCUMENTATION STATUS
Program Decision Memo Photos CompleteProject EA Report In ProgressOn-going Activity EIS Study Discontinued
Maps
REQUIRED BY FOREST PLAN GOALS AND OBJECTIVES
Community Stability Forest Pests Special AreasUrban Interface Geology and Minerals Timber
Forest Plan Economic Lands TransportationForest Plan Action Plan Air Quality Range Visual ResourcesProject Plan Cultural Resources Recreation WaterOn-going Activity Diversity Riparian Areas Wild and Scenic
Fire and Fuels Sensitive Plants WildernessFish and Wildlife Soils
Purpose or Objective:
Results:
Conclusions:
Recommendations:
Was the Monitoring and Evaluation information considered in subsequent management decisions?
Yes (describe how and refer to documentation)
No (explain)
FOREST PLAN ID TEAM REVIEW (ID Team Use Only)Project Number:
Continue CurrentIncrease Monitoring Comments:DiscontinueAmend Forest PlanRevise Forest Plan

A-6
Stanislaus National Forest
Land and Resource Management Plan
Monitoring and Evaluation Tracking
INSTRUCTIONS
Complete a tracking form for each individual monitoring or evaluation activity using the following definitions.
Monitoring: collection of data obtained with designed procedures and objectives. Intended to be repeated to determine status and trends. Also used to
determine whether standards are met. One-time inventories are not included (soil resource inventory, EUI, etc.). Repeating inventories are included,
especially those that establish baseline information which will be compared with future information to determine trends (timber, vegetation, recreation,
etc.).
Evaluation: usually administrative reviews judging implementation or effectiveness of a program, project or on-going activity (range management,
developed recreation, etc.). Evaluations are conducted with pre-determined objectives, usually by a team. Individual or group field observations without
specific objectives are not included (these often set the stage for a later monitoring or evaluation).
Check all boxes that apply. Spaces are provided for entering items not listed. Return completed forms to your sub-unit coordinator, along with any
comments and suggestions for improving the form. The coordinators will submit all forms and comments to the Forest ID Team.
Line-by-Line instructions, for the items that are not self-explanatory, are shown below.
Project Name: the name of the monitoring or evaluation activity (if any), or the name of the applicable program, project or on-going activity.
Resource: the key resource(s) being monitored or evaluated.
Activity: the type of program, project or on-going activity generating the need for the monitoring or evaluation.
Start Date: the date the monitoring or evaluation started.
End Date: the date the monitoring or evaluation ended.
Sub-Unit: the name of the sub-unit responsible for conducting the monitoring or evaluation.
Location: the specific location where the activity is located (Ranger District, site name, etc.) along with a legal description if applicable.
Key Contact: the name of the key person or staff to contact for more information. Include DG address and phone number.
File Location: the location of project files and supporting documentation. Include file designations if applicable.
Costs: the approximate costs incurred to date, directly attributable to the monitoring or evaluation activity.
Forest Plan Goals and Objectives: refer to Forest Plan pages IV-3 to IV-6. Check all that apply to the monitoring or evaluation activity.
NFS Watersheds: check all National Forest System watersheds where the activity occurred.
Purpose or Objective: state the key purpose or objective of the monitoring or evaluation activity (may be in the form of a question).
Results: briefly describe actual vs. expected results, cause and effect, deviation, areas affected or other considerations.
Conclusions: briefly compare actual conditions to standards. Does deviation exceed acceptable limits or established standards?
Recommendations: briefly describe recommendations for further action along with consequences of delay and impacts from implementation of these
recommendations.


![Australian [Adelaide] Longitudinal Study of Aging, Waves 1 ...€¦ · additional clinical studies. Wave 2 (1993-1994), Wave 3 (1994-1995), Wave 4 (1995-1996), and Wave 5 (1996-1997)](https://static.fdocuments.us/doc/165x107/5fdef2451d665b4a4b7e8fae/australian-adelaide-longitudinal-study-of-aging-waves-1-additional-clinical.jpg)