1987
32
CONSUMER AWARENESS AND SATISFACTION SURVEY 2014 October 2014 Infocomm Development Authority of Singapore 10 Pasir Panjang Road #10-01 Mapletree Business City Singapore 117438 Tel: (65) 6211 0888 Fax: (65) 6211 2222 Website: www.ida.gov.sg Copyright © 2014 IDA All rights reserved. No part of this material may be stored in a retrieval system, transmitted, or reproduced in any way, including but not limited to photocopy, photography, magnetic or other record, without the prior agreement and written permission of the Infocomm Development Authority of Singapore. Notwithstanding the above, part or parts of this publication may be used with the proper acknowledgement of its source without having to first obtain the prior agreement and written permission of the Infocomm Development Authority of Singapore.
-
Upload
james-morin -
Category
Documents
-
view
2 -
download
1
description
IDA
Transcript of 1987

CONSUMER AWARENESS AND
SATISFACTION SURVEY 2014
October 2014
Infocomm Development Authority of Singapore
10 Pasir Panjang Road
#10-01 Mapletree Business City
Singapore 117438
Tel: (65) 6211 0888
Fax: (65) 6211 2222
Website: www.ida.gov.sg Copyright © 2014 IDA
All rights reserved. No part of this material may be stored in a retrieval system, transmitted, or
reproduced in any way, including but not limited to photocopy, photography, magnetic or other
record, without the prior agreement and written permission of the Infocomm Development Authority of
Singapore.
Notwithstanding the above, part or parts of this publication may be used with the proper
acknowledgement of its source without having to first obtain the prior agreement and written
permission of the Infocomm Development Authority of Singapore.

IDA CONSUMER AWARENESS AND SATISFACTION SURVEY 2014
2
TABLE OF CONTENTS
INTRODUCTION ............................................................................................................. 4
SURVEY METHODOLOGY ............................................................................................. 4
SURVEY FINDINGS.......................................................................................................... 5
1 FIXED LINE TELEPHONE SERVICES ......................................................................... 5 1.1 Subscription ............................................................................................................................ 5 1.2 Attitude towards Fixed Line as a Necessity ........................................................................ 6 1.3 Satisfaction with Fixed Line Telephone Services ................................................................ 6
2 MOBILE TELEPHONE SERVICES .............................................................................. 7 2.1 Subscription ............................................................................................................................ 7 2.2 Awareness of Terms and Conditions ................................................................................... 8 2.3 Ability to Replace Fixed Line Telephone Services ............................................................. 9 2.4 Satisfaction with Mobile Telephone Services ..................................................................... 9
3 FIXED BROADBAND SERVICES ............................................................................ 11 3.1 Subscription .......................................................................................................................... 11 3.2 Awareness of Terms and Conditions ................................................................................. 12 3.3 Satisfaction with Fixed Broadband .................................................................................... 13
4 MOBILE BROADBAND SERVICES ........................................................................ 15 4.1 Subscription .......................................................................................................................... 15 4.2 Awareness of Terms and Conditions ................................................................................. 17 4.3 Satisfaction with Mobile Broadband ................................................................................. 17 4.4 Ability to Replace Fixed Line Broadband Services .......................................................... 19 4.5 Data Usage Bill Cap ............................................................................................................ 20 4.6 Excess Data Usage Charges .............................................................................................. 21 4.7 Switching to WIFI at Home .................................................................................................. 21
5 INTERNATIONAL ROAMING ................................................................................ 22 5.1 Awareness and Usage ........................................................................................................ 22 5.2 Satisfaction with International Roaming ........................................................................... 23 5.3 Mobile Roaming Charges................................................................................................... 24 5.4 Alternatives to International Roaming .............................................................................. 24 5.5 Data Roaming ...................................................................................................................... 25
6 PAYPHONE SERVICES .......................................................................................... 27 6.1 Usage of Payphone Services ............................................................................................. 27 6.2 Frequency of Usage ............................................................................................................ 28 6.3 Attitude towards Payphone as a Necessity ..................................................................... 29
7 CUSTOMER CARE SERVICES ............................................................................... 31 7.1 Satisfaction with Operators’ Customer Care Services .................................................... 31 7.2 Suggestions for Improvement ............................................................................................ 32

IDA CONSUMER AWARENESS AND SATISFACTION SURVEY 2014
3
LIST OF FIGURES
Figure 1-1 : Fixed Line Telephone Subscription ....................................................................................... 5 Figure 1-2 : Fixed Line Telephone Subscription by Housing Type ........................................................ 5 Figure 1-3 : Agreement on whether Fixed Line was still a Necessity by Housing Type ................... 6 Figure 1-4 : Satisfaction with Fixed Line Telephone Services (Mean Score) ..................................... 6 Figure 2-1 : Mobile Telephone Services Subscription ............................................................................ 7 Figure 2-2 : Mobile Telephone Services Subscription by Age .............................................................. 7 Figure 2-3 : Mobile Telephone Services Subscription by Housing Type ............................................. 8 Figure 2-4 : Awareness of Terms and Conditions for Post-paid and Pre-paid plans ....................... 8 Figure 2-5 : Ability to replace Fixed Line with Mobile Telephone Services ....................................... 9 Figure 2-6 : Satisfaction with Mobile Telephone Services (Mean Score) .......................................... 9 Figure 2-7 : Satisfaction with Mobile Telephone Services (Mean Score by Service Provider) .... 10 Figure 3-1 : Fixed Broadband Services Subscription ............................................................................ 11 Figure 3-2 : Fixed Broadband Services Subscription by Housing Type ............................................. 11 Figure 3-3 : Reasons for Not Subscribing to Fixed Broadband Service ............................................ 12 Figure 3-4 : Awareness of Terms and Conditions for Fixed Broadband Service ............................ 12 Figure 3-5 : Satisfaction with Fixed Broadband Services (Mean Score) .......................................... 13 Figure 3-6 : Satisfaction with Fixed Broadband Services (Mean Score by Service Provider) ...... 13 Figure 3-7 : Satisfaction with Fixed Broadband Speed (Mean Score by Service Provider) ......... 14 Figure 4-1 : Mobile Broadband Services Subscription ........................................................................ 15 Figure 4-2 : Mobile Broadband Services Subscription by Age .......................................................... 15 Figure 4-3 : Mobile Broadband Services Subscription by Housing Type .......................................... 16 Figure 4-4 : Reasons for Not Subscribing to Mobile Broadband Service ......................................... 16 Figure 4-5 : Awareness of Terms and Conditions for Mobile Broadband Service ......................... 17 Figure 4-6 : Satisfaction with Mobile Broadband Services (Mean Score) ....................................... 17 Figure 4-7 : Satisfaction with Mobile Broadband Services (Mean Score by Service Provider) ... 18 Figure 4-8 : Satisfaction with Mobile Broadband Speed (Mean Score) ......................................... 18 Figure 4-9 : Ability to Replace Fixed Broadband with Mobile Broadband Services ..................... 19 Figure 4-10 : Top Reasons for Being Able to replace Fixed Broadband Services.......................... 19 Figure 4-11 : Top Reasons for Not Being Able to replace Fixed Broadband Services .................. 20 Figure 4-12 : Awareness of local data usage bill cap ........................................................................ 20 Figure 4-13 : Awareness of the amount charged for excess mobile broadband data usage .. 21 Figure 4-14 : Do you switch to Fixed Broadband via WIFI on mobile devices when at home? . 21 Figure 5-1 : Awareness and Usage of Conventional Roaming Services ......................................... 22 Figure 5-2 : Awareness of Conventional Roaming Services by Age................................................ 22 Figure 5-3 : Usage of Conventional Roaming Services by Age ........................................................ 23 Figure 5-4 : Satisfaction with International Roaming (Mean Score) ................................................ 23 Figure 5-5 : Awareness of and Likelihood to Check International Mobile Roaming Charges ... 24 Figure 5-6 : Awareness of Alternatives to International Roaming .................................................... 24 Figure 5-7 : Awareness of Ability to Disable International Data Roaming ...................................... 25 Figure 5-8 : Awareness of Data Roaming Plans with Flat Rates for Data Usage ........................... 25 Figure 5-9 : Awareness of Ability to Activate Data Roaming Cap ................................................... 26 Figure 6-1 : Usage of Payphone Services .............................................................................................. 27 Figure 6-2 : Usage of Payphone Services by Age ............................................................................... 27 Figure 6-3 : Usage of Payphone Services by Housing Type ............................................................... 28 Figure 6-4 : Frequency of Payphone Usage ......................................................................................... 28 Figure 6-5 : Opinion on whether Payphone was Still a Necessity ..................................................... 29 Figure 6-6 : Opinion on whether Payphone was Still a Necessity by Housing Type ...................... 29 Figure 6-7 : Reasons for Payphones still being Necessary .................................................................. 30 Figure 6-8 : Reasons for Payphones Not being Necessary ................................................................ 30 Figure 7-1 : Hotline Waiting Time to speak to a Customer Service Officer (Mean Score) ........... 31 Figure 7-2 : Time Taken to Resolve Complaint (Mean Score) ........................................................... 31 Figure 7-3 : Competency of Customer Service Officer (Mean Score) ............................................ 32 Figure 7-4 : Customer Care – Suggestions / Improvements .............................................................. 32

IDA CONSUMER AWARENESS AND SATISFACTION SURVEY 2014
4
INTRODUCTION
The Consumer Awareness and Satisfaction Survey 2014 (CASS 2014) is a study that aims to measure
and track shifts in the perception of selected telecommunication services in Singapore. Local
consumers were asked about their awareness, as well as subscription or usage patterns, of the
telecommunication services. In addition, they were queried on their satisfaction with the services that
they had used, specifically in terms of the quality of service, price competitiveness of the service
offerings, variety of services available given the range of products and services currently offered in the
market, and customer service rendered by the service providers.
CASS 2014 is the fifth survey carried out by IDA since the full liberalisation of the Singapore
telecommunication market in year 2000. The last survey was conducted in 2010. Comparisons with
the previous survey findings are provided where available and appropriate. New services such as
mobile broadband Internet services are also included in this round of survey given their growing
popularity.
The scope of the telecommunication services surveyed includes:
A. Fixed Line Telephone
B. Mobile Telephone
C. Fixed Broadband
D. Mobile Broadband
E. International Roaming
F. Payphone
G. Customer Care Services
Feedback on newer operators such as MyRepublic and ViewQwest was also received during the survey,
but due to the small sample sizes, they are omitted in this report.
SURVEY METHODOLOGY
In total, 1,500 individuals from households all across Singapore were surveyed through door-to-door
interviews between 26th December 2013 and 14th March 2014. The selection of the 1,500 individuals
was conducted using a two-stage stratified design:
a) a sample of 1,500 households was selected from the Household Sampling Frame maintained
by the Department of Statistics, and
b) from each sampled households, an individual was randomly selected for the survey.
To be eligible for the survey, the individual had to be a Singapore Citizen or Singapore PR, aged 18 and
above, and a resident of the household.

IDA CONSUMER AWARENESS AND SATISFACTION SURVEY 2014
5
SURVEY FINDINGS
1 FIXED LINE TELEPHONE SERVICES
1.1 Subscription
Subscription to fixed line telephone services has declined over the last 9 years, with a significant drop
in 2014. Nevertheless, subscription amongst the respondents remained high at 87.5% (Figure 1-1).
Figure 1-1 : Fixed Line Telephone Subscription
92.2% 90.7% 90.0%87.5%
0%
20%
40%
60%
80%
100%
CASS 2005 CASS 2007 CASS 2010 CASS 2014
% o
f R
esp
on
den
ts
Figure 1-2 shows a breakdown of fixed line telephone subscription by housing type over the past 7
years. Subscription remained fairly consistent across most housing types since 2010 except among
respondents staying in HDB 1-2 room flats, which saw a significant drop in fixed line telephone
subscription (Figure 1-2).
Figure 1-2 : Fixed Line Telephone Subscription by Housing Type
53%
85%93% 95% 91% 91%
52%
85%92% 91% 92% 97%
78%
98% 100%
35%
81%89%
93% 90%95%
HDB 1-2-Rm Flat HDB 3-Rm Flat HDB 4-Rm Flat HDB 5-Rm or
Executive Flat
Condominiums or
Private Flat
Landed Property Others
CASS 07 CASS 10 CASS 14%
(N=8) (N=13)
% o
f R
esp
on
den
ts

IDA CONSUMER AWARENESS AND SATISFACTION SURVEY 2014
6
1.2 Attitude towards Fixed Line as a Necessity
Majority of respondents felt that fixed line telephone was still a necessity in their lives, although there
was a slight reduction in this sentiment in 2014. As compared to 2010, respondents staying in HDB 1-
2-room flats or condominiums were significantly less likely to agree that fixed line telephone was still a
necessity in their lives, as shown in Figure 1-3.
Figure 1-3 : Agreement on whether Fixed Line was still a Necessity by Housing Type
13.3%25.8%
13.4% 12.8% 16.6% 12.7% 17.6%22.7%
12.1% 15.4%7.0%
8.0%
24.3%
9.8% 14.5% 11.9% 15.0% 8.8%13.1% 12.3%
16.8%
9.9%14.9%
20.5%
78.7%
49.9%
76.8% 72.8% 71.4% 72.3% 73.6%67.7% 70.1%
60.5%
78.0%69.7% 72.0% 72.5%
28.0%19.2%17.6%
Disagree Neutral Agree%
HDB 1-2 Rm
HDB 3 Rm HDB 4 Rm HDB 5 Rm Condominiums or Private Flat
Landed Property Other
1410CASS: (N=6) (N=13)
(N=25)
% o
f Fi
xed
Lin
e Su
bsc
rib
ers
1.3 Satisfaction with Fixed Line Telephone Services
Fixed line telephone subscribers were generally satisfied with the service. They were mostly satisfied
with the service quality, which achieved a mean satisfaction of 4.12. Also, satisfaction with price
competitiveness was similarly high, scoring 3.82 (Figure 1-4).
Figure 1-4 : Satisfaction with Fixed Line Telephone Services (Mean Score)
4.123.82
1.00
2.00
3.00
4.00
5.00
Quality of Service Price Competitiveness
CASS 14
Mea
nSa
tisf
acti
on
Sco
re
VerySatisfied
VeryDissatisfied
IDA CONSUMER AWARENESS AND SATISFACTION SURVEY 2014
7
2 MOBILE TELEPHONE SERVICES
2.1 Subscription
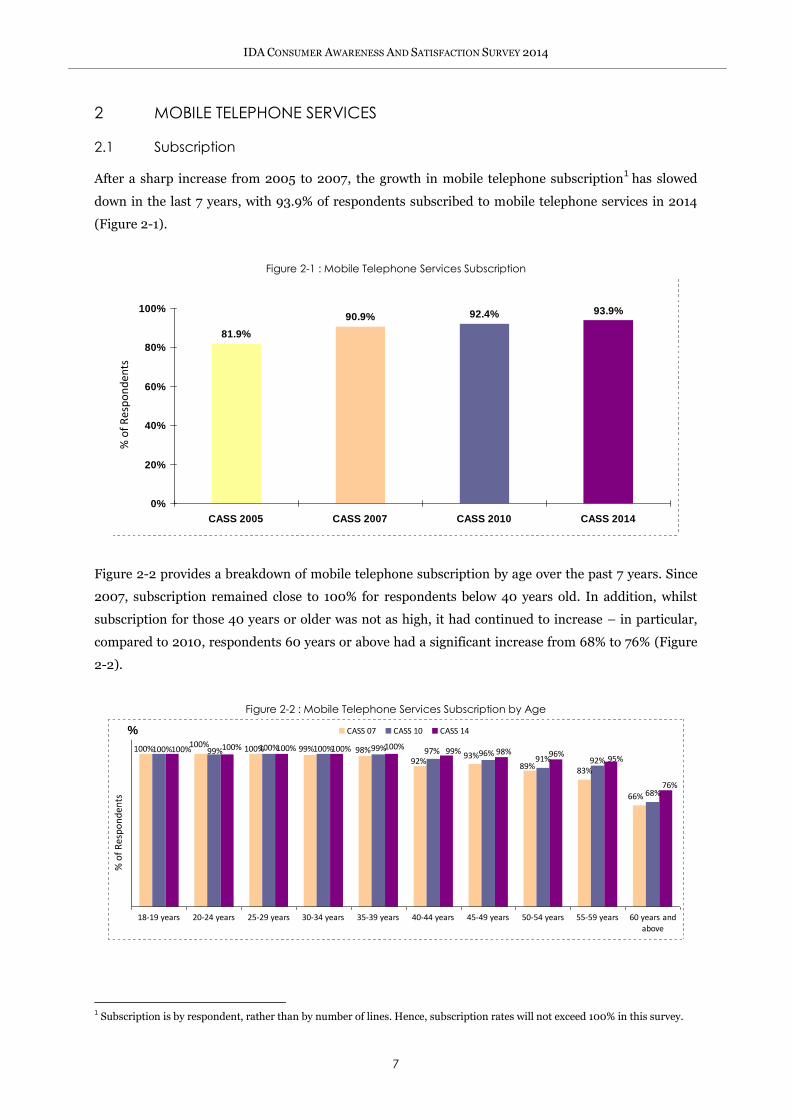
After a sharp increase from 2005 to 2007, the growth in mobile telephone subscription1 has slowed
down in the last 7 years, with 93.9% of respondents subscribed to mobile telephone services in 2014
(Figure 2-1).
Figure 2-1 : Mobile Telephone Services Subscription
81.9%
90.9% 92.4% 93.9%
0%
20%
40%
60%
80%
100%
CASS 2005 CASS 2007 CASS 2010 CASS 2014
% o
f R
esp
on
den
ts
Figure 2-2 provides a breakdown of mobile telephone subscription by age over the past 7 years. Since
2007, subscription remained close to 100% for respondents below 40 years old. In addition, whilst
subscription for those 40 years or older was not as high, it had continued to increase – in particular,
compared to 2010, respondents 60 years or above had a significant increase from 68% to 76% (Figure
2-2).
Figure 2-2 : Mobile Telephone Services Subscription by Age
83%
91%
68%
93%98%99%100%
66%
89%92%
100% 100% 99%100%99% 96%97%92%
100%100%95%
99%
76%
96%98%100%100%100%100% 100%
18-19 years 20-24 years 25-29 years 30-34 years 35-39 years 40-44 years 45-49 years 50-54 years 55-59 years 60 years and
above
CASS 07 CASS 10 CASS 14%
% o
f R
esp
on
den
ts
1 Subscription is by respondent, rather than by number of lines. Hence, subscription rates will not exceed 100% in this survey.

IDA CONSUMER AWARENESS AND SATISFACTION SURVEY 2014
8
Figure 2-3 shows the breakdown of subscription of mobile telephone by housing type. Compared to
2010, there was a significant increase in mobile telephone subscription among respondents who stayed
in HDB 1-2 room flats and a significant decrease among those who stayed in landed property (Figure
2-3).
Figure 2-3 : Mobile Telephone Services Subscription by Housing Type
75%
87% 90%94% 97%
85%
71%
85%93% 94% 96%
91%80%
99% 100%91% 88%
95% 95% 97%91%
HDB 1-2-Rm Flat HDB 3-Rm Flat HDB 4-Rm Flat HDB 5-Rm or
Executive Flat
Condominiums or
Private Flat
Landed Property Others
CASS 07 CASS 10 CASS 14%
(N=8) (N=13)
% o
f R
esp
on
den
ts
2.2 Awareness of Terms and Conditions
In general, mobile telephone subscribers displayed a high level of awareness regarding the terms of the
service. Regardless of whether they were using post-paid or pre-paid plans, subscribers’ awareness for
each aspect exceeded 75% (Figure 2-4).
Figure 2-4 : Awareness of Terms and Conditions for Post-paid and Pre-paid plans
94.6%
5.4%
Expiry Date Early Termination
Charge
CASS 14: Yes CASS 14: No
78.2%
93.9%
21.8%
6.1%
Contract Expiry Date Early Termination
Charge
CASS 14: Yes CASS 14: No
% %
Post-paid Plan Pre-paid Plan
% o
f M
ob
ile T
elep
ho
ne
Sub
scri
ber
s

IDA CONSUMER AWARENESS AND SATISFACTION SURVEY 2014
9
2.3 Ability to Replace Fixed Line Telephone Services
There was a substantial increase in respondents who felt that they could completely replace their fixed
line telephone with mobile telephone, and, correspondingly, respondents who felt they could not
replace their fixed line telephones declined significantly compared to 2010 (Figure 2-5).
Figure 2-5 : Ability to replace Fixed Line with Mobile Telephone Services
25.3%
18.8%16.6%
39.3%
31.5%
19.2%15.1%
34.2%
Yes, completely Yes, to a great
extent
Yes, slightly No, not at all
CASS 10 CASS 14
%
% o
f M
ob
ile T
elep
ho
ne
Sub
scri
ber
s
CASS 14:
% of “Yes” = 65.8%
2.4 Satisfaction with Mobile Telephone Services
Respondents were mostly still satisfied with quality of service despite the significant decrease in mean
score of satisfaction from 2010. On the other hand, satisfaction with price competitiveness and variety
of services remained fairly consistent compared to 2010 (Figure 2-6).
Figure 2-6 : Satisfaction with Mobile Telephone Services (Mean Score)
3.85
3.523.76
4.02
3.493.77
3.91
3.563.76
1.00
2.00
3.00
4.00
5.00
Quality of Service Price Competitiveness Variety of Services Available
CASS 07 CASS 10 CASS 14
Mea
nSa
tisf
acti
on
Sco
re
VerySatisfied
VeryDissatisfied

IDA CONSUMER AWARENESS AND SATISFACTION SURVEY 2014
10
Satisfaction with quality of service for M1 dropped significantly from 2010, while satisfaction with
price competitiveness of SingTel increased significantly compared to 2010 (Figure 2-7).
Figure 2-7 : Satisfaction with Mobile Telephone Services (Mean Score by Service Provider)
3.73 3.75 3.873.74 3.83 3.75
1.00
2.00
3.00
4.00
5.00
SingTel
Mobile
StarHub
Mobile
M1
3.373.53
3.693.48 3.60 3.67
1.00
2.00
3.00
4.00
5.00
SingTel
Mobile
StarHub
Mobile
M1
CASS 10 CASS 14CASS 10 CASS 14
4.01 3.95 4.093.98 3.85 3.82
1.00
2.00
3.00
4.00
5.00
SingTel
Mobile
StarHub
Mobile
M1
Quality of Service Price Competitiveness Variety of Services Available
Mea
n S
atis
fact
ion
Sco
re

IDA CONSUMER AWARENESS AND SATISFACTION SURVEY 2014
11
3 FIXED BROADBAND SERVICES
3.1 Subscription
Subscription to fixed broadband service2 continued to increase significantly over the past 9 years, with
almost 85% of respondents subscribed to fixed broadband in 2014 (Figure 3-1).
Figure 3-1 : Fixed Broadband Services Subscription
55.6%
75.3%81.1%
84.4%
0%
20%
40%
60%
80%
100%
CASS 2005 CASS 2007 CASS 2010 CASS 2014
% o
f R
esp
on
den
ts
Figure 3-2 provides a breakdown of fixed broadband subscription by housing type. Subscription was
observed to be highest among respondents staying in condominiums, which had increased
substantially from 2010. On the other hand, subscription was lowest among those living in HDB 1-2
room flats (Figure 3-2).
Figure 3-2 : Fixed Broadband Services Subscription by Housing Type
27%
64%
72%
85% 83%80%
25%
65%
83%87% 87% 89%
75%
92%
71%
30%
70%
84%91% 94% 91%
HDB 1-2-Rm Flat HDB 3-Rm Flat HDB 4-Rm Flat HDB 5-Rm or
Executive Flat
Condominiums or
Private Flat
Landed Property Others
CASS 07 CASS 10 CASS 14%
(N=8) (N=13)
% o
f R
esp
on
den
ts
2 Subscription is by respondent, rather than by number of lines. Hence, subscription rates will not exceed 100% in this survey.

IDA CONSUMER AWARENESS AND SATISFACTION SURVEY 2014
12
Among respondents who did not subscribe to fixed broadband, their reasons for doing so remained
fairly consistent compared to 2010, with majority citing lack of need as the reason (Figure 3-3).
Figure 3-3 : Reasons for Not Subscribing to Fixed Broadband Service
24.5% 23.0%
28.8% 29.9%
14.2%
72.8%
0.0%
52.6%
13.7%18.3%15.8%
55.2%
No need Do not know how to use the
Internet
Too expensive Prefer to use mobile
broadband internet service
CASS 07 CASS 10 CASS 14%
% o
f N
on
-su
bsc
rib
ers
3.2 Awareness of Terms and Conditions
Almost 80% of fixed broadband subscribers were aware of early termination charges, whereas only
55% knew about the expiry date of the service (Figure 3-4).
Figure 3-4 : Awareness of Terms and Conditions for Fixed Broadband Service
55.4%
79.8%
44.6%
20.2%
Contract Expiry Date Early Termination Charge
CASS 14: Yes CASS 14: No%
% o
f Fi
xed
Bro
adb
and
Su
bsc
rib
ers

IDA CONSUMER AWARENESS AND SATISFACTION SURVEY 2014
13
3.3 Satisfaction with Fixed Broadband
From 2010 to 2014, satisfaction with service quality and variety of fixed broadband increased
significantly. Overall, close to 2 in 3 respondents expressed satisfaction with the 3 surveyed aspects of
the service (Figure 3-5).
Figure 3-5 : Satisfaction with Fixed Broadband Services (Mean Score)
3.753.49
3.743.45 3.47
3.633.58 3.543.75
1.00
2.00
3.00
4.00
5.00
Quality of Service Price Competitiveness Variety of Services Available
CASS 07 CASS 10 CASS 14
Mea
nSa
tisf
acti
on
Sco
re
VerySatisfied
VeryDissatisfied
In 2014, satisfaction levels were broadly similar across the service providers. However, compared to
2010, SingNet saw significant increases in satisfaction with service quality and variety, while M1 had
significant increases in satisfaction with service quality and price competitiveness (Figure 3-6).
Figure 3-6 : Satisfaction with Fixed Broadband Services (Mean Score by Service Provider)
3.63 3.62 3.653.77 3.71 3.81
1.00
2.00
3.00
4.00
5.00
SingNet StarHub
Online
M1
3.44 3.483.30
3.55 3.483.73
1.00
2.00
3.00
4.00
5.00
SingNet StarHub
Online
M1
CASS 10 CASS 14CASS 10 CASS 14
3.393.57
2.75
3.58 3.57 3.66
1.00
2.00
3.00
4.00
5.00
SingNet StarHub
Online
M1
Quality of Service Price Competitiveness Variety of Services Available
(N=28) (N=28) (N=27)

IDA CONSUMER AWARENESS AND SATISFACTION SURVEY 2014
14
In terms of satisfaction with the speed of their fixed broadband service, SingNet and M1 saw
substantial increases in satisfaction scores compared to 2010 while StarHub’s satisfaction score
remained fairly consistent (Figure 3-7).
Figure 3-7 : Satisfaction with Fixed Broadband Speed (Mean Score by Service Provider)
3.333.50
2.84
3.56 3.523.80
1.00
2.00
3.00
4.00
5.00
SingNet StarHub Online M1
CASS 10 CASS 14CASS 10 CASS 14
(N=28)
Mea
nSa
tisf
acti
on
Sco
re
VerySatisfied
VeryDissatisfied

IDA CONSUMER AWARENESS AND SATISFACTION SURVEY 2014
15
4 MOBILE BROADBAND SERVICES
4.1 Subscription
Subscription to mobile broadband services3 was moderately high, with close to 65% of respondents
subscribed to mobile broadband on mobile phone (Figure 4-1). A breakdown of subscription by age
and by housing type is provided in Figure 4-2 and Figure 4-3 respectively.
Figure 4-1 : Mobile Broadband Services Subscription
3.5%
38.1%
64.3%
6.8%
20.2%
CASS 2010 CASS 2014
% o
f R
esp
on
den
ts
Dongle
Mobile Phone Data
%
Dongle
Mobile Phone Data
TabletTablet not surveyed
previously
Subscription to mobile broadband services was generally high amongst younger respondents – above
80% for those aged 18-39 years old. A fall in subscription was observed as the age of the respondents
increased (Figure 4-2).
Figure 4-2 : Mobile Broadband Services Subscription by Age
84.4%87.0% 86.5%
82.6% 83.4%77.6% 75.4%
60.1%
49.8%
25.0%
18-19 years 20-24 years 25-29 years 30-34 years 35-39 years 40-44 years 45-49 years 50-54 years 55-59 years 60 years and
above
CASS 14%
% o
f R
esp
on
den
ts
3 Subscription is by respondent, rather than by number of lines / devices. Hence, subscription rates will not exceed 100% in this
survey.

IDA CONSUMER AWARENESS AND SATISFACTION SURVEY 2014
16
Subscription was highest among private property dwellers and generally lower for those staying in
HDB 1- to 3-room flats (Figure 4-3)
Figure 4-3 : Mobile Broadband Services Subscription by Housing Type
71.0%
48.4% 50.1%
60.4%64.9%
77.6% 77.3%
HDB 1-2-Rm Flat HDB 3-Rm Flat HDB 4-Rm Flat HDB 5-Rm or
Executive Flat
Condominiums or
Private Flat
Landed Property Others
CASS 14%
% o
f R
esp
on
den
ts
Among respondents who did not subscribe to mobile broadband services, almost 2 in 3 cited not
having a need for the service as the reason (Figure 4-4).
Figure 4-4 : Reasons for Not Subscribing to Mobile Broadband Service
38.8%
4.0%
12.8%
64.1%
I do not have a need for the
services
I do not know how to use
the services
The services are too
expensive
Others
CASS 14%
% o
f N
on
-su
bsc
rib
ers

IDA CONSUMER AWARENESS AND SATISFACTION SURVEY 2014
17
4.2 Awareness of Terms and Conditions
More than 80% of mobile broadband subscribers were aware of the expiry date and early termination
charge of the service (Figure 4-5).
Figure 4-5 : Awareness of Terms and Conditions for Mobile Broadband Service
86.6%93.8%
13.4%6.2%
Contract Expiry Date Early Termination Charge
CASS 14: Yes CASS 14: No
%
% o
f M
ob
ile B
road
ban
d
Sub
scri
ber
s
4.3 Satisfaction with Mobile Broadband
Respondents’ satisfaction with price competitiveness of mobile broadband was lower as compared to
the other 2 surveyed aspects, which both achieved mean scores of about 3.6 (Figure 4-6).
Figure 4-6 : Satisfaction with Mobile Broadband Services (Mean Score)
3.633.46
3.64
1.00
2.00
3.00
4.00
5.00
Quality of Service Price Competitiveness Variety of Services Available
CASS 14
Mea
nSa
tisf
acti
on
Sco
re
VerySatisfied
VeryDissatisfied

IDA CONSUMER AWARENESS AND SATISFACTION SURVEY 2014
18
Satisfaction levels were fairly consistent across service providers, although SingTel scored slightly
better than StarHub and M1 in service quality (Figure 4-7).
Figure 4-7 : Satisfaction with Mobile Broadband Services (Mean Score by Service Provider)
3.62 3.67 3.66
1.00
2.00
3.00
4.00
5.00
SingTel StarHub M1
3.41 3.49 3.52
1.00
2.00
3.00
4.00
5.00
SingTel StarHub M1
3.67 3.56 3.56
1.00
2.00
3.00
4.00
5.00
SingTel StarHub M1
Quality of Service Price Competitiveness Variety of Services Available
CASS 14CASS 14
In 2014, about 2 in 3 respondents were satisfied with the experienced speed of their mobile broadband
in comparison to what was advertised, achieving a mean score of 3.55 (Figure 4-8).
Figure 4-8 : Satisfaction with Mobile Broadband Speed (Mean Score)
3.51 3.49
1.00
2.00
3.00
4.00
5.00
Mobile Phone Data Only Dongle Only
3.55
1.00
2.00
3.00
4.00
5.00
All Mobile Broadband
CASS 10 CASS 14
Mea
n S
atis
fact
ion
Sco
re

IDA CONSUMER AWARENESS AND SATISFACTION SURVEY 2014
19
4.4 Ability to Replace Fixed Line Broadband Services
60.7% of mobile broadband subscribers felt that they could not replace fixed broadband with mobile
broadband (Figure 4-9).
Figure 4-9 : Ability to Replace Fixed Broadband with Mobile Broadband Services
10.3% 11.6%17.4%
60.7%
Yes, completely Yes, to a great
extent
Yes, slightly No, not at all
CASS 14
%
% o
f M
ob
ile B
road
ban
d
Sub
scri
ber
s
CASS 14:
% of “Yes” = 39.3%
The most common reasons cited for being able to replace fixed broadband were the portability and
convenience of using mobile broadband (Figure 4-10).
Figure 4-10 : Top Reasons for Being Able to replace Fixed Broadband Services
38.5%
5.8% 3.6%6.9%6.9%9.2%
33.4%
Mobile broadband
is portable so I canuse it anywhere
Mobile broadband
is convenient andeasy to use
I am seldom at
home / always onthe move
Mobile broadband
speed iscomparable to or
better than fixedbroadband
I don't or seldom
use, need, orsubscribe to fixed
broadband
Mobile
broadband's levelof functionality is
comparable to orbetter than fixed
broadband
I prefer mobile
broadband and/oruse it often or all
the time
CASS 14%
% o
f M
ob
ile B
road
ban
d
Sub
scri
ber
s

IDA CONSUMER AWARENESS AND SATISFACTION SURVEY 2014
20
On the other hand, the faster speed of fixed broadband was the most cited reason for respondents’
inability to replace their fixed with mobile broadband (Figure 4-11).
Figure 4-11 : Top Reasons for Not Being Able to replace Fixed Broadband Services
42.4%
10.4% 9.2%10.5%11.7%13.9%16.9%
Fixed broadband
speed is faster
Fixed broadband is
cheaper /expensive when
exceed mobilebroadband cap
Fixed broadband
has a more stableand reliable
connection
I prefer to use
fixed broadband athome / need it for
other usagepurposes
Mobile broadband
has data cap orlow data capacity /
fixed broadband isunlimited, can
download more
Poor coverage of
mobile broadband
Mobile device
screen is too small
CASS 14%
% o
f M
ob
ile B
road
ban
d
Sub
scri
ber
s
4.5 Data Usage Bill Cap
81.5% of mobile broadband subscribers were aware of the local data usage bill cap that was applicable
to their mobile data services (Figure 4-12).
Figure 4-12 : Awareness of local data usage bill cap
81.5%
18.5%
Yes No
CASS 14
%
% o
f M
ob
ile B
road
ban
d
Sub
scri
ber
s

IDA CONSUMER AWARENESS AND SATISFACTION SURVEY 2014
21
4.6 Excess Data Usage Charges
62.1% of mobile broadband subscribers were aware of the amount that they would be charged for
excess data usage on their mobile broadband plan. Also, only about 5% of all mobile broadband
subscribers were subscribed to an unlimited data usage plan (Figure 4-13).
Figure 4-13 : Awareness of the amount charged for excess mobile broadband data usage
62.1%
32.5%
5.4%
Yes Not Sure My plan comes with
unlimited data usage
CASS 14
%
% o
f M
ob
ile B
road
ban
d
Sub
scri
ber
s
4.7 Switching to WIFI at Home
About 80% of mobile broadband subscribers indicated that, when at home, they would switch to using
fixed broadband via WIFI for Internet access on their mobile devices instead of continuing to use
mobile broadband (Figure 4-14).
Figure 4-14 : Do you switch to Fixed Broadband via WIFI on mobile devices when at home?
80.6%
19.4%
Yes No
CASS 14
%
% o
f M
ob
ile B
road
ban
d
Sub
scri
ber
s

IDA CONSUMER AWARENESS AND SATISFACTION SURVEY 2014
22
5 INTERNATIONAL ROAMING
5.1 Awareness and Usage
From 2010 to 2014, both respondents’ awareness and usage of conventional roaming services such as
roaming voice calls and SMSes declined. In 2014, about 3 in 4 respondents were aware of the service,
and about 2 in 5 had used it in the past 1 year (Figure 5-1).
Figure 5-1 : Awareness and Usage of Conventional Roaming Services
85.2%
50.1%
76.6%
40.6%
Aware Used
CASS 10 CASS 14%
% o
f R
esp
on
den
ts
Awareness of conventional roaming services such as roaming voice calls and SMSes declined among
respondents aged 20-39 and 55-59 years old (Figure 5-2).
Figure 5-2 : Awareness of Conventional Roaming Services by Age
88.5%93.1% 91.9% 92.3%
95.1%
83.7% 82.0%
61.7%
90.1%89.2%
70.7%
54.7%
81.1%
88.7%90.2%84.7%
80.7%78.7%81.8%87.0%
18-19 years 20-24 years 25-29 years 30-34 years 35-39 years 40-44 years 45-49 years 50-54 years 55-59 years 60 years andabove
CASS 10 CASS 14%
% o
f R
esp
on
den
ts

IDA CONSUMER AWARENESS AND SATISFACTION SURVEY 2014
23
In terms of usage of conventional roaming services such as roaming calls and SMSes, respondents
aged 18 to 39 years old generally had large declines compared to 2010 (Figure 5-3).
Figure 5-3 : Usage of Conventional Roaming Services by Age
40.6% 42.9%
64.0% 64.5%
71.7%
50.4%45.9%
25.0%
50.4%54.7%
40.2%
23.7%
38.7%
53.4%48.0%
55.2%55.4%51.8%
28.0%22.3%
18-19 years 20-24 years 25-29 years 30-34 years 35-39 years 40-44 years 45-49 years 50-54 years 55-59 years 60 years andabove
CASS 10 CASS 14%
% o
f R
esp
on
den
ts
5.2 Satisfaction with International Roaming
In 2014, mean scores for satisfaction with price competitiveness and service variety of international
roaming increased significantly compared to 2010. Nevertheless, satisfaction mean score for service
quality was highest at 3.92 (Figure 5-4).
Figure 5-4 : Satisfaction with International Roaming (Mean Score)
2.89
3.41
2.71
3.42
3.92
3.00
3.59
1.00
2.00
3.00
4.00
5.00
Quality of Service Price Competitiveness Variety of Services Available
CASS 07 CASS 10 CASS 14
Mea
nSa
tisf
acti
on
Sco
re
VerySatisfied
VeryDissatisfied
This aspect not
surveyed previously

IDA CONSUMER AWARENESS AND SATISFACTION SURVEY 2014
24
5.3 Mobile Roaming Charges
In 2014, users of international roaming services were significantly more aware of the international
mobile roaming charges for voice and data, and were also more likely to check the different charges
before travelling (Figure 5-5).
Figure 5-5 : Awareness of and Likelihood to Check International Mobile Roaming Charges
54.5%
41.2%
74.1%69.3%
Voice Data
CASS 10 CASS 14
%
Level of Awareness of international mobile roaming charges of telecom service provider
%
% who check the different international mobile roaming charges of service provider before travel
24.5%18.3%
37.0% 36.7%
Voice Data
CASS 10 CASS 14
% o
f In
tern
atio
nal
Ro
amin
g U
sers
5.4 Alternatives to International Roaming
Awareness of international roaming alternatives remained high in 2014, and had also increased
significantly from 81.5% in 2010 to 86.1% in 2014 (Figure 5-6).
Figure 5-6 : Awareness of Alternatives to International Roaming
81.5%
18.5%
86.1%
13.9%
Yes No
CASS 10 CASS 14
%
% o
f In
tern
atio
nal
Ro
amin
g U
sers

IDA CONSUMER AWARENESS AND SATISFACTION SURVEY 2014
25
5.5 Data Roaming
Showing a substantial increase compared to 2010, most respondents were aware that they could
disable international data roaming service by manually switching it off or by contacting their service
provider (Figure 5-7).
Figure 5-7 : Awareness of Ability to Disable International Data Roaming
70.4%
29.6%
89.9%
10.1%
Yes No
CASS 10 CASS 14
%
% o
f In
tern
atio
nal
Ro
amin
g U
sers
Respondents’ awareness of data roaming plans with flat rates for fixed or unlimited data usage almost
doubled in 2014 to 72.8%, a substantial increase compared to 2010 (Figure 5-8).
Figure 5-8 : Awareness of Data Roaming Plans with Flat Rates for Data Usage
37.1%
62.9%
72.8%
27.2%
Yes No
CASS 10 CASS 14
%
% o
f In
tern
atio
nal
Ro
amin
g U
sers

IDA CONSUMER AWARENESS AND SATISFACTION SURVEY 2014
26
More than 7 in 10 respondents were aware that they could contact their service provider to activate a
data roaming cap so as to prevent bill shock (Figure 5-9)
Figure 5-9 : Awareness of Ability to Activate Data Roaming Cap
71.8%
28.2%
Yes No
CASS 14
%
% o
f In
tern
atio
nal
Ro
amin
g U
sers

IDA CONSUMER AWARENESS AND SATISFACTION SURVEY 2014
27
6 PAYPHONE SERVICES
6.1 Usage of Payphone Services
Usage of payphones had declined sharply over the past 9 years, falling from 22% in 2005 to 8.4% in
2014 (Figure 6-1).
Figure 6-1 : Usage of Payphone Services
22.0%20.5%
13.4%
8.4%
0%
10%
20%
30%
40%
CASS 2005 CASS 2007 CASS 2010 CASS 2014
Note: ‘Usage’ = Usage of payphone services at least once in the last 6 months.
% o
f R
esp
on
den
ts
Across all age groups, usage of payphones had mostly declined over the past 7 years. However, usage
among respondents aged 50 years old and above was still higher compared to other age ranges (Figure
6-2).
Figure 6-2 : Usage of Payphone Services by Age
18.5% 17.6%
20.1%
16.4% 16.6% 16.2%
25.2%
22.8%
26.2%24.2%
28.4%
9.9%
14.3%
7.8%8.8%
16.8%19.1%
8.3%
12.0%13.4%
10.2%
1.9%3.2%
3.8%
8.4% 9.2%
6.4%
13.8%11.6%
9.6%
18-19 years 20-24 years 25-29 years 30-34 years 35-39 years 40-44 years 45-49 years 50-54 years 55-59 years 60 years and
above
CASS 07 CASS 10 CASS 14%
% o
f R
esp
on
den
ts

IDA CONSUMER AWARENESS AND SATISFACTION SURVEY 2014
28
There was a steep decline in payphone usage for respondents staying in HDB 1-2 Room, 3 Room, and 4
Room flats (Figure 6-3).
Figure 6-3 : Usage of Payphone Services by Housing Type
42.8%
29.9%
25.5%
15.2%
11.2%
7.2%
39.5%
21.6%
16.6%
8.9%6.6% 7.1%
0.0%
8.1%
0.0%
23.7%
9.5%7.2%
9.2%7.7%
5.2%
HDB 1-2-Rm Flat HDB 3-Rm Flat HDB 4-Rm Flat HDB 5-Rm or
Executive Flat
Condominiums or
Private Flat
Landed Property Others
CASS 07 CASS 10 CASS 14%
(N=8) (N=13)
% o
f R
esp
on
den
ts
6.2 Frequency of Usage
Compared to 2010, frequency of payphone usage remained consistently low, with almost 70% of
payphone users claiming to have used the service fewer than 5 times a year in 2014 (Figure 6-4).
Figure 6-4 : Frequency of Payphone Usage
59.1%
32.5%
7.2%1.3%
67.4%
21.2%
9.7%
1.7%
69.1%
12.4%17.8%
0.7%
Very rarely (fewer than 5 times
a year)
Fairly often (at least once a
month)
Very often (at least once a
week)
Most of the time (at least once
a day)
CASS 07 CASS 10 CASS 14
% o
f P
ayp
ho
ne
Use
rs
(N=3)(N=22)
%
CASS 14:
% of Frequent Usage
= 18.5%
(N=11) (N=2)(N=17) (N=5)
IDA CONSUMER AWARENESS AND SATISFACTION SURVEY 2014
29
6.3 Attitude towards Payphone as a Necessity
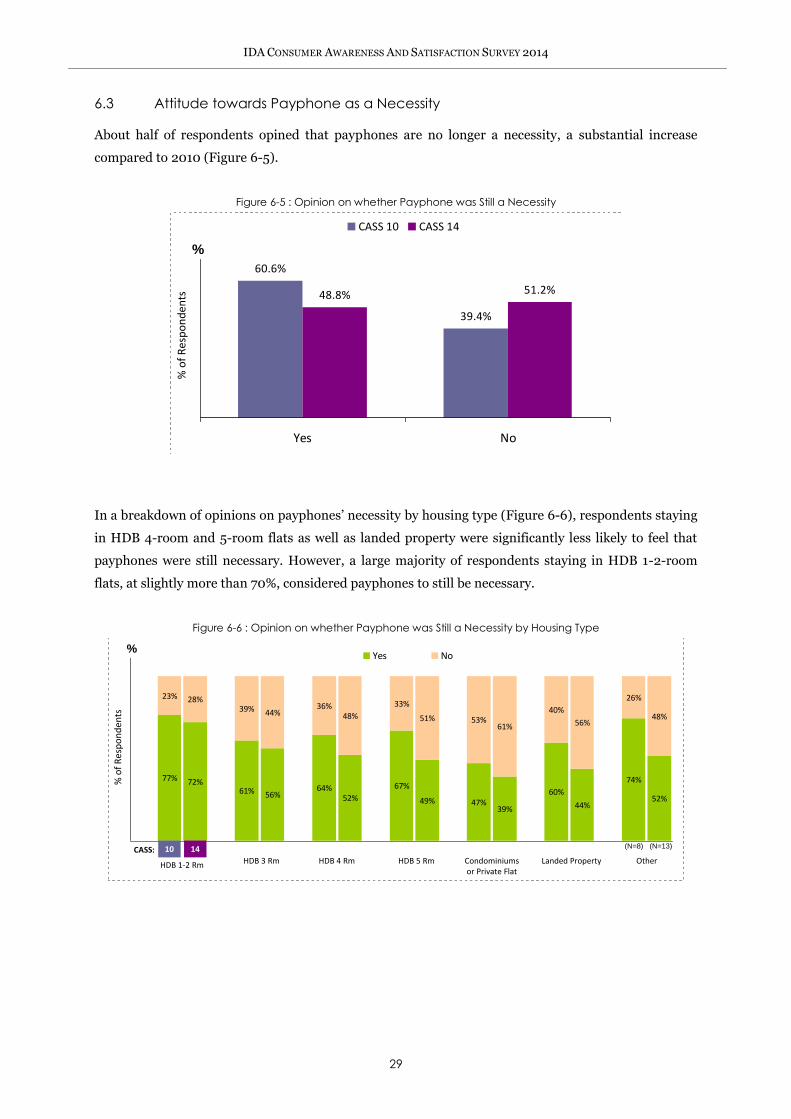
About half of respondents opined that payphones are no longer a necessity, a substantial increase
compared to 2010 (Figure 6-5).
Figure 6-5 : Opinion on whether Payphone was Still a Necessity
60.6%
39.4%
48.8% 51.2%
Yes No
CASS 10 CASS 14
%
% o
f R
esp
on
den
ts
In a breakdown of opinions on payphones’ necessity by housing type (Figure 6-6), respondents staying
in HDB 4-room and 5-room flats as well as landed property were significantly less likely to feel that
payphones were still necessary. However, a large majority of respondents staying in HDB 1-2-room
flats, at slightly more than 70%, considered payphones to still be necessary.
Figure 6-6 : Opinion on whether Payphone was Still a Necessity by Housing Type
77% 72%61% 56%
64%52%
67%
49% 47%39%
60%
44%
74%
52%
23% 28%39% 44%
36%48% 53%
61%
40%
56%48%
33%
51%
26%
Yes No%
HDB 1-2 Rm HDB 3 Rm HDB 4 Rm HDB 5 Rm Condominiums or Private Flat
Landed Property Other
1410CASS: (N=8) (N=13)
% o
f R
esp
on
den
ts

IDA CONSUMER AWARENESS AND SATISFACTION SURVEY 2014
30
A majority (83.9%) of the respondents who felt that the payphone was still a necessary service cited
payphones’ function as a backup for unexpected situations as the main reason (Figure 6-7).
Figure 6-7 : Reasons for Payphones still being Necessary
48.4%
7.8%1.5%
42.5%
6.6% 5.8% 1.2%
82.0% 83.9%
As backup for my
mobile phone
To access emergency
services
For other people
without handphone,
e.g. elderly, children,
foreigners, tourists
No mobile telephone
service
No residential fixed
telephone line
CASS 10 CASS 14
%
(N=22) (N=12)
This aspect not surveyed in CAS 10
% o
f R
esp
on
den
ts
On the other hand, respondents who thought that payphones were no longer necessary primarily cited
already having a mobile phone as the reason; almost 90% of them gave this reason (Figure 6-8).
Figure 6-8 : Reasons for Payphones Not being Necessary
29.4%21.4%
13.3%2.9%
34.0%25.6%
18.6%
4.2%
85.3% 88.1%
Already subscribed to
mobile phone
Already have
residential fixed line
Not convenient to use Do not know locations
of payphones
Others
CASS 10 CASS 14
%
% o
f R
esp
on
den
ts

IDA CONSUMER AWARENESS AND SATISFACTION SURVEY 2014
31
7 CUSTOMER CARE SERVICES
7.1 Satisfaction with Operators’ Customer Care Services
For the three major operators (SingTel, StarHub, and M1), respondents were generally least satisfied
with hotline waiting times, as compared to the other aspects of customer care (time taken to resolve
complaints and competency of customer service officer).
Nevertheless, satisfaction with hotline waiting times for the three major service providers had actually
improved since 2010. This is evidenced in the significant increase in satisfaction levels (Figure 7-1).
Figure 7-1 : Hotline Waiting Time to speak to a Customer Service Officer (Mean Score)
2.75
2.37
3.183.102.95
3.32
1.00
2.00
3.00
4.00
5.00
SingTel StarHub M1
CASS 10 CASS 14
Mea
n S
atis
fact
ion
Sco
re
VerySatisfied
VeryDissatisfied
2014 saw substantial improvements in respondents’ satisfaction with time taken to resolve complaints
for SingTel and StarHub. Significant increases in the mean scores of satisfaction were observed (Figure
7-2).
Figure 7-2 : Time Taken to Resolve Complaint (Mean Score)
3.112.97
3.473.39 3.323.51
1.00
2.00
3.00
4.00
5.00
SingTel StarHub M1
CASS 10 CASS 14
Mea
n S
atis
fact
ion
Sco
re
VerySatisfied
VeryDissatisfied

IDA CONSUMER AWARENESS AND SATISFACTION SURVEY 2014
32
With regards to satisfaction with competency of customer service officers, SingTel enjoyed significant
improvement in its satisfaction mean score compared to 2010; on the other hand, satisfaction levels
for StarHub and M1 remained fairly consistent compared to 2010 (Figure 7-3).
Figure 7-3 : Competency of Customer Service Officer (Mean Score)
3.42 3.413.68
3.54 3.51 3.57
1.00
2.00
3.00
4.00
5.00
SingTel StarHub M1
CASS 10 CASS 14
Mea
n S
atis
fact
ion
Sco
re
VerySatisfied
VeryDissatisfied
7.2 Suggestions for Improvement
When asked for areas where customer care services could be further improved, most respondents
suggest a reduction in hotline waiting times, amongst other customer care improvements. It was still
the primary suggestion despite a significant decrease compared to 2010 (Figure 7-4).
Figure 7-4 : Customer Care – Suggestions / Improvements
44.6%
6.4%7.8%4.6% 4.5% 4.2% 3.9%
7.0%
2.4%4.6%
12.0%12.4% 11.4%
32.6%
Reduce hotline
waiting time
Prompt and
effective follow-up
to complaints
Improve
competency &
product knowledge
of CSOs
Reduce number of
transfers in hotline
/ connect directly to
CSO
Employ local CSOs /
speak local
languages fluently
& clearly
Streamline the
routing directory of
CS hotline
Improve sincerity,
politeness & inter-
personal skills of
CSOs
CASS 10 CASS 14%
% o
f R
esp
on
den
ts