1987: U. S. Anhydrous Ammonia Distribution System in ...
15
U. S. Anhydrous Ammonia Distribution System in Transition Future supply locations will affect overall ammonia distribution system as production within the U.S. drops and imports increase. C. Clay Hale Pritchard Corp., Overland Park, KS 66210 and W.H. Lichtenberg Cominco American Inc., Beatrice, NB INTRODUCTION About twenty years ago two major pipelines were constructed for the primary purpose of transporting anhydrous ammonia from the man- ufacturing plants in north Texas and south- ern Louisiana to the corn and wheat belt of the Midwest. As these two pipelines were completed, refrigerated ammonia storage tanks were built along the line as part of the overall distribution system. This new pipeline system now competes with the river barge system that was in place in the Midwest for many years operated by the Army Corps of Engineers. Of course ammonia is only one of many products using the rivers for bulk transportation. Each system has advantage economically as far as cost per ton mile and availability of pro- duct year round. In the last twenty years, major changes have been made in the source of ammonia des- tined for the upper Midwest. It also appears that the changes are still in pro- gress. The increased supply from ports in the Gulf of Mexico can no doubt be absorbed in the system. Each USA seaport has access to at least 300 similar ammonia bulk ship- ping points worldwide. By transferring this ammonia either to the existing pipeline (Gulf Central Pipeline Company) or Missis- sippi river barges, the ammonia can be moved north to the upper Midwest. The new supply from Eastern and Western Canada however will require additional facilities. In January of 1986 an article was published by B. Prentice, Agrichemicals Research, North Vancouver B.C. with the title "World Ammonia Industry in Transi- tion." This article predicts the Canadian ammonia manufacturing capacity will increase from a 100% rate in 1985 to a 193% rate in 1992. This period is almost half over and three new plants are now in operation. A considerable portion is to be marketed in the USA. According to chemical Week July 23, 1986 issue, the USA production fell 20% dur- ing the years from 1977 to 1986. During this same period, world production of ammo- nia increased. This report provides data collected from the pipeline companies and similar sources to illustrate the existing distribution system. A separate section in this report will provide "typical tie-ins" for Canadian Ammonia on the mainline rail- roads to the two pipelines and the northern river channel ports. Finally, safety records on the pipe- lines available from the U.S.A. Department of Transportation have been summarized to indicate their advantage in this area. Transport safety risk potentials for each of these other major systems will also be dis- cussed based on several reports published in the USA and overseas on accidents in hand- ling and transporting ammonia. , ,, • 76
Transcript of 1987: U. S. Anhydrous Ammonia Distribution System in ...

U. S. Anhydrous Ammonia DistributionSystem in Transition
Future supply locations will affect overall ammonia distributionsystem as production within the U.S. drops and imports increase.
C. Clay HalePritchard Corp., Overland Park, KS 66210
andW.H. Lichtenberg
Cominco American Inc., Beatrice, NB
INTRODUCTION
About twenty years ago two major pipelineswere constructed for the primary purpose oftransporting anhydrous ammonia from the man-ufacturing plants in north Texas and south-ern Louisiana to the corn and wheat belt ofthe Midwest. As these two pipelines werecompleted, refrigerated ammonia storagetanks were built along the line as part ofthe overall distribution system.
This new pipeline system now competeswith the river barge system that was inplace in the Midwest for many years operatedby the Army Corps of Engineers. Of courseammonia is only one of many products usingthe rivers for bulk transportation. Eachsystem has advantage economically as far ascost per ton mile and availability of pro-duct year round.
In the last twenty years, major changeshave been made in the source of ammonia des-tined for the upper Midwest. It alsoappears that the changes are still in pro-gress. The increased supply from ports inthe Gulf of Mexico can no doubt be absorbedin the system. Each USA seaport has accessto at least 300 similar ammonia bulk ship-ping points worldwide. By transferring thisammonia either to the existing pipeline(Gulf Central Pipeline Company) or Missis-sippi river barges, the ammonia can be movednorth to the upper Midwest.
The new supply from Eastern and WesternCanada however will require additionalfacilities. In January of 1986 an articlewas published by B. Prentice, AgrichemicalsResearch, North Vancouver B.C. with thetitle "World Ammonia Industry in Transi-tion." This article predicts the Canadianammonia manufacturing capacity will increasefrom a 100% rate in 1985 to a 193% rate in1992. This period is almost half over andthree new plants are now in operation. Aconsiderable portion is to be marketed inthe USA.
According to chemical Week July 23,1986 issue, the USA production fell 20% dur-ing the years from 1977 to 1986. Duringthis same period, world production of ammo-nia increased. This report provides datacollected from the pipeline companies andsimilar sources to illustrate the existingdistribution system. A separate section inthis report will provide "typical tie-ins"for Canadian Ammonia on the mainline rail-roads to the two pipelines and the northernriver channel ports.
Finally, safety records on the pipe-lines available from the U.S.A. Departmentof Transportation have been summarized toindicate their advantage in this area.Transport safety risk potentials for each ofthese other major systems will also be dis-cussed based on several reports published inthe USA and overseas on accidents in hand-ling and transporting ammonia. , ,, •
76
USA FERTILIZER BULK AMMONIA DISTRIBUTIONSYSTEM
The existing routes available for the bulkshipment of ammonia can be summarized asfollows:
Existing Distribution System
By Pipeline - Three companies serving11 states and almost 3,000 miles totallength.
By Water - Seaports and river bargeterminals. This overall length also3,000 miles.
By Rail - Throughout all the contiguous48 states - mainland and connections toCanada and Mexico.
By Truck - Over interstate and statehighways for delivery from plants/-terminals to local dealers.
The most unique part of the USA distri-bution system is the 3,000 miles of pipe-lines dedicated to ammonia service. Twomajor ammonia pipelines serve the upper Mid-west area. One transports ammonia fromTexas and the other starts in the NewOrleans, Louisiana area. The actual routesfor these two lines have been described inprevious papers as well as their control andoperation. A brief review is included hereto help in evaluating the significance ofchanging the supply. This change primarilyinvolves rail import replacing plant manu-facture, import by ship, or delivery bypipeline. Terminals designed to receiveammonia from any one of these three sourcesusually cannot economically handle tank carsby rail.
USA Pipelines
For the purpose of outlining the facil-ities available in the USA, the three mainsystems have been broken down as follows:
Gulf Central Pipeline System and
Gulf Central Storage and Terminal Com-pany
Mid-America Pipeline Company
Tampa Bay Pipe Line Company
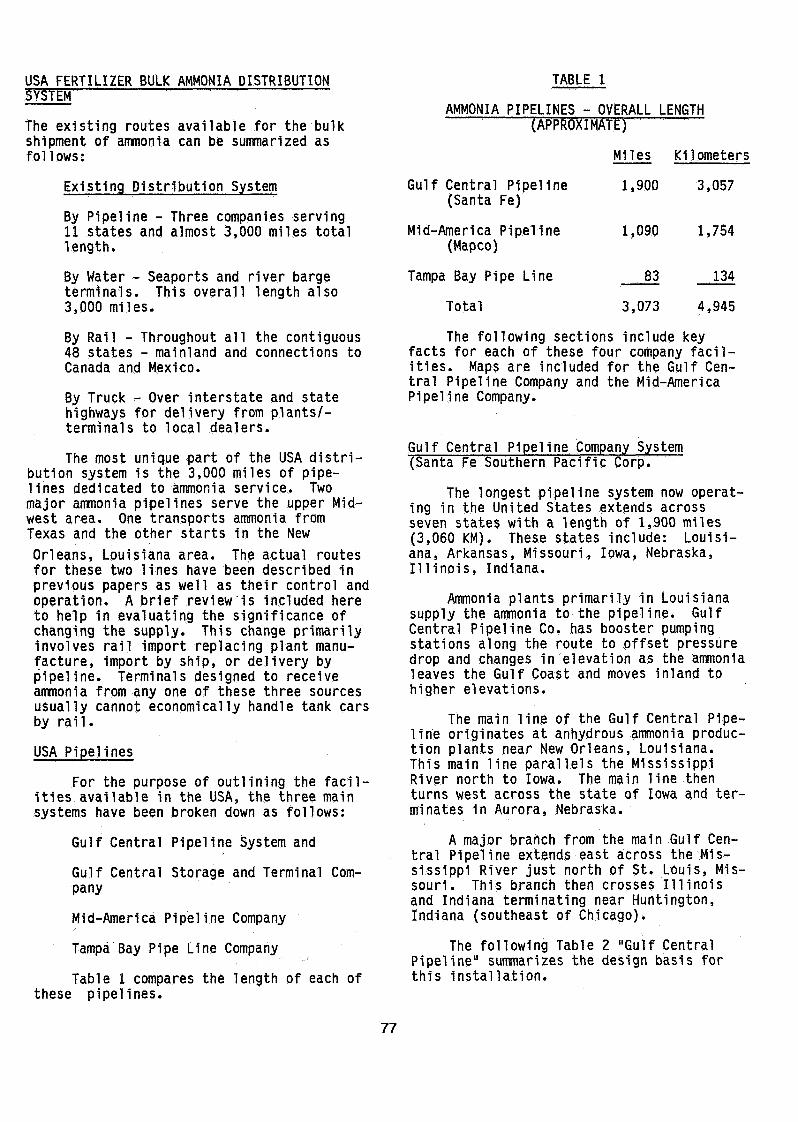
Table 1 compares the length of each ofthese pipelines.
TABLE 1
AMMONIA PIPELINES - OVERALL LENGTHFE)
Miles Kilometers
Gulf Central Pipeline 1,900 3,057(Santa Fe)
Mid-America Pipeline 1,090 1,754(Mapco)
Tampa Bay Pipe Line 83 134
Total 3,073 4,945
The following sections include keyfacts for each of these four company facil-ities. Maps are included for the Gulf Cen-tral Pipeline Company and the Mid-AmericaPipeline Company.
Gulf Central Pipeline Company System(Santa Fe Southern Pacific Corp.
The longest pipeline system now operat-ing in the United States extends acrossseven states with a length of 1,900 miles(3,060 KM). These states include: Louisi-ana, Arkansas, Missouri, Iowa, Nebraska,Illinois, Indiana.
Ammonia plants primarily in Louisianasupply the ammonia to the pipeline. GulfCentral Pipeline Co. has booster pumpingstations along the route to offset pressuredrop and changes in elevation as the ammonialeaves the Gulf Coast and moves inland tohigher elevations.
The main line of the Gulf Central Pipe-line originates at anhydrous ammonia produc-tion plants near New Orleans, Louisiana.This main line parallels the MississippiRiver north to Iowa. The main line thenturns west across the state of Iowa and ter-minates in Aurora, Nebraska.
A major branch from the main Gulf Cen-tral Pipeline extends east across the Mis-sissippi River just north of St. Louis, Mis-souri. This branch then crosses Illinoisand Indiana terminating near Huntington,Indiana (southeast of Chicago).
The following Table 2 "Gulf CentralPipeline" summarizes the design basis forthis installation.
77

TABLE 2
GULF CENTRAL PIPELINE
DESIGN BASIS
Control Center Tul sa, OK
Capacity
Main Pipe Line
Maximum Pressure
Minimum Pressure
Overall Length
Owner
2,000,000 tons peryear. Approximately1,500 gal per minute.
10" Alexandria, LA toHermann, MO
8" to Spencer, IA6" from Spencer, IAto Aurora, NE
Branch
8" from Hermann, MOto Terre Haute, IN
6" to Huntington, IN
1,424 psig
300 psig
1,900 miles
SFSP Corp. (SFSP alsoowns other liquid pro-ducts pipelines.)
A copy of Figure 1 the "Gulf CentralPipeline Company - System Map" is includedto illustrate additional detail on thispipeline. The numbers on this map refer totie-ins to the line from ammonia plants andammonia storage terminals. The followingsection describes these facilities and usesthese numbers.
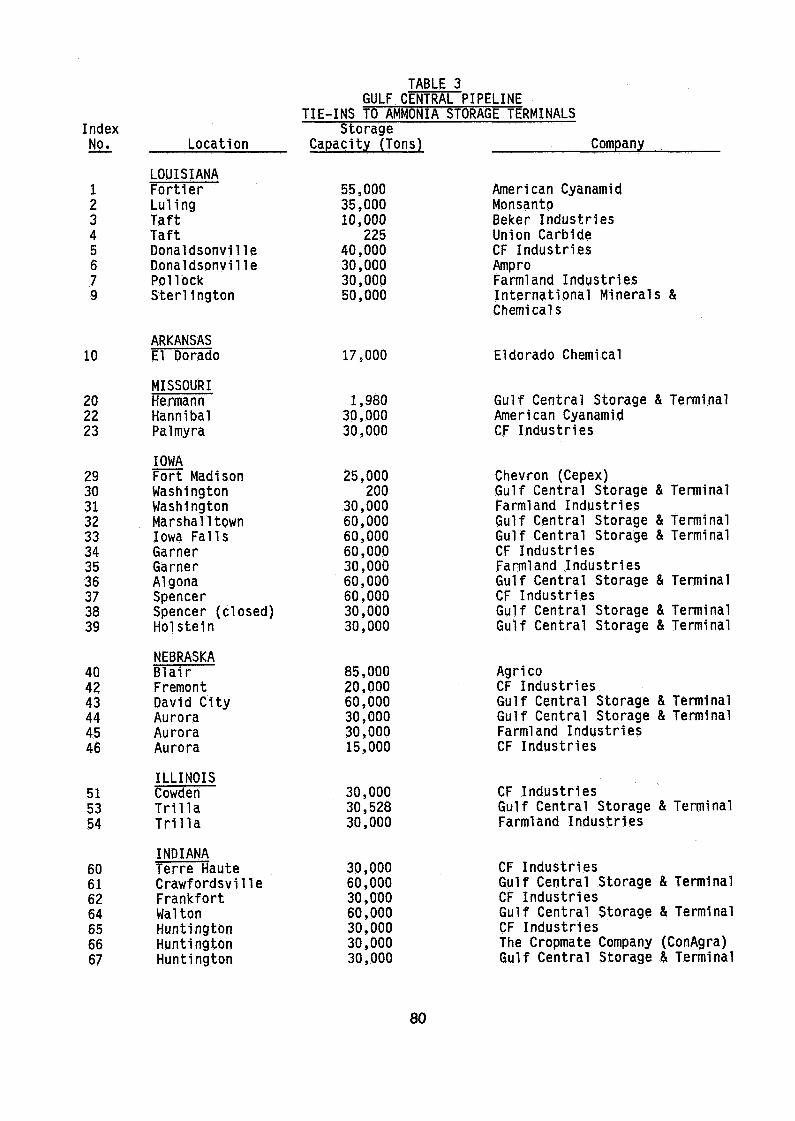
Gulf Central Storage and Terminal Company
To supplement the Gulf Central Pipe-line, the Gulf Central Storage and TerminalCompany provides complete operating AmmoniaTerminals for public storage of anhydrousammonia. A total of eleven cryogenic stor-age terminals are located along the pipeline
in strategic locations. These terminalseach provide full storage and terminaldelivery service.
Table 3 Gulf Central Storage and Termi-nal Tie-ins lists all of the plant andterminal tie-ins to the Gulf Central Pipe-line. The ownership of each facility islisted in this table with location (stateand closest city) and the total ammoniacapacity for each location. This list indi-cates in addition to the Gulf Central Stor-age and Terminal company facilities, twelveother companies own and operate a total of28 facilities. As noted above, this totalof 40 Gulf Central and independent terminalsis shown on Figure 1 "Gulf Central PipelineCompany System Map."
Mid-America Pipeline Company (MAPCO)
The MAPCO ammonia pipeline was thefirst interstate system in operation, theinitial charging of the line with ammonia in1968 came from an ammonia manufacturingplant in Borger, Texas, now owned andoperated by Cominco American,a subsidiary ofCominco Limited with headquarters in Van-couver, Canada. The MAPCO line now extendsabout 1,090 mi.les northeast from north Texasacross Oklahoma, Kansas, Nebraska, Iowa,ending in Minnesota. The main line andbranches provide connections from threemajor ammonia plants to 13 distribution cen-ters in four of these six states.
The overall Mid-America Pipeline Com-pany system consists of about 9,000 miles of"product liquids" pipelines. In addition toanhydrous ammonia these include hydrocarbonssuch as propane and ethane propane (E.P.)mix.
The following list in Table 4 summar-izes the design basis for this ammonia pipe-line:
The tie-ins to the Mid-America Pipeline aresummarized on Table 5 "Plants and TerminalLocations - Ownership - Ammonia Capacity"Mid-America Pipeline Company.
This table lists terminals in six stateswhich are connected to the pipeline andoperated by five companies in addition tothose operated by MAPCO.
78

Figure 1. Gulf central pipeline company system map.
79
IndexNo.
l2345679
Location
LOUISIANAFortierLul ingTaftTaftDonaldsonvilleDonaldsonvillePollockSterlington
TABLE 3GULF CENTRAL PIPELINE
TIE-INS TO AMMONIA STORAGE TERMINALSStorage
Capacity (Tons)
55,00035,00010,000
22540,00030,00030,00050,000
Company
American CyanamidMonsantoBeker IndustriesUnion CarbideCF IndustriesAmproFarmland IndustriesInternational MineralsChemicals
ARKANSAS10 El Dorado
MISSOURI20 Hermann22 Hannibal23 Palmyra
IOMA29 Fort Madison30 Washington31 Washington32 Marshall town33 Iowa Falls34 Garner35 Garner36 Algona37 Spencer38 Spencer (closed)39 Holstein
NEBRASKA40 Blair42 Fremont43 David City44 Aurora45 Aurora46 Aurora
ILLINOIS51 Cowden53 Trilla54 Trilla
INDIANA60 Terre Haute61 Crawfordsville62 Frankfort64 Walton65 Huntington66 Huntington67 Huntington
17,000
1,98030,00030,000
25,000200
30,00060,00060,00060,00030,00060,00060,00030,00030,000
85,00020,00060,00030,00030,00015,000
30,00030,52830,000
30,00060,00030,00060,00030,00030,00030,000
Eldorado Chemical
Gulf Central Storage & TerminalAmerican CyanamidCF Industries
Chevron (Cepex)Gulf Central Storage & TerminalFarmland IndustriesGulf Central Storage & TerminalGulf Central Storage & TerminalCF IndustriesFarmland IndustriesGulf Central Storage & TerminalCF IndustriesGulf Central Storage & TerminalGulf Central Storage & Terminal
AgricoCF IndustriesGulf Central Storage & TerminalGulf Central Storage & TerminalFarmland IndustriesCF Industries
CF IndustriesGulf Central Storage & TerminalFarmland Industries
CF IndustriesGulf Central Storage & TerminalCF IndustriesGulf Central Storage & TerminalCF IndustriesThe Cropmate Company (ConAgra)Gulf Central Storage & Terminal
80
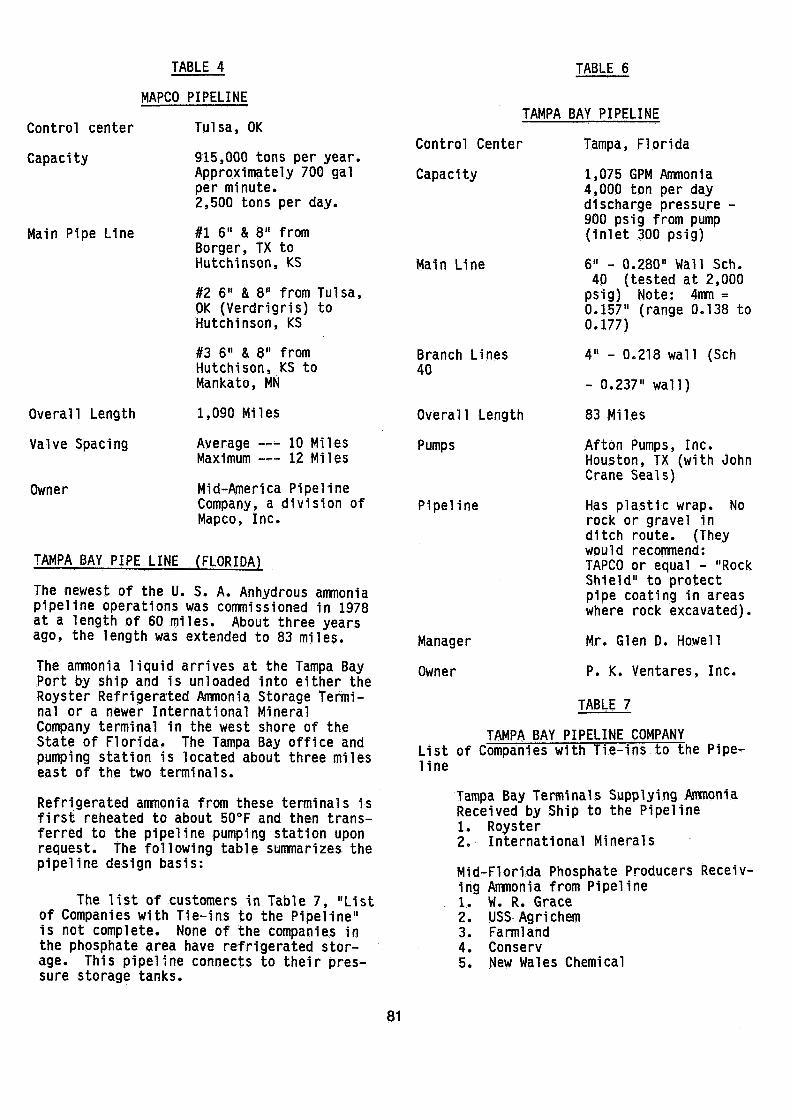
TABLE 4 TABLE 6
Control center
Capacity
Main Pipe Line
MAPCO PIPELINE
Tul sa, OKTAMPA BAY PIPELINE
Overall Length
Valve Spacing
Owner
915,000 tons per year.Approximately 700 galper minute.2,500 tons per day.
#1 6" & 8" fromBorger, TX toHutchinson, KS
#2 6" & 8" from Tul sa,OK (Verdrigris) toHutchinson, KS
#3 6" & 8" fromHutchison, KS toMankato, HN
1,090 Miles
Average — 10 MilesMaximum — 12 Miles
Mid-America PipelineCompany, a division ofMapco, Inc.
TAMPA BAY PIPE LINE (FLORIDA)
The newest of the U. S. A. Anhydrous ammoniapipeline operations was commissioned in 1978at a length of 60 miles. About three yearsago, the length was extended to 83 miles.
The ammonia liquid arrives at the Tampa BayPort by ship and is unloaded into either theRoyster Refrigerated Ammonia Storage Termi-nal or a newer International MineralCompany terminal in the west shore of theState of Florida. The Tampa Bay office andpumping station is located about three mileseast of the two terminals.
Refrigerated ammonia from these terminals isfirst reheated to about 50°F and then trans-ferred to the pipeline pumping station uponrequest. The following table summarizes thepipeline design basis:
The list of customers in Table 7, "Listof Companies with Tie-ins to the Pipeline"is not complete. None of the companies inthe phosphate area have refrigerated stor-age. This pipeline connects to their pres-sure storage tanks.
Control Center
Capacity
Main Line
Branch Lines40
Overall Length
Pumps
Pipeline
Manager
Owner
Tampa, Florida
1,075 GPM Ammonia4,000 ton per daydischarge pressure -900 psig from pump(inlet 300 psig)
6" - 0.280" Wall Sch.40 (tested at 2,000psig) Note: 4mm -0.157" (range 0.138 to0.177)
4" - 0.218 wall (Sch
- 0.237" wall)
83 Miles
Afton Pumps, Inc.Houston, TX (with JohnCrane Seals)
Has plastic wrap. Norock or gravel inditch route. (Theywould recommend:TAPCO or equal - "RockShield" to protectpipe coating in areaswhere rock excavated).
Mr. Glen D. Howell
P. K. Ventares, Inc.
TABLE 7
TAMPA BAY PIPELINE COMPANYList of Companies with Tie-ins to the Pipe-line
Tampa Bay Terminals Supplying AmmoniaReceived by Ship to the Pipeline1. Royster2. International Minerals
Mid-Florida Phosphate Producers Receiv-ing Ammonia from Pipeline1. W. R. Grace2. USS Agrichem3. Farmland4. Conserv5. New Wales Chemical
81

MID-AMERICA PIPELINE COMPANY
,T A N O R T H DAKOTA
«
I MINNESOTA)ƒ . x -s f"j 'i ( \jjn! ^ O - . T I -, • - r -l ™4 WISCONSIN^//so j TH J r t f %u r A l tass! j f
«N, G L EH
C O L O R A D o i
-// gAUMLAMft.«^l
/""•""ISÜH15IÄ?
i—7 "l *—r \rsgSTVgS5i%Ma^rcilM?u-' ! ™ *. -"«- \ ,N P. ̂ A N - A s£_„. J
,' M £ W M E v j - rjC, K '. A h 'J }a A ,
UJ—ST
(ttk.̂ .. ƒ
Figure 2. Mid-America pipeline company.
82
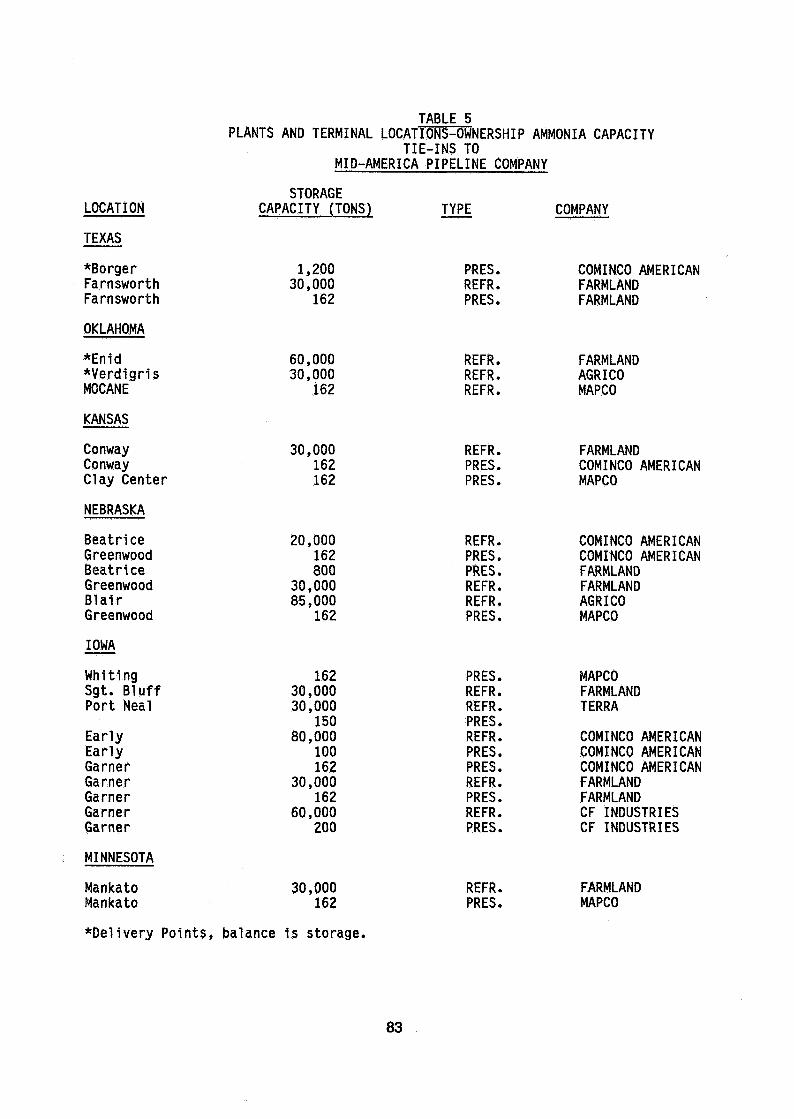
TABLE 5PLANTS AND TERMINAL LOCATIONS-OWNERSHIP AMMONIA CAPACITY
TIE-INS TOMID-AMERICA PIPELINE COMPANY
LOCATION
TEXAS
*BorgerFarnsworthFarnsworth
OKLAHOMA
*En1d*Verd1grisMOCANE
KANSAS
ConwayConwayClay Center
NEBRASKA
BeatriceGreenwoodBeatriceGreenwoodBlairGreenwood
IOWA
WhitingSgt. BluffPort Neal
EarlyEarlyGarnerGarnerGarnerGarnerGarner
MINNESOTA
MankatoMankato
STORAGECAPACITY (TONS)
1,20030,000
162
60,00030,000
162
30,000162162
20,000162800
30,00085,000
162
16230,00030,000
15080,000
100162
30,000162
60,000200
30,000162
TYPE COMPANY
PRES.REFR.PRES.
REFR.REFR.REFR.
REFR.PRES.PRES.
REFR.PRES.PRES.REFR.REFR.PRES.
PRES.REFR.REFR.PRES.REFR.PRES.PRES.REFR.PRES.REFR.PRES.
REFR.PRES.
COMINCO AMERICANFARMLANDFARMLAND
FARMLANDAGRICOMAPCO
FARMLANDCOMINCO AMERICANMAPCO
COMINCO AMERICANCOMINCO AMERICANFARMLANDFARMLANDAGRICOMAPCO
MAPCOFARMLANDTERRA
COMINCO AMERICANCOMINCO AMERICANCOMINCO AMERICANFARMLANDFARMLANDCF INDUSTRIESCF INDUSTRIES
FARMLANDMAPCO
*Delivery Points, balance is storage.
83

RIVER TRANSPORT
The USA has an extensive ship and bargetransport system for receiving ammonia fromvarious overseas plants. About 30 seaportson the coasts and the Gulf of Mexico canunload ships hauling anhydrous ammonia.Barges can then move this ammonia from theGulf of Mexico, Atlantic and Pacific Oceanports both inland and along the intracoastalwaterway. For the Midwest the bulk of thisammonia is received in the New Orleans area.This ammonia can travel by barge up the Mis-sissippi River and with major branches onthe Missouri, Ohio, Illinois and Tennesseerivers. The Missouri River barge trafficends at Sioux City, Iowa. The Ohio Riverties into the Monongahela and Alleghenyrivers at Pittsburgh, PA. The TennesseeRiver extends the barge traffic from theOhio up to Knoxville. A new canal,Tennessee-Tombigbee is now open and providesa new shortcut north from the Gulf of Mexicoto the Tennessee River supplementing the 30seaport terminals. At least 35 ammonia term-inals are located on rivers in the USA.Several of these terminals can deliver ammo-nia from the barge to the Gulf Central Pipe-line system. Table 8 lists the location,capacity and owner for ammonia terminals onthe following rivers: Mississippi River,Missouri River, Ohio-Monongahela Rivers,Illinois River. This list is based on tanksurveys, but river transport may not be usedbut their location would provide this methodif required.
Review of this list indicates the com-bined length of these rivers is about thesame as for the three pipelines. Also theammonia plants in the New Orleans to BatonRouge, Louisiana area provide most of theammonia for the barge traffic. In addition,a significant portion of this ammonia istransferred from ships imported from over-seas plants such as the USSR trade agreementammonia.
RAILROADS
The overall USA railroad network is toocomplicated to;discuss in this paper. How-ever, changes in the railway ownership bymergers will no doubt affect ammonia ship-ments as well as will the changes in thesource of supply of fertilizer ammonia. Theincreased supply discussed in the "WorldNH3 Industry in Transition" article is of
major concern since none of this ammonia canreach the USA except by rail.
About 10 years ago serious considera-tion was given to constructing a new ammoniapipeline from Alberta Province in Canada tothe USA Midwest with connections to the twomajor pipelines that cross to Garner, Iowa.This pipeline was never built so rail trans-port is the only method available. Whilethis pipeline was being considered aboutfour new refrigerated ammonia storage termi-nals were built along the proposed pipelineroute. These terminals were designed.forrail ammonia shipments. These now can servea limited area in the upper Midwest.
Several rail crossings of the existingpipelines appear to provide an opportunityfor connecting west Canada to existing stor-age systems. Gulf Central Pipeline, forexample, terminates in Aurora, Nebraska.The Burlington Northern railroad fromAlberta, Canada goes through Aurora on theway to Lincoln, Nebraska. Farmland, C. F.Industries and Gulf Central Storage and Ter-minal Company all have terminals at thislocation.
Ammonia shipped from East Canada,Niagara Falls or Courtright (Sarnia)Ontario, can tie in to the Gulf Centralpipeline at Huntington, Indiana.
This point is the eastern branch oftheir pipeline from New Orleans. Three com-panies have storage terminals in Huntington,C. F. Industries, ConAgra and Gulf CentralStorage and Terminal Company.
A condensed map is shown in Figure 3"United States Railroads". The northernborder shows railroads from western Canada.
Canadian National Railroad fromEdmonton, Alberta east throughSaskatoon.
Canadian Pacific Railroad fromCalgary, Alberta east with a tie-into Burlington Northern Railroad atMi not, Minnesota.
84

TABLE 8RIVER TERMINALS
MISSISSIPPI RIVER
Length - Gulf of Mexico to Cairo, Illinois (Ohio River) - 922 miles
Length - Cairo, Illinois to Minneapolis = 853 miles
Total = 1,775 miles
LOUISIANA
SterlingtonLulingFortierTaftGeismarDonaldsonvilleDonaldsonvilleDonaldsonville
TENNESSEE
MemphisMemphisMemphis
ARKANSAS
HelenaBlytheville
MISSOURI
Crystal CityLouisianaPalmyra
ILLINOIS
E. St. LouisWood RiverNiotaAlbany
IOWA
Fort MadisonFort MadisonBurlingtonMuscatineBelleview
MINNESOTA
Pinebend
STORAGECAPACITY. TONS
50,00030,00055,000107,00015,00030,00070,00025,000
20,0004,0009,500
20,00045,000
35,00027,00030,000
30,00030,00030,00060,000
20,00060,00030.00060.00030.000
60,000
OWNER
I.M.C.MonsantoAmerican CyanamidOccidentalArcadianTriadCF IndustriesAgrico
GraceLucy-WoodstockAgrico
Gardlneer (Arcadian)Agrico
USS AgrichemHerculesCF Industries
CepexConAgraN-RenCF Industries
CepexArcoConagraMonsantoUS Agrichem
CF Industries
85

MISSOURI RIVER
Length - St. Louis Missouri to Sioux City, Iowa = 550 miles
MISSOURI
Sugar Creek
NEBRASKA
LaPlatteOmahaBlair (2)
IOWA
Sgt. BluffPort Neal
20,000
22,50020,00050,000/35,000
30,00030,000
Cepex
ArcadianOlinAgrico
FarmlandTerra Chem
OHIO RIVER
Length - Cairo, Illinois to Pittsburgh, PA - 400 miles
KENTUCKY
HendersonWilder
INDIANA
Mt. VernonMt. Vernon
OHIO
Cincinnati
MONONGAHELA RIVER
PENNSYLVANIANewel 1Donora
ILLINOIS RIVER
45,00018,000
15,00015,000
20,000
10,00010,000
AgricoAgrico
AgricoCF Industries
Kaiser
Weiland ChemicalHercules
Length - Grafton, Illinois to Chicago, Illinois = 330 miles
ILLINOIS
Meredosia 20,000Meredosia 36,000N. Pékin 21,000N. Pékin 60,000Henry 20,000Peru 20,000Marseilles 10,000Marseilles 42,500Seneca 30,000Joliet 20,000Joliet 25,000Kingston Mines 40,000
EsmarkGraceAgricoConAgraGraceCF IndustriesBekerKaiserSeneca Port AuthorityOlinAmerican Oil (shut down)CF Industries
86

-fiUNITED STATES
RAILROADS
ft.»
U. S. railroads. A T Figure 4. U. S. interstate highways.
87

TABLE 9A
RAILROAD TIE-INS TO POSSIBLE PIPELINE LOCATIONS
TIE-IN FROM WESTERN CANADA TERMINAL OPERATOR
1. Andra, Nebraska C F IndustriesGulf Central Farmland
Gulf Central Storage and Terminal Co.
2. Garner Iowa* C F IndustriesGulf Central and MAPCO Farmland
3. Sioux City, Iowa Farmland(Sgt. Bluff/Port Neal) Terra ChemicalMAPCO
*Point of Pipeline Intersection
TIE-IN FROM EASTERN CANADA
4. Huntington, Indiana C F IndustriesGulf Central Cropmate (ConAgra)
Gulf Central Storage and Terminal Co.
TABLE 9B
RAILROAD TIE-INS TO POSSIBLE RIVER LOCATION
TIE-IN FROM WESTERN CANADA TERMINAL OPERATOR
1. Sioux City, Iowa Farmland(Sgt. Bluff/Port Neal) Terra Chemical(Missouri River - Northern Chemical)
2. Minneapolis, Minnesota C F Industries(Pine Bend)(Mississippi River - Northern Chemical)
3. Belleview, Iowa U.S. Agrichem(Mississippi River) (and Soo Railroad line)
TIE-IN FROM EASTERN CANADA
1. Newell, Pennsylvania Weiland ChemicalMonongahela River (to Ohio River)
2. Cincinnati, Ohio Agrico Chemical(Wilder, Kentucky)Ohio River
3. Seneca, Illinois Seneca Port Authority(Morris)Illinois River
The above lists in Table 9 are intended to illustrate how the ammonia safety could be im-proved with transport of ammonia by rail. This would involve transferring either to pipe-line or river barge at the closes point.
88

USA INTERSTATE HIGHWAY SYSTEM
Bulk ammonia shipment by the major car-riers, that is the Ammonia pipeline, riverbarge, or tank car, almost always ends up ina tank truck for delivery to the fertilizerdistributor. The location of the refriger-ated ammonia storage terminal is usuallyfirst determined by the pipeline, rail orriver route. If this can be combined withconvenient access to one of the inter-statehighways, the effective distribution areacan be increased,
The interstate highway system in theupper Midwest area follows either a east-west or a north-south route. The east-westroute is roughly 150 miles apart and thenorth-south about 200 miles spacing. As aresult, finding a location near an intersec-tion of two interstates offers a number ofadvantages.
POSSIBLE TIE-IN FROM CANADA
As noted in the Introduction new ammoniaproduction in Canada will be routed fromboth eastern and western Canada to the Mid-west. The logical tie-in points would be toexist-ing terminals with tie-ins to the exist-ing pipelines or to the navigable riverssince they both offer economical and safetransport to existing market areas.
The USA Railroad Map shows the mainlines of the Canadian Pacific and CanadianNational Railroads. These connect in theWestern and.Midwestern USA across the borderto the Burlington Northern and the Soo rail-roads. Actually, Burlington Northern hasdirect connections to Winnipeg, Manitobacrossing the border into North Dakota atEmerson Junction.
SAFETY CONSIDERATIONS
The overall description of the USA "Dis-tribution System" would not be completewithout a discussion on relative safety.However, the only complete analysis ofaccidents over the years has been summarizedfrom "Reports of Ammonia Pipeline Incidents"as reported to the USA Department of Trans-portation.
Table 10 covers the period between Octo-ber, 1968 to March, 1986 (18 1/2 years).Over this period there were no fatalitiesand 15 injuries reported. Most of theinjuries were to excavating equipment oper-ators.
The option between the various transportmethods cannot usually be made based onsafety considerations. Fortunately this isnot normally a problem since in general thelarge volume transport, pipeline, or bargeroutes are more economical and are consid-ered less hazardous than over-the-road tanktruck or even railroad transport.
The records of "Accidental Releases ofAmmonia" as published in the Loss PreventionSymposium a few years ago by P. J. Baldockof I.C.I, for transport accidents includedthe following relative number of accidents:
SeaRailRoad
19 (all major)12 (7 major)
In addition to these type accidents,about 27 accidents occurred as the trans-ports were being filled or emptied.
From the above incomplete summary,safety problems with rail and trucks trans-port, it is obvious the pipeline.and barge/ship transport have a superior ré'cord. Thisof course can be explained by the exposureto highway traffic which normally kills50,000 people each year in the USA. Eventhe railroads are not free of this type ofaccident where the highways cross their mainlines.
REFERENCES
(1) World NH2 Industry 1n Transition" by B. Prentice,Agrlchemicals Economic Research, North Vancouver, B.C.Canada, Hydrocarbon Processing, Oan. 1986
(2) Chemical Week, April 28, 1986, Newsfront
(3) "Dept. of Transportation's (USA) Hazardous MaterialsInformation System," Write to:
WHson Hill Information SystemResearch & Special Programs Admin.Office of Hazardous Materials
Information DivisionInformation System BranchDHM-63 Room 8112400 7th Street, S.W.Washington, D.C. 20590
(4) Gulf Central Pipeline co. andGulf Central Storage and Terminal Co.907 South Detroit StreetSuite 2000Tul sa, OK 74120-4225
(5) Mid-America Pipeline Co. (MAPCO)1800 South Baltimore Ave.P. 0. Box 645Tul sa, OK 74101-0645
(6) Tampa Pipeline Co.P. 0. Box 5526Tampa, Florida 33675
(7) Ammonia Terminals on Rivers Data from "1983 Survey ofRefrigerated Amnonla Storage In US & Canada," Plant/Opera-tions Progress (Vol. 3, No. 3 July 1984)
89

TABLE 10SUMMARY OF PIPELINE SPILLS
FROMUSA DEPARTMENT OF TRANSPORTATION
AMMONIA PIPELINE DATA10/68 TO 3/86
Report P/LNo.
1
2345678910111213141516171819202122
2324
25262728
2930313233
Owner
GC*
ArcoArcoGCMapcoGCWilli amsGCGCWilliamsGCMapcoMapcoGCMapcoMapcoMapcoMapcoGCGCMapcoGC
MapcoGC
MapcoMapcoMapcoGC
GCGCGCMapcoGC
Spill Qty. Cause of SpillState
Iowa
Okla.Okla.La.Nebr.La.Okla.Ark.Ind.Minn.IowaMinn.Kan.La.TexasNebr.Kan.TexasMo. ,IowaOkla.La.
IowaIowa
IowaKan.Kan.La.
Ark.Nebr.Ind.Okla.La.
BBL
2
2246875532
2390282925
17252553-
3225567936063425
51093465218503647
10
127922
503190321040
680010
30001000
5
Company
ThreadedFittings
Corrosion--
Pump-
Operations--
CorrosionPump
-----
Valve--
Valve Oper.-
DefectivePipe-
ValvePump Station
Outside
Rupture PipeDamage Pipe
-Damage Pipe-Damage ValveDamage Pipe-
-Rupture PipeDamage PipeDamage PipeRupture PipeRupture Pipe
-Rupture PipeRupture Pipe
-Rupture Pipe
-
Rupture Pipe-
Defective WeldError -Error(Operator)ValvePump Station
-Flange Leak
--
ValvePump Station
-
Damage Pipe-
Damage PipeRupture Pipe
-
Injury
1
000030000001700000000
00
0020
01000
Date
10/85
3/8512/843/842/8410/833/8310/825/8212/8112/8111/817/815/816/808/797/7810/7712/768/765/769/75
9/755/75
10/748/7412/739/71
6/711/711/71
10/705/70
34 Mapco Texas 1000 Rupture Pipe 9/69
*GC = Gulf Central Pipeline
C. Clay Hale W.M. Lichtenberg90