1981 Vedic Chronology & Geological Time Scale
36
THE SA-VIJNANAM PROJECT Working Paper Number 1 VEDIC CHRONOLOGY AND THE GEOLOGICAL TIME SCALE by Richard L. Thompson
Transcript of 1981 Vedic Chronology & Geological Time Scale

THE SA-VIJNANAM PROJECT Working Paper Number 1
VEDIC CHRONOLOGY AND THE GEOLOGICAL TIME SCALE
by Richard L. Thompson
THE SA-VIJNA.NAM PROJECT
Working Paper Number 1.
VEDIC CHRONOLOGY AND
THE GEOLOGICAL TIME SCALE
by
Richard L. Thompson
Published by the Sa-vijfianam Project
51 West Allens Lane, Philadelphia, Pa. 19119

@ 1981 Richard L. Thompson All rights reserved. Printed in U. S. A.

Vedic C hronolo gy and the Geological Time Scale
In this essay we will compare the system of chronology described in the Vedic literatures of India with the chronological system devised by geologists and paleontologists to date the history of life on the earth. Since the time of Charles Lyell in the mid-nineteenth century, geologists have accepted that the history of the earth must be measured in millions or even hundreds of mil-lions of years--a view that contrasts sharply with earlier Christian chronology that set the date of the earth's creation at about 4,004 B. C. At the present time geologists estimate that the earth has existed for some 4.6 billion years, and that highly organized life forms have existed for about 600 million years.
It is not so widely known that the Vedic liter-atures of India, such as the Bhagavad-gHii. and the Srimad-Bhagavatam, also give an account of history that extends over hundreds of millions and even billions of years. The Vedic and geolog-ical systems of chronology have completely dif-ferent origins, but they divide time into broadly similar subdivisions, and thus it is natural to ask whether or not they have anything in common. In this essay we will present some evidence indicat-ing that these two chronological systems can, in fact, be correlated with one another in a very precise way.
We begin in Sections 1 and 2 by giving brief outlines of the Vedic and geological systems of
1

chronology. In Section 3 we describe the correla-tion that can be found between the two systems. This section is presented in the form of a series of questions and answers which are intended to bring out various important points concerning the statistical evaluation of the correlation. Finally, in Section 4 we discuss some possible interpretations of this correlation.
1. Vedic Chronology
Our information concerning Vedic chronology is taken from the Srimad-Bhagavatam( 1) and the Surya-siddhiinta( 2). These literatures maintain that the universe has been existing for some one and a half quadrillion years, and that events have unfolded during this time in accordance with a number of interlocking historical cycles. Of these cycles, the kalpa, or day of Brahma, is the long-est that will concern us. Each kalpa lasts for 4.32 billion solar years and is divided into 14 manvan-tara periods. Each manvantara is divided into 71 divya-yugas of 4.32 million years apiece, and thus each manvantara lasts for 306,720,000 solar years.
Each manvantara is preceded by a transitional period, or sandhyii. of .4 divya-yugas, and the last manvantara in a kalpa is also followed by such a sandhya. We note that 14 x 71 + 15 x .4 = 1, 000, so that the lengths of the 14 manvantaras and 15 sandhyas add up to one kalpa of 4.32 bil-lion years.
Both the manvantaras and the divya-yugas rep-resent patterns of recurrence in the course of universal history. Each manvantara corresponds to the reign of a particular Manu--a kind of demigod who is entrusted with certain important duties in the management of this world as a whole. The end of each manvantara is marked by a period of dev-astation in which many life forms are annihilated and subsequently recreated. This devastation may take the form of a world -wide flood.
2

Each divya-yuga is broken down into four yugas called satya. treta, dvapara, and kali. and the lengths of these periods are respectively 40%, 30%, 20%, and 10% of the total length of a divya-yuga.
According to Vedic chronology, we are now in the seventh manvantara of the current kalpa. This manvantara is named after Vaivasvata, the present Manu. Twenty-seven divya-yugas of this manvan-tara have elapsed(3). According to astronomical calculations based on the Siirya-siddhiinta. we are now in roughly the 5,OOOth year of the kali-yuga of the twenty-eighth divya-yuga.
Manvantara
Vaivasvata
Raivata Tamasa Uttama Svarocil?a Svayambhuva
Starting Date
120.533 428.981 737.429
1045.877 1354.325 1662.779 1971. 221
Table 1. The starting dates of the first seven manvantaras of this kalpa. The dates are in millions of years before the present.
Table 1 lists the starting dates of the first sev-en manvantaras of this kalpa. These dates were calculated using the Vedic chronological data pre-sented in this section, and they are given in mil-lions of years before the present.
2. The Geological Time Scale
In the modern science of geology the history of the earth is divided into two major parts, the Phanerozoic and the Prephanerozoic. The Phanero-zoic is the most recent and well-known of these divisions, and it extends from the present to about
3

600 million years into the past. The Phanerozoic era corresponds to those strata of sedimentary ma-terial on the earth's surface that tend to contain abundant and clearly recognizable fossils. On the basis of these fossils, paleontologists have divided this period of time into numerous subdivisions. They have assigned dates to these subdivisions by a complex process involving radiometric dating and various methods of analyzing and correlating sed-imentary strata.
Table 2 summarizes the subdivisions of the Phanerozoic era. Two systems of dates for these subdivisions are given, both taken from a paper by Harland, Smith, and Wilcock ( 4). The leftmost column of figures gives the geological dates deter-mined by a group of Russian workers, headed by
Division Afanassyef Holmes
C) Pleistocene 2 2 ..... Pliocene 12 7 0 N Miocene 26 12, 18.5, 26 0 c: Oligocene 37 31. 5, 37.5 Cl) , u Eocene 60 45, 49, 53.5 C) Paleocene 67 58.5, 65 ...... 0 { Cretacious 137 100, 136 N 0 Jurassic 195 162, 172, 193 00 Cl) Triassic 240 205, 215, 225
Permian 285 240, 280 C) Carboniferous 350 325, 345 ...... 0 Devonian 410 359, 370, 395 N 0 Silurian 440 435 Q) ....... Ordovician 500 445, 500 C'j
J:l.. Cambrian 570-600 515, 540, 570
Table 2. Two geological time scales for the Phanerozoic era. The dates are in millions of years before the present, and they mark the beginnings of the corresponding geological periods. Multiple entries on a line date finer period subdivisions.
4

Afanassyef, and we will refer to this system of dates as the Afanassyef scale. The figures in the rightmost column are the dates determined by a group of American and European investigators, and we will refer to this system as the Holmes scale.
All dates are given in millions of years before the present. When several dates separated by com-mas are given for a particular subdivision, these correspond to the further breakdown of that sub-division into upper, lower, and sometimes middle periods. (In the Oligocene, figures were available only for the middle and lower periods.) When a range of dates was given in Harland, Smith, and Wilcock for a particular subdivision, we have re-placed the range by a single date representing its midpoint. The two exceptions to this rule are the Pleistocene, where we have specified 2 in place of 1. 5-2, and the Cambrian in the Afanassyef scale, where we have simply specified a range of 570-600.
In contrast to the Phanerozoic era, geologists do not have a very clear picture of the Prephan-erozoic period of the earth's history. There is an assemblage of fossils of what appear to be soft-bodied metazoan organisms, which has been assigned dates of 570 to 720 million years ago. This assem-blage is known as the Ediacara fauna, and it is thought to constitute the oldest clear-cut evidence for the existence of multicellular organisms on the earth(5). In earlier sediments there are structures called stromatolites, which are believed to have been prod uced by the growth of algae, and microscopic structures that have been interpreted as fossils of single-celled algae and bacteria. Apart from this, no other direct evidence for the existence of life in the Prephanerozoic has been found up to the present time.
3. The Correlation between the Vedic and Geological Time Scales
In this section we shall discuss a numerical re-lationship that can be seen to hold between the
5

geological and the Vedic chronological systems. We begin by raising a fundamental question that casts doubt on the very possibility that these two sys-tems could be significantly related:
Question: It seems to me unlikely that the Vedic and the geological accounts of the past could be genuinely related to one another. These two accounts are drastically different in content. According to the Vedas, life has existed in all its variety since time immemorial, and various popUlations of living beings have been repeat-edly manifested and annihilated in accordance with a series of historical cycles. In contrast, the modern geological account of the past is evolutionary. The fossil record reveals a pro-gression of life forms beginning hundreds of millions of years ago with primitive algae and bacteria, and culminating only recently with the appearance of man.
The origins of these two systems are also completely different, for one is based on ancient mythology, and the other is based on scientific observation. How, then, could they be related?
Answer': It is indeed hard to see why mythological stories created in pre-scientific cultures should have anything to do with the findings of modern geology and paleontology. However, we should not assume a priori that the Vedic account of the past is mythical. I propose that we should take a strictly empirical approach and try to see whether or not there really is a significant cor-relation between the Vedic and the geological systems. Since both systems contain numerical data, we can search for a correlation by using standard statistical methods. If we actually do find a significant correlation, we can then con-sider how it may have come about. At that point we can confront the questions you have raised about the dissimilarities between the Vedic and the geological accounts of the past.
6

Question: Very well. But what kind of numerical correlation do you have in mind? I can see no obvious relationship between Tables 1 and 2.
Answer: There is no obvious direct connection between these two lists of figures, but an inter-esting relationship emerges if we shrink the dates in Table 1 by a constant factor. This is done in Table 3.
Question: That's strange. The dates seem to line up!
Answer: How do you explain that? Question: I don't know. But what is this factor of
R = .554479? How did you obtain this number? Answer: R was chosen empirically so as to maxi-
mize the agreement between the scaled down Vedic dates and the geological dates in the table.
Question: Perhaps that explains this alignment of figures. You chose R so as to create an appar-ent agreement, even though no real relationship exists.
Answer: No, the relationship disclosed in Table 3 is a real one. Consider just the first three lines in the table. There we see that 67, 240, and 410 agree very closely with 120.533 x R,
(1) ( 2)
Vaivasvata 120.533xR = 66083 428.981xR = 237.86 737.429xR - 408.89
( 3)
67 240 410
( 4)
Paleocene Triassic Devonian
Caks;us;a Raivata Tumasa 1045. 877xR = 579.92 570-600 Cambrian
Table 3. Comparison between manvantara starting dates and the starting dates of certain key geo-logical periods. In column (2) the starting dates of the manvantaras in column (1) are scaled down by a factor of R = .554479. Column (3) lists the starting dates according to the Afanassyef scale of the geological periods in column (4).
7

428.891 x R, and 737.429 x R. The only variable that we can change at will here is R, and by adjusting this one variable properly we can bring three sets of numbers into close agreement.
In general, it would not be possible to do this. You could pick one line of the table, and bring the numbers on that line into agreement by adjusting R. But there is no reason that the remaining numbers would have to agree. We can compute the probability that three randomly cho-sen positive numbers, (x,y,z), could be aligned as closely with (120.533,428.981,737.429) as the geological dates in the table( 6). This prob-ability turns out to be .000025, or one chance in 40,000.
Question: So you seem to be finding some kind of relationship between these numbers, but what does this relationship mean? What is the signifi-cance of this R factor?
Answer: The most obvious interpretation of the R factor is that it represents a systematic differ-ence in scale between Vedic time and geological time. The direct meaning of R is that there are .554479 geological years per Vedic year. Accord-ing to this interpretation, both the Vedic dates and the geological dates are referring to the same historical events, but they differ in abso-lute magnitude because they are expressed in different scales.
Question: Why should there be such a difference in scale?
Answer: I don't know, but here is one possibility. The geological dates are computed by very com-plex methods involving radiometric dating and the correlation of geological strata. Some system-atic error might throw all the dates off by a fixed factor.
Such an error might be very difficult to de-tect. For example, according to the Vedic liter-atures, the laws of nature do not operate in the same way in each of the four yugas comprising
8

a divya-yuga. In particular, the tendency of p.latter to decay and break down varies cyclical-ly, reaching a low point in each satya-yuga and a high point in each kali-yuga. Now, consider the possibility that the rate of radioactive decay may be lower in the satya, treta, and dvapara yugas than it is in the kali-yuga. This would cause the radiometric dates of past divya-yugas to be reduced by a constant factor.
I mention this idea only to show that your question can be given a reasonable answer. This is one of many possible explanations, and it may not be correct.
Question: You say that both the Venic and the geological dates may be referring to the same historical events. Could you explain what you mean by that?
Answer: Here is some evidence that may suggest an answer to that question. In Table 3 we see that the beginnings of the last fou.r manvantaras correspond to the beginnings of the Paleocene, Triassic, Devonian, and Cambrian periods. Let's consider briefly what the paleontologists have to say about these periods.
(1) The Paleocene. This is the first period in the Cenozoic era, one of the three major sec-tions into which the paleontologists divide their time scale. Since the mammals first became prom-inently represented in the fossil record in the Paleocene, the Cenozoic is known as the "age of mammals." Also, the famous extinction of the dinosaurs took place at the end of the preceding period, the Cretacious. Many theories have been advanced to explain the disappearance of the dinosaurs, but none have proven satisfactory. Here we see that the time when the dinosaurs disappeared coincides closely with the beginning of the Vaivasvata manvantara.
(2) The Triassic. The interval between the end of the Permian and the beginning of the Triassic is also marked by a severe episode of
9

apparent mass extinction. According to the pa-leontologist David Raup, between 88 and 96 per-cent of all marine species became extinct at the end of the Permian period(7). This time of tran-sition has been chosen by geologists as the beginning of another major division of their scale--namely, the Mesozoic era.
(3) The Devonian. This is an important sub-division of the Paleozoic era, the earliest of the three main divisions of the geological time scale. It is interesting to note that continental strata are almost entirely absent from the fossil record prior to the late Silurian period, the period im-mediately preceding the Devonian. Thus the record of life on the land seems to begin with the Devonian and the very late Silurian periods.
(4) The Cambrian. This is the fourth geo-logical period listed in Table 3. It is perhaps significant that when R is chosen so as to line up the first three pairs of dates, the starting date of Tamasa manvantara automatically lines up within the time interval specified for the begin-ning' of the Cambrian in the Afanassyef scale. The beginning of the Cambrian is marked by the first appearance in the fossil record of several phyla of marine invertebrates. These include the arthropoda and other highly developed animals possessing calcareous shells or skeletons. This relatively sudden appearance of highly complex life forms has seemed enigmatic to many paleon-tologists, since no fossil remains of an even remotely comparable nature have ever been found in Precambrian strata. Indeed, the beginning of the Cambrian is a point of transition between later sedimentary strata containing abundant fos-sil remains, and earlier strata which are almost completely devoid of fossils.
It is interesting that the starting dates of the last four manvantaras line up with these impor-tant geological dates after being scaled down by the R factor. to the Vedic literatures,
10

the intervals between the manvantaras are major periods of transition, and they are often punc-tuated by episodes of pr' alaya, or devastation. Is it coincidental that Table 3 associates periods of transition and upheaval in the Vedic historical account with similar periods in the geological account?
Question: Perhaps not, but I have my doubts. First of all, was your choice of geological dates in Table 3 really dictated by hard evidence? Might it not be that by using a different R value, you could show a correlation between the man-vantaras and some other sequence of geological dates?
Answer: That possibility was checked by means of a computer. The computer was programmed to evaluate the correlation between the manvantara dates and each possible sequence of four dates from the Afanassyef scale. The sequence of dates in Table 3 shows by far the best corre-lation, and all the other sequences showing a reasonably good correlation are very close to this sequence(8).
At this point I would like to describe some additional evidence that supports the hypothesis that there is a correlation between manvantaras and major geological periods. If the correlation we have seen is not just a nuke, we might also expect to find a correlation between the divya-yugas and the system of geological dates.
Question: It would certainly strengthen your case if there were such a correlation.
Answer: Consider the time line in Figure 1. The numbers in the column on the left represent the starting dates of past divya-yugas in millions of years before the present. (We can call these dates divya-yug'a boundaries.) Recall that a divya-yug'a lasts for 4.32 million years. We are 5,000 years into the kali-yuga of the current divya-yuga, and thus 3. 893 million years of this divya-yuga have elapsed. This gives us the
11

first date in the lefthand column. The remammg dates were computed by repeatedly adding 4.32 to 3.893.
Now, the question is: Do the dates in the Afanassyef scale correspond to some of these divya-yuga boundaries? To answer this we simply convert the geological dates into Vedic years by dividing them by the same scale factor that we
Divya-yuga Boundaries
o. 3.893
8.213
12.533
16.853
21.173
25.493
29.813
34.133
38.453
42.773
47.093
51. 413
Geological Periods
3.607 Pleistocene (Displacement = - 6.6%)
21.642 Pliocene (Displacement = 10.9%)
46.891 Miocene (Displacement = -4.7%)
Figure 1. The alignment of divya-yuga boundaries with the starting dates of geological periods. All dates are in millions of years before the present.
12

used before, namely R = .554479. The resulting numbers for the first three divisions of the Afanassyef scale are plotted on the time line in the column on the right.
Que s tio n : That's interesting. T hey do seem to line up with divya-yuga starting dates.
Answer: Yes. N ext to each geological date is the percentage of one divya-yuga by which it misses the nearest divya-yuga boundary. For example, for the Pleistocene this percentage is given by 100 x (3.607 - 3.893) / 4.32, and this is about -6.6%. Similarly, the Pliocene misses the nearest divya-yuga boundary by a percentage of 100 x (21.642 - 21.173)/4.32, or 10.9% of a divya-yuga.
Question: Why are some of these percentages neg-ative?
Answer: The percentage is negative if the geologi-cal date falls below the nearest divya-yuga bound-ary, and otherwise it is positive (or zero.) The midpoint of each divya-yuga is a kind of cross-over point, since it lies at a displacement of -50% from the divya-yuga boundary above it, and at a displacement of +50% from the boundary be-low it.
Table 4 lists the percentages of displacement for the first nine dates in the Afanassyef scale. Note that these percentages tend to be small. If the geological dates had no relationship with the divya-yuga boundaries, then we would expect these percentages to fall at random between -50% and +50%. As it is, they tend to cluster around zero.
Question: I see that two percentages are quite large, however. The Oligocene and the Triassic seem to miss by a large margin.
Answer: That is true. The correlation is only statistical. Due to inevitable errors in the dating process, we could not expect to find an exact alignment between geological dates and divya-yugas.
13
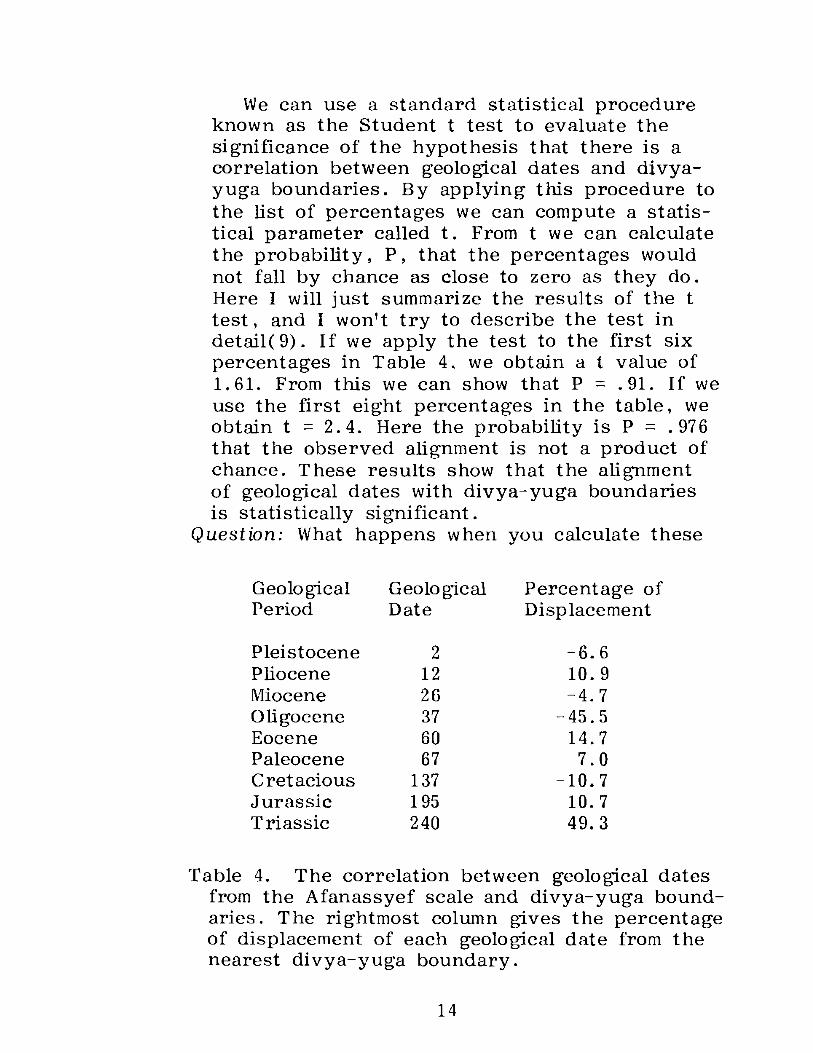
We can use a standard statistical procedure known as the Student t test to evaluate the significance of the hypothesis that there is a correlation between geological dates and divya-yuga boundaries. By applying this procedure to the list of percentages we can compute a statis-tical parameter called t. From t we can calculate the probability, P, that the percentages would not fall by chance as close to zero as they do. Here I will just summarize the results of the t test, and I won't try to describe the test in detail( 9). If we apply the test to the first six percentages in Table 4, we obtain a t value of 1.61. From this we can show that P = .91. If we use the first eight percentages in the table, we obtain t = 2.4. Here the probability is P = .976 that the observed alignment is not a product of chance. These results show that the alignment of geological dates with divya-yuga boundaries is statistically significant.
Question: What happens when you calculate these
Geological Geological Percentage of Period Date Displacement
Pleistocene 2 -6.6 Pliocene 12 10.9 Miocene 26 -4.7 Oligocene 37 -45.5 Eocene 60 14.7 Paleocene 67 7.0 Cretacious 137 -10.7 Jurassic 195 10.7 Triassic 240 49.3
Table 4. The correlation between geological dates from the Afanassyef scale and divya-yuga bound-aries. The rightmost column gives the percentage of displacement of each geological date from the nearest divya-yuga boundary.
14

percentages for the periods preceding the Triassic?
Answer: We find that there is no significant cor-relation between divya-yuga boundaries and geo-logical dates preceding the Triassic period. How-ever, this is not surprising, for we would expect there to be larger random errors in the earlier dates than in the more recent ones.
Question: Here is another question. I notice that in Figure 1 there are many more divya-yuga bound-aries than geological period boundaries. Wouldn't you expect these other divya-yuga boundaries to also correspond to observable features of the geological record?
Answer: T hat is an interesting question, and a partial answer is provided by the Holmes scale, the other geological time scale listed in Table 2. The Holmes scale assigns dates to a larger number of geological subdivisions than does the Afana-ssyef scale, and it turns out that many of these additional dates also line up with divya-yuga boundaries.
Perhaps at this point it would be a good idea for us to systematically survey the evidence pro-vided by the Holmes scale.
Question: Go ahead. Answer: First let's consider the correlation that we
have seen between the manvantaras and the major subdivisions of the geological time scale. The Holmes scale also reveals such a correlation, and this is shown in Table 5. For the first three lines of this table, the alignment of dates is not as close as the corresponding alignment in Table 3. However, the Holmes scale gives a specific date for the beginning of the Cambrian (rather than the broad range of dates given in the Afanassyef scale), and this date agrees closely with the scaled-down date for the T amasa man-vantara.
In general, the Holmes scale reveals somewhat rougher correlations than the Afanassyef scale.
15

But as we shall see, since the Holmes scale con-tains more data, it provides even stronger evi-dence for a correlation between the Vedic and geological chronologies than does the Afanassyef scale.
Question: I notice that you used a smaller R factor here than you used before. Why is that?
Answer: If you examine the two scales in Table 2, you will see that the dates in the Holmes scale are systematically smaller than the dates in the Afanassyef scale. For this reason we have to use a smaller R factor.
Question: Do you also find a correlation between divya-yugas and geological dates in the Holmes scale?
Answer: Yes, and this provides a partial answer to the question you asked earlier. The Holmes scale includes dates for upper, middle, and low-er subdivisions of many geological periods. If we examine these dates we find that in the Cenozoic era they correlate very closely with divya-yuga boundaries. This correlation deteriorates rapidly as we go beyond the Cenozoic, but this is not surprIsmg, since we expect older dates to be affected by larger random errors.
(1) (2) ( 3) ( 4)
Vaivasvata 120. 533xR = 65.4 65 Paleocene 428. 981xR = 232.7 225 Triassic
Raivata 737. 429xR ::: 400.0 395 Devonian Tamasa 1045. 877xR = 567.4 570 Cambrian
Table 5. Comparison between manvantara starting dates and the starting dates of certain key geo-logical periods. In column (2) the starting dates of the manvantaras in column (1) are scaled down by a factor of R = .54249. Column (3) lists the starting dates according to the Holmes scale of the geological periods in column (4).
16

Table 6 lists the percentages of displacement 'from divya-yuga boundaries for the dates from the Holmes scale. These percentages were com-puted in the same way as the corresponding percentages in Table 4. The geological dates were converted into Vedic years by dividing them by R = .54249, and the resulting numbers were compared with divya-yuga boundaries.
Question: I notice that there are some large per-centages there, such as -46% and 30%.
Answer: Yes. T he correlation is statistical, as before. Figure 2 shows graphically how the per-centages in Table 6 are distributed. If the geo-logical dates had nothing to do with the divya-yuga boundaries, we would expect them to miss these boundaries by percentages falling randomly between -50% and +50%. In that case we would expect to find the triangles in Figure 2 scattered evenly throughout this range. But you can see
Geological Geological Percentage of Period Date Displacement
Pleistocene 2 - 4.8 Pliocene 7 8.6 Upper Miocene 12 22.0 Middle Miocene 18.5 -.7 Lower Miocene 26 19.3 Middle Oligocene 31. 5 -46.0 Lower Oligocene 37.5 10.0 Upper Eocene 45 30.0 Middle Eocene 49 .7 Lower Eocene 53.5 -7.3 Upper Paleocene 58.5 6.1 Lower Paleocene 65 -16.6
Table 6. The correlation between geological dates from the Holmes scale and divya-yuga boundaries. The rightmost column gives the percentage of displacement of each geological date from the nearest divya-yuga boundary.
17

in the figure that the percentages of displace-ment are actually clustered closely about zero.
For this distribution of dates the Student t value is 2.762. This value of t corresponds to a significance level of P = .99, indicating that there is a 99% chance that the correlation between geo-logical dates and divya-yuga boundaries would be worse if the geological dates were chosen randomly.
I note, by the way, that the percentage of - 46% corresponds to the middle Oligocene. Oddly enough, the Oligocene in the Afanassyef scale also falls in the center of a divya-yuga (as you can see in Table 4.)
Question: So, it seems that the geological dates do tend to line up with divya-yuga boundaries. Now, what can you say about the Precambrian era? Do you find any correlation between Vedic dates and Precam brian dates?
Answer: The fossil record in the Precambrian is very scanty, and there are very few solidly
-50 -40 -30 -20 -10 o 10 20 30 40 50
Figure 2. The distribution of percentages of dis-placement from divya-yuga boundaries for the Cenozoic dates in the Holmes scale. Each triangle marks a percentage from Table 6. The bar graph plots the number of percentages falling in each interval of 10%.
18

established Precambrian dates to use for compar-ison. T here are a couple of rough correspon-dences that I could point to, but I don't attach very much significance to them (10).
Question: What about the geologists' estimate of 4.6 billion years for the age of the earth? Doesn't the Vedic chronology extend over a much longer period?
Answer: It does. According to the Vedic account, the world passes through repeated days and nights of Brahma, each of which lasts for 4.32 billion years. Some 1. 97 billion years of the cur-rent day of Brahma have elapsed, and thus the last day of Brahma ended about 6.29 billion years ago. At this time there occurred a period of fiery devast.ation which was followed by universal flooding(11) .
Now, if we multiply 6.29 by our R factors (of.54249 or .554479), we obtain dates of 3.4 or 3.5 billion years. It is interesting to note that the oldest known sedimentary rocks in the earth's crust have been assigned an age of about 3.8 billion years. And one geologist has argued that the earth went through a period of crustal melt-ing at that time(12).
Question: Ah, well! Let's go back to another ques-tion that I had about Tables 4 and 6. What hap-pens to the percentages of displacement if you vary R? It wouldn't look very good if your cor-relations showed up for a wide range of R values.
Answer: It turns out that the correlation between divya-yugas and geological periods is very sen-sitive to the R factor. If we increase or decrease R by a small amount, the correlation quickly de-teriorates.
This is shown for the Holmes scale by graph (1) in Figure 3. In this graph, the x-axis is labeled with R values ranging from . 48 to . 62. For many closely spaced values of R in this range, the percentages of displacement were cal-culated for the Cenozoic dates in the Holmes
19

3.
1.
,54 .54
R -
Figure 3. Two measures of correlation between the Vedic and geological time scales, plotted as func-tions of R. Curve (1) is a graph of Student t value for the correlation between divya-yugas and subdivisions of the Cenozoic. Curve (2) is a graph of the root mean square difference betwccn manvantara lengths and the lengths of the cor-responding geological time intervals.
20

scale. The Student t value was then calculated for each set of percentages. (A computer was used to perform these calculations.) Graph (1) plots the Student t value calculated for each R.
Note that this graph reaches a sharply de-fined maximum at R = .54249. As I have pointed out, the significance of the correlation for this R value is P = .99.
Graph (2) in Figure 3 shows how the correla-tion between manvantaras and major geological periods depends on R. This graph plots a "root mean square" estimate of the difference between the geological dates in Table 5 and the corre-sponding scaled-down manvantara dates(13). The graph shows, in essence, how closely the geo-logical dates agree with the manvantara dates, once the latter have been scaled down by R. The lowest point on graph (2) is the point of closest agreement.
Question: That is interesting. The low point of graph (2) almost exactly matches the high point of graph (1).
Answer: Yes. The R value for the best correlation between divya-yugas and Cenozoic periods is nearly the same as the R value for the best cor-relation between manvantaras and major geologi-cal subdivisions. Both correlations are quite pronounced if R is set equal to .54249, but they deteriorate rapidly if R is shifted very far away from this value.
4. Discussion
We are confronted here with direct evidence for a natural correspondence between the Vedic and the geological systems of chronology. If we carry out a change of temporal scale of about .54 geological years per Vedic year, we find that key dates in the Vedic chronological system tend to line up in a statistically significant way with key dates in t he geological time scale. How do
21

you think we can account for this correspondence? Question: I must admit that I don't know how to
explain these correlations. If the Vedic chronol-ogy is mythological--as most scholars would assume--then surely we would not expect it to correlate with the chronology devised by the geologists. We would expect any apparent cor-relation to be a mere coincidence,
Answer'; It is possible for a relatively probable juxtaposition of events to seem highly improbable. and thus convey the illusion that there is a causal relationship. even though no such rela-tions hip exists. Yet. given the hypothesis that there is no causal connection between the Vedic and geological chronologies, statistical analysis shows that the correlation we have been exam-ining really is highly improbable.
I suggest that we should consider the possi-bility that such a connection may exist. Perhaps the simplest way to explain the correlation is to suppose that both chronologies refer to actual events that have occurred in the past. As I mentioned before, the change in temporal scale might be due to some systematic error in the geological dating. This hypothesis should not. of course, be regarded as a firm conclusion, Rather, it is a tentative suggestion that may provide inspiration for further research.
Question: Your hypothesis is conceivable. But if it is true, then how can you account for the appar-ently evolutionary character of the geological record? The Vedic description of the origin and history of the world is not at all evolutionary. You seem to be finding a correlation between two completely incompatible accounts of the past.
Answer'; There are a number of reasons for sup-posing that the fossil record should be given a nonevolutionary interpretation. One of these is that the existing theory of evolution has funda-mental deficiencies that cannot be remedied by superficial modifications in our scientific world
22

view. Since this subject entails many involved considerations, we cannot do justice to it here, but I will make a few brief observations.
Any theory of evolution that is consistent with modern science must rest ultimately on the funda-mental principles of physics. But if we carefully analyze our conceptions of chance and physical causation, we can see that the laws of nature as we presently understand them cannot account for the origin of either lower or higher living organ-isms. Indeed, no set of simple mechanistic laws can do so. A system of mechanistic laws can ac-count for the origin of life only if these laws are so complex that they contain built-in specifications for larg'e numbers of complex biological forms(14).
Now, if we carefully examine the implications of this conclusion, we can see that it completely rules out the possibility of devising an adequate mechanistic explanation of life. Either we must abandon the very idea of explaining the origin of life, or we must consider explanations in which nonmechanistic elements playa significant role. I'm afraid, though, that any fully developed nonmechanistic explanation would seem fantastic from the viewpoint of modern science. Such a theory would necessarily entail features which are so strongly at variance with the familiar con-ceptions of modern scientific thought that they might well seem "mythological." We should not, therefore, reject the possibility that so-called mythological stories may contain important factual information about the nature of the world and the process of creation.
Question: Let's grant that an adequate explanation of the origin of life may have to be fundamental-ly different from anything that scientists have contemplated thus far. Still, the fossil record reveals a gradual evolutionary progression from primitive to advanced life forms. Wouldn't any new theory, however radical it might be, have to entail such a progression?
23

Answer: Many observers, beginning with Darwin himself, have remarked that the fossil record does not provide strong evidence for the evolu-tionary transformation of species. The central idea of the theory of evolution is that organisms undergo slight modifications from generation to generation, and in this way one species gradu-ally gives rise to another. The fossil record, however, gives practically no evidence of such gradual transformations. Species generally appear abruptly in the fossil record; they retain the same form throughout the period of their exist-ence; and then, in some cases, they abruptly disappear. Recently, the paleontologists Niles Eldridge and Stephen J. Gould have claimed that this pattern of abrupt appearance and disappear-ance holds for nearly all fossil species(15). They have made this claim the central tenet of their theory of "punctuated equilibrium," and their views have been accepted by many prominent paleontologists.
Question: Yet these paleontologists are still evolu-tionists. And, indeed, how could they be other-wise? The fossil record may not show the inter-mediate forms linking one species to another, but it does show an overall progression from lower forms to higher forms. You yourself gave a de-scription of this progression in your discussion of 'the Cambrian, Devonian. Triassic. and Paleo-cene periods. The most remarkable feature of your discussion is that you were correlating this apparently evolutionary sequence with the non-evolutionary sequence of the manvantaras.
Answer: It does seem remarkable that there could be such a correlation. But we can make two ob-servations that may make this seem more plaus-ible.
The first observation is that the fossil record appears to be giving us a very incomplete and biased record of the past. Consider, for example, the fact that only marine deposits have been
24

found in the strata that antedate the late Silurian period. One interpretation of this is that there was no life on the land prior to this time, and that evolution first began to produce land-dwell-ing life forms in the late Silurian and early De-vonian. However, there is evidence that calls for a different interpretation. Spores and fragments of wood from land plants have been found in deposits corresponding to the Cambrian period(16). This implies that there must have been life on the land at that time, even though no complete fos-sils of land dwelling plants and animals have been found. It appears that important segments of the earth's history have left few, if any, direct traces in the geological record.
Question: But, according to the Vedic literatures, human civilization has existed on the earth for hundreds of millions of years. How could the fos-sil record be so incomplete as to leave out any trace of this? Why is it that there is no evidence indicating the existence of human civilization prior to a few thousand years ago?
Answer: Actually there is such evidence, but you will not find any accounts of it in standard sci-entific textbooks and journals. If you turn to various scientifically disreputable sources, how-ever, you can find many reports of artifacts and other traces of human activity that have been found in strata corresponding to early geological peri-ods(17). (It is interesting to note that journals such as Nature and Scientific American used to report such discoveries in the nineteenth century, but they do not report them today(18).)
This brings us to the second point that I wanted to make. Since scientists have been ac-customed to viewing the fossil record from a particular perspective--namely, the perspective of Darwinian evolution--they have tended to ig-nore or misinterpret much of the evidence that the fossil record contains. T he main reason for this is that scientists generally work within the
25

social milieu of the scientific community as a whole, and they therefore have very little oppor-tunity to develop ideas that are strongly at var-iance with the accepted views of that community. Yet many important discoveries have been made by those who were willing to seriously consider such ideas. I would like to suggest that further investigation of the fossil record, conducted from a radically nonevolutionary viewpoint, may reveal hitherto unrecognized patterns in the accepted geological evidence, and also enable us to mean-ingfully interpret much evidence that has been ignored or suppressed because of its incompati-bility with prevailing scientific conceptions.
The correlation we have observed between the geological and Vedic time scales provides one example of this. A person whose thinking was limited to the current evolutionary world view would not be likely to even consider searching for a possible connection between the Vedic and the geological chronologies, and so he would not be likely to discover the correlation that we have been discussing. It may be that many similar patterns lie hidden in the welter of geological evidence. These patterns may be found if we are willing to approach the evidence with an open mind and consider the possibility that the his-tory of the earth may have many features which would appear fantastic or impossible from the viewpoint of current evolutionary theory.
Notes
1. A. C. Bhaktivedanta Swami Prabhupada, Srlmad -Bhdgavatam of Vyasa. Sanskrit text, translation, and commentary. Los Angeles: Bhaktivedanta Book Trust, 1977, Canto 3, Chapter 11.
2. Fitzedward Hall and Bapu Deva Sastrin, Siirya-siddhanta. Translation. Calcutta, 1859, pp. 3-4.
26

3. Another reference for this information is: Kri?t:ladasa Kaviraja Gosvaml, SrI Caitanya-caritdmrta. Bengali text, translation, and com-mentary by A. C. Bhaktivedanta Swami Prabhupada. Los Angeles: Bhaktivedanta Book Trust, 1974, Adi-lilii, Vol. 1, p. 170.
4. W. B. Harland, A. G. Smith, and B. Wilcock, "The Phanerozoic Time Scale," a supplement to The Quarterly Journal of the Geological Society of London, Vol. 120s, 1964.
5. M. F. Glaessner, "Biological Events and the Precambrian Time Scale," in Adventures in Earth History. Edited by P. Cloud. San Fran-cisco: W. H. Freeman and Co., 1970, pp. 470- 477 .
6. To calculate this probability, we must specify more carefully what we mean by the statement that x, y, and z are chosen randomly. One simple way of doing this is as follows: The numbers x, y, and z represent the boundaries of geological periods. Let us suppose that the lengths, x, y-x, and z-y, of these periods are independently chosen at random in the interval between 0 and a fixed number, L. Let y = (120.533, 308. 448, 308. 448), and define X = (x, y-x, z-y). Here, the components of the vector Yare the lengths of the Vaivasvata,
and Raivata manvantara periods, as given in Table 1. If we assign to x, y, and z the values 67, 240, and 410 of Table 3, then the angle between the vectors X and Y is about . 48 degrees.
Now. what is the probability that if X were chosen at random, this angle would be as small as .5 degrees? Well, we have assumed that X is to be chosen at random in a cube of side L. The set of vectors lying within .5 degrees of Y forms a narrow cone. The probability that a randomly chosen X will fall in this cone is equal
27

to the volume of the part of the cone lying within the cube, divided by the volume of the cube. This is one measure of the probability that the geological periods in Table 3--if cho-sen at random--would line up as closely as they do with the last three manvantara periods. It turns out to be approximately .000025.
7. David Raup, "Size of the Permo-Triassic Bottle-neck and Its Evolutionary Implications." Science, Vol. 206. 12 October, 1979, pp. 217-218.
8. Here is a brief description of this investigation. The following list of possible Phanerozoic dates was stored in the computer's memory: 2, 12, 26, 37, 60, 137, 195,240, 285, 350, 410,440, 500, 570, 580, 590, 600. These are from the Afanassyef scale, and the last four dates rep-resent the range of 570-600 stipulated in this scale for the beginning of the Cambrian period. The computer was programmed to systematically select every possible group of four successive
Xl X 2 X3 X4 Angle (in degrees)
67 240 410 580 .46519 . 67 240 410 590 1. 35999 67 240 410 570 1. 87135 60 240 410 590 2.08028 60 240 410 590 2.20772
Table 7. Dates from the Afanassyef scale that correlate with manvantara boundaries. The angle measures the amount of correlation be-tween the geological dates, Xl, X2, X3, and X4' and the starting dates of the last four manvantaras.
28

dates, Xl' X2' X3' and X4, from this list, and compute a vector of interval lengths, (Xl' X2- X1' X3- X2. X4- X3)' The angle be-tween this vector and the vector of manvantara lengths. (120.533. 308.448, 308.448, 308.448), is a measure of how closely the interval bound-aries, Xl, X2, X3, and X4, correspond to a constant multiple of the boundaries of the manvantara periods. An angle of zero would indicate an exact proportionality, and a small angle would indicate a near proportionality.
The computer program calculated this angle for each of the 3,060 possible groups of four successive dates. T he group of dates yielding the smallest angle was 67, 240, 410, and 580, and the angle for this group was about .47 degrees. Table 7 lists the groups of dates cor-responding to the five smallest angles. We can see that this program has automatically picked out the Paleocene, Triassic, Devonian, and Cambrian periods.
9. The Student t test is described in F. Mills, Statistical Methods. 3d ed. New York: Henry Holt and Co., 1955. To apply this test, let m be the average absolute value of the first n percentages in Table 4, and let s be the stan-dard deviation of these absolute values about the mean, m. Then the quantity t used in the Student t test is defined to be
t = 25 - m 1 s/(n - 1)2
If the first n percentages of deviation were chosen randomly in the interval between plus or minus 50 percent, then the quantity t would be expected to vary according to a certain well-known probability distribution. Using this dis-tribution we can compute the probability P that the mean absolute value of n randomly chosen percentages of deviation will be greater than m.
29

10. There is a rough correlation between the start-ing date of the Ediacara fauna (720) and the beginning of Uttama manvantara (1345.325 x .54249 = 734.71).
11. A.C. Bhaktivedanta Swami Prabhupada, Srimad-Bhiigavatam. Canto 3, Chapter 11, pp. 108-110.
12. Preston Cloud, \I Atmospheric and Hydrospheric Evolution on the Primitive Earth," in Adven-tures in Earth History, pp. 446-457.
13. Graph (2) in Figure 3 is a plot of
D = H(65 - 120.528 x R)2 + 2 (160 - 308.448 x R) +
(170 - 308.448 x R)2 + (175 - 308.448 x R)2J"!
The numbers 65, 160, 170, and 175 are the lengths of the intervals between the geological dates in Table 5. In this formula they are com-pared with the scaled-down lengths of the cor-responding manvantara periods.
14. This is discussed in: Richard Thompson, Mechanistic and Nonmechanistic Science. New York: Bala Publications, 1981, Chapters 5 and 6.
15. Stephen J. Gould and Niles Eldridge, "Punc-tuated Equilibrium: The Tempo and Mode of Evolution Reconsidered." Paleobiology. Vol. 3, 1977, pp. 115-151.
16. Daniel I. Axelrod, "Evolution of the Psilophyte Paleoflora," Evolution. Vol. 13. June, 1959, pp. 267-275.
30

17. See, for example, the CY'eation Research Society Quarterly, the INFO Journal, and books such as William Corliss, Ancient Man. Glen Arm, Md.: The Sourcebook Project, 1978.
18. See, for example, Scientific American, 7: 298, 1852.
About the Sa-vijPiiinam Project. In the Bhagavad-gita (7. 2) states
jfianam te 'ham Sa-VI]nanam idam vak?yamy asef?ata1').
yaj jniitva neha bhuyo 'nyaj jriatavyam avasi$yate
"I shall now declare unto you in full this know-ledge both phenomenal and noumenal, by knowing which there shall remain nothing further to be known." In the philosophy of the Bhagavad-glta, knowledge of material phenomena is regarded as being completely compatible with realized know-ledge of higher spiritual categories. There, both types of knowledge are regarded as "scientific," for both are presented within a comprehensive and consistent theoretical framework, and both are accompanied by practical procedures that en-able expert investigators to realize them through actual experience.
Such a harmony between material and spiritual forms of knowledge has been singularly lacking in the modern world. The world view of modern science contains no spiritual categories, and it provides no basis for understanding the ultimate purpose and meaning of life. Spiritual knowledge has been provided in the past by traditional reli-gious systems. But since the picture of the mate-rial world presented in these systems clashes
31

sharply with the world view of modern science, their credibility has been greatly eroded. As a result, many people find themselves in a painful situation: It seems that they can acquire rational knowledge only at the price of being cast adrift on a trackless sea of fundamental meaninglessness.
The aim of the Sa-vij:fianam Project is to restore the lost unity between spiritual and material know-ledge. This cannot be done by reinterpreting re-ligion so as to force it within the confines of the scientific world view, for the very essence of the conflict between science and religion is that this world view is too narrow to accommodate adequate spiritual conceptions. The thesis of the Sa-vijiianam Project is that we can resolve the incompatibility between science and religion only by radically revising our present scientific theories and reinter-preting, from a genuinely spiritual perspective, the evidence on which they are based.
The specific objective of the Sa-vijnanam Project is to reevaluate current scientific theories about the nature and origin of life in light of the spir-itual and material information presented in the Bhagavad-glta, the Bhagavata Pural').a. and other texts from the Vedic tradition of India. * This re-evaluation should be carried out honestly, in ac-cordance with reason and proper methods for handling empirical evidence. It will entail critical analyses of current theories, as well as synthetic works in which Vedic knowledge is used as the basis for new interpretations of scientific evidence.
Such a project can be executed without jeop-ardizing the valid accomplishments of modern science, for true scientific inquiry always thrives on the challenges provided by new points of view.
* Although many scholars use the term "Vedic" to refer only to the l:J.g Veda, we shall use it as a convenient term to refer to a variety of Sanskrit texts. including the Vedas. the Pural').as, and the Itihasas.
32

Also, if it is approached properly, the project will do more than simply provide support for what may seem to be a sectarian religious point of view. The thesis of the Sa-vijnanam Project is that many systems of religion contain valid knowledge about aspects of reality that are either imperfectly de-scribed by modern science, or not touched upon at all. By examining the modern scientific world view from the perspective of the Bhagavad-gHli and other Vedic texts, it should be possible to provide a framework for a system of spiritual and material knowledge that is both consistent and universal.
About the Author. Dr. Richard L. Thompson was born in Binghamton, New York, in 1947. He re-ceived his B. S. in mathematics from S. U . N . Y. at Binghamton and his M. A. in mathematics from Syracuse University. In 1974 he received his Ph.D. in mathematics from Cornell University, where he specialized in probability theory and statistical mechanics. Dr. Thompson has worked for General Aniline and Film Corporation and for Computer Science Corporation as a mathematician and com-puter programmer. He has taught computer pro-gramming and done research in mathematical bio-logy at S. U. N. Y., Binghamton. Dr. Thompson is the author of numerous articles and one book, entitled Mechanistic and Nonmechanistic Science. He is a member of the American Mathematical Society.
33