197CON3188 2018 Annual Report V2 - Event Hospitality and ...€¦ · 3 EVENT Hospitality &...
95
Annual Report 2018 EVENT HOSPITALITY & ENTERTAINMENT LIMITED ABN 51 000 005 103
Transcript of 197CON3188 2018 Annual Report V2 - Event Hospitality and ...€¦ · 3 EVENT Hospitality &...

AnnualReport
2018
EVENT HOSPITALITY & ENTERTAINMENT LIMITED
A B N 51 0 0 0 0 0 5 1 0 3

E V E N T H O S P I T A L I T Y & E N T E R T A I N M E N T L I M I T E D A B N 5 1 0 0 0 0 0 5 1 0 3
2 0 1 8 A N N U A L R E P O R T
C O N T E N T S
1 EVENT Hospitality & Entertainment Limited – 2018 Annual Report
Section Page
Directors’ Report 2
Message from the Chairman regarding the Remuneration Report 16
Directors’ Report: Remuneration Report – Audited 17
Lead Auditor’s Independence Declaration 30
Statement of Financial Position 31
Income Statement 32
Statement of Comprehensive Income 33
Statement of Changes in Equity 34
Statement of Cash Flows 35
Notes to the Financial Statements
Section 1 – Basis of preparation
1.1 – Reporting entity 36
1.2 – Basis of preparation 36
1.3 – Foreign currency 37
1.4 – New standards and interpretations not yet adopted 37
Section 2 – Performance for the year
2.1 – Revenue 39
2.2 – Segment reporting 40
2.3 – Individually significant items 45
2.4 – Taxation 45
2.5 – Earnings per share 48
Section 3 – Operating assets and liabilities
3.1 – Trade and other receivables 49
3.2 – Inventories 50
3.3 – Property, plant and equipment 50
3.4 – Investment properties 54
3.5 – Goodwill and other intangible assets 55
3.6 – Trade and other payables 57
3.7 – Provisions 57
3.8 – Other liabilities 58
Section 4 – Capital structure and financing
4.1 – Share capital 59
4.2 – Dividends 60
4.3 – Reserves 61
4.4 – Loans, borrowings and financing arrangements 62
4.5 – Financial risk management 63
Section 5 – Group composition
5.1 – Business combinations 68
5.2 – Subsidiaries 70
5.3 – Interests in other entities 73
Section 6 – Employee benefits and related party transactions
6.1 – Share-based payments 76
6.2 – Director and executive disclosures 79
6.3 – Related parties 80
Section 7 – Other information
7.1 – Commitments and leases 81
7.2 – Contingent liabilities 82
7.3 – Reconciliation of profit for the year to net cash provided by operating activities 82
7.4 – Auditors’ remuneration 83
7.5 – Parent entity disclosures 83
7.6 – Events subsequent to reporting date 84
7.7 – Deed of Cross Guarantee 85
Directors’ Declaration 87
Independent Auditor’s Report 88
Shareholder Information 92
Other Information 94

D I R E C T O R S ’ R E P O R T
2 EVENT Hospitality & Entertainment Limited – 2018 Annual Report
The directors present their report together with the financial report of EVENT Hospitality & Entertainment Limited, being the
Company and its controlled entities (“Group”), for the year ended 30 June 2018 and the auditor’s report thereon.
DIRECTORS
The directors of the Company in office at any time during or since the end of the year are:
AG Rydge (Chairman)
Director since 1978
KG Chapman
Director since 2010
PR Coates
Director since 2009
VA Davies
Director since 2011
DC Grant
Director since 2013
JM Hastings (Managing Director)
Appointed 1 July 2017
PM Mann
Director since 2013
RG Newton
Director since 2008.
Directors’ qualifications, experience and independent status
Alan Rydge
Non-executive Chairman, Board member since 1978, Chairman of the Board since 1980. Member of the Audit and Risk
Committee and Member of the Nomination and Remuneration Committee.
Experience
A company director with 40-plus years experience in the film, hospitality, leisure and tourism industries. Joined the Greater
Union group in 1971 and was formerly the Group Managing Director.
Directorships
Mr Rydge is also a director of the listed company, Carlton Investments Limited (appointed 1980, chairman since 1980). In
addition, Mr Rydge is chairman of Alphoeb Pty Limited and Enbeear Pty Limited.
Kenneth Chapman MB BS, FAICD, FAIM, AFRACMA
Independent non-executive director and Board member since 2010.
Experience
A company director with 20-plus years senior executive experience in the tourism and real estate sectors. Currently, chief
executive officer of Skyrail-ITM and executive director of the Chapman group of companies.
Directorships
Positions held by Mr Chapman during the last three years include:
• director of Aquis Entertainment Limited (appointed 14 August 2015, resigned 3 November 2016);
• chairman of Skyrail Pty Ltd trading as Skyrail Rainforest Cableway;
• chairman of Far North Queensland Hospital Foundation;
• chairman of Skyrail Rainforest Foundation Limited; and
• director of various entities associated with the privately held Chapman group of companies.

D I R E C T O R S ’ R E P O R T
3 EVENT Hospitality & Entertainment Limited – 2018 Annual Report
Directors’ qualifications, experience and independent status (continued)
Peter Coates AO, BSc (Mining Engineering), FAICD, FAusIMM
Independent non-executive director and Board member since 2009. Mr Coates served as a member of the Audit and Risk
Committee and as a member and Chairman of the Nomination and Remuneration Committee until 2015. Mr Coates is the
lead independent director.
Experience
A company director with more than 50 years of resource industry experience including as CEO of Xstrata and Glencore’s
global coal businesses until his retirement in December 2007. Mr Coates was a past non-executive chairman of Santos
Limited, Sphere Minerals Limited and Minara Resources Ltd, and a past chairman of the Minerals Council of Australia, NSW
Minerals Council and Australian Coal Association. He was made an Officer of the Order of Australia in 2009 and awarded the
Australasian Institute of Mining and Metallurgy Medal in 2011.
Directorships
Positions held by Mr Coates during the last three years include:
• director of Glencore plc;
• chairman of the Industry Advisory Council for the School of Minerals and Energy Resource Engineering, UNSW;
• director of Santos Limited (resigned 19 February 2018); and
• director and chairman of Sphere Minerals Limited (resigned 22 June 2016).
Valerie Davies FAICD
Independent non-executive director and Board member since 2011.
Experience
A company director with more than two decades of broad experience across diverse sectors, including tourism, property,
health and media. In parallel, Ms Davies has more than 20 years senior executive experience in corporate communications,
as Principal of her own consultancy One.2.One Communications Pty Ltd.
Directorships
Positions held by Ms Davies during the last three years include:
• director of Cedar Woods Properties Limited;
• director of HBF Health Limited (resigned 24 October 2017); and
• commissioner of Tourism Western Australia.
David Grant BComm, CA, GAICD
Independent non-executive director, Board member since 2013, Chairman of the Audit and Risk Committee and Chairman of
the Nomination and Remuneration Committee.
Experience
Mr Grant is a Chartered Accountant with 25-plus years accounting and finance experience spanning both the accounting
profession and the commercial sector. Mr Grant’s executive career included roles with Goodman Fielder Limited and Iluka
Resources Limited as well as co-founding a privately held resource exploration venture in New Zealand. Mr Grant was
formerly a non-executive director of Consolidated Rutile Limited.
Directorships
Positions held by Mr Grant during the last three years include:
• director of iiNet Limited (resigned 7 September 2015); and
• director of Murray Goulburn Co-operative Co. Limited (appointed 27 October 2017).

D I R E C T O R S ’ R E P O R T
4 EVENT Hospitality & Entertainment Limited – 2018 Annual Report
Directors’ qualifications, experience and independent status (continued)
Jane Hastings BComm
Managing Director and Chief Executive Officer (“CEO”) from 1 July 2017.
Experience
Ms Hastings has more than 20 years’ experience in the tourism, hospitality and entertainment sectors. Ms Hastings
previously held a number of senior positions with APN News & Media Limited, including CEO of The Radio Network (2012 −
2014) and CEO of New Zealand Media and Entertainment (NZME) (2014 − 2016). Ms Hastings was appointed as the Group’s
Chief Operating Officer with effect from 29 August 2016 and on 27 April 2017, the Group announced that Ms Hastings would
succeed Mr DC Seargeant as the Group’s Managing Director and CEO from 1 July 2017.
Directorships
Ms Hastings is also a New Zealand Film Commission board member.
Patria Mann BEc, CA, FAICD
Independent non-executive director and Board member since 2013. Member of the Audit and Risk Committee and Member
of the Nomination and Remuneration Committee.
Experience
Mrs Mann is a Chartered Accountant, a former partner of KPMG and a company director with over 25 years’ experience. She
has been a professional non-executive director for over 15 years. Mrs Mann has extensive audit, investigation, risk
management and corporate governance experience.
Directorships
Positions held by Mrs Mann during the last three years include:
• director of Bellamy’s Australia Limited (appointed 10 March 2016, resigned 18 May 2017);
• director of Ridley Corporation Limited;
• director of Perpetual Superannuation Limited (resigned 31 October 2016); and
• director of Allianz Australia Limited.
Richard Newton BBus (Marketing), FAICD
Independent non-executive director and Board member since 2008.
Experience
A company director with 20-plus years senior executive experience in property investment and development, specifically in
hotel operations.
Directorships
Positions held by Mr Newton during the last three years include:
• chairman of Capricorn Village Joint Venture, WA;
• chairman and director of Selpam (Australia) Pty Limited and a director of various companies wholly owned by Selpam
(Australia) Pty Limited; and
• director of Bonsey Jaden Pte Ltd, a digital advertising agency.
Explanation of abbreviations and degrees: AFRACMA Associate Fellow of The Royal Australasian College of Medical Administrators; AO Officer in the Order
of Australia; BBus (Marketing) Bachelor of Business (Marketing); BComm Bachelor of Commerce; BEc Bachelor of Economics; BSc (Mining Engineering)
Bachelor of Science (Mining Engineering); CA Member of Chartered Accountants Australia and New Zealand; FAICD Fellow of the Australian Institute of
Company Directors; FAIM Fellow of the Australian Institute of Management; FAusIMM Fellow of the Australasian Institute of Mining and Metallurgy; GAICD
Graduate Member of the Australian Institute of Company Directors; and MB BS Bachelor of Medicine and Bachelor of Surgery.
COMPANY SECRETARIES
GC Dean CA, ACIS was appointed to the position of Company Secretary for EVENT Hospitality & Entertainment Limited in
December 2002. GC Dean was Accounting Manager for the Company (2001 – 2002) and is a Chartered Accountant and a member
of the Governance Institute of Australia.
DI Stone FCA, ACIS was appointed to the position of Company Secretary for EVENT Hospitality & Entertainment Limited in
February 2012. Prior to this appointment, DI Stone was an audit senior manager at KPMG. DI Stone is a Fellow of the Institute of
Chartered Accountants in England and Wales and a member of the Governance Institute of Australia.

D I R E C T O R S ’ R E P O R T
5 EVENT Hospitality & Entertainment Limited – 2018 Annual Report
CORPORATE GOVERNANCE
The Board endorses the ASX Corporate Governance Council’s Corporate Governance Principles and Recommendations, 3rd
Edition. The Group has disclosed its 2018 Corporate Governance Statement in the Corporate Governance section on the EVENT
website (https://www.evt.com/investors/). As required, the Group has also lodged the 2018 Corporate Governance Statement
and Appendix 4G with the ASX.
DIRECTORS’ MEETINGS
The number of directors’ meetings (including meetings of committees of directors) and the number of meetings attended by each
of the directors of the Company during the year are set out below:
Directors’
meetings
Audit and Risk
Committee
meetings
Nomination and
Remuneration
Committee meetings
Entitled
to attend
Attended
Entitled
to attend
Attended
Entitled
to attend
Attended
AG Rydge 9 9 4 4 5 5
KG Chapman 9 9 – – – –
PR Coates 9 9 – – – –
VA Davies 9 9 – – – –
DC Grant 9 9 4 4 5 5
JM Hastings (a) 9 9 4 4 4 4
PM Mann 9 8 4 4 5 5
RG Newton 9 9 – – – –
(a) JM Hastings attended Audit and Risk Committee and certain Nomination and Remuneration Committee meetings by invitation. Other directors who are not
members of a committee may attend meetings by invitation from time to time.
During the year, directors also visited various sites to improve their understanding of the Group’s locations and operations.
PRINCIPAL ACTIVITIES
The principal activities of the Group during the course of the year included the following:
• cinema exhibition operations in Australia, including technology equipment supply and servicing, and the State Theatre;
• cinema exhibition operations in New Zealand;
• cinema exhibition operations in Germany;
• ownership, operation and management of hotels and resorts in Australia and overseas;
• operation of the Thredbo resort including property development activities; and
• property development, investment properties, and investment in shares in listed and unlisted companies.
There were no significant changes in the nature of the activities of the Group during the year.
SIGNIFICANT CHANGES IN THE STATE OF AFFAIRS
There were no significant changes in the state of affairs of the Group during the year.
OPERATING AND FINANCIAL REVIEW
Overview of the Group
Net profit after tax was $111,910,000 (2017: $110,819,000), an increase of $1,091,000 or 1.0% above the prior year result. The
normalised result before interest and income tax expense was $190,270,000 (2017: $169,932,000), an increase of $20,338,000 or
12.0% and the normalised result after tax was $124,281,000 (2017: $113,684,000), an increase of $10,597,000 or 9.3% above the
prior year result.
The individually significant items for the year are set out on page 7. The individually significant items were a net expense item
after tax of $12,371,000 (2017: net expense item after tax of $2,865,000).

DIR
EC
TO
RS
’ R
EP
OR
T
6 E
VE
NT
Ho
spit
alit
y &
En
tert
ain
me
nt
Lim
ite
d –
20
18
An
nu
al R
ep
ort
Ov
erv
iew
of
the
Gro
up
(co
nti
nu
ed
)
A s
um
ma
ry o
f th
e n
orm
alis
ed
re
sult
is
ou
tlin
ed
be
low
:
2
01
8
20
17
2
01
6
No
rma
lise
d
resu
lt *
Re
con
cili
ati
on
to
rep
ort
ed
ne
t p
rofi
t
No
rma
lise
d
resu
lt *
Re
con
cili
ati
on
to
rep
ort
ed
ne
t p
rofi
t
No
rma
lise
d
resu
lt *
Re
con
cili
ati
on
to
rep
ort
ed
ne
t p
rofi
t
$
’00
0
$’0
00
$
’00
0
$’0
00
$
’00
0
$’0
00
En
tert
ain
me
nt
Au
stra
lia
68
,60
0
68
,60
0
78
,95
7
78
,95
7
88
,51
5
88
,51
5
Ne
w Z
ea
lan
d
11
,15
0
11
,15
0
10
,78
7
10
,78
7
10
,50
8
10
,50
8
Ge
rma
ny
19
,91
8
19
,91
8
22
,24
6
22
,24
6
36
,04
2
36
,04
2
Ho
spit
ali
ty a
nd
Le
isu
re
Ho
tels
an
d R
eso
rts
69
,27
0
69
,27
0
52
,73
4
52
,73
4
51
,59
7
51
,59
7
Th
red
bo
Alp
ine
Re
sort
2
1,8
38
2
1,8
38
1
8,1
87
1
8,1
87
1
5,0
07
1
5,0
07
Pro
pe
rty
an
d O
the
r In
ve
stm
en
ts
16
,52
8
16
,52
8
9,3
43
9
,34
3
5,5
84
5
,58
4
Un
all
oca
ted
re
ve
nu
e a
nd
exp
en
ses
(17
,03
4)
(17
,03
4)
(22
,32
2)
(22
,32
2)
(21
,30
8)
(21
,30
8)
No
rma
lise
d p
rofi
t b
efo
re in
tere
st a
nd
ta
x 1
90
,27
0
19
0,2
70
1
69
,93
2
16
9,9
32
1
85
,94
5
18
5,9
45
Fin
an
ce r
eve
nu
e
59
9
59
9
80
7
80
7
91
5
91
5
Fin
an
ce c
ost
s (7
,65
5)
(7,6
55
) (9
,80
2)
(9,8
02
) (8
,94
6)
(8,9
46
)
No
rma
lise
d p
rofi
t b
efo
re t
ax
18
3,2
14
1
83
,21
4
16
0,9
37
1
60
,93
7
17
7,9
14
1
77
,91
4
Inco
me
ta
x e
xpe
nse
(5
8,9
33
) (5
8,9
33
) (4
7,2
53
) (4
7,2
53
) (5
1,9
34
) (5
1,9
34
)
No
rma
lise
d p
rofi
t a
fte
r ta
x 1
24
,28
1
12
4,2
81
1
13
,68
4
11
3,6
84
1
25
,98
0
12
5,9
80
Ind
ivid
ua
lly s
ign
ific
an
t it
em
s –
ne
t o
f ta
x
(12
,37
1)
(2
,86
5)
4
,26
8
Pro
fit
for
the
ye
ar
1
11
,91
0
1
10
,81
9
1
30
,24
8
* N
orm
alis
ed
re
sult
is
pro
fit
for
the
ye
ar
be
fore
in
div
idu
ally
sig
nif
ica
nt
ite
ms
(as
ou
tlin
ed
in
No
te 2
.3 t
o t
he
fin
an
cia
l st
ate
me
nts
an
d i
n t
he
ta
ble
be
low
). A
s o
utl
ine
d i
n N
ote
2.2
to
th
e f
ina
nci
al
sta
tem
en
ts,
this
me
asu
re i
s u
sed
by
the
Gro
up
’s C
EO
to
allo
cate
re
sou
rce
s a
nd
in a
sse
ssin
g t
he
re
lati
ve p
erf
orm
an
ce o
f th
e G
rou
p’s
op
era
tio
ns.
Th
e n
orm
alis
ed
re
sult
is
an
un
au
dit
ed
no
n-I
nte
rna
tio
na
l Fin
an
cia
l Re
po
rtin
g S
tan
da
rds
me
asu
re.

D I R E C T O R S ’ R E P O R T
7 EVENT Hospitality & Entertainment Limited – 2018 Annual Report
Overview of the Group (continued)
An analysis of the last five years is outlined below:
2018 2017 2016 2015 2014
Total revenue and other income ($’000) 1,289,738 1,294,269 1,280,889 1,174,662 1,097,138
Basic earnings per share (cents) 69.9 69.6 82.2 68.9 49.7
Dividends declared(a) ($’000) 83,670 81,886 81,886 85,097 67,435
Dividends per share (cents) 52 51 51 45 42
Special dividend per share (cents) – – – 8 –
(a) Includes the interim dividend paid and the final and special dividends declared in relation to the financial year ended 30 June.
Individually significant items
Individually significant items comprised the following:
2018
$’000
2017
$’000
Impairment charges (18,525) (10,986)
Managing Director retirement and transition costs – (5,526)
Net proceeds from insurance 1,148 5,457
Write-back of expired voucher stock – 5,184
Other individually significant items (net) (296) 2,255
Individually significant items before income tax (17,673) (3,616)
Income tax benefit 5,302 751
Individually significant items after income tax (12,371) (2,865)
The individually significant items for the year included impairment charges, restructure, redundancy and closure costs, and hotel
pre-opening expenses offset by termination fees in relation to certain hotel management agreements. The individually significant
items for the prior year included impairment charges, Managing Director retirement and transition costs and hotel pre-opening
expenses offset by net proceeds from insurance, the write-back of expired voucher stock, profit on sale of a cinema circuit in Fiji
and profit on sale of apartments.
Investments
The Group acquired property, plant and equipment totalling $169,388,000 during the year. The significant acquisitions and capital
additions include the following:
• QT Queenstown, QT Perth and Atura Adelaide Airport hotel developments;
• the redevelopment of QT Museum Wellington;
• cinema developments at Smithfield (QLD), Palmerston (NT), Whitford (WA), Plenty Valley (VIC), Coomera (QLD) and Kawana
(QLD); and
• refurbishment requirements for the cinemas, hotels and resorts.
Property
The Group’s interest in land and buildings and integral plant and equipment, including long term leasehold land and
improvements, is independently valued by registered qualified valuers on a progressive three year cycle. Independent valuations
for the majority of the Group’s properties have been obtained at 30 June 2018, and the revised total value of the Group’s interest
in land and buildings, excluding investment properties, based on these independent valuations is $1,963,300,000 (refer to Note
3.3 to the financial statements) whilst the total written-down book value of these land and buildings including integral plant and
equipment at 30 June 2018 was $1,118,029,000. The total value of the investment properties at 30 June 2018 was $74,000,000.
Capital structure
Cash and term deposits at 30 June 2018 totalled $95,564,000 and total bank debt outstanding was $375,540,000.
D I R E C T O R S ’ R E P O R T
8 EVENT Hospitality & Entertainment Limited – 2018 Annual Report
Treasury policy
The Group manages interest rate risk in accordance with a Board approved policy covering the types of instruments, range of
protection and duration of instruments. The financial instruments cover interest rate swaps and forward rate agreements.
Maturities of these instruments are up to a maximum of five years. Interest rate swaps and forward rate agreements allow the
Group to raise long term borrowings at floating rates and swap a portion of those borrowings into fixed rates.
The approved range of interest rate cover is based on the projected debt levels for each currency and reduced for each future
year. At 30 June 2018, the Group had no interest rate hedges (2017: no interest rate hedges) due to the low level of Group debt.
Liquidity and funding
The Group’s secured bank debt facilities were amended and restated on 15 August 2017 and comprise the following:
• $545,000,000 revolving multi-currency loan facility; and
• $15,000,000 credit support facility (for the issue of letters of credit and bank guarantees).
The above facilities mature on 15 August 2020 and are supported by interlocking guarantees from most Group entities and are
secured by specific property mortgages. Debt drawn under these facilities bears interest at the relevant inter-bank benchmark
reference rate plus a margin of between 1.15% and 2.1% per annum.
Cash flows from operations
Net operating cash inflows increased to $207,749,000 from $188,681,000 recorded in the prior comparable year. This increase was
driven by an overall increase in operating cash flow from the Group’s major operating businesses and a reduction in tax paid due
to timing differences.
Impact of legislation and other external requirements
There were no changes in environmental or other legislative requirements during the year that have significantly impacted the
results of operations of the Group.
REVIEW OF OPERATIONS BY DIVISION
ENTERTAINMENT
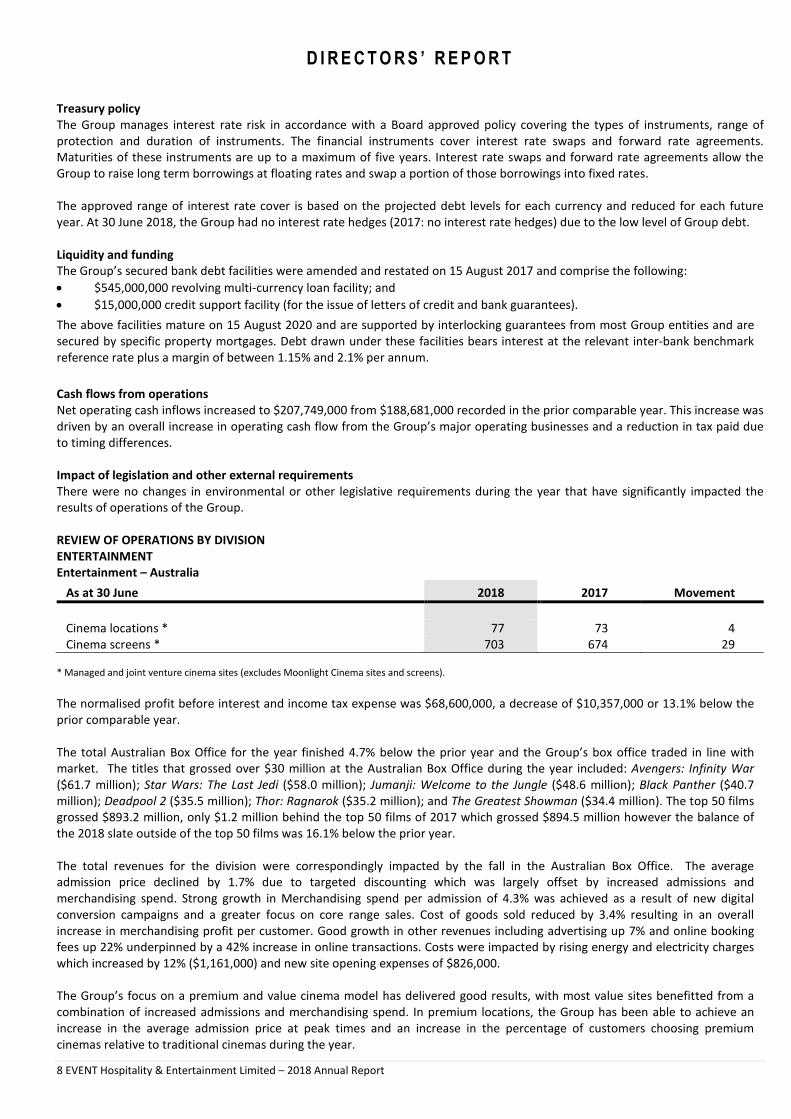
Entertainment – Australia
As at 30 June 2018 2017 Movement
Cinema locations * 77 73 4
Cinema screens * 703 674 29
* Managed and joint venture cinema sites (excludes Moonlight Cinema sites and screens).
The normalised profit before interest and income tax expense was $68,600,000, a decrease of $10,357,000 or 13.1% below the
prior comparable year.
The total Australian Box Office for the year finished 4.7% below the prior year and the Group’s box office traded in line with
market. The titles that grossed over $30 million at the Australian Box Office during the year included: Avengers: Infinity War
($61.7 million); Star Wars: The Last Jedi ($58.0 million); Jumanji: Welcome to the Jungle ($48.6 million); Black Panther ($40.7
million); Deadpool 2 ($35.5 million); Thor: Ragnarok ($35.2 million); and The Greatest Showman ($34.4 million). The top 50 films
grossed $893.2 million, only $1.2 million behind the top 50 films of 2017 which grossed $894.5 million however the balance of
the 2018 slate outside of the top 50 films was 16.1% below the prior year.
The total revenues for the division were correspondingly impacted by the fall in the Australian Box Office. The average
admission price declined by 1.7% due to targeted discounting which was largely offset by increased admissions and
merchandising spend. Strong growth in Merchandising spend per admission of 4.3% was achieved as a result of new digital
conversion campaigns and a greater focus on core range sales. Cost of goods sold reduced by 3.4% resulting in an overall
increase in merchandising profit per customer. Good growth in other revenues including advertising up 7% and online booking
fees up 22% underpinned by a 42% increase in online transactions. Costs were impacted by rising energy and electricity charges
which increased by 12% ($1,161,000) and new site opening expenses of $826,000.
The Group’s focus on a premium and value cinema model has delivered good results, with most value sites benefitted from a
combination of increased admissions and merchandising spend. In premium locations, the Group has been able to achieve an
increase in the average admission price at peak times and an increase in the percentage of customers choosing premium
cinemas relative to traditional cinemas during the year.
D I R E C T O R S ’ R E P O R T
9 EVENT Hospitality & Entertainment Limited – 2018 Annual Report
The Group continued to pursue increased market share and visitation loyalty through the Cinebuzz program with membership
increasing by a record 33% which represents an increase of over 500,000 members since 30 June 2017. Cinebuzz member
bookings now represent 64% of total admissions and the program is a powerful marketing and sales channel.
During the year the Group opened four new cinemas, totalling 29 screens. These included new Event Cinemas in Smithfield
(Cairns) which includes one Vmax and five traditional screens, Palmerston (Darwin), which includes two Vmax and four
traditional screens, and Whitford (Perth) which includes two Gold Class, two Vmax and four traditional screens. In addition,
Village Plenty Valley opened in April 2018 including Gold Class and Vmax auditoria. These new sites contributed negatively to
earnings, as expected in the first year of trading. With the exception of Palmerston, the cinemas are trading in line with initial
expectations. New Event Cinemas in Coomera (Gold Coast) and Kawana (Sunshine Coast) are due to open later in 2018 and will
incorporate premium cinemas and new concepts.
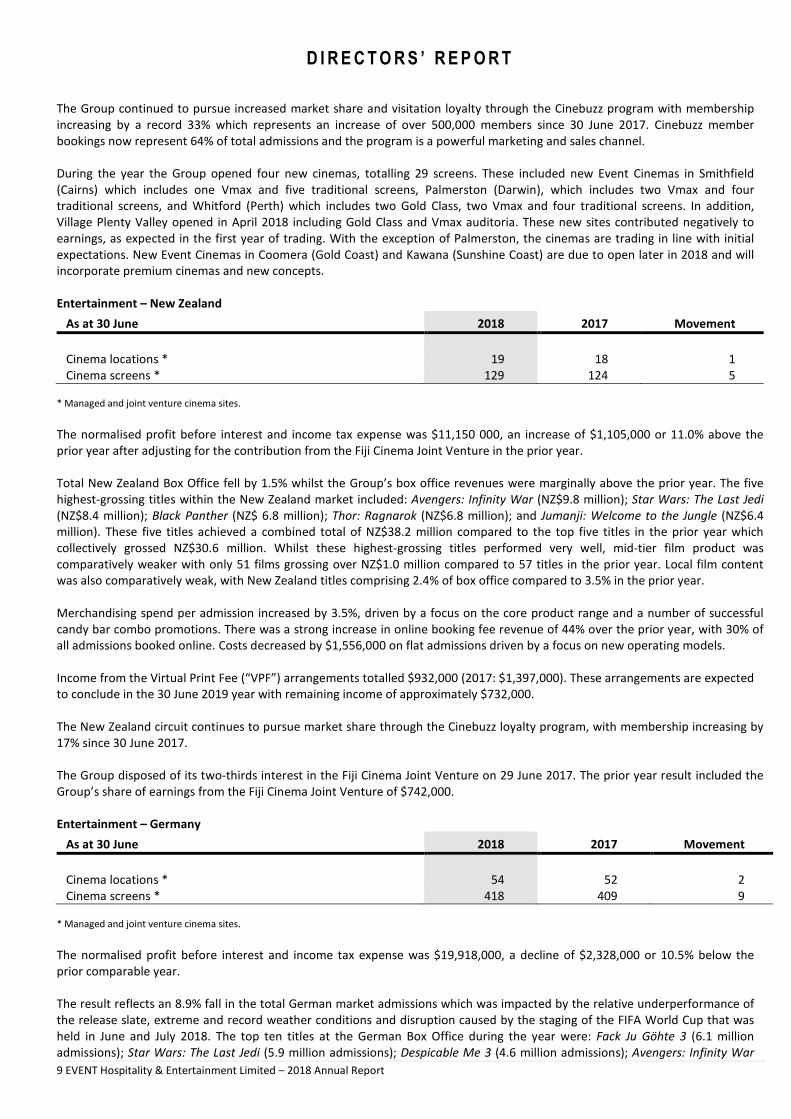
Entertainment – New Zealand
As at 30 June 2018 2017 Movement
Cinema locations * 19 18 1
Cinema screens * 129 124 5
* Managed and joint venture cinema sites.
The normalised profit before interest and income tax expense was $11,150 000, an increase of $1,105,000 or 11.0% above the
prior year after adjusting for the contribution from the Fiji Cinema Joint Venture in the prior year.
Total New Zealand Box Office fell by 1.5% whilst the Group’s box office revenues were marginally above the prior year. The five
highest-grossing titles within the New Zealand market included: Avengers: Infinity War (NZ$9.8 million); Star Wars: The Last Jedi
(NZ$8.4 million); Black Panther (NZ$ 6.8 million); Thor: Ragnarok (NZ$6.8 million); and Jumanji: Welcome to the Jungle (NZ$6.4
million). These five titles achieved a combined total of NZ$38.2 million compared to the top five titles in the prior year which
collectively grossed NZ$30.6 million. Whilst these highest-grossing titles performed very well, mid-tier film product was
comparatively weaker with only 51 films grossing over NZ$1.0 million compared to 57 titles in the prior year. Local film content
was also comparatively weak, with New Zealand titles comprising 2.4% of box office compared to 3.5% in the prior year.
Merchandising spend per admission increased by 3.5%, driven by a focus on the core product range and a number of successful
candy bar combo promotions. There was a strong increase in online booking fee revenue of 44% over the prior year, with 30% of
all admissions booked online. Costs decreased by $1,556,000 on flat admissions driven by a focus on new operating models.
Income from the Virtual Print Fee (“VPF”) arrangements totalled $932,000 (2017: $1,397,000). These arrangements are expected
to conclude in the 30 June 2019 year with remaining income of approximately $732,000.
The New Zealand circuit continues to pursue market share through the Cinebuzz loyalty program, with membership increasing by
17% since 30 June 2017.
The Group disposed of its two-thirds interest in the Fiji Cinema Joint Venture on 29 June 2017. The prior year result included the
Group’s share of earnings from the Fiji Cinema Joint Venture of $742,000.
Entertainment – Germany
As at 30 June 2018 2017 Movement
Cinema locations * 54 52 2
Cinema screens * 418 409 9
* Managed and joint venture cinema sites.
The normalised profit before interest and income tax expense was $19,918,000, a decline of $2,328,000 or 10.5% below the
prior comparable year.
The result reflects an 8.9% fall in the total German market admissions which was impacted by the relative underperformance of
the release slate, extreme and record weather conditions and disruption caused by the staging of the FIFA World Cup that was
held in June and July 2018. The top ten titles at the German Box Office during the year were: Fack Ju Göhte 3 (6.1 million
admissions); Star Wars: The Last Jedi (5.9 million admissions); Despicable Me 3 (4.6 million admissions); Avengers: Infinity War
D I R E C T O R S ’ R E P O R T
10 EVENT Hospitality & Entertainment Limited – 2018 Annual Report
(3.3 million admissions); IT (3.1 million admissions); Fifty Shades Freed (2.8 million admissions); Deadpool 2 (2.0 million
admissions); Dieses Bescheuerte Herz (2.0 million admissions); Jumanji: Welcome to the Jungle (2.0 million admissions); and
Bullyparade – Der Film (1.9 million admissions). The top ten films achieved total market admissions of 33.70 million, consistent
with the top ten films of the 2017 year which achieved 33.74 million admissions. Outside of the top ten films, the market
underperformed on a comparative basis, down 12.5%. German-produced films represented 21.2% (2017: 13.9%) of the German
Box Office and admissions to German films increased by 36% over the previous year. The online ticketing percentage increased
16.8%.
Average admission price and screen advertising revenues were consistent with the prior year whilst merchandising profit per
admission increased by 7.3% and booking fee income was up 7.4%. Costs were well managed and the strengthening of the Euro
by 5.7% against the Australian dollar also assisted with the conversion.
Income from the Virtual Print Fee (“VPF”) arrangements totalled $6,819,000 (2017: $5,795,000) and this income item is expected
to wind-down over the next two years and conclude in the 30 June 2020 year. The VPF income for the 2019 and 2020 financial
years is expected to deliver approximately $2,632,000 and $2,630,000 respectively.
The Cinestar loyalty program was enhanced and has increased the membership base by 27.8%. A strong focus on increasing
loyalty members and the introduction of online package sales is expected to deliver further growth.
Cinema locations increased during the year with the addition of the two-screen leased site Weimar Atrium and the 7-screen
freehold site Neumünster. There are three new leasehold sites under current development including: Augsburg, with 9-screens
and expected to open in October 2018; Remscheid with 5-screens and expected to open in the first quarter of the 2019 calendar
year; and Freising with 5-screens and also expected to open in the first quarter of the 2019 calendar year. The three new
cinemas will incorporate traditional as well as introduce premium seating concepts.
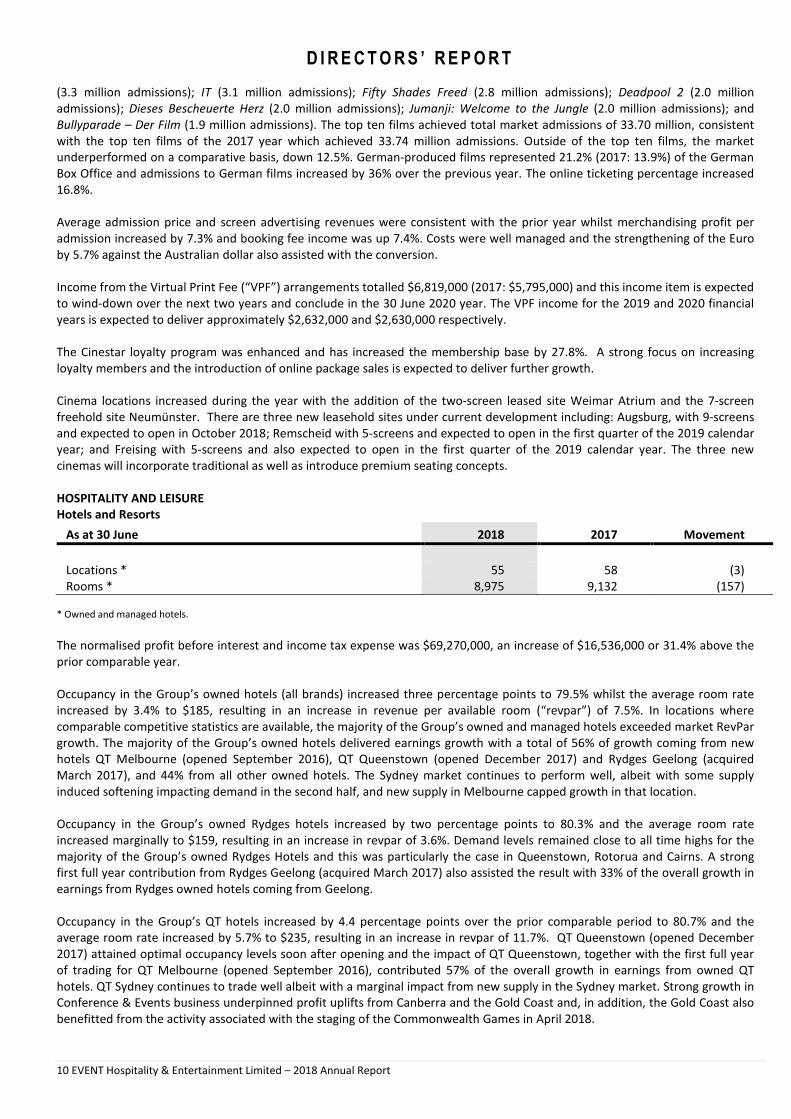
HOSPITALITY AND LEISURE
Hotels and Resorts
As at 30 June 2018 2017 Movement
Locations * 55 58 (3)
Rooms * 8,975 9,132 (157)
* Owned and managed hotels.
The normalised profit before interest and income tax expense was $69,270,000, an increase of $16,536,000 or 31.4% above the
prior comparable year.
Occupancy in the Group’s owned hotels (all brands) increased three percentage points to 79.5% whilst the average room rate
increased by 3.4% to $185, resulting in an increase in revenue per available room (“revpar”) of 7.5%. In locations where
comparable competitive statistics are available, the majority of the Group’s owned and managed hotels exceeded market RevPar
growth. The majority of the Group’s owned hotels delivered earnings growth with a total of 56% of growth coming from new
hotels QT Melbourne (opened September 2016), QT Queenstown (opened December 2017) and Rydges Geelong (acquired
March 2017), and 44% from all other owned hotels. The Sydney market continues to perform well, albeit with some supply
induced softening impacting demand in the second half, and new supply in Melbourne capped growth in that location.
Occupancy in the Group’s owned Rydges hotels increased by two percentage points to 80.3% and the average room rate
increased marginally to $159, resulting in an increase in revpar of 3.6%. Demand levels remained close to all time highs for the
majority of the Group’s owned Rydges Hotels and this was particularly the case in Queenstown, Rotorua and Cairns. A strong
first full year contribution from Rydges Geelong (acquired March 2017) also assisted the result with 33% of the overall growth in
earnings from Rydges owned hotels coming from Geelong.
Occupancy in the Group’s QT hotels increased by 4.4 percentage points over the prior comparable period to 80.7% and the
average room rate increased by 5.7% to $235, resulting in an increase in revpar of 11.7%. QT Queenstown (opened December
2017) attained optimal occupancy levels soon after opening and the impact of QT Queenstown, together with the first full year
of trading for QT Melbourne (opened September 2016), contributed 57% of the overall growth in earnings from owned QT
hotels. QT Sydney continues to trade well albeit with a marginal impact from new supply in the Sydney market. Strong growth in
Conference & Events business underpinned profit uplifts from Canberra and the Gold Coast and, in addition, the Gold Coast also
benefitted from the activity associated with the staging of the Commonwealth Games in April 2018.
D I R E C T O R S ’ R E P O R T
11 EVENT Hospitality & Entertainment Limited – 2018 Annual Report
Occupancy in the Group’s Atura hotels increased 2.1 percentage points over the prior comparable year to 72.3% and average
room rate increased by 1.2% to $141, resulting in an increase in revpar of 4.3%.
Managed hotels across New Zealand and most Australian mainland capital cities produced good results. The Brisbane properties
recorded solid growth despite recent increased supply within that market and regional centres, such as Bathurst and Kalgoorlie,
also traded well.
The management services agreements for the Art Series Hotels ended in October 2017, whilst hotels located in Brisbane,
Mackay, Newcastle, Melbourne and Tailem Bend in South Australia joined the managed portfolio in the second half of the year.
In addition, Rydges Darwin Central joined the portfolio in July 2018, and a management development consulting agreement has
been signed for The Hermitage Aoraki Mount Cook.
Thredbo Alpine Resort
The normalised profit before interest and income tax expense was $21,838,000, an increase of $3,651,000 or 20.1% above the
prior comparable year.
The 2017 snow season was consistent with the 2016 season in July and August however September 2017 experienced good
snowfall resulting in a 40% increase in skiers which largely contributed to an overall increase in visitation of 12% for the season.
Total revenue for the year grew 10% to $72,971,000 with lift pass revenue for the 2017 snow season from 1 July 2017 increasing
by 13%, and similar increases achieved in other ski-related ancillary revenue streams. Strong food and beverage revenues
contributed to overall growth, with revenue improving by 15% over the prior year.
Summer revenues continue to grow, underpinned by growth in mountain biking visitation with total summer revenue increasing
by 19% over the prior year.
PROPERTY AND OTHER INVESTMENTS
The normalised profit before interest and income tax expense was $16,528,000, an increase of $7,185,000 or 76.9% above the
prior year. The improved result includes rental income from the two properties located at 458-472 George Street, Sydney, which
were acquired in May 2017 and are currently leased to several retail and commercial tenants. The result was further assisted by a
fair value increment of the investment properties of $5,750,000.
Updated independent valuations for the majority of the Group’s properties have been obtained at 30 June 2018, and based on
these valuations the fair value of the Group’s property portfolio at 30 June 2018 is approximately $2.0 billion (including
investment properties), whilst the book value of these interests is $1.2 billion. Further information regarding the fair value of the
Group’s property portfolio is disclosed in note 3.3 to the financial statements.
UNALLOCATED REVENUES AND EXPENSES
The unallocated revenues and expenses include the Group’s corporate functions and various head office expenses. The decrease
in the net expense reflects the new corporate structure, reduced incentive payments and general cost saving initiatives.
D I R E C T O R S ’ R E P O R T
12 EVENT Hospitality & Entertainment Limited – 2018 Annual Report
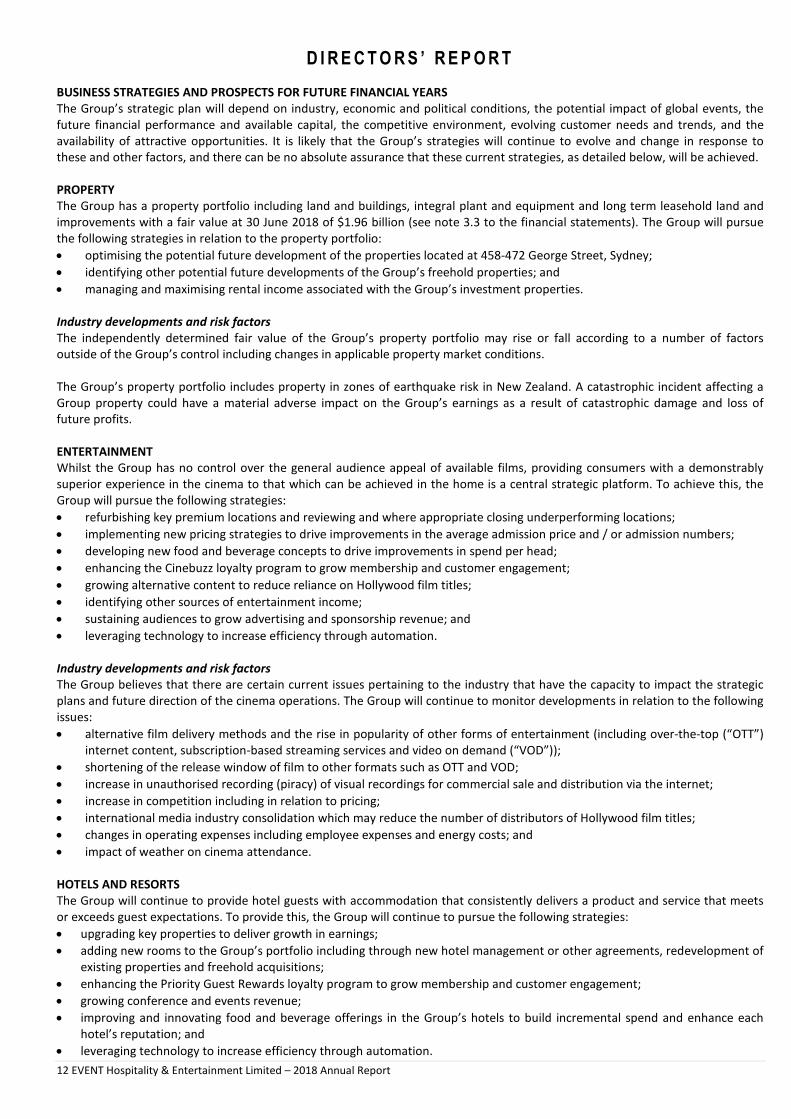
BUSINESS STRATEGIES AND PROSPECTS FOR FUTURE FINANCIAL YEARS
The Group’s strategic plan will depend on industry, economic and political conditions, the potential impact of global events, the
future financial performance and available capital, the competitive environment, evolving customer needs and trends, and the
availability of attractive opportunities. It is likely that the Group’s strategies will continue to evolve and change in response to
these and other factors, and there can be no absolute assurance that these current strategies, as detailed below, will be achieved.
PROPERTY
The Group has a property portfolio including land and buildings, integral plant and equipment and long term leasehold land and
improvements with a fair value at 30 June 2018 of $1.96 billion (see note 3.3 to the financial statements). The Group will pursue
the following strategies in relation to the property portfolio:
• optimising the potential future development of the properties located at 458-472 George Street, Sydney;
• identifying other potential future developments of the Group’s freehold properties; and
• managing and maximising rental income associated with the Group’s investment properties.
Industry developments and risk factors
The independently determined fair value of the Group’s property portfolio may rise or fall according to a number of factors
outside of the Group’s control including changes in applicable property market conditions.
The Group’s property portfolio includes property in zones of earthquake risk in New Zealand. A catastrophic incident affecting a
Group property could have a material adverse impact on the Group’s earnings as a result of catastrophic damage and loss of
future profits.
ENTERTAINMENT
Whilst the Group has no control over the general audience appeal of available films, providing consumers with a demonstrably
superior experience in the cinema to that which can be achieved in the home is a central strategic platform. To achieve this, the
Group will pursue the following strategies:
• refurbishing key premium locations and reviewing and where appropriate closing underperforming locations;
• implementing new pricing strategies to drive improvements in the average admission price and / or admission numbers;
• developing new food and beverage concepts to drive improvements in spend per head;
• enhancing the Cinebuzz loyalty program to grow membership and customer engagement;
• growing alternative content to reduce reliance on Hollywood film titles;
• identifying other sources of entertainment income;
• sustaining audiences to grow advertising and sponsorship revenue; and
• leveraging technology to increase efficiency through automation.
Industry developments and risk factors
The Group believes that there are certain current issues pertaining to the industry that have the capacity to impact the strategic
plans and future direction of the cinema operations. The Group will continue to monitor developments in relation to the following
issues:
• alternative film delivery methods and the rise in popularity of other forms of entertainment (including over-the-top (“OTT”)
internet content, subscription-based streaming services and video on demand (“VOD”));
• shortening of the release window of film to other formats such as OTT and VOD;
• increase in unauthorised recording (piracy) of visual recordings for commercial sale and distribution via the internet;
• increase in competition including in relation to pricing;
• international media industry consolidation which may reduce the number of distributors of Hollywood film titles;
• changes in operating expenses including employee expenses and energy costs; and
• impact of weather on cinema attendance.
HOTELS AND RESORTS
The Group will continue to provide hotel guests with accommodation that consistently delivers a product and service that meets
or exceeds guest expectations. To provide this, the Group will continue to pursue the following strategies:
• upgrading key properties to deliver growth in earnings;
• adding new rooms to the Group’s portfolio including through new hotel management or other agreements, redevelopment of
existing properties and freehold acquisitions;
• enhancing the Priority Guest Rewards loyalty program to grow membership and customer engagement;
• growing conference and events revenue;
• improving and innovating food and beverage offerings in the Group’s hotels to build incremental spend and enhance each
hotel’s reputation; and
• leveraging technology to increase efficiency through automation.

D I R E C T O R S ’ R E P O R T
13 EVENT Hospitality & Entertainment Limited – 2018 Annual Report
Industry developments and risk factors
The Group believes that there are certain current issues pertaining to the industry that have the capacity to impact the strategic
plans and future direction of the hotel operations. The Group will continue to monitor developments in relation to the following
issues:
• new hotel supply in key markets increasing competition for the Group’s hotels in those markets;
• competition for the distribution of rooms from online travel agents;
• changes in operating expenses including employee expenses and energy costs; and
• growth and market penetration of alternative accommodation providers.
THREDBO ALPINE RESORT
The key strategy for the Thredbo Alpine Resort is to maintain the facility as one of the premier Australian holiday destinations. This
strategy includes:
• continuing to ensure the popularity, high quality and ambience of the winter-time resort facility;
• continuing to improve snowmaking capability to mitigate risk in poor snow seasons;
• increasing the number and quality of sporting and cultural events to increase visitation outside of the snow season;
• expanding the mountain bike trail network to appeal to a broader range of riders; and
• ensuring that the environmental integrity of the Resort is maintained and, where possible, improved.
Industry developments and risk factors
The Group believes that there are certain current issues pertaining to the industry that have the capacity to impact the strategic
plans and future direction of Thredbo’s operations. The Group will continue to monitor developments in relation to the following
issues:
• reliance on natural snowfall, which is partially mitigated by the Group’s snow making capability;
• changes in operating expenses including employee expenses and energy costs; and
• short and long-term climate-related physical, regulatory and transition risks. Further information regarding the Group’s
response to climate change is available in section 5.8 of the 2018 Corporate Governance Statement.
DIVIDENDS
Dividends paid or declared by the Company since the end of the previous year were:
Per share
Cents
Total
amount
$’000 Date of payment
Tax rate for
franking
credit
Declared and paid during the year
Final 2017 dividend 31 49,774 21 September 2017 30%
Interim 2018 dividend 21 33,790 15 March 2018 30%
83,564
Declared after the end of the year
Final 2018 dividend 31 49,880 20 September 2018
30%
All the dividends paid or declared by the Company since the end of the previous year were 100% franked.
REMUNERATION REPORT
The Remuneration Report, which forms part of the Directors’ Report, is set out on pages 17 to 29 and has been audited as
required by section 308(3C) of the Corporations Act 2001.
EVENTS SUBSEQUENT TO REPORTING DATE
There has not arisen in the interval between the end of the year and the date of this report, any item, transaction or event of
a material and unusual nature likely, in the opinion of the directors of the Company, to affect significantly the operations of
the Group, the results of those operations, or the state of affairs of the Group, in future years.
LIKELY DEVELOPMENTS
Likely developments in the operations of the Group are referred to in the Review of Operations by Division, set out within this
report.
D I R E C T O R S ’ R E P O R T
14 EVENT Hospitality & Entertainment Limited – 2018 Annual Report
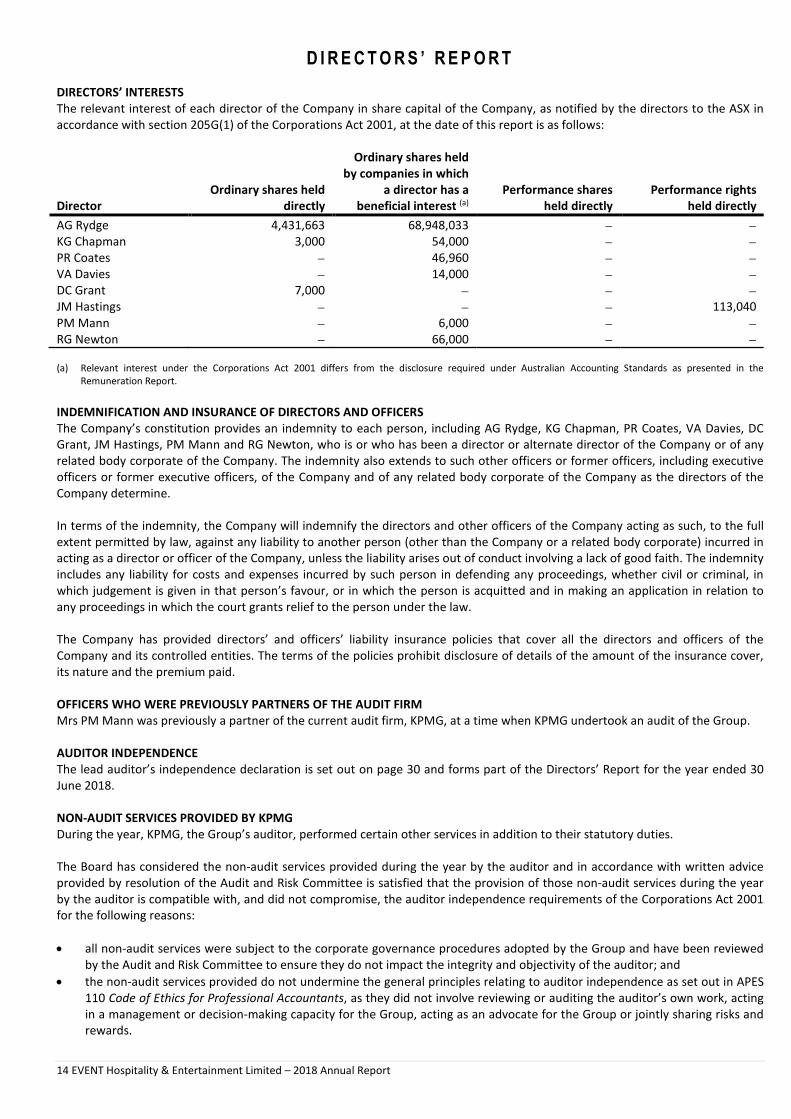
DIRECTORS’ INTERESTS
The relevant interest of each director of the Company in share capital of the Company, as notified by the directors to the ASX in
accordance with section 205G(1) of the Corporations Act 2001, at the date of this report is as follows:
Director
Ordinary shares held
directly
Ordinary shares held
by companies in which
a director has a
beneficial interest (a)
Performance shares
held directly
Performance rights
held directly
AG Rydge 4,431,663 68,948,033 − −
KG Chapman 3,000 54,000 − −
PR Coates − 46,960 − −
VA Davies − 14,000 − −
DC Grant 7,000 − − −
JM Hastings − − − 113,040
PM Mann − 6,000 − −
RG Newton − 66,000 − −
(a) Relevant interest under the Corporations Act 2001 differs from the disclosure required under Australian Accounting Standards as presented in the
Remuneration Report.
INDEMNIFICATION AND INSURANCE OF DIRECTORS AND OFFICERS
The Company’s constitution provides an indemnity to each person, including AG Rydge, KG Chapman, PR Coates, VA Davies, DC
Grant, JM Hastings, PM Mann and RG Newton, who is or who has been a director or alternate director of the Company or of any
related body corporate of the Company. The indemnity also extends to such other officers or former officers, including executive
officers or former executive officers, of the Company and of any related body corporate of the Company as the directors of the
Company determine.
In terms of the indemnity, the Company will indemnify the directors and other officers of the Company acting as such, to the full
extent permitted by law, against any liability to another person (other than the Company or a related body corporate) incurred in
acting as a director or officer of the Company, unless the liability arises out of conduct involving a lack of good faith. The indemnity
includes any liability for costs and expenses incurred by such person in defending any proceedings, whether civil or criminal, in
which judgement is given in that person’s favour, or in which the person is acquitted and in making an application in relation to
any proceedings in which the court grants relief to the person under the law.
The Company has provided directors’ and officers’ liability insurance policies that cover all the directors and officers of the
Company and its controlled entities. The terms of the policies prohibit disclosure of details of the amount of the insurance cover,
its nature and the premium paid.
OFFICERS WHO WERE PREVIOUSLY PARTNERS OF THE AUDIT FIRM
Mrs PM Mann was previously a partner of the current audit firm, KPMG, at a time when KPMG undertook an audit of the Group.
AUDITOR INDEPENDENCE
The lead auditor’s independence declaration is set out on page 30 and forms part of the Directors’ Report for the year ended 30
June 2018.
NON-AUDIT SERVICES PROVIDED BY KPMG
During the year, KPMG, the Group’s auditor, performed certain other services in addition to their statutory duties.
The Board has considered the non-audit services provided during the year by the auditor and in accordance with written advice
provided by resolution of the Audit and Risk Committee is satisfied that the provision of those non-audit services during the year
by the auditor is compatible with, and did not compromise, the auditor independence requirements of the Corporations Act 2001
for the following reasons:
• all non-audit services were subject to the corporate governance procedures adopted by the Group and have been reviewed
by the Audit and Risk Committee to ensure they do not impact the integrity and objectivity of the auditor; and
• the non-audit services provided do not undermine the general principles relating to auditor independence as set out in APES
110 Code of Ethics for Professional Accountants, as they did not involve reviewing or auditing the auditor’s own work, acting
in a management or decision-making capacity for the Group, acting as an advocate for the Group or jointly sharing risks and
rewards.

D I R E C T O R S ’ R E P O R T
15 EVENT Hospitality & Entertainment Limited – 2018 Annual Report
A copy of the auditors’ independence declaration as required under section 307C of the Corporations Act 2001 has been included
in this Directors’ Report.
Details of the amounts paid to the auditor of the Group, KPMG, and its related practices for audit and non-audit services provided
during the year are set out in Note 7.4 to the financial statements.
ROUNDING OFF
The Company is of a kind referred to in ASIC Corporations (Rounding in Financial/Directors’ Reports) Instrument 2016/191 as
issued by the Australian Securities and Investments Commission (“ASIC”). In accordance with that Instrument, amounts in the
Directors’ Report and financial report have been rounded off to the nearest thousand dollars, unless otherwise stated.
Signed in accordance with a resolution of the directors:
AG Rydge
Director
JM Hastings
Director
Dated at Sydney this 23rd day of August 2018.

D I R E C T O R S ’ R E P O R T
16 EVENT Hospitality & Entertainment Limited – 2018 Annual Report
MESSAGE FROM THE CHAIRMAN REGARDING THE REMUNERATION REPORT
Dear Shareholder
On behalf of the Board, I am pleased to introduce the EVENT Hospitality & Entertainment Limited 2018 Remuneration Report.
Remuneration arrangements for the CEO
Jane Hastings commenced as the Group’s new CEO with effect from 1 July 2017. Ms Hastings’ remuneration arrangements were
set by the Board following advice from remuneration consultants in the prior year and full details of Ms Hastings’ remuneration for
the year ended 30 June 2018 are disclosed in the remuneration table on page 23.
In accordance with the CEO’s contract, a review of Ms Hastings’ remuneration arrangements was conducted by the Board in the
year ended 30 June 2018, including consideration of updated market benchmarking information. Market benchmarking for the
CEO role considers the market capitalisation of the Group and the size, diversity and complexity of the Group’s operations, noting
that by market capitalisation the Group is within the top 150 companies in the All Ordinaries index. Following this review,
reasonable adjustments were made to the CEO’s fixed annual remuneration and maximum short term incentive opportunity with
effect from 1 July 2018. Details of these new arrangements are set out on page 21.
Review of long term incentive arrangements
As foreshadowed in the 2017 Annual Report, the Board conducted a review of the Group’s long term incentive arrangements
during the year ended 30 June 2018, with assistance from remuneration consultants as disclosed on page 22. The review found
that the existing structure of the Executive Performance Rights Plan remained appropriate, and that the hurdles continued to
provide appropriately challenging targets for plan participants and an alignment with shareholder interests. The Board continues
to consider opportunities to further align the Group’s incentive arrangements with the Group’s long-term strategic objectives.
Changes in key management personnel
As CEO, Ms Hastings has reviewed and amended the internal organisational structure and this has resulted in some changes in the
determination of which other executives meet the definition of “key management personnel” requiring disclosure in the
remuneration report. Details of the key management personnel for the year ended 30 June 2018 are set out on page 22.
The Remuneration Report provides further details regarding the above matters as well as important material on remuneration
strategy, structure and outcomes. The Board commends the Remuneration Report to you.
AG Rydge
Chairman

D I R E C T O R S ’ R E P O R T
17 EVENT Hospitality & Entertainment Limited – 2018 Annual Report
REMUNERATION REPORT – AUDITED
This report outlines the remuneration arrangements in place for the Group’s key management personnel (“KMP”) as defined in
AASB 124 Related Party Disclosures including non-executive directors, the CEO (who is also the Managing Director), and other
senior executives who have authority for planning, directing and controlling the activities of the Group. The KMP for the financial
year are set out on page 22.
Remuneration philosophy
The Nomination and Remuneration Committee is responsible for making recommendations to the Board on remuneration policy
and packages applicable to the Board members and senior executives. The objective of the remuneration policy is to ensure the
remuneration package properly reflects the person’s duties and responsibilities, and that remuneration is competitive in
attracting, motivating and retaining people of the appropriate quality.
Remuneration levels are competitively set to attract appropriately qualified and experienced directors and executives. The
Nomination and Remuneration Committee obtains independent advice on the level of remuneration packages. The remuneration
packages of the CEO and senior executives include an at-risk component that is linked to the overall financial and operational
performance of the Group and based on the achievement of specific goals of the Group. Executives participate in the Group’s
Executive Performance Rights Plan. The long term benefits of the Executive Performance Rights Plan are conditional upon the
Group achieving certain performance criteria, details of which are outlined below.
Further details in relation to the Group’s share plans are provided in Note 6.1 to the financial statements.
Remuneration structure
In accordance with best practice corporate governance, the structure of non-executive director remuneration is separate and
distinct from senior executive remuneration.
Non-executive director remuneration
Objective
The Group’s remuneration policy for non-executive directors aims to ensure that the Group can attract, retain and appropriately
remunerate suitably skilled, experienced and committed individuals to serve on the Board and its committees.
Structure
The constitution and the ASX Listing Rules specify that the aggregate remuneration of non-executive directors shall be determined
from time to time by a general meeting. The latest determination was at the Annual General Meeting held on 22 October 2010
when shareholders approved a maximum aggregate remuneration of $1,500,000 per year. Non-executive directors do not receive
any performance related remuneration nor are they issued shares or performance rights.
The amount of aggregate remuneration sought to be approved by shareholders and the manner in which it is apportioned among
directors are reviewed annually. The Board considers advice from external consultants as well as the fees paid to non-executive
directors of comparable companies when undertaking the annual review process.
Each director receives a fee for being a director of the Company. A committee fee is also paid for being a member of the Audit and
Risk Committee and the Nomination and Remuneration Committee. The payment of the committee fee recognises the additional
time commitment required by directors who serve on those committees. Other Board committees may be appointed from time to
time to deal with issues associated with the conduct of the Group’s various activities, and directors serving on such committees
may receive an additional fee in recognition of this additional commitment.
The Board has approved non-executive director fees for the year ending 30 June 2019 as follows:
2019
$
2018
$
Chairman (including committee fees) 328,000 321,000
Other non-executive directors
Base fee 134,000 131,000
Committee fee 21,000 21,000
Additional fee for the Chairman of the Board committees 18,000 18,000

D I R E C T O R S ’ R E P O R T
18 EVENT Hospitality & Entertainment Limited – 2018 Annual Report
Structure (continued)
The remuneration of non-executive directors for the year ended 30 June 2018 is detailed on page 23.
Directors’ fees cover all main Board activities. Non-executive directors are also entitled to be reimbursed for all reasonable
business related expenses, including travel, as may be incurred in the discharge of their duties.
CEO and other executive remuneration
Objective
The Group’s remuneration policy aims to reward the CEO and other executives with a level and mix of remuneration
commensurate with their position and responsibilities within the Group, and to:
• reward executives for Group, business unit and individual performance against targets set by reference to appropriate
benchmarks and key performance indicators (“KPIs”);
• align the interests of executives with those of shareholders;
• link reward with the strategic goals and performance of the Group; and
• ensure total remuneration is competitive by market standards.
Structure
In determining the level and composition of executive remuneration, the Nomination and Remuneration Committee obtains
independent advice on the appropriateness of remuneration packages for senior executives, based on remuneration trends in the
market, from which recommendations are made to the Board.
It is the Group’s policy that employment contracts are entered into with the CEO and other senior executives. Details of these
employment contracts are provided on page 21.
Remuneration consists of both fixed and variable remuneration components. The variable remuneration component includes a
short term incentive (“STI”) plan and a long term incentive (“LTI”) plan. The proportion of fixed and variable remuneration
(potential STI and LTI) is set and approved for each senior executive by the Nomination and Remuneration Committee.
Fixed annual remuneration
Objective
Remuneration levels for executives are reviewed annually to ensure that they are appropriate for the responsibilities,
qualifications and experience of each executive and are competitive with the market.
The Nomination and Remuneration Committee establishes and issues an appropriate guideline for the purpose of the annual
review of fixed annual remuneration levels. The guideline is based on both current and forecast Consumer Price Index and market
conditions. There are no guaranteed fixed remuneration increases in any executives’ contracts.
Structure
Executives have the option to receive their fixed annual remuneration in cash and a limited range of prescribed fringe benefits
such as motor vehicles and car parking. Fixed annual remuneration includes superannuation and all prescribed fringe benefits,
including fringe benefits tax.
Variable remuneration – STI
Objective
The objective of the STI program is to link the achievement of the operational targets with the remuneration received by the
executives charged with meeting those targets. The total potential STI available is set at a level to provide sufficient incentive to
the executive to achieve the operational targets and such that the cost to the Group is reasonable in the circumstances.
Structure
Actual STI payments to each executive are determined based on the extent to which specific operating targets, set at the
beginning of the year, are met. The operational targets consist of a number of KPIs covering both financial and non-financial
measures of performance. Typically, KPIs and assessment criteria include:
• meeting of pre-determined growth in Group earnings over the prior year;
• meeting of strategic and operational objectives; and
• assessed personal effort and contribution.
The Group has pre-determined benchmarks which must be met in order to trigger payments under the STI. The measures were
chosen to directly align the individual’s STI to the KPIs of the Group and to its strategies and performance.

D I R E C T O R S ’ R E P O R T
19 EVENT Hospitality & Entertainment Limited – 2018 Annual Report
Structure (continued)
On an annual basis, an earnings performance rating for the Group and each division is assessed and approved by the Nomination
and Remuneration Committee. The individual performance of each executive is also assessed and rated and the ratings are taken
into account when determining the amount, if any, of the STI to be allocated to each executive.
The aggregate of annual STI payments available for executives across the Group is subject to the approval of the Nomination and
Remuneration Committee. STI payments are delivered as a cash bonus.
For the CEO and other executive KMP, the general target bonus opportunity range is from 50% to 80% of fixed annual
remuneration. The target bonus range for the CEO and other executive KMP is detailed below:
Maximum STI calculated
on fixed annual
remuneration(a)
Allocated between:
Group
earnings
Divisional
earnings
Special
projects
Other
KPIs
Managing Director and CEO
JM Hastings (b) 80% 40% – 20% 20%
Other executive KMP
NC Arundel 50% 15% 20% – 15%
GC Dean 50% 25% – – 25%
MR Duff 50% 25% – 11% 14%
HR Eberstaller 50% 16.7% 16.7% 4% 12.6%
JM Rodgers 50% 15% 20% – 15%
(a) Fixed annual remuneration is comprised of base salary, superannuation and benefits provided through salary sacrificing arrangements.
(b) The targets set for the CEO’s STI relate to the Group’s performance, the management of current property developments and other business growth targets.
These targets may include, for example, the identification of new hotel developments that will provide an acceptable return and fit within the Group’s overall
strategic objectives, the delivery of property development projects having regard to timing and budget, and the identification, negotiation and delivery of
new cinema sites. The Board considers the specific targets to be commercially sensitive and accordingly further details of these targets have not been
disclosed.
Bonuses may be paid above these levels at the discretion of the Nomination and Remuneration Committee and the Board, if it is
assessed that an exceptional contribution has been made by an executive. There is no separate profit-share plan.
Variable remuneration – LTI
Objective
The objectives of the LTI plan are to:
• align executive incentives with shareholder interests;
• balance the short term with the long term Group focus; and
• retain high calibre executives by providing an attractive equity-based incentive that builds an ownership of the Group
mindset.
Structure
Executives are awarded performance rights which will only vest on the achievement of certain performance hurdles and service
conditions. An offer is made under the Executive Performance Rights Plan to executives each financial year and is based on
individual performance as assessed by the annual appraisal process. If an executive does not sustain a consistent level of high
performance, they will not be nominated for Executive Performance Rights Plan participation. The Nomination and Remuneration
Committee reviews details of executives nominated for participation subject to final Board approval. In accordance with the ASX
Listing Rules, approval from shareholders is obtained before participation in the Executive Performance Rights Plan commences
for the CEO.
Only executives who are able to directly influence the long term success of the Group participate in the Executive Performance
Rights Plan.

D I R E C T O R S ’ R E P O R T
20 EVENT Hospitality & Entertainment Limited – 2018 Annual Report
Structure (continued)
Each award of performance rights is divided into equal portions, with each portion being subject to a different performance
hurdle. The performance hurdles are based on earnings per share (“EPS”) growth and relative total shareholder return (“TSR”) of
EVENT Hospitality & Entertainment Limited as determined by the Board over a three year period (“Performance Period”). The
extent to which the performance hurdles have been met will be assessed by the Board at the expiry of the Performance Period.
Performance rights do not carry the right to vote or to receive dividends during the Performance Period.
The performance hurdles for the awards of performance rights to executives in the financial year ended 30 June 2018 are based
on EVENT Hospitality & Entertainment Limited’s EPS growth and relative TSR performance over the Performance Period of the
three years to 30 June 2020, with EPS performance measured against the year ended 30 June 2017 (being the base year).
The performance hurdles for the awards of performance rights to executives in the financial year ended 30 June 2018 are as
follows:
EPS hurdle
The EPS hurdle requires that the Group’s EPS growth for the Performance Period must be greater than the target set by the Board.
The EPS hurdle was chosen as it provides evidence of the Group’s growth in earnings. The hurdle is as follows:
• if annual compound EPS growth over the Performance Period is less than 4%, no performance rights will vest with the
executive;
• if annual compound EPS growth over the Performance Period is equal to or greater than 4% but less than 6%, the proportion
of performance rights vesting will be increased on a pro-rata basis between 50% and 100%; or
• if annual compound EPS growth over the Performance Period is equal to or greater than 6%, all of the performance rights
awarded (and attaching to this hurdle) will vest with the executive.
TSR hurdle
The TSR hurdle requires that the Group’s relative TSR performance must be above the median of the Company’s comparator
group (“comparator group”). The comparator group is the S&P/ASX 200 (excluding trusts, infrastructure groups and mining
companies). TSR is defined as share price growth and dividends paid and reinvested on the ex-dividend date (adjusted for rights,
bonus issues and any capital reconstructions) measured from the beginning to the end of the Performance Period.
The TSR performance hurdle was chosen as it is widely recognised as one of the best indicators of shareholder value creation. The
comparator group for TSR purposes has been chosen as it represents the group with which the Group competes for shareholders’
capital. The hurdle is as follows:
• if the Company’s TSR ranking relative to the comparator group over the Performance Period is less than the 51st percentile,
no performance rights will vest;
• if the Company’s TSR ranking relative to the comparator group over the Performance Period is equal to or exceeds the 51st
percentile but is less than the 75th percentile, the proportion of performance rights vesting will be increased on a pro-rata
basis between 50% and 100%; or
• if the Company’s TSR ranking relative to the comparator group over the Performance Period is equal to or greater than the
75th percentile, all of the performance rights awarded will vest.
After the Board has assessed the extent to which the above performance hurdles and criteria have been achieved, executives will
be allocated ordinary shares equal to the number of vested performance rights held.
The Board has retained the discretion to vary the performance hurdles and criteria.
Group performance
To provide further context on the Group’s performance and returns for shareholders, the following table outlines a 5 year history
of key financial metrics:
2018 2017 2016 2015 2014
Net profit before individually
significant items and income tax ($)(a) 183,214,000 160,937,000 177,914,000 152,367,000 108,304,000
Dividends per share (cents) 52 51 51 45 42
Special dividend per share (cents) – – – 8 –
Share price at year end ($) 13.39 13.37 14.53 12.54 9.33
(a) Refer to page 6 in the Directors’ Report for a reconciliation to reported net profit for the year.

D I R E C T O R S ’ R E P O R T
21 EVENT Hospitality & Entertainment Limited – 2018 Annual Report
Employment contract for the CEO and other executive KMP
A summary of the key terms of Ms Hastings’ employment agreement is set out in the table below:
Contract term Ms Hastings’ appointment is ongoing, and there is no fixed term.
Fixed annual
remuneration
Effective from 1 July 2018, a remuneration package to the value of $1,450,000 per annum gross, comprising
base salary, superannuation and, if applicable, any fringe benefits or additional superannuation contributions.
Incentives Ms Hastings is eligible to participate in the Group’s incentive arrangements (including STI and LTI).
Ms Hastings is eligible to receive an annual STI bonus payment with a target award of up to 80% of her fixed
annual remuneration, subject to the achievement of performance criteria determined by the Board. The
maximum award to Ms Hastings under the STI plan is 90% of fixed annual remuneration.
Ms Hastings is also eligible to participate in the Group’s Long Term Incentive Plan (“LTIP”). The current LTIP is
the Performance Rights Plan approved by shareholders at the 2013 Annual General Meeting. Subject to any
required or appropriate shareholder approval, Ms Hastings’ allocation of performance rights under the LTIP will
be determined based on a face value of 90% of the fixed annual remuneration.
Termination Either party may terminate the agreement at any time by giving six months’ notice.
On termination, the Group may at its discretion make a payment in lieu of all or part of the notice period based
on Ms Hastings’ fixed annual remuneration at the time of the notice of termination.
Ms Hastings may terminate immediately if there is a fundamental change in her responsibilities or authority
without her consent. In that case, Ms Hastings is entitled to a payment equivalent to six months’ fixed annual
remuneration.
The Group may terminate the agreement immediately in circumstances of misconduct, or if Ms Hastings
breaches any material term of the agreement, in which case there is no payment in lieu of notice.
Restraint The agreement contains non-solicitation and other restraints that apply for a restriction period of up to 12
months. Ms Hastings may receive a restraint payment for some or all of the restriction period, calculated based
on her fixed annual remuneration at the termination date.
The CEO’s contract provides for an annual review of the CEO’s fixed annual remuneration and maximum incentive opportunities.
Employment contracts typically outline the components of remuneration paid to the CEO and other senior executives but do not
prescribe how remuneration levels are to be modified from year to year. Generally, remuneration levels are reviewed each year to
take into account Consumer Price Index changes, remuneration trends in the market, any change in the scope of the role
performed by the executive and any changes required to meet the principles of the remuneration policy.
Termination provisions in the employment contracts with other executive KMP are summarised in the table below:
Executive
Termination by
the executive
Termination by the Group
Expiry date of
contract
NC Arundel
GC Dean
MR Duff
HR Eberstaller
JM Rodgers
The notice
period is one
month.
The notice period is one month. On termination, the Group
may make a payment in lieu of notice, equal to the notice
period.
The Group retains the right to terminate the contract
immediately under certain conditions. On termination, the
executive is entitled to accrued annual and long service
benefits. There are no other termination payments.
Payment of any LTI (or pro-rata thereof) is subject to the
rules in operation at the termination date and at the
discretion of the Board.
Not applicable,
rolling contracts.
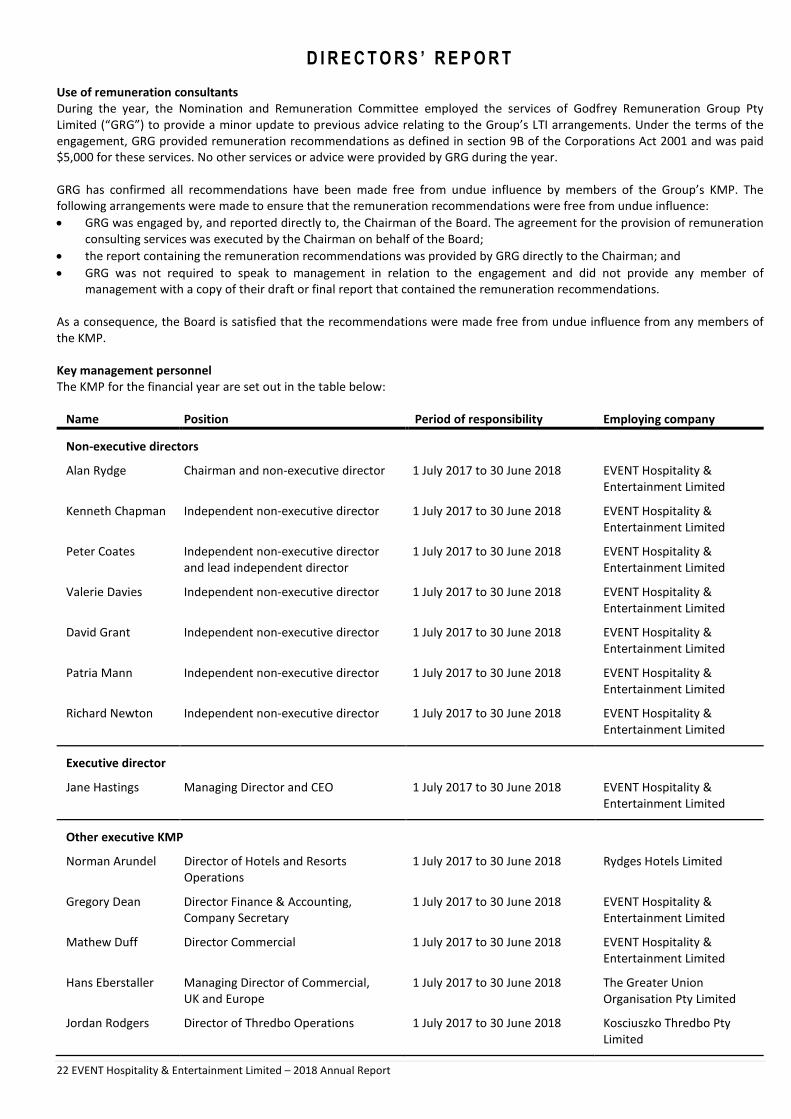
D I R E C T O R S ’ R E P O R T
22 EVENT Hospitality & Entertainment Limited – 2018 Annual Report
Use of remuneration consultants
During the year, the Nomination and Remuneration Committee employed the services of Godfrey Remuneration Group Pty
Limited (“GRG”) to provide a minor update to previous advice relating to the Group’s LTI arrangements. Under the terms of the
engagement, GRG provided remuneration recommendations as defined in section 9B of the Corporations Act 2001 and was paid
$5,000 for these services. No other services or advice were provided by GRG during the year.
GRG has confirmed all recommendations have been made free from undue influence by members of the Group’s KMP. The
following arrangements were made to ensure that the remuneration recommendations were free from undue influence:
• GRG was engaged by, and reported directly to, the Chairman of the Board. The agreement for the provision of remuneration
consulting services was executed by the Chairman on behalf of the Board;
• the report containing the remuneration recommendations was provided by GRG directly to the Chairman; and
• GRG was not required to speak to management in relation to the engagement and did not provide any member of
management with a copy of their draft or final report that contained the remuneration recommendations.
As a consequence, the Board is satisfied that the recommendations were made free from undue influence from any members of
the KMP.
Key management personnel
The KMP for the financial year are set out in the table below:
Name
Position
Period of responsibility
Employing company
Non-executive directors
Alan Rydge Chairman and non-executive director 1 July 2017 to 30 June 2018 EVENT Hospitality &
Entertainment Limited
Kenneth Chapman Independent non-executive director 1 July 2017 to 30 June 2018 EVENT Hospitality &
Entertainment Limited
Peter Coates Independent non-executive director
and lead independent director
1 July 2017 to 30 June 2018 EVENT Hospitality &
Entertainment Limited
Valerie Davies Independent non-executive director 1 July 2017 to 30 June 2018 EVENT Hospitality &
Entertainment Limited
David Grant Independent non-executive director 1 July 2017 to 30 June 2018 EVENT Hospitality &
Entertainment Limited
Patria Mann Independent non-executive director 1 July 2017 to 30 June 2018 EVENT Hospitality &
Entertainment Limited
Richard Newton Independent non-executive director 1 July 2017 to 30 June 2018 EVENT Hospitality &
Entertainment Limited
Executive director
Jane Hastings Managing Director and CEO
1 July 2017 to 30 June 2018 EVENT Hospitality &
Entertainment Limited
Other executive KMP
Norman Arundel Director of Hotels and Resorts
Operations
1 July 2017 to 30 June 2018 Rydges Hotels Limited
Gregory Dean Director Finance & Accounting,
Company Secretary
1 July 2017 to 30 June 2018 EVENT Hospitality &
Entertainment Limited
Mathew Duff Director Commercial 1 July 2017 to 30 June 2018 EVENT Hospitality &
Entertainment Limited
Hans Eberstaller Managing Director of Commercial,
UK and Europe
1 July 2017 to 30 June 2018 The Greater Union
Organisation Pty Limited
Jordan Rodgers Director of Thredbo Operations 1 July 2017 to 30 June 2018 Kosciuszko Thredbo Pty
Limited

DIR
EC
TO
RS
’ R
EP
OR
T
23
EV
EN
T H
osp
ita
lity
& E
nte
rta
inm
en
t Li
mit
ed
– 2
01
8 A
nn
ua
l Re
po
rt
Dir
ect
ors
’ a
nd
exe
cuti
ve
s’ r
em
un
era
tio
n
De
tails
of
the
na
ture
an
d a
mo
un
t o
f e
ach
ma
jor
ele
me
nt
of
the
re
mu
ne
rati
on
of
ea
ch d
ire
cto
r o
f th
e C
om
pa
ny
an
d o
the
r K
MP
of
the
Gro
up
are
se
t o
ut
be
low
:
Sh
ort
te
rm
Po
st-
em
plo
ym
en
t S
ha
re-b
ase
d
Oth
er
lon
g t
erm
O
the
r T
ota
l P
rop
ort
ion
of
rem
un
era
tio
n
pe
rfo
rma
nce
rela
ted
Fix
ed
an
nu
al
rem
un
era
tio
n a
nd
fee
s $
ST
I
bo
nu
ses $
No
n-c
ash
be
ne
fits
$
Insu
ran
ce
pre
miu
ms(a
) $
Su
pe
ran
nu
ati
on
con
trib
uti
on
s $
Pe
rfo
rma
nce
rig
hts
(b) $
Acc
rue
d a
nn
ua
l
lea
ve
$
Acc
rue
d l
on
g
serv
ice
le
av
e
$
Te
rmin
ati
on
pa
ym
en
ts
$
$
DIR
EC
TO
RS
No
n-e
xe
cuti
ve
AG
Ryd
ge
2
01
8
30
0,9
51
–
–
–
2
0,0
49
–
–
–
–
3
21
,00
0
–
2
01
7
29
3,3
84
–
–
–
1
9,6
16
–
–
–
–
3
13
,00
0
–
KG
Ch
ap
ma
n
20
18
1
19
,63
5
–
–
–
11
,36
5
–
–
–
–
13
1,0
00
–
2
01
7
11
6,8
95
–
–
–
1
1,1
05
–
–
–
–
1
28
,00
0
–
PR
Co
ate
s 2
01
8
11
9,6
35
–
–
–
1
1,3
65
–
–
–
–
1
31
,00
0
–
2
01
7
11
6,8
95
–
–
–
1
1,1
05
–
–
–
–
1
28
,00
0
–
VA
Da
vie
s 2
01
8
11
9,6
35
–
–
–
1
1,3
65
–
–
–
–
1
31
,00
0
–
2
01
7
11
6,8
95
–
–
–
1
1,1
05
–
–
–
–
1
28
,00
0
–
DC
Gra
nt
20
18
1
55
,25
1
–
–
–
14
,74
9
–
–
–
–
17
0,0
00
–
2
01
7
15
1,5
98
–
–
–
1
4,4
02
–
–
–
–
1
66
,00
0
–
PM
Ma
nn
2
01
8
13
8,8
13
–
–
–
1
3,1
87
–
–
–
–
1
52
,00
0
–
2
01
7
13
5,1
60
–
–
–
1
2,8
40
–
–
–
–
1
48
,00
0
–
RG
Ne
wto
n
20
18
1
19
,63
5
–
–
–
11
,36
5
–
–
–
–
13
1,0
00
–
2
01
7
11
6,8
95
–
–
–
1
1,1
05
–
–
–
–
1
28
,00
0
–
Ex
ecu
tiv
e
JM H
ast
ing
s(c)
20
18
1
,27
9,9
51
1
43
,05
1
–
2,8
85
2
0,0
49
1
95
,37
6
41
,64
7
–
–
1,6
82
,95
9
20
.1%
2
01
7
73
5,5
88
–
–
1
,65
0
17
,31
1
31
,87
7
21
,63
4
–
–
80
8,0
60
3
.9%

DIR
EC
TO
RS
’ R
EP
OR
T
24
EV
EN
T H
osp
ita
lity
& E
nte
rta
inm
en
t Li
mit
ed
– 2
01
8 A
nn
ua
l Re
po
rt
Dir
ect
ors
’ a
nd
exe
cuti
ve
s’ r
em
un
era
tio
n (
con
tin
ue
d)
Sh
ort
te
rm
Po
st-
em
plo
ym
en
t S
ha
re-b
ase
d
Oth
er
lon
g t
erm
O
the
r T
ota
l
Fix
ed
an
nu
al
rem
un
era
tio
n a
nd
fee
s $
ST
I
bo
nu
ses $
No
n-c
ash
be
ne
fits
$
Insu
ran
ce
pre
miu
ms(a
) $
Su
pe
ran
nu
ati
on
con
trib
uti
on
s $
Pe
rfo
rma
nce
rig
hts
(b) $
Acc
rue
d a
nn
ua
l
lea
ve
$
Acc
rue
d l
on
g
serv
ice
le
av
e
$
Te
rmin
ati
on
pa
ym
en
ts
$
$
Pro
po
rtio
n o
f
rem
un
era
tio
n
pe
rfo
rma
nce
rela
ted
OT
HE
R E
XE
CU
TIV
E K
MP
NC
Aru
nd
el (
d)
20
18
4
79
,41
5
65
,05
0
–
8,2
87
2
0,0
49
1
48
,07
8
13
,95
1
(5,3
41
) –
7
29
,48
9
29
.2%
2
01
7
72
,66
0
10
5,7
50
–
1
,04
6
3,0
43
3
0,3
70
5
,08
7
1,5
27
–
2
19
,48
3
62
.0%
GC
De
an
2
01
8
62
9,9
51
7
6,2
50
–
6
,88
6
20
,04
9
21
0,7
26
(3
0,9
92
) 1
7,3
26
–
9
30
,19
6
30
.9%
2
01
7
59
0,3
84
2
82
,50
0
–
5,2
41
1
9,6
16
2
15
,96
1
(13
,41
9)
24
,51
8
–
1,1
24
,80
1
44
.3%
MR
Du
ff
20
18
6
29
,95
1
11
6,9
52
–
5
,16
3
20
,04
9
21
2,3
84
9
0,5
26
1
7,5
37
–
1
,09
2,5
62
3
0.1
%
2
01
7
59
0,3
84
2
63
,68
6
–
3,8
48
1
9,6
16
2
23
,38
0
8,5
63
2
5,0
99
–
1
,13
4,5
76
4
2.9
%
HR
Eb
ers
talle
r 2
01
8
36
7,5
41
6
3,3
08
–
2
,76
2
20
,04
9
10
9,4
40
(6
,36
2)
11
,70
4
–
56
8,4
42
3
0.4
%
2
01
7
36
0,3
84
1
85
,00
0
–
2,1
83
1
9,6
16
1
24
,24
0
(41
,03
6)
(35
,59
9)
–
61
4,7
88
5
0.3
%
JM R
od
ge
rs(e
) 2
01
8
42
9,9
51
1
19
,53
1
–
2,7
62
2
0,0
49
1
09
,94
9
1,0
65
9
,49
4
–
69
2,8
01
3
3.1
%
2
01
7
–
–
–
–
–
–
–
–
–
–
–
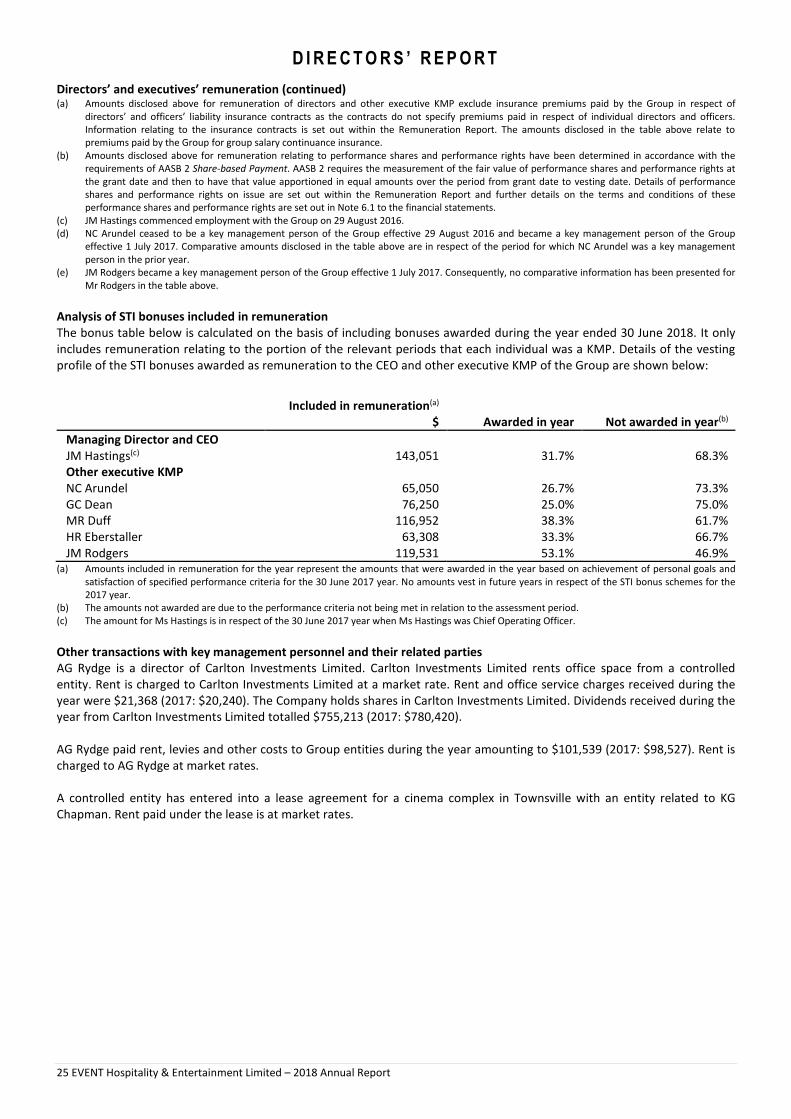
D I R E C T O R S ’ R E P O R T
25 EVENT Hospitality & Entertainment Limited – 2018 Annual Report
Directors’ and executives’ remuneration (continued) (a) Amounts disclosed above for remuneration of directors and other executive KMP exclude insurance premiums paid by the Group in respect of
directors’ and officers’ liability insurance contracts as the contracts do not specify premiums paid in respect of individual directors and officers.
Information relating to the insurance contracts is set out within the Remuneration Report. The amounts disclosed in the table above relate to
premiums paid by the Group for group salary continuance insurance.
(b) Amounts disclosed above for remuneration relating to performance shares and performance rights have been determined in accordance with the
requirements of AASB 2 Share-based Payment. AASB 2 requires the measurement of the fair value of performance shares and performance rights at
the grant date and then to have that value apportioned in equal amounts over the period from grant date to vesting date. Details of performance
shares and performance rights on issue are set out within the Remuneration Report and further details on the terms and conditions of these
performance shares and performance rights are set out in Note 6.1 to the financial statements.
(c) JM Hastings commenced employment with the Group on 29 August 2016.
(d) NC Arundel ceased to be a key management person of the Group effective 29 August 2016 and became a key management person of the Group
effective 1 July 2017. Comparative amounts disclosed in the table above are in respect of the period for which NC Arundel was a key management
person in the prior year.
(e) JM Rodgers became a key management person of the Group effective 1 July 2017. Consequently, no comparative information has been presented for
Mr Rodgers in the table above.
Analysis of STI bonuses included in remuneration
The bonus table below is calculated on the basis of including bonuses awarded during the year ended 30 June 2018. It only
includes remuneration relating to the portion of the relevant periods that each individual was a KMP. Details of the vesting
profile of the STI bonuses awarded as remuneration to the CEO and other executive KMP of the Group are shown below:
Included in remuneration(a)
$ Awarded in year Not awarded in year(b)
Managing Director and CEO
JM Hastings(c) 143,051 31.7% 68.3%
Other executive KMP
NC Arundel 65,050 26.7% 73.3%
GC Dean 76,250 25.0% 75.0%
MR Duff 116,952 38.3% 61.7%
HR Eberstaller 63,308 33.3% 66.7%
JM Rodgers 119,531 53.1% 46.9% (a) Amounts included in remuneration for the year represent the amounts that were awarded in the year based on achievement of personal goals and
satisfaction of specified performance criteria for the 30 June 2017 year. No amounts vest in future years in respect of the STI bonus schemes for the
2017 year.
(b) The amounts not awarded are due to the performance criteria not being met in relation to the assessment period.
(c) The amount for Ms Hastings is in respect of the 30 June 2017 year when Ms Hastings was Chief Operating Officer.
Other transactions with key management personnel and their related parties
AG Rydge is a director of Carlton Investments Limited. Carlton Investments Limited rents office space from a controlled
entity. Rent is charged to Carlton Investments Limited at a market rate. Rent and office service charges received during the
year were $21,368 (2017: $20,240). The Company holds shares in Carlton Investments Limited. Dividends received during the
year from Carlton Investments Limited totalled $755,213 (2017: $780,420).
AG Rydge paid rent, levies and other costs to Group entities during the year amounting to $101,539 (2017: $98,527). Rent is
charged to AG Rydge at market rates.
A controlled entity has entered into a lease agreement for a cinema complex in Townsville with an entity related to KG
Chapman. Rent paid under the lease is at market rates.
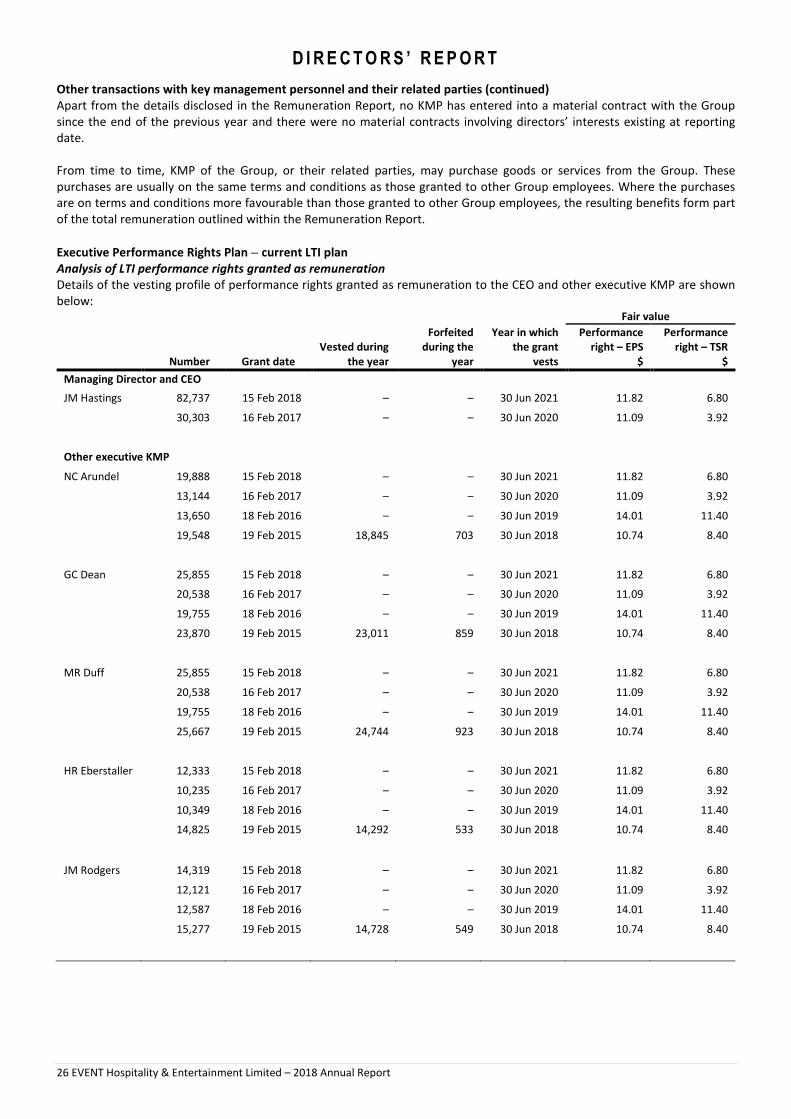
D I R E C T O R S ’ R E P O R T
26 EVENT Hospitality & Entertainment Limited – 2018 Annual Report
Other transactions with key management personnel and their related parties (continued)
Apart from the details disclosed in the Remuneration Report, no KMP has entered into a material contract with the Group
since the end of the previous year and there were no material contracts involving directors’ interests existing at reporting
date.
From time to time, KMP of the Group, or their related parties, may purchase goods or services from the Group. These
purchases are usually on the same terms and conditions as those granted to other Group employees. Where the purchases
are on terms and conditions more favourable than those granted to other Group employees, the resulting benefits form part
of the total remuneration outlined within the Remuneration Report.
Executive Performance Rights Plan − current LTI plan
Analysis of LTI performance rights granted as remuneration
Details of the vesting profile of performance rights granted as remuneration to the CEO and other executive KMP are shown
below: Fair value
Number Grant date
Vested during
the year
Forfeited
during the
year
Year in which
the grant
vests
Performance
right – EPS
$
Performance
right – TSR
$
Managing Director and CEO
JM Hastings 82,737 15 Feb 2018 – – 30 Jun 2021 11.82 6.80
30,303 16 Feb 2017 – – 30 Jun 2020 11.09 3.92
Other executive KMP
NC Arundel 19,888 15 Feb 2018 – – 30 Jun 2021 11.82 6.80
13,144 16 Feb 2017 – – 30 Jun 2020 11.09 3.92
13,650 18 Feb 2016 – – 30 Jun 2019 14.01 11.40
19,548 19 Feb 2015 18,845 703 30 Jun 2018 10.74 8.40
GC Dean 25,855 15 Feb 2018 – – 30 Jun 2021 11.82 6.80
20,538 16 Feb 2017 – – 30 Jun 2020 11.09 3.92
19,755 18 Feb 2016 – – 30 Jun 2019 14.01 11.40
23,870 19 Feb 2015 23,011 859 30 Jun 2018 10.74 8.40
MR Duff 25,855 15 Feb 2018 – – 30 Jun 2021 11.82 6.80
20,538 16 Feb 2017 – – 30 Jun 2020 11.09 3.92
19,755 18 Feb 2016 – – 30 Jun 2019 14.01 11.40
25,667 19 Feb 2015 24,744 923 30 Jun 2018 10.74 8.40
HR Eberstaller 12,333 15 Feb 2018 – – 30 Jun 2021 11.82 6.80
10,235 16 Feb 2017 – – 30 Jun 2020 11.09 3.92
10,349 18 Feb 2016 – – 30 Jun 2019 14.01 11.40
14,825 19 Feb 2015 14,292 533 30 Jun 2018 10.74 8.40
JM Rodgers 14,319 15 Feb 2018 – – 30 Jun 2021 11.82 6.80
12,121 16 Feb 2017 – – 30 Jun 2020 11.09 3.92
12,587 18 Feb 2016 – – 30 Jun 2019 14.01 11.40
15,277 19 Feb 2015 14,728 549 30 Jun 2018 10.74 8.40

D I R E C T O R S ’ R E P O R T
27 EVENT Hospitality & Entertainment Limited – 2018 Annual Report
Executive Performance Rights Plan − current LTI plan (continued)
Analysis of movements in performance rights
The movement during the year, by value, of performance rights in the Company held by the CEO and other executive KMP is
detailed below:
Granted during
the year (a)
$
Exercised during
the year
$
Performance
rights exercised
Number
Amount paid per
right exercised
$
Managing Director and CEO
JM Hastings 770,279 – – –
Other executive KMP
NC Arundel 185,157 243,654 18,845 –
GC Dean 240,708 297,518 23,011 –
MR Duff 240,708 319,924 24,744 –
HR Eberstaller 114,818 184,786 14,292 –
JM Rodgers 133,307 190,424 14,728 –
(a) The value of performance rights granted in the year is the fair value of the performance rights calculated at grant date, estimated using a Binomial
tree model for those rights that have EPS hurdles and a Monte Carlo model for those rights that have TSR hurdles. The total value of the performance
rights granted is included in the table above. This amount is allocated to remuneration over the vesting period.
No performance rights have been granted since the end of the year.
Performance rights holdings and transactions
The movement during the year in the number of performance rights in EVENT Hospitality & Entertainment Limited held by
the CEO and other executive KMP is detailed below:
Held at
the beginning of
the year
Granted
Exercised
Forfeited
Other
Held at
the end of
the year
Managing Director and CEO
JM Hastings 2018 30,303 82,737 – – – 113,040
2017 – 30,303 – – – 30,303
Other executive KMP
NC Arundel 2018 46,342 19,888 (18,845) (703) – 46,682
2017 56,083 13,144 (22,885) – – 46,342
GC Dean 2018 64,163 25,855 (23,011) (859) – 66,148
2017 64,981 20,538 (21,356) – – 64,163
MR Duff 2018 65,960 25,855 (24,744) (923) – 66,148
2017 68,405 20,538 (22,983) – – 65,960
HR Eberstaller 2018 35,409 12,333 (14,292) (533) – 32,917
2017 42,485 10,235 (17,311) – – 35,409
JM Rodgers 2018 39,985 14,319 (14,728) (549) – 39,027
2017 45,718 12,121 (17,854) – – 39,985
No performance rights have been granted since the end of the year. No performance rights are held by any related parties of
KMP.

D I R E C T O R S ’ R E P O R T
28 EVENT Hospitality & Entertainment Limited – 2018 Annual Report
Executive Performance Share Plan − previous LTI plan
Performance shares exercised during the year
Details of performance shares in the Company exercised during the year by the CEO and other executive KMP are shown
below:
Exercised during
the year(a)
$
Performance
shares exercised
Number
Amount paid per
performance share
$
Managing Director and CEO
JM Hastings – – –
Other executive KMP
NC Arundel – – –
GC Dean – – –
MR Duff 149,251 11,105 Nil
HR Eberstaller 145,716 10,842 Nil
JM Rodgers – – –
(a) The value of performance shares exercised during the year is calculated as the market price of shares of the Company on the ASX as at close of trading
on the date that the performance shares were exercised.
Performance share holdings and transactions
The movement during the year in the number of performance shares in EVENT Hospitality & Entertainment Limited held by
the CEO and other executive KMP is detailed below:
Held at
the beginning
of the year
Granted
Exercised
Forfeited
Other
Held at
the end of
the year
Managing Director and CEO
JM Hastings 2018 – – – – – –
2017 – – – – – –
Other executive KMP
NC Arundel 2018 23,502 – – – – 23,502
2017 23,502 – – – – 23,502
GC Dean 2018 – – – – – –
2017 – – – – – –
MR Duff 2018 47,048 – (11,105) – – 35,943
2017 85,665 – (38,617) – – 47,048
HR Eberstaller 2018 26,614 – (10,842) – – 15,772
2017 35,529 – (8,915) – – 26,614
JM Rodgers 2018 – – – – – –
2017 – – – – – –
No performance shares have been granted since the end of the year. There were no performance shares held by the related
parties of KMP.
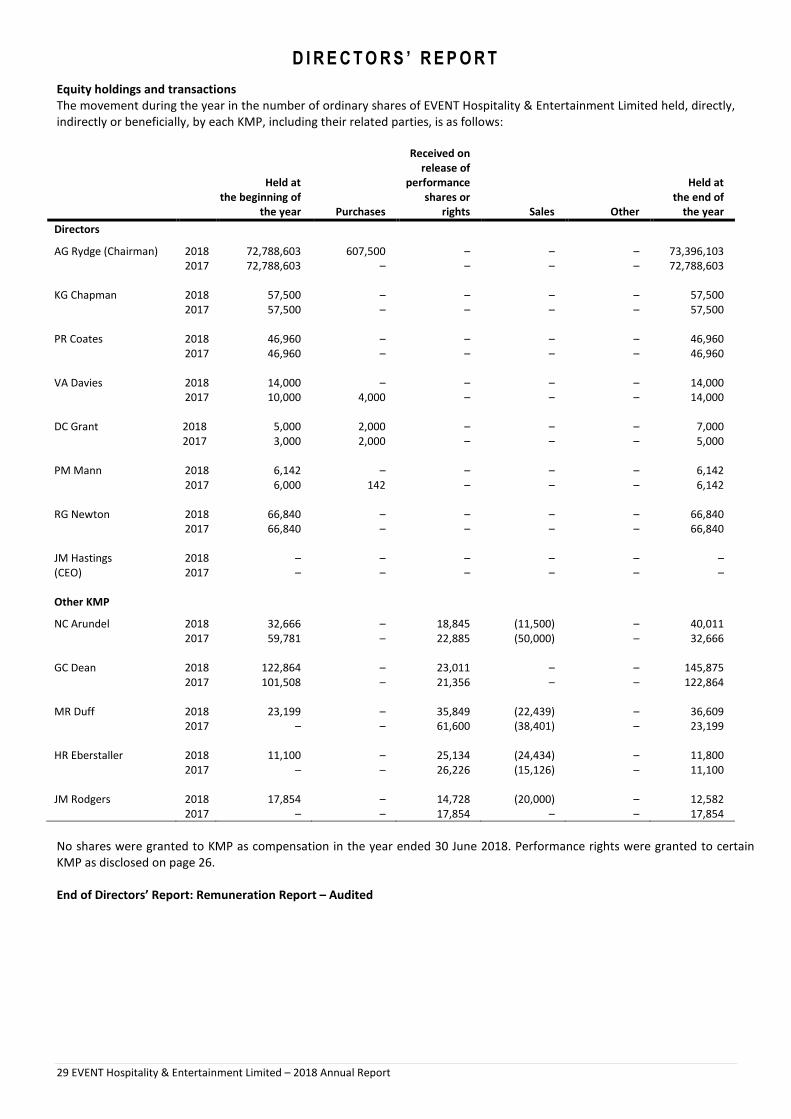
D I R E C T O R S ’ R E P O R T
29 EVENT Hospitality & Entertainment Limited – 2018 Annual Report
Equity holdings and transactions
The movement during the year in the number of ordinary shares of EVENT Hospitality & Entertainment Limited held, directly,
indirectly or beneficially, by each KMP, including their related parties, is as follows:
Held at
the beginning of
the year Purchases
Received on
release of
performance
shares or
rights Sales Other
Held at
the end of
the year
Directors
AG Rydge (Chairman) 2018 72,788,603 607,500 – – – 73,396,103
2017 72,788,603 – – – – 72,788,603
KG Chapman 2018 57,500 – – – – 57,500
2017 57,500 – – – – 57,500
PR Coates 2018 46,960 – – – – 46,960
2017 46,960 – – – – 46,960
VA Davies 2018 14,000 – – – – 14,000
2017 10,000 4,000 – – – 14,000
DC Grant 2018 5,000 2,000 – – – 7,000
2017 3,000 2,000 – – – 5,000
PM Mann 2018 6,142 – – – – 6,142
2017 6,000 142 – – – 6,142
RG Newton 2018 66,840 – – – – 66,840
2017 66,840 – – – – 66,840
JM Hastings 2018 – – – – – –
(CEO) 2017 – – – – – –
Other KMP
NC Arundel 2018 32,666 – 18,845 (11,500) – 40,011
2017 59,781 – 22,885 (50,000) – 32,666
GC Dean 2018 122,864 – 23,011 – – 145,875
2017 101,508 – 21,356 – – 122,864
MR Duff 2018 23,199 – 35,849 (22,439) – 36,609
2017 – – 61,600 (38,401) – 23,199
HR Eberstaller 2018 11,100 – 25,134 (24,434) – 11,800
2017 – – 26,226 (15,126) – 11,100
JM Rodgers 2018 17,854 – 14,728 (20,000) – 12,582
2017 – – 17,854 – – 17,854
No shares were granted to KMP as compensation in the year ended 30 June 2018. Performance rights were granted to certain
KMP as disclosed on page 26.
End of Directors’ Report: Remuneration Report – Audited

30
KPMG, an Australian partnership and a member firm of the KPMG network of independent member firms affiliated with KPMG International Cooperative (“KPMG International”), a Swiss entity.
Liability limited by a scheme approved under Professional Standards Legislation.
Lead Auditor’s Independence Declaration under
Section 307C of the Corporations Act 2001
To the Directors of Event Hospitality & Entertainment Limited
I declare that, to the best of my knowledge and belief, in relation to the audit of Event Hospitality & Entertainment Limited for
the financial year ended 30 June 2018 there have been:
(i) no contraventions of the auditor independence requirements as set out in the Corporations Act 2001 in relation to
the audit; and
(ii) no contraventions of any applicable code of professional conduct in relation to the audit.
KPM_INI_01
KPMG
Anthony Travers
Partner
Sydney
23 August 2018

S T A T E M E N T O F F I N A N C I A L P O S I T I O N
A S A T 3 0 J U N E 2 0 1 8
31 EVENT Hospitality & Entertainment Limited – 2018 Annual Report
Note
2018
$’000
2017
$’000
ASSETS
Current assets
Cash and cash equivalents 4.4 95,564 92,318
Trade and other receivables 3.1 55,293 55,051
Inventories 3.2 21,552 20,409
Prepayments and other current assets 16,482 10,458
Total current assets 188,891 178,236
Non-current assets
Trade and other receivables 3.1 1,042 1,519
Other financial assets 1,396 1,396
Available-for-sale financial assets 4.5 20,924 19,928
Investments accounted for using the equity method 5.3 14,368 10,942
Property, plant and equipment 3.3 1,321,917 1,237,708
Investment properties 3.4 74,000 68,250
Goodwill and other intangible assets 3.5 101,323 108,899
Deferred tax assets 2.4 4,771 6,333
Other non-current assets 1,947 3,115
Total non-current assets 1,541,688 1,458,090
Total assets 1,730,579 1,636,326
LIABILITIES
Current liabilities
Trade and other payables 3.6 106,947 106,895
Loans and borrowings 4.4 1,127 325,441
Current tax liabilities 2.4 1,298 790
Provisions 3.7 20,665 20,613
Deferred revenue 2.1 90,170 88,235
Other current liabilities 3.8 5,852 3,841
Total current liabilities 226,059 545,815
Non-current liabilities
Loans and borrowings 4.4 376,355 2,360
Deferred tax liabilities 2.4 11,731 12,192
Provisions 3.7 16,443 14,340
Deferred revenue 2.1 9,202 8,720
Other non-current liabilities 3.8 2,191 2,610
Total non-current liabilities 415,922 40,222
Total liabilities 641,981 586,037
Net assets 1,088,598 1,050,289
EQUITY
Share capital 4.1 219,126 219,126
Reserves 4.3 64,896 54,933
Retained earnings 804,576 776,230
Total equity 1,088,598 1,050,289
The Statement of Financial Position is to be read in conjunction with the notes to the financial statements on pages 36 to 86.

I N C O M E S T A T E M E N T
F O R T H E Y E A R E N D E D 3 0 J U N E 2 0 1 8
32 EVENT Hospitality & Entertainment Limited – 2018 Annual Report
Note
2018
$’000
2017
$’000
Revenue and other income
Revenue from sale of goods and rendering of services 2.1 1,223,216 1,217,058
Other revenue and income 2.1 66,522 77,211
1,289,738 1,294,269
Expenses
Employee expenses (307,856) (308,536)
Occupancy expenses (261,394) (256,145)
Film hire and other film expenses (228,430) (244,231)
Purchases and other direct expenses (110,613) (118,698)
Depreciation, amortisation and impairments (96,387) (84,591)
Other operating expenses (77,158) (80,291)
Advertising, commissions and marketing expenses (36,972) (37,338)
Finance costs (7,655) (9,802)
(1,126,465) (1,139,632)
Equity accounted profit
Share of net profit of equity accounted associates and joint ventures 5.3 2,268 2,684
Profit before tax 165,541 157,321
Income tax expense 2.4 (53,631) (46,502)
Profit for the year 111,910 110,819
2018
Cents
2017
Cents
Earnings per share
Basic earnings per share 2.5 69.9 69.6
Diluted earnings per share 2.5 69.3 68.7
The Income Statement is to be read in conjunction with the notes to the financial statements on pages 36 to 86.

S T A T E M E N T O F C O M P R E H E N S I V E I N C O M E
F O R T H E Y E A R E N D E D 3 0 J U N E 2 0 1 8
33 EVENT Hospitality & Entertainment Limited – 2018 Annual Report
The Statement of Comprehensive Income is to be read in conjunction with the notes to the financial statements on pages 36
to 86.
2018
$’000
2017
$’000
Profit for the year
111,910 110,819
Other comprehensive income
Items that may be reclassified to profit or loss
Foreign currency translation differences for foreign operations – net of tax 5,192 381
Transfer from foreign currency translation reserve to the Income Statement on sale of
interest in Fiji Cinema Joint Venture – 306
Net change in fair value of available-for-sale financial assets – net of tax 697 (97)
Net change in fair value of cash flow hedges – net of tax 18 (20)
Other comprehensive income for the year – net of tax 5,907 570
Total comprehensive income for the year
117,817 111,389

ST
AT
EM
EN
T O
F C
HA
NG
ES
IN
EQ
UIT
Y
FO
R T
HE
YE
AR
EN
DE
D 3
0 J
UN
E 2
01
8
34
EV
EN
T H
osp
ita
lity
& E
nte
rta
inm
en
t Li
mit
ed
– 2
01
8 A
nn
ua
l Re
po
rt
Sh
are
ca
pit
al
$’0
00
Re
serv
es
$’0
00
Re
tain
ed
ea
rnin
gs
$’0
00
To
tal
eq
uit
y
$’0
00
Ba
lan
ce a
t 1
Ju
ly 2
01
7
21
9,1
26
5
4,9
33
7
76
,23
0
1,0
50
,28
9
Pro
fit
for
the
ye
ar
–
–
11
1,9
10
1
11
,91
0
Oth
er
com
pre
he
nsi
ve i
nco
me
Fore
ign
cu
rre
ncy
tra
nsl
ati
on
dif
fere
nce
s fo
r fo
reig
n o
pe
rati
on
s –
ne
t o
f ta
x –
5
,19
2
–
5,1
92
Ne
t ch
an
ge
in f
air
va
lue
of
ava
ilab
le-f
or-
sale
fin
an
cia
l ass
ets
– n
et
of
tax
–
69
7
–
69
7
Ne
t ch
an
ge
in f
air
va
lue
of
cash
flo
w h
ed
gin
g in
stru
me
nts
– n
et
of
tax
–
18
–
1
8
To
tal
oth
er
com
pre
he
nsi
ve
in
com
e r
eco
gn
ise
d d
ire
ctly
in
eq
uit
y
–
5,9
07
–
5
,90
7
To
tal
com
pre
he
nsi
ve
in
com
e f
or
the
ye
ar
–
5,9
07
1
11
,91
0
11
7,8
17
Em
plo
yee
sh
are
-ba
sed
pa
yme
nts
exp
en
se –
ne
t o
f ta
x –
4
,05
6
–
4,0
56
Div
ide
nd
s p
aid
–
–
(8
3,5
64
) (8
3,5
64
)
To
tal
tra
nsa
ctio
ns
wit
h o
wn
ers
–
4
,05
6
(83
,56
4)
(79
,50
8)
Ba
lan
ce a
t 3
0 J
un
e 2
01
8
21
9,1
26
6
4,8
96
8
04
,57
6
1,0
88
,59
8
Ba
lan
ce a
t 1
Ju
ly 2
01
6
21
9,1
26
4
6,3
21
7
47
,29
7
1,0
12
,74
4
Pro
fit
for
the
ye
ar
–
–
11
0,8
19
1
10
,81
9
Oth
er
com
pre
he
nsi
ve i
nco
me
Fore
ign
cu
rre
ncy
tra
nsl
ati
on
dif
fere
nce
s fo
r fo
reig
n o
pe
rati
on
s –
ne
t o
f ta
x –
3
81
–
3
81
Tra
nsf
er
fro
m f
ore
ign
cu
rre
ncy
tra
nsl
ati
on
re
serv
e t
o t
he
In
com
e S
tate
me
nt
on
sa
le o
f in
tere
st
in F
iji C
ine
ma
s Jo
int
Ve
ntu
re
–
30
6
–
30
6
Ne
t ch
an
ge
in f
air
va
lue
of
ava
ilab
le-f
or-
sale
fin
an
cia
l ass
ets
– n
et
of
tax
–
(97
) –
(9
7)
Ne
t ch
an
ge
in f
air
va
lue
of
cash
flo
w h
ed
gin
g in
stru
me
nts
– n
et
of
tax
–
(20
) –
(2
0)
To
tal
oth
er
com
pre
he
nsi
ve
in
com
e r
eco
gn
ise
d d
ire
ctly
in
eq
uit
y
–
57
0
–
57
0
To
tal
com
pre
he
nsi
ve
in
com
e f
or
the
ye
ar
–
57
0
11
0,8
19
1
11
,38
9
Em
plo
yee
sh
are
-ba
sed
pa
yme
nts
exp
en
se –
ne
t o
f ta
x –
8
,04
2
–
8,0
42
Div
ide
nd
s p
aid
–
–
(8
1,8
86
) (8
1,8
86
)
To
tal
tra
nsa
ctio
ns
wit
h o
wn
ers
–
8
,04
2
(81
,88
6)
(73
,84
4)
Ba
lan
ce a
t 3
0 J
un
e 2
01
7
21
9,1
26
5
4,9
33
7
76
,23
0
1,0
50
,28
9
Th
e S
tate
me
nt
of
Ch
an
ge
s in
Eq
uit
y is
to
be
re
ad
in c
on
jun
ctio
n w
ith
th
e n
ote
s to
th
e f
ina
nci
al
sta
tem
en
ts o
n p
ag
es
36
to
86
.

S T A T E M E N T O F C A S H F L O W S
F O R T H E Y E A R E N D E D 3 0 J U N E 2 0 1 8
35 EVENT Hospitality & Entertainment Limited – 2018 Annual Report
Note
2018
$’000
2017
$’000
Cash flows from operating activities
Cash receipts in the course of operations 1,333,797 1,366,585
Cash payments in the course of operations (1,131,180) (1,162,968)
Cash provided by operations 202,617 203,617
Dividends from associates and joint ventures 2,252 3,692
Other revenue 59,024 56,745
Dividends received 771 795
Interest received 599 807
Finance costs paid (7,736) (9,793)
Income tax paid (49,778) (67,182)
Net cash provided by operating activities 7.3 207,749 188,681
Cash flows from investing activities
Payments for property, plant and equipment and redevelopment of properties (169,388) (258,956)
Purchase of management and leasehold rights, software and other intangible assets (3,352) (1,405)
Payments for interest in joint venture (3,266) −
Decrease in loans from other entities (1,609) (472)
Payments for businesses acquired, including intangible assets (1,141) (31,249)
Proceeds from disposal of other non-current assets 91 5
Proceeds from disposal of interest in joint operation − 9,088
Net cash used by investing activities (178,665) (282,989)
Cash flows from financing activities
Proceeds from borrowings 169,665 275,765
Repayments of borrowings (115,191) (150,127)
Dividends paid 4.2 (83,564) (81,886)
Net cash (used)/provided by financing activities (29,090) 43,752
Net decrease in cash and cash equivalents (6) (50,556)
Cash and cash equivalents at the beginning of the year 92,318 145,040
Effect of exchange rate fluctuations on cash held 3,252 (2,166)
Cash and cash equivalents at the end of the year 95,564 92,318
The Statement of Cash Flows is to be read in conjunction with the notes to the financial statements on pages 36 to 86.
N O T E S T O T H E F I N A N C I A L S T A T E M E N T S F O R T H E Y E A R E N D E D 3 0 J U N E 2 0 1 8
S E C T I O N 1 – B A S I S O F P R E P A R A T I O N
36 EVENT Hospitality & Entertainment Limited – 2018 Annual Report
This section explains the basis of preparation for the Group’s financial statements, including information
regarding the impact of the adoption of new accounting standards.
1.1 – REPORTING ENTITY
EVENT Hospitality & Entertainment Limited (“Company”) is a company domiciled in Australia. The consolidated financial
report of the Company as at and for the year ended 30 June 2018 comprises the Company and its subsidiaries (collectively
referred to as the “Group”) and the Group’s interest in associates, joint ventures and joint operations.
EVENT Hospitality & Entertainment Limited is a for-profit company incorporated in Australia and limited by shares. The
shares are publicly traded on the ASX. The nature of the operations and principal activities of the Group are described in Note
2.2.
The financial report was authorised for issue by the Board of Directors of EVENT Hospitality & Entertainment Limited on 23
August 2018.
1.2 – BASIS OF PREPARATION
Statement of compliance
The financial report is a general purpose financial report which has been prepared in accordance with Australian Accounting
Standards (“AASBs”) (including Australian Accounting Interpretations) adopted by the Australian Accounting Standards Board
and the Corporations Act 2001. The financial report also complies with International Financial Reporting Standards and
interpretations adopted by the International Accounting Standards Board.
Basis of measurement
The financial report is prepared on the historical cost basis except for the following material items in the Statement of
Financial Position which are measured at fair value: derivative financial instruments, financial assets classified as available-
for-sale, liabilities for cash-settled share-based payments and investment properties. Assets held for sale are stated at the
lower of carrying amount, and fair value less costs to sell.
The Company is of a kind referred to in ASIC Corporations (Rounding in Financial/Directors’ Reports) Instrument 2016/191
and in accordance with the Instrument, amounts in the financial report and Directors’ Report have been rounded off to the
nearest thousand dollars, unless otherwise stated.
Use of estimates and judgements
The preparation of a financial report in conformity with AASBs requires management to make judgements, estimates and
assumptions that affect the application of accounting policies and reported amounts of assets, liabilities, income and
expenses. The estimates and associated assumptions are based on historical experience and various other factors that are
believed to be reasonable under the circumstances, the results of which form the basis of making the judgements about
carrying values of assets and liabilities that are not readily apparent from other sources. Actual results may differ from these
estimates.
The estimates and underlying assumptions are reviewed on an ongoing basis. Revisions to accounting estimates are
recognised in the period in which the estimate is revised and in any future periods if affected. Judgements made by
management in the application of AASBs that have a significant effect on the financial report are discussed in note 3.3
(Property, plant and equipment) and 3.5 (Goodwill and other intangible assets).
Measurement of fair values
A number of the Group’s accounting policies and disclosures require the measurement of fair values, for both financial and
non-financial assets and liabilities. When measuring the fair value of an asset or a liability, the Group uses market observable
data as far as possible. Fair values are categorised into different levels in a fair value hierarchy based on the inputs used in
the valuation techniques as follows:
• Level 1: quoted prices (unadjusted) in active markets for identical assets or liabilities;
• Level 2: inputs other than quoted prices included in Level 1 that are observable for the asset or liability, either
directly (i.e. as prices) or indirectly (i.e. derived from prices); and
• Level 3: inputs for the asset or liability that are not based on observable market data (unobservable inputs).

N O T E S T O T H E F I N A N C I A L S T A T E M E N T S F O R T H E Y E A R E N D E D 3 0 J U N E 2 0 1 8
S E C T I O N 1 – B A S I S O F P R E P A R A T I O N
37 EVENT Hospitality & Entertainment Limited – 2018 Annual Report
1.2 – BASIS OF PREPARATION (continued)
If the inputs used to measure the fair value of an asset or a liability might be categorised in different levels of the fair value
hierarchy, then the fair value measurement is categorised in its entirety in the same level of the fair value hierarchy as the
lowest level input that is significant to the entire measurement. The Group recognises transfers between levels of the fair
value hierarchy at the end of the reporting period during which the change has occurred. Further information about the
assumptions made in measuring fair values is included in Notes 3.3 (Property, plant and equipment), 3.4 (Investment
properties) and 4.5 (Financial risk management).
1.3 – FOREIGN CURRENCY
Functional and presentation currency
All amounts are expressed in Australian dollars, which is the Group’s presentation currency. Items included in the financial
statements of each of the Group’s entities are measured using the currency of the primary economic environment in which
the entity operates (“functional currency”). The functional currency of the Company is Australian dollars.
Foreign currency transactions
Transactions in foreign currencies are translated at the foreign exchange rate ruling at the date of the transaction. Monetary
assets and liabilities denominated in foreign currencies at the year end date are translated to Australian dollars at the foreign
exchange rate ruling at that date. Foreign exchange differences arising on translation are recognised in profit or loss, except
for differences arising on retranslation of a financial liability designated as a hedge of the net investment in a foreign
operation that is effective, which are recognised in other comprehensive income. Non-monetary assets and liabilities that are
measured in terms of historical cost in a foreign currency are translated using the exchange rate at the dates of the
transactions. Non-monetary assets and liabilities denominated in foreign currencies that are stated at fair value are
translated to Australian dollars at foreign exchange rates ruling at the dates the fair value was determined.
Financial statements of foreign operations
The assets and liabilities of foreign operations, including goodwill and fair value adjustments arising on acquisition, are
translated to Australian dollars at foreign exchange rates ruling at the reporting date. The income and expenses of foreign
operations are translated to Australian dollars at rates approximating the foreign exchange rates ruling at the dates of the
transactions. Foreign exchange differences arising on retranslation are recognised in other comprehensive income, and
presented in the foreign currency translation reserve in equity.
When a foreign operation is disposed of in its entirety or partially such that control, significant influence or joint control is
lost, the cumulative amount in the foreign currency translation reserve related to that foreign operation is reclassified to
profit or loss as part of the gain or loss on disposal. If the Group disposes of part of its interest in a subsidiary but retains
control, then the relevant proportion of the cumulative amount is reattributed to non-controlling interests. When the Group
disposes of only part of an associate or joint venture whilst retaining significant influence or joint control, the relevant
proportion of the cumulative amount is reclassified to profit or loss.
Net investment in foreign operations
Exchange differences arising from the translation of the net investment in foreign operations, and the effective portion of
related hedges, are taken to the foreign currency translation reserve. They are released to profit or loss as an adjustment to
profit or loss on disposal. Foreign exchange gains and losses arising from a monetary item receivable from or payable to a
foreign operation, the settlement of which is neither planned nor likely in the foreseeable future, are considered to form part
of a net investment in a foreign operation and are recognised directly in other comprehensive income and presented in the
foreign currency translation reserve in equity.
1.4 – NEW STANDARDS AND INTERPRETATIONS NOT YET ADOPTED
A number of new standards, amendments to standards and interpretations are effective for annual periods beginning on or
after 1 July 2018, and have not been applied in preparing these consolidated financial statements. None of these is expected
to have a significant effect on the consolidated financial statements of the Group, except for:
• AASB 9 Financial Instruments;
• AASB 15 Revenue from Contracts with Customers; and
• AASB 16 Leases.
N O T E S T O T H E F I N A N C I A L S T A T E M E N T S F O R T H E Y E A R E N D E D 3 0 J U N E 2 0 1 8
S E C T I O N 1 – B A S I S O F P R E P A R A T I O N
38 EVENT Hospitality & Entertainment Limited – 2018 Annual Report
1.4 – NEW STANDARDS AND INTERPRETATIONS NOT YET ADOPTED (continued)
AASB 9 Financial Instruments
The adoption of this standard will not have a material impact on the amounts recognised in the Group’s financial statements.
However, the new standard introduces expanded disclosure requirements and changes in presentation which will change the
nature and extent of the Group’s disclosures regarding its financial instruments in the financial statements for the year
ending 30 June 2019.
AASB 15 Revenue from Contracts with Customers
This standard will be effective for the Group’s financial statements with effect from 1 July 2018 and will have the following
impacts on the Group’s revenue:
• Revenue from gift cards that are not redeemed by customers (“breakage”) is required to be estimated and
recognised when the gift cards are sold based on historical patterns of redemption by customers. The Group
currently recognises breakage only when gift cards expire. This will have the effect of decreasing the Group’s
deferred revenue balance at 1 July 2018.
• The determination of the fair value of points earned by customers in the Group’s loyalty programs will change under
AASB 15 as a result of specific guidance on the methodology required to be used in this calculation. This will have
the effect of increasing the Group’s deferred revenue balance at 1 July 2018.
• Contract acquisition costs related to hotel management agreements will be recognised over the term of the
contracts as a reduction in revenue instead of as amortisation expense, with no net effect on the Group’s profit or
loss or net asset position.
The Group has assessed the estimated impact that the initial application of AASB 15 will have on its financial statements and
determined that the cumulative effect on adoption at 1 July 2018 will not be significant.
AASB 15 allows entities to apply certain transitional provisions on initial adoption of this standard. The Group has determined
to apply the cumulative effect adjustment approach to adoption of the standard and consequently there will be no
restatement of 30 June 2018 comparative information in the financial statements for the year ending 30 June 2019.
AASB 16 Leases
This standard will have a material impact on the Group’s accounting for operating leases. The Group has extensive operating
lease arrangements, details of which are disclosed in Notes 5.3 and 7.1 in accordance with AASB 117 Leases. The new
standard requires the recognition of a right-of-use (“ROU”) asset and lease liability for each operating lease, with certain
limited exceptions. Rental expense will no longer be recognised in respect of operating leases. Instead, the ROU asset will be
depreciated over the lease term, whilst interest expense will be incurred in respect of the lease liability. These changes will
have the effect of materially increasing the Group’s earnings before interest, tax, depreciation and amortisation, and
materially increasing the Group’s depreciation and interest expenditure, whilst also potentially having a material impact on
net profit after tax, which will vary from year to year, and has yet to be quantified by the Group.
AASB 16 allows entities to apply certain transitional provisions on initial adoption of the standard. The Group has determined
to apply the modified retrospective transition approach to adoption of the standard and consequently the date of initial
application will be 1 July 2019. Under the transitional provisions, the Group is required to determine the discount rate for
each lease at 1 July 2019. The calculation of the impact on the Group’s financial statements is materially sensitive to the
discount rate used for each lease and consequently it is not yet possible to quantify the impact of AASB 16.
The Group’s transition project is well advanced and the Group will be in a position to quantify the impact once the discount
rate at 1 July 2019 is determined. The expected quantitative impact of adoption of AASB 16 will be disclosed in the Group’s
financial statements for the year ending 30 June 2019.
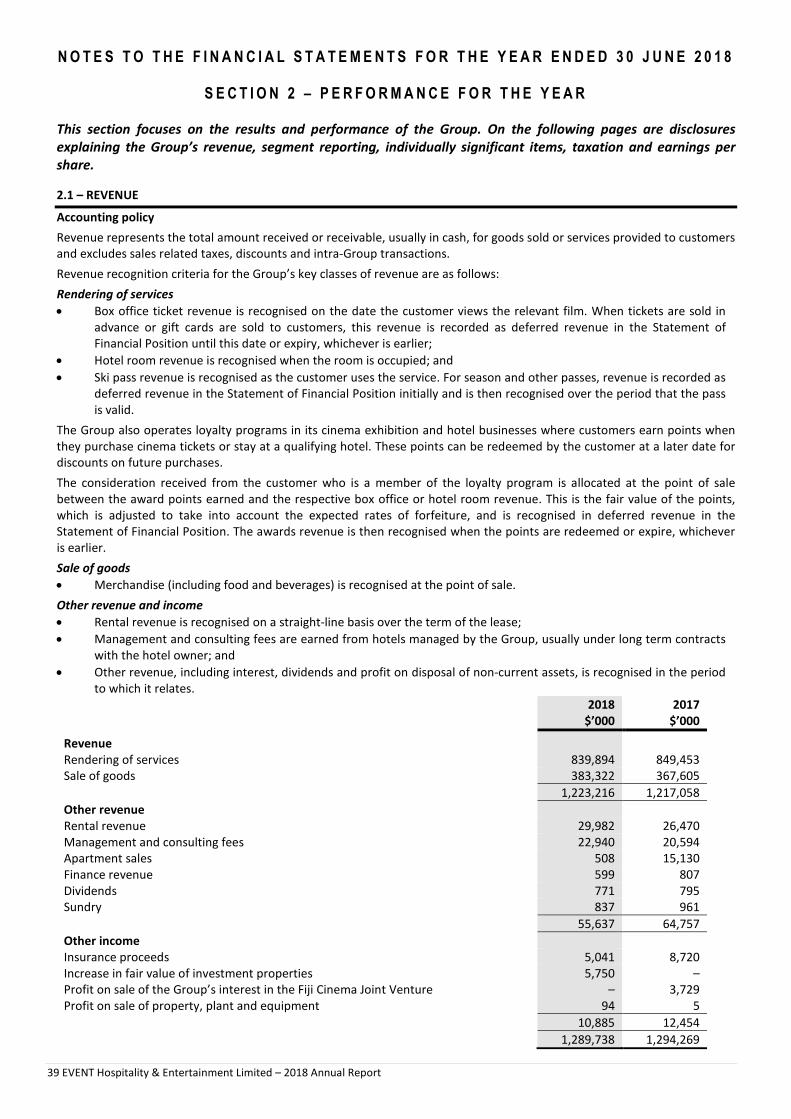
N O T E S T O T H E F I N A N C I A L S T A T E M E N T S F O R T H E Y E A R E N D E D 3 0 J U N E 2 0 1 8
S E C T I O N 2 – P E R F O R M A N C E F O R T H E Y E A R
39 EVENT Hospitality & Entertainment Limited – 2018 Annual Report
This section focuses on the results and performance of the Group. On the following pages are disclosures
explaining the Group’s revenue, segment reporting, individually significant items, taxation and earnings per
share.
2.1 – REVENUE
Accounting policy
Revenue represents the total amount received or receivable, usually in cash, for goods sold or services provided to customers
and excludes sales related taxes, discounts and intra-Group transactions.
Revenue recognition criteria for the Group’s key classes of revenue are as follows:
Rendering of services
• Box office ticket revenue is recognised on the date the customer views the relevant film. When tickets are sold in
advance or gift cards are sold to customers, this revenue is recorded as deferred revenue in the Statement of
Financial Position until this date or expiry, whichever is earlier;
• Hotel room revenue is recognised when the room is occupied; and
• Ski pass revenue is recognised as the customer uses the service. For season and other passes, revenue is recorded as
deferred revenue in the Statement of Financial Position initially and is then recognised over the period that the pass
is valid.
The Group also operates loyalty programs in its cinema exhibition and hotel businesses where customers earn points when
they purchase cinema tickets or stay at a qualifying hotel. These points can be redeemed by the customer at a later date for
discounts on future purchases.
The consideration received from the customer who is a member of the loyalty program is allocated at the point of sale
between the award points earned and the respective box office or hotel room revenue. This is the fair value of the points,
which is adjusted to take into account the expected rates of forfeiture, and is recognised in deferred revenue in the
Statement of Financial Position. The awards revenue is then recognised when the points are redeemed or expire, whichever
is earlier.
Sale of goods
• Merchandise (including food and beverages) is recognised at the point of sale.
Other revenue and income
• Rental revenue is recognised on a straight-line basis over the term of the lease;
• Management and consulting fees are earned from hotels managed by the Group, usually under long term contracts
with the hotel owner; and
• Other revenue, including interest, dividends and profit on disposal of non-current assets, is recognised in the period
to which it relates.
2018
$’000
2017
$’000
Revenue
Rendering of services 839,894 849,453
Sale of goods 383,322 367,605
1,223,216 1,217,058
Other revenue
Rental revenue 29,982 26,470
Management and consulting fees 22,940 20,594
Apartment sales 508 15,130
Finance revenue 599 807
Dividends 771 795
Sundry 837 961
55,637 64,757
Other income
Insurance proceeds 5,041 8,720
Increase in fair value of investment properties 5,750 –
Profit on sale of the Group’s interest in the Fiji Cinema Joint Venture – 3,729
Profit on sale of property, plant and equipment 94 5
10,885 12,454
1,289,738 1,294,269

N O T E S T O T H E F I N A N C I A L S T A T E M E N T S F O R T H E Y E A R E N D E D 3 0 J U N E 2 0 1 8
S E C T I O N 2 – P E R F O R M A N C E F O R T H E Y E A R
40 EVENT Hospitality & Entertainment Limited – 2018 Annual Report
2.2 – SEGMENT REPORTING
Accounting policy
An operating segment is a component of the Group that engages in business activities from which it earns revenues and
incurs expenses, including revenues and expenses from transactions with other Group segments. All segments’ operating
results are regularly reviewed by the Group’s CEO to make decisions about resources to be allocated to a segment and to
assess its performance, and for which discrete financial information is available.
Segment results that are reported to the CEO include items directly attributable to a segment, before individually significant
items, as well as those that can be allocated on a reasonable basis. Unallocated items comprise mainly corporate head office
assets, head office expenses, and income tax assets and liabilities.
Additions to non-current segment assets are the total cost incurred during the period to acquire assets that include amounts
expected to be recovered over more than 12 months after the year end date. Amounts include property, plant and
equipment, but exclude financial instruments and deferred tax assets.
Segment information is presented in respect of the Group’s reporting segments. These are the Group’s main strategic
business segments and have differing risks and rewards associated with the business due to their different product or service
and geographic markets. For each of these operating segments, the Group’s CEO regularly reviews internal management
reports.
Information regarding the results of each reportable segment is included below. Performance is measured based on segment
profit before income tax as included in the internal management reports. Segment profit is used to measure performance as
management believes that such information is the most relevant in evaluating the results of segments relative to those of
other businesses. Inter-segment pricing is determined on an arm’s length basis.
Segment results, assets and liabilities include items directly attributable to a segment as well as those that can be allocated
on a reasonable basis. Unallocated items mainly comprise interest bearing loans and borrowings and borrowing costs,
interest income and corporate head office assets and expenses.
Operating segments
The Group comprises the following main operating segments:
Entertainment Australia
Includes the cinema exhibition operations in Australia, technology equipment supply and servicing, and the State Theatre.
Entertainment New Zealand
Includes cinema exhibition operations in New Zealand.
Entertainment Germany
Includes the cinema exhibition operations in Germany.
Hotels and Resorts
Includes the ownership, operation and management of hotels in Australia and overseas.
Thredbo Alpine Resort
Includes all the operations of the resort including property development activities.
Property and Other Investments
Includes property rental, investment properties and available-for-sale financial assets.
Geographical information
Also presented is information on the Group’s split of revenue and non-current assets by geographic location. Geographic
revenue is based on the geographical location of customers. Segment assets are based on the geographical location of the
assets. The Group operates in Australia, New Zealand and Germany.

NO
TE
S T
O T
HE
F
INA
NC
IA
L S
TA
TE
ME
NT
S F
OR
T
HE
YE
AR
E
ND
ED
30
JU
NE
20
18
SE
CT
ION
2 –
PE
RF
OR
MA
NC
E F
OR
T
HE
YE
AR
41
EV
EN
T H
osp
ita
lity
& E
nte
rta
inm
en
t Li
mit
ed
– 2
01
8 A
nn
ua
l Re
po
rt
En
tert
ain
me
nt
2.2
– S
EG
ME
NT
RE
PO
RT
ING
(co
nti
nu
ed
)
Au
stra
lia
Ne
w Z
ea
lan
d
Ge
rma
ny
Ho
tels
an
d
Re
sort
s
Th
red
bo
Alp
ine
Re
sort
Pro
pe
rty
an
d
Oth
er
Inv
est
me
nts
Co
nso
lid
ate
d
Op
era
tin
g s
eg
me
nts
$
’00
0
$’0
00
$
’00
0
$’0
00
$
’00
0
$’0
00
$
’00
0
20
18
Re
ve
nu
e a
nd
oth
er
inco
me
Ext
ern
al s
eg
me
nt
reve
nu
e
45
5,1
21
8
7,3
08
3
07
,38
3
33
7,0
93
7
2,9
71
2
3,7
76
1
,28
3,6
52
Fin
an
ce r
eve
nu
e
59
9
Oth
er
un
all
oca
ted
re
ven
ue
2
7
Re
ve
nu
e a
nd
oth
er
inco
me
be
fore
in
div
idu
all
y s
ign
ific
an
t it
em
s
1
,28
4,2
78
Ind
ivid
ua
lly s
ign
ific
an
t it
em
s
5
,46
0
Re
ve
nu
e a
nd
oth
er
inco
me
1
,28
9,7
38
Re
sult
Se
gm
en
t re
sult
be
fore
in
div
idu
ally
sig
nif
ica
nt
ite
ms
68
,29
4
11
,15
0
18
,42
7
68
,79
9
21
,83
8
16
,52
8
20
5,0
36
Sh
are
of
ne
t p
rofi
t o
f e
qu
ity
acc
ou
nte
d in
vest
ee
s 3
06
–
1
,49
1
47
1
–
–
2,2
68
To
tal s
eg
me
nt
resu
lt b
efo
re i
nd
ivid
ua
lly s
ign
ific
an
t it
em
s 6
8,6
00
1
1,1
50
1
9,9
18
6
9,2
70
2
1,8
38
1
6,5
28
2
07
,30
4
Un
allo
cate
d r
eve
nu
e a
nd
exp
en
ses
(17
,03
4)
Ne
t fi
na
nce
co
sts
(7,0
56
)
Ind
ivid
ua
lly s
ign
ific
an
t it
em
s
(1
7,6
73
)
Pro
fit
be
fore
re
late
d i
nco
me
ta
x e
xp
en
se
16
5,5
41
Inco
me
ta
x e
xpe
nse
(5
3,6
31
)
Pro
fit
aft
er
inco
me
ta
x e
xp
en
se
11
1,9
10
Am
ort
isa
tio
n a
nd
de
pre
cia
tio
n (
ne
t o
f im
pa
irm
en
t w
rite
-do
wn
s)
(27
,23
0)
(5,8
68
) (1
0,9
88
) (2
6,9
15
) (3
,86
7)
(2,9
94
) (7
7,8
62
)
Imp
air
me
nt
wri
te-d
ow
ns
(14
,50
0)
–
(3,0
71
) (9
54
) –
–
(1
8,5
25
)
Am
ort
isa
tio
n,
de
pre
cia
tio
n a
nd
im
pa
irm
en
ts
(41
,73
0)
(5,8
68
) (1
4,0
59
) (2
7,8
69
) (3
,86
7)
(2,9
94
) (9
6,3
87
)
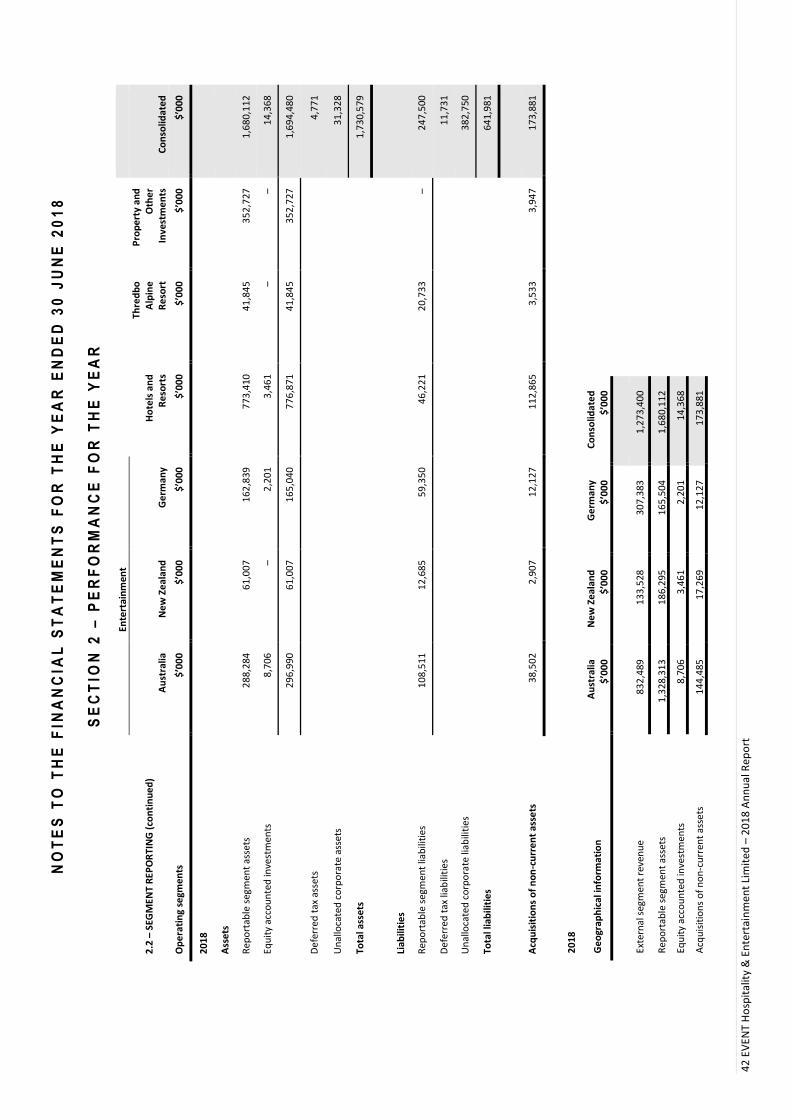
NO
TE
S T
O T
HE
F
INA
NC
IA
L S
TA
TE
ME
NT
S F
OR
T
HE
YE
AR
E
ND
ED
30
JU
NE
20
18
SE
CT
ION
2 –
PE
RF
OR
MA
NC
E F
OR
T
HE
YE
AR
42
EV
EN
T H
osp
ita
lity
& E
nte
rta
inm
en
t Li
mit
ed
– 2
01
8 A
nn
ua
l Re
po
rt
E
nte
rta
inm
en
t
2.2
– S
EG
ME
NT
RE
PO
RT
ING
(co
nti
nu
ed
)
Au
stra
lia
Ne
w Z
ea
lan
d
Ge
rma
ny
Ho
tels
an
d
Re
sort
s
Th
red
bo
Alp
ine
Re
sort
Pro
pe
rty
an
d
Oth
er
Inv
est
me
nts
Co
nso
lid
ate
d
Op
era
tin
g s
eg
me
nts
$
’00
0
$’0
00
$
’00
0
$’0
00
$
’00
0
$’0
00
$
’00
0
20
18
Ass
ets
Re
po
rta
ble
se
gm
en
t a
sse
ts
28
8,2
84
6
1,0
07
1
62
,83
9
77
3,4
10
4
1,8
45
3
52
,72
7
1,6
80
,11
2
Eq
uit
y a
cco
un
ted
inve
stm
en
ts
8,7
06
–
2
,20
1
3,4
61
–
–
1
4,3
68
2
96
,99
0
61
,00
7
16
5,0
40
7
76
,87
1
41
,84
5
35
2,7
27
1
,69
4,4
80
De
ferr
ed
ta
x a
sse
ts
4,7
71
Un
allo
cate
d c
orp
ora
te a
sse
ts
31
,32
8
To
tal
ass
ets
1
,73
0,5
79
Lia
bil
itie
s
Re
po
rta
ble
se
gm
en
t lia
bil
itie
s 1
08
,51
1
12
,68
5
59
,35
0
46
,22
1
20
,73
3
–
24
7,5
00
De
ferr
ed
ta
x lia
bili
tie
s
1
1,7
31
Un
allo
cate
d c
orp
ora
te li
ab
iliti
es
38
2,7
50
To
tal
lia
bil
itie
s
6
41
,98
1
Acq
uis
itio
ns
of
no
n-c
urr
en
t a
sse
ts
38
,50
2
2,9
07
1
2,1
27
1
12
,86
5
3,5
33
3
,94
7
17
3,8
81
20
18
Ge
og
rap
hic
al
info
rma
tio
n
Au
stra
lia
$’0
00
Ne
w Z
ea
lan
d
$’0
00
Ge
rma
ny
$’0
00
Co
nso
lid
ate
d
$’0
00
Ext
ern
al s
eg
me
nt
reve
nu
e
83
2,4
89
1
33
,52
8
30
7,3
83
1
,27
3,4
00
Re
po
rta
ble
se
gm
en
t a
sse
ts
1,3
28
,31
3
18
6,2
95
1
65
,50
4
1,6
80
,11
2
Eq
uit
y a
cco
un
ted
inve
stm
en
ts
8,7
06
3
,46
1
2,2
01
1
4,3
68
Acq
uis
itio
ns
of
no
n-c
urr
en
t a
sse
ts
14
4,4
85
1
7,2
69
1
2,1
27
1
73
,88
1
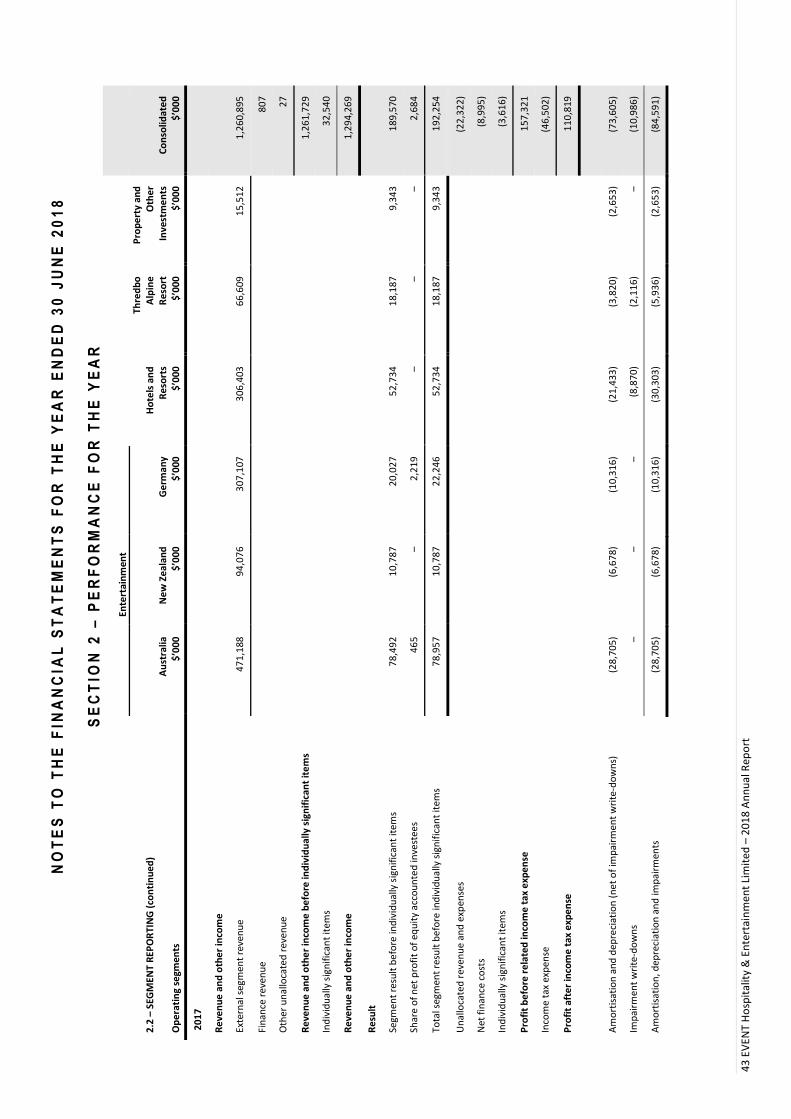
NO
TE
S T
O T
HE
F
INA
NC
IA
L S
TA
TE
ME
NT
S F
OR
T
HE
YE
AR
E
ND
ED
30
JU
NE
20
18
SE
CT
ION
2 –
PE
RF
OR
MA
NC
E F
OR
T
HE
YE
AR
43
EV
EN
T H
osp
ita
lity
& E
nte
rta
inm
en
t Li
mit
ed
– 2
01
8 A
nn
ua
l Re
po
rt
En
tert
ain
me
nt
2.2
– S
EG
ME
NT
RE
PO
RT
ING
(co
nti
nu
ed
)
Au
stra
lia
Ne
w Z
ea
lan
d
Ge
rma
ny
Ho
tels
an
d
Re
sort
s
Th
red
bo
Alp
ine
Re
sort
Pro
pe
rty
an
d
Oth
er
Inv
est
me
nts
Co
nso
lid
ate
d
Op
era
tin
g s
eg
me
nts
$
’00
0
$’0
00
$
’00
0
$’0
00
$
’00
0
$’0
00
$
’00
0
20
17
Re
ve
nu
e a
nd
oth
er
inco
me
Ext
ern
al s
eg
me
nt
reve
nu
e
47
1,1
88
9
4,0
76
3
07
,10
7
30
6,4
03
6
6,6
09
1
5,5
12
1
,26
0,8
95
Fin
an
ce r
eve
nu
e
80
7
Oth
er
un
all
oca
ted
re
ven
ue
2
7
Re
ve
nu
e a
nd
oth
er
inco
me
be
fore
in
div
idu
all
y s
ign
ific
an
t it
em
s
1
,26
1,7
29
Ind
ivid
ua
lly s
ign
ific
an
t it
em
s
3
2,5
40
Re
ve
nu
e a
nd
oth
er
inco
me
1
,29
4,2
69
Re
sult
Se
gm
en
t re
sult
be
fore
in
div
idu
ally
sig
nif
ica
nt
ite
ms
78
,49
2
10
,78
7
20
,02
7
52
,73
4
18
,18
7
9,3
43
1
89
,57
0
Sh
are
of
ne
t p
rofi
t o
f e
qu
ity
acc
ou
nte
d in
vest
ee
s 4
65
–
2
,21
9
–
–
–
2,6
84
To
tal s
eg
me
nt
resu
lt b
efo
re i
nd
ivid
ua
lly s
ign
ific
an
t it
em
s 7
8,9
57
1
0,7
87
2
2,2
46
5
2,7
34
1
8,1
87
9
,34
3
19
2,2
54
Un
allo
cate
d r
eve
nu
e a
nd
exp
en
ses
(22
,32
2)
Ne
t fi
na
nce
co
sts
(8,9
95
)
Ind
ivid
ua
lly s
ign
ific
an
t it
em
s
(3
,61
6)
Pro
fit
be
fore
re
late
d i
nco
me
ta
x e
xp
en
se
15
7,3
21
Inco
me
ta
x e
xpe
nse
(4
6,5
02
)
Pro
fit
aft
er
inco
me
ta
x e
xp
en
se
11
0,8
19
Am
ort
isa
tio
n a
nd
de
pre
cia
tio
n (
ne
t o
f im
pa
irm
en
t w
rite
-do
wn
s)
(28
,70
5)
(6,6
78
) (1
0,3
16
) (2
1,4
33
) (3
,82
0)
(2,6
53
) (7
3,6
05
)
Imp
air
me
nt
wri
te-d
ow
ns
–
–
–
(8,8
70
) (2
,11
6)
–
(10
,98
6)
Am
ort
isa
tio
n,
de
pre
cia
tio
n a
nd
im
pa
irm
en
ts
(28
,70
5)
(6,6
78
) (1
0,3
16
) (3
0,3
03
) (5
,93
6)
(2,6
53
) (8
4,5
91
)

NO
TE
S T
O T
HE
F
INA
NC
IA
L S
TA
TE
ME
NT
S F
OR
T
HE
YE
AR
E
ND
ED
30
JU
NE
20
18
SE
CT
ION
2 –
PE
RF
OR
MA
NC
E F
OR
T
HE
YE
AR
44
EV
EN
T H
osp
ita
lity
& E
nte
rta
inm
en
t Li
mit
ed
– 2
01
8 A
nn
ua
l Re
po
rt
En
tert
ain
me
nt
2.2
– S
EG
ME
NT
RE
PO
RT
ING
(co
nti
nu
ed
)
Au
stra
lia
Ne
w Z
ea
lan
d
Ge
rma
ny
Ho
tels
an
d
Re
sort
s
Th
red
bo
Alp
ine
Re
sort
Pro
pe
rty
an
d
Oth
er
Inv
est
me
nts
Co
nso
lid
ate
d
Op
era
tin
g s
eg
me
nts
$
’00
0
$’0
00
$
’00
0
$’0
00
$
’00
0
$’0
00
$
’00
0
20
17
Ass
ets
Re
po
rta
ble
se
gm
en
t a
sse
ts
29
1,6
32
7
4,6
82
1
50
,42
6
68
8,4
32
4
1,9
40
3
45
,44
0
1,5
92
,55
2
Eq
uit
y a
cco
un
ted
inve
stm
en
ts
8,4
00
–
2
,54
2
–
–
–
10
,94
2
3
00
,03
2
74
,68
2
15
2,9
68
6
88
,43
2
41
,94
0
34
5,4
40
1
,60
3,4
94
De
ferr
ed
ta
x a
sse
ts
6,3
33
Un
allo
cate
d c
orp
ora
te a
sse
ts
26
,49
9
To
tal
ass
ets
1
,63
6,3
26
Lia
bil
itie
s
Re
po
rta
ble
se
gm
en
t lia
bil
itie
s 1
05
,66
9
12
,82
6
59
,47
5
42
,76
6
19
,52
9
–
24
0,2
65
De
ferr
ed
ta
x lia
bili
tie
s
1
2,1
92
Un
allo
cate
d c
orp
ora
te li
ab
iliti
es
33
3,5
80
To
tal
lia
bil
itie
s
5
86
,03
7
Acq
uis
itio
ns
of
no
n-c
urr
en
t a
sse
ts
25
,72
5
8,6
58
1
6,9
09
1
15
,26
3
2,4
94
1
22
,69
8
29
1,7
47
20
17
Ge
og
rap
hic
al
info
rma
tio
n
Au
stra
lia
$’0
00
Ne
w Z
ea
lan
d
an
d F
iji
$’0
00
Ge
rma
ny
$’0
00
Co
nso
lid
ate
d
$’0
00
Ext
ern
al s
eg
me
nt
reve
nu
e
82
0,6
20
1
32
,36
8
30
7,1
07
1
,26
0,0
95
Re
po
rta
ble
se
gm
en
t a
sse
ts
1,2
50
,06
9
19
2,0
57
1
50
,42
6
1,5
92
,55
2
Eq
uit
y a
cco
un
ted
inve
stm
en
ts
8,4
00
–
2
,54
2
10
,94
2
Acq
uis
itio
ns
of
no
n-c
urr
en
t a
sse
ts
24
0,3
30
3
4,5
08
1
6,9
09
2
91
,74
7

N O T E S T O T H E F I N A N C I A L S T A T E M E N T S F O R T H E Y E A R E N D E D 3 0 J U N E 2 0 1 8
S E C T I O N 2 – P E R F O R M A N C E F O R T H E Y E A R
45 EVENT Hospitality & Entertainment Limited – 2018 Annual Report
2.3 – INDIVIDUALLY SIGNIFICANT ITEMS
Individually significant items comprised the following:
2018
$’000
2017
$’000
Impairment charges (18,525) (10,986)
Managing Director retirement and transition costs – (5,526)
Net proceeds from insurance 1,148 5,457
Write-back of expired voucher stock – 5,184
Other individually significant items (net) (296) 2,255
Individually significant items before income tax (17,673) (3,616)
Income tax benefit 5,302 751
Individually significant items after income tax (12,371) (2,865)
2.4 – TAXATION
Accounting policy
Income tax expense in the Income Statement for the periods presented comprises current and deferred tax. Income tax is
recognised in profit or loss except to the extent that it relates to a business combination, or items recognised directly in equity or
in other comprehensive income.
Current tax
Current tax is the expected tax payable on the taxable income for the year, using tax rates enacted or substantially enacted at
the balance sheet date, and any adjustment to tax payable in respect of previous years.
The Company and its Australian wholly-owned subsidiaries are part of a tax consolidated group. As a consequence, all members
of the tax consolidated group are taxed as a single entity. EVENT Hospitality & Entertainment Limited is the head entity within
the tax consolidated group.
Deferred tax
Deferred tax arises due to certain temporary differences between the carrying amounts of assets and liabilities for financial
reporting purposes and those for taxation purposes. The following temporary differences are not provided for:
• taxable temporary differences on the initial recognition of goodwill;
• the initial recognition of assets or liabilities that affect neither accounting nor taxable profit other than in a business
combination; and
• differences relating to investments in subsidiaries to the extent that they will probably not reverse in the foreseeable
future.
Deferred tax assets and liabilities are disclosed net to the extent that they relate to taxes levied by the same authority and the
Group has the right of set off.
The amount of deferred tax provided is based on the expected manner of realisation or settlement of the carrying amount of
assets and liabilities. A deferred tax asset is recognised only to the extent that it is probable that sufficient taxable profit will be
available to utilise the temporary difference.
The Group has unrecognised deferred tax assets in respect of certain foreign tax revenue losses as disclosed on page 47. The
utilisation of the tax revenue losses is dependent upon the generation of sufficient future taxable profits within the applicable
foreign tax entities and a deferred tax asset is only recognised to the extent that it is supported by sufficient forecast taxable
profits. Assumptions regarding the generation of future taxable profits relevant to those foreign tax entities has been based
upon management’s budget estimates and forecasts. Management considers that the forecast of taxable profits for the
applicable foreign tax entities is subject to risk and uncertainty; hence, the Group has not recognised all of the losses as a
deferred tax asset.

N O T E S T O T H E F I N A N C I A L S T A T E M E N T S F O R T H E Y E A R E N D E D 3 0 J U N E 2 0 1 8
S E C T I O N 2 – P E R F O R M A N C E F O R T H E Y E A R
46 EVENT Hospitality & Entertainment Limited – 2018 Annual Report
2.4 – TAXATION (continued) 2018
$’000
2017
$’000
Income tax expense
The major components of income tax expense are:
Income tax recognised in profit or loss 53,631 46,502
Current income tax
Current income tax expense 49,696 49,958
Income tax under/(over) provided in prior year 780 (1,908)
Deferred income tax
Relating to origination and reversal of temporary differences 3,155 (1,548)
Income tax expense reported in the Income Statement 53,631 46,502
Income tax (credited)/charged directly in equity
Deferred income tax related to items (credited)/charged directly in equity:
Relating to other comprehensive income
Effective portion of changes in fair value of cash flow hedges 4 (4)
Unrealised loss/(gain) on available-for-sale financial assets 299 (42)
Currency translation movements of deferred tax balances of foreign operations (727) (373)
Net (gain)/loss on hedge of net investment in overseas subsidiaries (1,622) 32
Income tax benefit reported in equity (2,046) (387)
Reconciliation between income tax expense and pre-tax profit
A reconciliation between income tax expense and accounting profit before income tax
multiplied by the Group’s applicable income tax rate is as follows:
Accounting profit before income tax expense 165,541 157,321
Prima facie income tax expense calculated at the Group’s statutory income tax rate of
30% (2017: 30%) on accounting profit
49,662
47,196
Increase/(decrease) in income tax expense due to:
Impairment write-down of land and buildings 1,632 1,057
Non-deductible items and losses in non-resident controlled entities 1,421 1,757
Amortisation of management rights and other intangible assets 914 936
Tax losses from prior years now recognised or utilised 39 (523)
Depreciation and amortisation of buildings 472 404
Other 152 542
4,630 4,173
Decrease in income tax expense due to:
Share of incorporated joint venture net profit 842 969
Non-assessable profit on disposal of interest in the Fiji Cinema Joint Venture – 212
Other 599 1,778
1,441 2,959
Income tax under/(over) provided in prior year 780 (1,908)
53,631 46,502

N O T E S T O T H E F I N A N C I A L S T A T E M E N T S F O R T H E Y E A R E N D E D 3 0 J U N E 2 0 1 8
S E C T I O N 2 – P E R F O R M A N C E F O R T H E Y E A R
47 EVENT Hospitality & Entertainment Limited – 2018 Annual Report
2.4 – TAXATION (continued) 2018
$’000
2017
$’000
Unrecognised deferred tax assets
Revenue losses – foreign 2,487 2,027
2,487 2,027
Included in the deferred tax assets not recognised is the gross value of tax revenue losses arising in Germany of $8,290,000
(2017: $6,757,000). The availability of these tax losses is subject to certain utilisation limits and ongoing availability tests under
German tax law. At 30 June 2018, there was no recognised deferred income tax liability (2017: $nil) for taxes that would be
payable on the unremitted earnings of certain of the Group’s subsidiaries, associates or incorporated joint ventures.
Deferred tax liabilities and assets Statement of Financial
Position
Income
Statement
Deferred tax liabilities
2018
$’000
2017
$’000
2018
$’000
2017
$’000
Deferred tax liabilities comprise:
Difference in depreciation and amortisation of property, plant
and equipment for accounting and income tax purposes 32,940 29,888
3,348
3,049
Investment properties 10,754 8,801 1,953 681
Available-for-sale financial assets 4,760 4,461 – –
Share of joint arrangement timing differences 42 49 (7) (26)
Expenditure immediately deductible for tax but amortised for
accounting purposes 4,494 4,342
147
(267)
Accrued revenue 188 262 (88) (375)
Prepayments 66 79 (13) (4)
Interest and deferred financing costs 742 563 179 (323)
Share-based payments immediately deductible for tax but
deferred and amortised for accounting purposes – 321
(321)
(1,111)
Unrealised foreign exchange gains not currently assessable 68 1,518 – (147)
Sundry items 568 557 17 (311)
54,622 50,841
Less: deferred tax assets of the tax consolidated group offset
against deferred tax liabilities (42,891) (38,649)
11,731 12,192
Deferred tax assets
Deferred tax assets comprise:
Difference in depreciation and amortisation of property, plant
and equipment and intangible assets for accounting and income
tax purposes 6,102 6,296
283
(1,879)
Share of joint arrangement timing differences 10,971 10,105 (866) (898)
Provisions and accrued employee benefits not currently deductible 11,334 8,527 (2,795) 543
Deferred revenue 5,927 4,864 (1,071) (200)
Accrued expenses 1,177 2,024 845 (1,037)
Discounted long term lease and non-interest bearing loan liabilities 34 34 – –
Difference between book and tax values of residential apartment
development – 17
17
479
Share-based payments not currently deductible for tax 2,669 3,472 803 (1,288)
Capital losses offsetting unrealised capital gains 286 – (286) –
Tax losses carried forward 4,842 5,398 865 2,072
Unrealised foreign exchange losses not currently deductible 2,924 2,744 – 211
Sundry items 1,396 1,501 145 (719)
47,662 44,982
Less: deferred tax liabilities of the tax consolidated group offset
against deferred tax assets (42,891) (38,649)
4,771 6,333
Deferred tax expense/(benefit) 3,155 (1,550)

N O T E S T O T H E F I N A N C I A L S T A T E M E N T S F O R T H E Y E A R E N D E D 3 0 J U N E 2 0 1 8
S E C T I O N 2 – P E R F O R M A N C E F O R T H E Y E A R
48 EVENT Hospitality & Entertainment Limited – 2018 Annual Report
2.5 – EARNINGS PER SHARE
Basic earnings per share (“EPS”) is calculated by dividing the profit for the period attributable to members of the Company by
the weighted average number of ordinary shares of the Company.
Diluted EPS adjusts the figures used in the determination of basic EPS to take into account the after-income tax effect of interest
and other financing costs associated with dilutive potential ordinary shares and the weighted average number of shares assumed
to have been issued for no consideration in relation to dilutive potential ordinary shares.
2018 2017
$’000 $’000
Profit attributable to ordinary shareholders (basic and diluted) 111,910 110,819
Number Number
Weighted average number of ordinary shares (basic)
160,195,475
159,162,961
Effect of performance shares and performance rights 1,368,020 2,076,392
Weighted average number of ordinary shares (diluted) 161,563,495 161,239,353
Further details in relation to the Executive Performance Rights Plan and Executive Performance Share Plan are provided in Note
6.1.

N O T E S T O T H E F I N A N C I A L S T A T E M E N T S F O R T H E Y E A R E N D E D 3 0 J U N E 2 0 1 8
S E C T I O N 3 – O P E R A T I N G A S S E T S A N D L I A B I L I T I E S
49 EVENT Hospitality & Entertainment Limited – 2018 Annual Report
This section shows the assets used to generate the Group’s trading performance and the liabilities incurred as a
result. Liabilities relating to the Group’s financing activities are addressed in section 4. Deferred tax assets and
liabilities are shown in Note 2.4.
On the following pages, there are sections covering working capital balances, property, plant and equipment,
investment properties, intangible assets and provisions.
3.1 – TRADE AND OTHER RECEIVABLES
Trade and other receivables are recognised initially at fair value, and subsequently at the amounts considered recoverable
(amortised cost). Where the payment terms for the sale of an asset are deferred, the receivable is discounted using the
prevailing rate for a similar instrument of an issuer with similar credit terms. The unwinding of the discount is treated as finance
revenue.
Trade receivables are non-interest bearing and are generally on 30 to 90 day terms. The Group’s exposure to credit and foreign
exchange risks related to trade and other receivables is disclosed in Note 4.5.
Estimates are used in determining the level of receivables that will not be collected, and these estimates take into account
factors such as historical experience. Allowances are made for impairment losses when there is sufficient evidence that the
Group will not be able to collect all amounts due. These allowances are made until such time that the Group is satisfied that no
recovery of the amount owing is possible; at that point, the amount considered irrecoverable is written off against the asset
directly.
The carrying value of trade and other receivables is considered to approximate fair value.
Receivables are stated with the amount of goods and services tax (“GST”) or equivalent tax included.
2018
$’000
2017
$’000
Current
Trade receivables 23,683 26,581
Less: allowance for trade receivables (617) (615)
23,066 25,966
Other receivables 32,227 29,085
55,293 55,051
Non-current
Other receivables 1,000 1,476
Receivable from associates 42 43
1,042 1,519
As at 30 June 2018, trade receivables with a value of $617,000 (2017: $615,000) were impaired and fully provided for. The
movement in the allowance is not considered material.
As at 30 June 2018, trade receivables for the Group that were past due but not impaired were $4,533,000 (2017: $4,048,000), of
which $3,113,000 (2017: $2,112,000) was less than 30 days overdue. The remainder is not considered material and consequently
an ageing analysis has not been provided.
Other current receivables of $32,227,000 (2017: $29,085,000) do not contain impaired assets and are not past due. Based on the
credit history of these other receivables, it is expected that these amounts will be recovered when due.

N O T E S T O T H E F I N A N C I A L S T A T E M E N T S F O R T H E Y E A R E N D E D 3 0 J U N E 2 0 1 8
S E C T I O N 3 – O P E R A T I N G A S S E T S A N D L I A B I L I T I E S
50 EVENT Hospitality & Entertainment Limited – 2018 Annual Report
3.2 – INVENTORIES
Inventories are measured at the lower of cost and net realisable value. Work in progress is valued at cost. Cost is based on the
first-in-first-out principle and includes expenditure incurred in bringing inventories to their existing condition and location.
3.3 – PROPERTY, PLANT AND EQUIPMENT
Property, plant and equipment
Property, plant and equipment are the physical assets used by the Group to generate revenue and profit. These assets include
land and buildings, and plant and equipment. Property, plant and equipment are recognised at cost (which is the amount initially
paid for them) less accumulated depreciation (the estimate of annual wear and tear) and impairment losses.
The Group leases properties in the normal course of business, principally to conduct its cinema exhibition businesses. On
inception of a lease, the estimated cost of decommissioning any additions to these properties (known as leasehold
improvements) is included within property, plant and equipment and depreciated over the lease term. A corresponding
provision is set up as disclosed in Note 3.7.
Where parts of an item of property, plant and equipment have different useful lives, they are accounted for separately.
Depreciation is charged to the Income Statement on a straight-line basis over the asset’s estimated useful life. The major
categories of property, plant and equipment are depreciated as follows:
• plant and equipment 3 – 20 years;
• buildings and improvements subject to long term leases Shorter of estimated useful life and term of lease;
• freehold buildings 40 – 80 years; and
• resort apartments and share of common property 40 – 80 years.
Freehold land and land subject to long term leases are not depreciated. Similarly, assets under construction (classified as capital
work in progress) are not depreciated until they come into use, when they are transferred to buildings or plant and equipment
as appropriate.
Impairment of property, plant and equipment
Property, plant and equipment that are subject to depreciation are reviewed for impairment whenever events or changes in
circumstances indicate that the carrying amount may not be recoverable. Indicators of impairment may include changes in
technology and business performance.
The process of impairment testing is to estimate the recoverable amount of the assets concerned, and recognise an impairment
loss in the Income Statement whenever the carrying amount of those assets exceeds the recoverable amount.
Impairment testing of property, plant and equipment is performed at an individual hotel or cinema site level, with the exception
of cinema sites within a single geographic location, which are tested as one cash-generating unit. Details regarding impairment
testing performed at 30 June 2018 is set out below.

NO
TE
S T
O T
HE
F
INA
NC
IA
L S
TA
TE
ME
NT
S F
OR
T
HE
YE
AR
E
ND
ED
30
JU
NE
20
18
SE
CT
ION
3 –
O
PE
RA
TIN
G A
SS
ET
S A
ND
L
IAB
IL
IT
IE
S
51
EV
EN
T H
osp
ita
lity
& E
nte
rta
inm
en
t Li
mit
ed
– 2
01
8 A
nn
ua
l Re
po
rt
3.3
– P
RO
PE
RT
Y,
PLA
NT
AN
D E
QU
IPM
EN
T (
con
tin
ue
d)
Fre
eh
old
la
nd
an
d b
uil
din
gs
Lan
d s
ub
ject
to
lon
g t
erm
le
ase
s
Bu
ild
ing
s a
nd
imp
rov
em
en
ts
sub
ject
to
lo
ng
term
le
ase
s
Re
sort
ap
art
me
nts
an
d s
ha
re o
f
com
mo
n p
rop
ert
y
Pla
nt
an
d
eq
uip
me
nt
Ca
pit
al
wo
rk i
n
pro
gre
ss
To
tal
$
’00
0
$’0
00
$
’00
0
$’0
00
$
’00
0
$’0
00
$
’00
0
20
18
Gro
ss b
ala
nce
at
the
be
gin
nin
g o
f th
e y
ea
r 7
41
,09
1
1,3
44
3
47
,61
0
34
,05
5
75
9,0
56
2
09
,94
4
2,0
93
,10
0
Acc
um
ula
ted
de
pre
cia
tio
n,
am
ort
isa
tio
n a
nd
imp
air
me
nts
at
the
be
gin
nin
g o
f th
e y
ea
r
(11
4,7
99
)
–
(20
3,4
20
)
(26
,07
4)
(51
1,0
99
)
–
(85
5,3
92
)
Ne
t b
ala
nce
at
the
be
gin
nin
g o
f th
e y
ea
r 6
26
,29
2
1,3
44
1
44
,19
0
7,9
81
2
47
,95
7
20
9,9
44
1
,23
7,7
08
Ad
dit
ion
s 1
,69
6
–
7,2
67
–
1
8,9
08
1
41
,51
7
16
9,3
88
Ad
dit
ion
s fr
om
acq
uis
itio
ns
–
–
–
–
39
7
–
39
7
Tra
nsf
ers
1
48
,62
4
–
19
,67
5
–
33
,01
4
(20
1,8
53
) (5
40
)
Dis
po
sals
(3
9)
–
(39
) –
(8
33
) –
(9
11
)
De
pre
cia
tio
n a
nd
am
ort
isa
tio
n
(10
,27
0)
–
(13
,35
1)
(22
9)
(47
,28
4)
–
(71
,13
4)
Imp
air
me
nt
(4,9
31
) –
(9
93
) –
(7
,18
8)
–
(13
,11
2)
Eff
ect
of
mo
vem
en
t in
fo
reig
n e
xch
an
ge
1
,75
9
(39
) (6
76
) –
1
9
(94
2)
12
1
At
30
Ju
ne
20
18
7
63
,13
1
1,3
05
1
56
,07
3
7,7
52
2
44
,99
0
14
8,6
66
1
,32
1,9
17
Gro
ss b
ala
nce
at
the
en
d o
f th
e y
ea
r 8
93
,54
7
1,3
05
3
76
,77
5
34
,05
5
78
7,4
21
1
48
,66
6
2,2
41
,76
9
Acc
um
ula
ted
de
pre
cia
tio
n,
am
ort
isa
tio
n a
nd
imp
air
me
nts
at
the
en
d o
f th
e y
ea
r
(13
0,4
16
)
–
(22
0,7
02
)
(26
,30
3)
(54
2,4
31
)
–
(91
9,8
52
)
Ne
t b
ala
nce
at
the
en
d o
f th
e y
ea
r 7
63
,13
1
1,3
05
1
56
,07
3
7,7
52
2
44
,99
0
14
8,6
66
1
,32
1,9
17
20
17
Gro
ss b
ala
nce
at
the
be
gin
nin
g o
f th
e y
ea
r 6
62
,55
7
1,3
45
3
40
,04
5
31
,86
0
73
0,9
39
9
6,4
91
1
,86
3,2
37
Acc
um
ula
ted
de
pre
cia
tio
n,
am
ort
isa
tio
n a
nd
imp
air
me
nts
at
the
be
gin
nin
g o
f th
e y
ea
r
(11
4,7
99
)
–
(19
3,2
66
)
(23
,65
2)
(48
8,8
37
)
–
(82
0,5
54
)
Ne
t b
ala
nce
at
the
be
gin
nin
g o
f th
e y
ea
r 5
47
,75
8
1,3
45
1
46
,77
9
8,2
08
2
42
,10
2
96
,49
1
1,0
42
,68
3
Ad
dit
ion
s 2
7,9
11
–
5
,18
9
–
16
,99
0
22
9,4
73
2
79
,56
3
Ad
dit
ion
s fr
om
acq
uis
itio
ns
–
–
37
7
–
1,3
85
–
1
,76
2
Tra
nsf
ers
6
8,1
83
–
5
,08
9
–
41
,92
4
(11
4,0
91
) 1
,10
5
Dis
po
sals
(1
41
) –
–
–
(3
,42
0)
–
(3,5
61
)
Dis
po
sal o
f b
usi
ne
ss
(2,0
96
) –
(4
30
) –
(3
,17
7)
–
(5,7
03
)
De
pre
cia
tio
n a
nd
am
ort
isa
tio
n
(9,1
77
) –
(1
2,7
78
) (2
27
) (4
4,8
04
) –
(6
6,9
86
)
Imp
air
me
nt
(6,1
79
) –
–
–
(2
,69
1)
(2,1
16
) (1
0,9
86
)
Eff
ect
of
mo
vem
en
t in
fo
reig
n e
xch
an
ge
3
3
(1)
(36
) –
(3
52
) 1
87
(1
69
)
At
30
Ju
ne
20
17
6
26
,29
2
1,3
44
1
44
,19
0
7,9
81
2
47
,95
7
20
9,9
44
1
,23
7,7
08
Gro
ss b
ala
nce
at
the
en
d o
f th
e y
ea
r 7
41
,09
1
1,3
44
3
47
,61
0
34
,05
5
75
9,0
56
2
09
,94
4
2,0
93
,10
0
Acc
um
ula
ted
de
pre
cia
tio
n,
am
ort
isa
tio
n a
nd
imp
air
me
nts
at
the
en
d o
f th
e y
ea
r
(11
4,7
99
)
–
(20
3,4
20
)
(26
,07
4)
(51
1,0
99
)
–
(85
5,3
92
)
Ne
t b
ala
nce
at
the
en
d o
f th
e y
ea
r 6
26
,29
2
1,3
44
1
44
,19
0
7,9
81
2
47
,95
7
20
9,9
44
1
,23
7,7
08

N O T E S T O T H E F I N A N C I A L S T A T E M E N T S F O R T H E Y E A R E N D E D 3 0 J U N E 2 0 1 8
S E C T I O N 3 – O P E R A T I N G A S S E T S A N D L I A B I L I T I E S
52 EVENT Hospitality & Entertainment Limited – 2018 Annual Report
3.3 – PROPERTY, PLANT AND EQUIPMENT (continued)
Independent valuations of interest in land and buildings
In assessing current values for the Group’s interest in land and buildings and integral plant and equipment, including long term
leasehold land and improvements, the directors have relied in most cases upon independent valuations from registered qualified
valuers or management value in use calculations. Except for investment properties, which are revalued every half year (refer to
Note 3.4), valuations are generally carried out on a progressive three year cycle. The last valuations were completed as at June
2018 and June 2016.
Measurement of fair values
Amounts disclosed below represent the fair value of the Group’s interest in land and buildings, excluding investment properties,
as determined at the time of the most recent independent valuation report. Independent registered qualified valuers are
engaged to perform the valuations. The values are determined based on the highest and best use of each property. In most
cases, the existing use is the highest and best use and values are determined on a going concern basis. For certain properties,
the highest and best use may differ from the current use, and consideration may be given to the development of such properties
at an appropriate time in the future in order to realise the full value of the property.
This fair value disclosure has been categorised as a Level 3 fair value based on the inputs to the valuation techniques used. Going
concern value is based on capitalisation and discounted cash flow methodologies, and significant unobservable inputs include
the forecast net income for each property, and the capitalisation and discount rates used in determining fair value. In the most
recent valuations, capitalisation rates utilised ranged from 4.75% to 12.25% and pre-tax discount rates utilised ranged from 6.5%
to 13.75% per annum. For certain sites where the going concern value was not the highest and best use, fair value was
determined using a direct comparison methodology with reference to recent sales of similar properties.
The fair values determined by the independent registered qualified valuers are sensitive to changes in these significant
unobservable inputs. However, overall the fair value of the Group’s interest in land and buildings, excluding investment
properties, is significantly higher than the book value of these interests as noted below.
Most recent valuations of interest in land and buildings, excluding investment properties
2018
$’000
2017
$’000
A summary of recent independent valuations, by year of the last valuation, is set out as
follows:
Existing use is highest and best use
Independent valuation – 2018 1,367,255 –
– 2016 206,580 474,326
– 2015 – 576,110
1,573,835 1,050,436
Alternate use is highest and best use
Independent valuation – 2018 101,707 –
– 2015 – 75,600
Land and buildings not independently valued
Book value of land and buildings not independently valued 287,758 389,626
1,963,300 1,515,662
The book value of the above interests at 30 June 2018 was $1,118,029,000 (2017: $1,044,822,000). The written-down book value
of plant and equipment which is deemed integral to land and buildings, has been determined to total approximately
$134,917,000 as at 30 June 2018 (2017: $139,857,000).
The above valuations do not take into account the potential impact of capital gains tax.

N O T E S T O T H E F I N A N C I A L S T A T E M E N T S F O R T H E Y E A R E N D E D 3 0 J U N E 2 0 1 8
S E C T I O N 3 – O P E R A T I N G A S S E T S A N D L I A B I L I T I E S
53 EVENT Hospitality & Entertainment Limited – 2018 Annual Report
3.3 – PROPERTY, PLANT AND EQUIPMENT (continued)
Impairment considerations at 30 June 2018
Hotel properties are treated as separate cash-generating units and their recoverable values were based upon the independent
valuations from registered qualified valuers at 30 June 2018, using the valuation parameters outlined above. The independent
valuations were compared to the carrying amount of hotel properties and, as a result of these assessments, no impairment
losses (2017: $10,986,000) were recognised in respect of hotel properties.
For hotels that had been subject to impairments in previous years, the trading performance and recoverable amount were also
reviewed during the year. As a result of the review, there were no impairment charges (2017: nil) booked in previous years, that
were required to be reversed in the year.
The trading performance of certain cinema sites caused the Group to assess their recoverable amount. Cinema sites are treated
as separate cash-generating units, with the exception of cinema sites within a single geographic location, which are tested as one
cash-generating unit. The recoverable values for each cinema site under review was based upon the independent valuations
from registered qualified valuers at 30 June 2018, using the valuation parameters outlined above. Impairment losses totalling
$13,112,000 (2017: nil) were recorded as a result of this assessment.
Security
The following assets, whose carrying values are listed below, are subject to mortgage security to secure the Group’s bank loan
facilities (refer to Note 4.4):
2018
$’000
2017
$’000
Freehold land and buildings 253,092 257,622
Freehold land and buildings classified as investment properties 16,750 13,750
269,842 271,372
Capital commitments
2018
$’000
2017
$’000
Capital expenditure commitments contracted but not provided for and payable 46,959 70,715

N O T E S T O T H E F I N A N C I A L S T A T E M E N T S F O R T H E Y E A R E N D E D 3 0 J U N E 2 0 1 8
S E C T I O N 3 – O P E R A T I N G A S S E T S A N D L I A B I L I T I E S
54 EVENT Hospitality & Entertainment Limited – 2018 Annual Report
3.4 – INVESTMENT PROPERTIES
Accounting policy
Investment properties comprise land and buildings which are held for long term rental yields or for capital appreciation, or both,
and are not occupied by the Group in the ordinary course of business or for administration purposes. Initially, investment
properties are measured at cost including transaction costs. Subsequent to initial recognition, investment properties are stated
at fair value with any change therein recognised in profit or loss. Property that is being constructed or redeveloped for future
use as an investment property is also measured at fair value (unless a fair value cannot be reliably determined).
When the use of a property changes from owner occupied to investment property, the property is reclassified as an investment
property. Any difference at the date of transfer between the carrying amount of the property immediately prior to transfer and
its fair value is recognised directly to the investment property revaluation reserve if it is an increase and to profit or loss if it is a
decrease. A gain may be recognised to profit on remeasurement only to the extent it reverses a previous impairment loss on the
property. Subsequent transfers from investment property to property, plant and equipment or inventories occur when there is a
change in use of the property, usually evidenced by commencement of redevelopment for own use.
Investment properties are derecognised when they have either been disposed of or when the investment property is
permanently withdrawn from use and no future benefit is expected from its disposal. Any gains or losses on derecognition of an
investment property are recognised in profit or loss in the period of derecognition.
Fair value of investment properties
Investment properties are independently revalued to fair value each reporting period, with any gain or loss arising on
remeasurement being recognised in profit or loss. The fair value of investment property has been categorised as a Level 3 fair
value based on the inputs to the valuation technique used. In assessing the fair value of investment properties, a number of
assumptions are made at the end of each reporting period regarding future cash flows, future property market economic
conditions and other factors including cash flow discount rates, rental capitalisation rates, and recent market transactions for
similar properties.
The carrying amount of investment properties is the fair value of the properties as determined by an independent registered
qualified valuer. The significant unobservable inputs used by the valuer in determining the fair value of the investment
properties held by the Group at 30 June 2018 included capitalisation rates on reversionary rental yields in the range of 6.25% to
7.25% (2017: 6.75% to 8.50%).
Investment properties comprise a number of commercial properties that are leased to third parties and which are held to derive
rental income or capital appreciation or both. Each of the leases for investment properties contains an initial non-cancellable
period of between five and 15 years. Subsequent renewals are negotiated with the lessee. No contingent rents are charged for
these investment properties.
During the year ended 30 June 2018, $6,004,000 (2017: $6,494,000) was recognised as rental income for investment properties
in the Income Statement, with $1,645,000 (2017: $1,377,000) incurred in respect of direct costs, including $243,000 (2017:
$145,000) for repairs and maintenance.
2018
$’000
2017
$’000
Freehold land and buildings
At fair value (Level 3 fair values) 74,000 68,250
Summary of movements:
Balance at the beginning of the year 68,250 68,500
Fair value increment/(decrement) 5,750 (250)
Balance at the end of the year 74,000 68,250

N O T E S T O T H E F I N A N C I A L S T A T E M E N T S F O R T H E Y E A R E N D E D 3 0 J U N E 2 0 1 8
S E C T I O N 3 – O P E R A T I N G A S S E T S A N D L I A B I L I T I E S
55 EVENT Hospitality & Entertainment Limited – 2018 Annual Report
3.5 – GOODWILL AND OTHER INTANGIBLE ASSETS
Accounting policy
Goodwill
Goodwill arises from business combinations as described in Note 5.1 and represents the future economic benefits that arise
from assets that are not capable of being individually identified and separately recognised.
Following initial recognition, goodwill is measured at cost less any accumulated impairment losses. Goodwill is not amortised,
but instead is reviewed for impairment annually or more frequently if events or changes in circumstances indicate that the
carrying value may be impaired.
Goodwill is allocated to cash-generating units, and impairment is determined by assessing the recoverable amount of the cash-
generating unit to which the goodwill relates. Where the recoverable amount of the cash-generating unit is less than the
carrying amount, an impairment loss is recognised. An impairment loss recognised in respect of goodwill cannot be reversed.
The carrying amount of goodwill in respect of associates and joint ventures is included in the carrying amount of the investment
in the associate or joint venture.
Construction rights
Construction rights relate to the Group’s ability to develop accommodation in the Thredbo Alpine Resort. Construction rights are
recognised at cost and are derecognised as the rights are either sold or developed. The carrying value of construction rights is
reviewed annually. Any amounts no longer considered recoverable are written off, with the impairment loss recorded in profit or
loss.
Other intangible assets
Other intangible assets, which largely comprise management and leasehold rights and software, are stated at cost less
accumulated amortisation and impairment losses. Management and leasehold rights are amortised over the life of the
agreements, which range from 10 to 20 years, on a straight-line basis. Software for major operating systems is amortised over a
four to five year period on a straight-line basis.
Impairment
The carrying amounts of the Group’s non-financial assets, other than investment properties (see Note 3.4), are reviewed at each
reporting date to determine whether there is any indication of impairment. Where an indicator of impairment exists, the Group
makes a formal estimate of the asset’s recoverable amount. For goodwill, the recoverable amount is estimated each year at the
same time.
The recoverable amount of assets or cash-generating units is the greater of their fair value less costs to sell, and their value in
use. In assessing value in use, the estimated future cash flows are discounted to their present value using a pre-tax discount rate
that reflects current market assessments of the time value of money and the risks specific to the asset or cash-generating unit.
For an asset that does not generate largely independent cash inflows, the recoverable amount is determined for the cash-
generating unit to which the asset belongs.
Where the carrying amount of an asset or its related cash-generating unit exceeds its recoverable amount, the asset is
considered impaired and is written down to its recoverable amount. Impairment losses recognised in respect of cash-generating
units are allocated first to reduce the carrying value of any goodwill allocated to the cash-generating unit, and then to reduce the
carrying amounts of the other assets in the cash-generating unit on a pro-rata basis.
Impairment losses are recognised in profit or loss unless the asset or its cash-generating unit has previously been revalued, in
which case the impairment loss is recognised as a reversal to the extent of the previous revaluation, with any excess recognised
in profit or loss.
An impairment loss in respect of goodwill cannot be reversed. In respect of other assets, impairment losses recognised in prior
periods are assessed at each reporting date for any indications that the loss has decreased or no longer exists. An impairment
loss is reversed only to the extent that the asset’s carrying amount does not exceed the carrying amount that would have been
determined, net of depreciation or amortisation, if no impairment loss had been recognised.
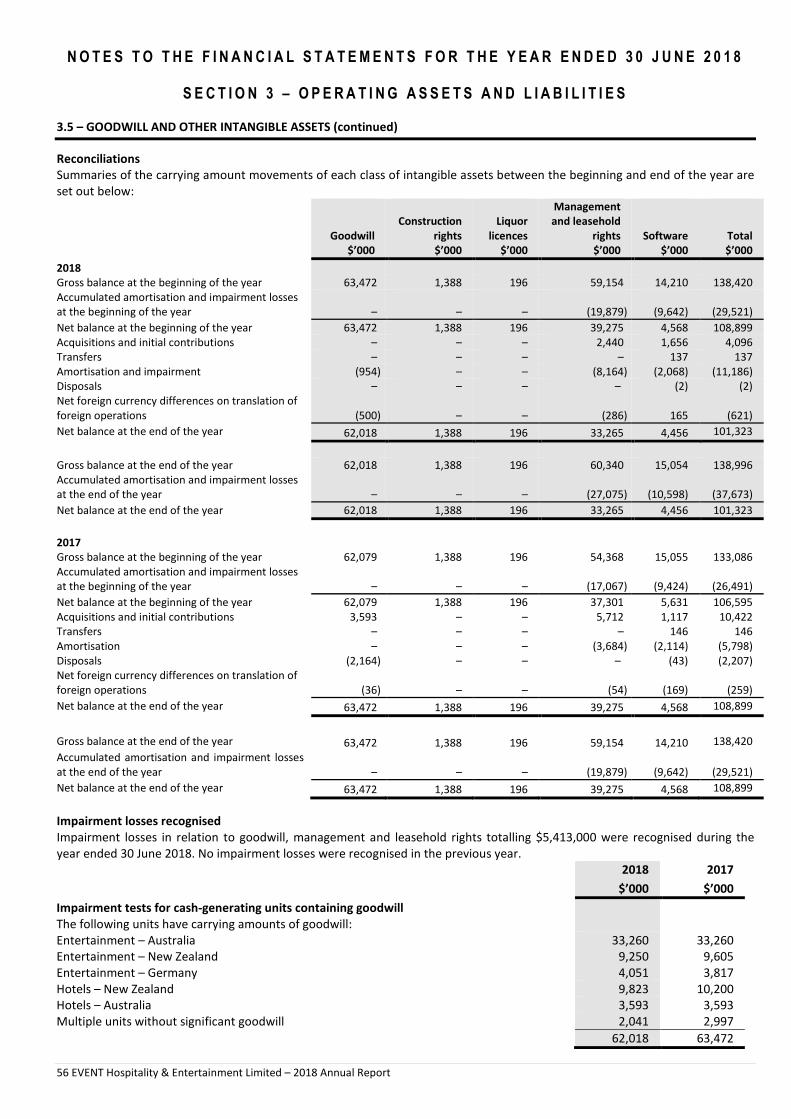
N O T E S T O T H E F I N A N C I A L S T A T E M E N T S F O R T H E Y E A R E N D E D 3 0 J U N E 2 0 1 8
S E C T I O N 3 – O P E R A T I N G A S S E T S A N D L I A B I L I T I E S
56 EVENT Hospitality & Entertainment Limited – 2018 Annual Report
3.5 – GOODWILL AND OTHER INTANGIBLE ASSETS (continued)
Reconciliations
Summaries of the carrying amount movements of each class of intangible assets between the beginning and end of the year are
set out below:
Goodwill
$’000
Construction
rights
$’000
Liquor
licences
$’000
Management
and leasehold
rights
$’000
Software
$’000
Total
$’000
2018
Gross balance at the beginning of the year 63,472 1,388 196 59,154 14,210 138,420
Accumulated amortisation and impairment losses
at the beginning of the year – – – (19,879) (9,642) (29,521)
Net balance at the beginning of the year 63,472 1,388 196 39,275 4,568 108,899
Acquisitions and initial contributions – – – 2,440 1,656 4,096
Transfers – – – – 137 137
Amortisation and impairment (954) – – (8,164) (2,068) (11,186)
Disposals – – – – (2) (2)
Net foreign currency differences on translation of
foreign operations (500) – – (286) 165
(621)
Net balance at the end of the year 62,018 1,388 196 33,265 4,456 101,323
Gross balance at the end of the year 62,018 1,388 196 60,340 15,054 138,996
Accumulated amortisation and impairment losses
at the end of the year – – – (27,075) (10,598) (37,673)
Net balance at the end of the year 62,018 1,388 196 33,265 4,456 101,323
2017
Gross balance at the beginning of the year 62,079 1,388 196 54,368 15,055 133,086
Accumulated amortisation and impairment losses
at the beginning of the year – – – (17,067) (9,424) (26,491)
Net balance at the beginning of the year 62,079 1,388 196 37,301 5,631 106,595
Acquisitions and initial contributions 3,593 – – 5,712 1,117 10,422
Transfers – – – – 146 146
Amortisation – – – (3,684) (2,114) (5,798)
Disposals (2,164) – – – (43) (2,207)
Net foreign currency differences on translation of
foreign operations (36) – – (54) (169)
(259)
Net balance at the end of the year 63,472 1,388 196 39,275 4,568 108,899
Gross balance at the end of the year 63,472 1,388 196 59,154 14,210 138,420
Accumulated amortisation and impairment losses
at the end of the year – – – (19,879) (9,642)
(29,521)
Net balance at the end of the year 63,472 1,388 196 39,275 4,568 108,899
Impairment losses recognised
Impairment losses in relation to goodwill, management and leasehold rights totalling $5,413,000 were recognised during the
year ended 30 June 2018. No impairment losses were recognised in the previous year.
2018
$’000
2017
$’000
Impairment tests for cash-generating units containing goodwill
The following units have carrying amounts of goodwill:
Entertainment – Australia 33,260 33,260
Entertainment – New Zealand 9,250 9,605
Entertainment – Germany 4,051 3,817
Hotels – New Zealand 9,823 10,200
Hotels – Australia 3,593 3,593
Multiple units without significant goodwill 2,041 2,997
62,018 63,472

N O T E S T O T H E F I N A N C I A L S T A T E M E N T S F O R T H E Y E A R E N D E D 3 0 J U N E 2 0 1 8
S E C T I O N 3 – O P E R A T I N G A S S E T S A N D L I A B I L I T I E S
57 EVENT Hospitality & Entertainment Limited – 2018 Annual Report
3.5 – GOODWILL AND OTHER INTANGIBLE ASSETS (continued)
The recoverable value of goodwill relating to the exhibition business in Australia and New Zealand, and goodwill relating to the
Group’s share of a cinema joint venture in Germany, has been determined by value in use calculations. This calculation uses cash
flow projections based on operating forecasts and projected five year results, with cash flows beyond the five year period being
projected using a per annum growth rate of 2.5%, which is considered appropriate given economic indicators and the expected
long term increase in revenue and operating costs in these markets. Pre-tax discount rates of 8.18% to 12.0% (2017: 7.86% to
12.0%) per annum have been used in discounting the projected cash flows. In management’s assessment, there are no
reasonable possible changes in assumptions that would give rise to an impairment.
3.6 – TRADE AND OTHER PAYABLES
Trade and other payables are recognised initially at fair value plus any directly attributable transaction costs. Subsequent to
initial recognition, these financial liabilities are measured at amortised cost. Trade payables are normally non-interest bearing
and settled within 30 days. Payables are stated with the amount of GST or equivalent tax included.
The carrying value of trade and other payables is considered to approximate fair value.
2018
$’000
2017
$’000
Trade payables 30,759 20,381
Other payables and accruals 76,188 86,514
106,947 106,895
3.7 – PROVISIONS
Accounting policy
Employee benefits
Provision is made for employee benefits including annual leave and long service leave for employees. The provision is calculated
as the present value of the Group’s net obligation to pay such benefits resulting from the employees’ services provided up to the
reporting date. The provisions due or available to be settled within 12 months have been calculated at undiscounted amounts
based on the remuneration rates the employer expects to pay after the reporting date and includes related on-costs.
The liability for employees’ benefits to long service leave represents the present value of the estimated future cash outflows to
be made by the employer resulting from employees’ services provided up to the reporting date.
Liabilities for employee benefits which are not due to be settled within 12 months are discounted using the rates attaching to
national government securities at reporting date, which most closely match the terms of maturity of the related liabilities.
In determining the liability for employee benefits, consideration has been given to future increases in wage and salary rates, and
the Group’s experience with staff departures. Related on-costs have also been included in the liability.
Insurance loss contingencies and other claims
The insurance loss contingencies and other claims provision relates to estimated costs to be incurred in respect of various claims
that are expected to be settled within 12 months of the balance date.
Decommissioning of leasehold improvements
A provision for the estimated cost of decommissioning leasehold improvements is made where a legal or constructive obligation
exists.
In determining the provision for decommissioning costs, an assessment is made for each location of the likelihood and amount
of the decommissioning costs to be incurred in the future. The estimated future liability is discounted to a present value, with
the discount amount unwinding over the life of the leasehold asset as a finance cost in profit or loss. The estimated
decommissioning cost recognised as a provision is included as part of the cost of the leasehold improvements at the time of
installation or during the term of the lease, as the liability for decommissioning is reassessed. This amount capitalised is then
depreciated over the life of the asset.

N O T E S T O T H E F I N A N C I A L S T A T E M E N T S F O R T H E Y E A R E N D E D 3 0 J U N E 2 0 1 8
S E C T I O N 3 – O P E R A T I N G A S S E T S A N D L I A B I L I T I E S
58 EVENT Hospitality & Entertainment Limited – 2018 Annual Report
3.7 – PROVISIONS (continued)
Decommissioning of leasehold improvements (continued)
The decommissioning of leasehold improvements provision has been raised in respect of “make-good” obligations under long
term lease contracts for various cinema sites. In determining the provision, an assessment has been made, for each location, of
the likelihood that a decommissioning cost will be incurred in the future and, where applicable, the level of costs to be incurred.
Uncertainty exists in estimating the level of costs to be incurred in the future because of the long term nature of cinema leases.
The basis of accounting is set out in Note 3.3.
Other
Other provisions are recognised in the Statement of Financial Position when the Group has a present legal or constructive
obligation as a result of a past event, and it is probable that an outflow of economic benefits will be required to settle the
obligation. Provisions are determined by discounting the expected future cash flows at a pre-tax rate that reflects current market
assessments of the time value of money and, where appropriate, the risks specific to the liability. The unwinding of the discount
is recognised as a finance cost.
2018
$’000
2017
$’000
Current
Employee benefits 20,385 20,532
Insurance loss contingencies and other claims 75 81
Onerous contract 205 –
20,665 20,613
Non-current
Employee benefits 3,025 2,830
Onerous contract 286 –
Decommissioning of leasehold improvements 13,132 11,510
16,443 14,340
Movements in provisions
Movements in the carrying amounts of each class of provisions, except for employee benefits,
are set out below:
Insurance loss contingencies and other claims
Carrying amount at the beginning of the year 81 75
Payments (34) (20)
Provided 28 26
Carrying amount at the end of the year 75 81
Onerous contract
Carrying amount at the beginning of the year − −
Provided 491 −
Carrying amount at the end of the year 491 −
Decommissioning of leasehold improvements
Carrying amount at the beginning of the year 11,510 11,377
Provided 1,140 96
Reversed (62) (50)
Notional interest 200 114
Net foreign currency differences on translation of foreign operations 344 (27)
Carrying amount at the end of the year 13,132 11,510
3.8 – OTHER LIABILITIES
Other liabilities include contract deposits received in advance and deferred lease incentive balances arising from operating
leases. Refer to Note 7.1 for further details regarding operating lease arrangements.
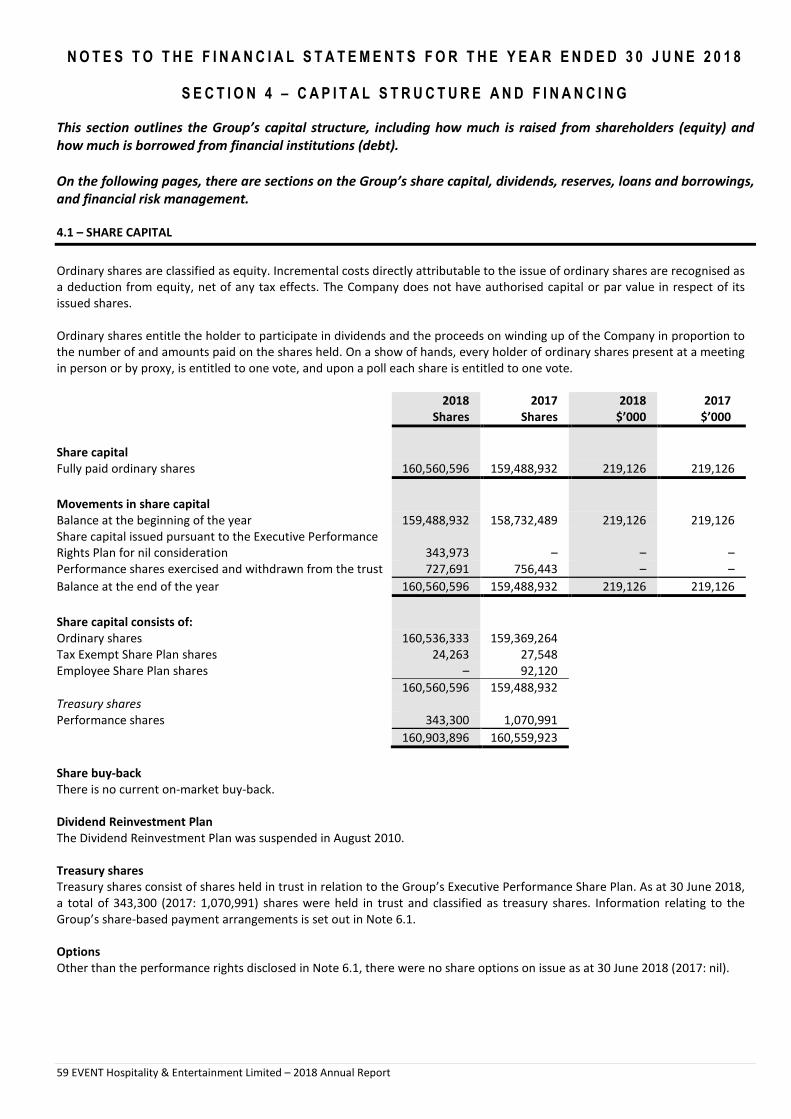
N O T E S T O T H E F I N A N C I A L S T A T E M E N T S F O R T H E Y E A R E N D E D 3 0 J U N E 2 0 1 8
S E C T I O N 4 – C A P I T A L S T R U C T U R E A N D F I N A N C I N G
59 EVENT Hospitality & Entertainment Limited – 2018 Annual Report
This section outlines the Group’s capital structure, including how much is raised from shareholders (equity) and
how much is borrowed from financial institutions (debt).
On the following pages, there are sections on the Group’s share capital, dividends, reserves, loans and borrowings,
and financial risk management.
4.1 – SHARE CAPITAL
Ordinary shares are classified as equity. Incremental costs directly attributable to the issue of ordinary shares are recognised as
a deduction from equity, net of any tax effects. The Company does not have authorised capital or par value in respect of its
issued shares.
Ordinary shares entitle the holder to participate in dividends and the proceeds on winding up of the Company in proportion to
the number of and amounts paid on the shares held. On a show of hands, every holder of ordinary shares present at a meeting
in person or by proxy, is entitled to one vote, and upon a poll each share is entitled to one vote.
2018
Shares
2017
Shares
2018
$’000
2017
$’000
Share capital
Fully paid ordinary shares 160,560,596 159,488,932 219,126 219,126
Movements in share capital
Balance at the beginning of the year 159,488,932 158,732,489 219,126 219,126
Share capital issued pursuant to the Executive Performance
Rights Plan for nil consideration
343,973
– – –
Performance shares exercised and withdrawn from the trust 727,691 756,443 – –
Balance at the end of the year 160,560,596 159,488,932 219,126 219,126
Share capital consists of:
Ordinary shares 160,536,333 159,369,264
Tax Exempt Share Plan shares 24,263 27,548
Employee Share Plan shares – 92,120
160,560,596 159,488,932
Treasury shares
Performance shares 343,300 1,070,991
160,903,896 160,559,923
Share buy-back
There is no current on-market buy-back.
Dividend Reinvestment Plan
The Dividend Reinvestment Plan was suspended in August 2010.
Treasury shares
Treasury shares consist of shares held in trust in relation to the Group’s Executive Performance Share Plan. As at 30 June 2018,
a total of 343,300 (2017: 1,070,991) shares were held in trust and classified as treasury shares. Information relating to the
Group’s share-based payment arrangements is set out in Note 6.1.
Options
Other than the performance rights disclosed in Note 6.1, there were no share options on issue as at 30 June 2018 (2017: nil).

N O T E S T O T H E F I N A N C I A L S T A T E M E N T S F O R T H E Y E A R E N D E D 3 0 J U N E 2 0 1 8
S E C T I O N 4 – C A P I T A L S T R U C T U R E A N D F I N A N C I N G
60 EVENT Hospitality & Entertainment Limited – 2018 Annual Report
4.1 – SHARE CAPITAL (continued)
Capital management
The Group manages its capital with the objective of maintaining a strong capital base so as to maintain investor, creditor and
market confidence and to have the capacity to take advantage of opportunities that will enhance the existing businesses and
enable future growth and expansion. The Board monitors the return on capital, which the Group defines as operating profit after
income tax divided by shareholders’ equity and long term debt. The Board also monitors the Group’s gearing ratio, being net
debt divided by shareholders’ equity.
It is recognised that the Group operates in business segments in which operating results may be subject to volatility and the
Board continuously reviews the capital structure to ensure sufficient:
• surplus funding capacity is available;
• funds are available for capital expenditure and to implement longer term business development strategies; and
• funds are available to maintain appropriate dividend levels.
There were no changes in the Group’s approach to capital management during the year. No Group entity is subject to externally
imposed capital requirements.
4.2 – DIVIDENDS
Per share
Cents
Total
amount
$’000 Date of payment
Tax rate for
franking credit
Percentage
franked
Dividends on ordinary shares paid during the year were:
2018
Final 2017 dividend 31 49,774 21 September 2017 30% 100%
Interim 2018 dividend 21 33,790 15 March 2018 30% 100%
83,564
2017
Final 2016 dividend
31 49,774 22 September 2016 30% 100%
Interim 2017 dividend 20 32,112 16 March 2017 30% 100%
81,886
Subsequent events
Since the end of the year, the directors declared the following dividends:
Final 2018 dividend 31 49,880 20 September 2018 30% 100%
The financial effect of the final dividend in respect of the year has not been brought to account in the financial statements for
the year ended 30 June 2018 and will be recognised in subsequent financial statements.
2018
$’000
2017
$’000
Franking credit balance
The amount of franking credits available for future reporting periods 143,183 140,314
The impact on the franking account of dividends proposed or declared before the financial report was authorised for issue but
not recognised as a distribution to equity holders during the period is to reduce the balance by $21,377,000 (2017: $21,332,000).
The ability to utilise franking credits is dependent upon the Company being in a sufficient positive net asset position and also
having adequate available cash flow liquidity.
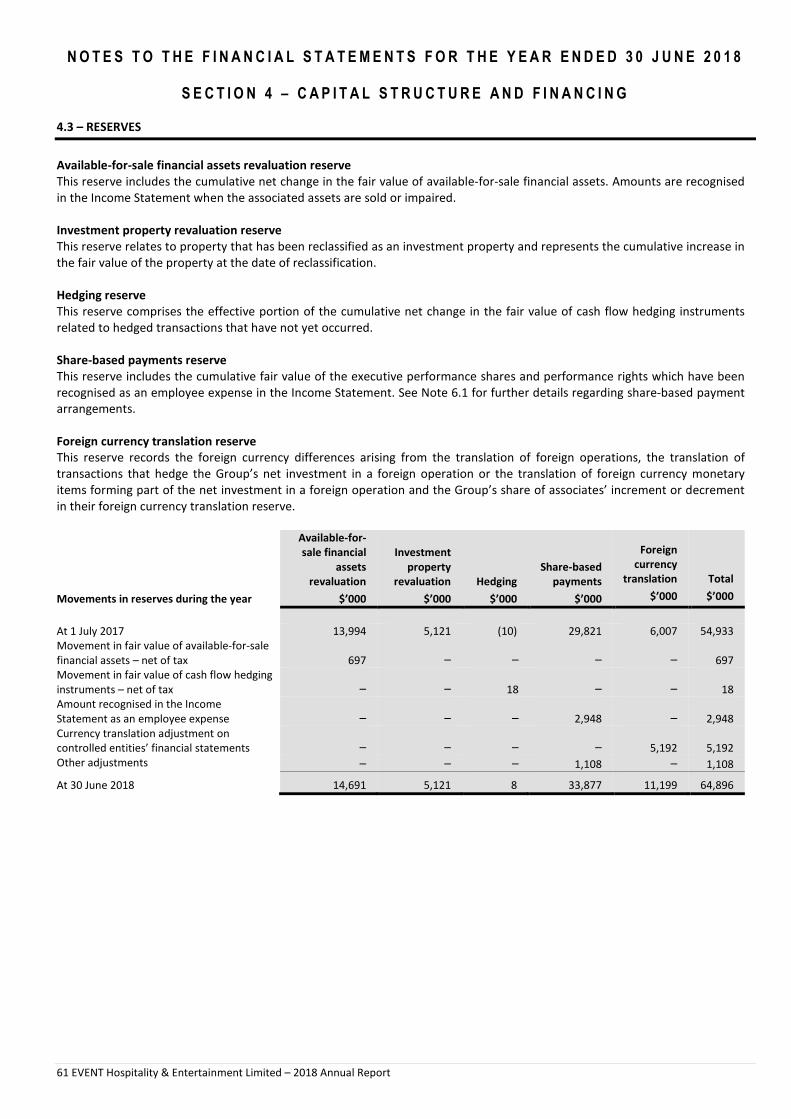
N O T E S T O T H E F I N A N C I A L S T A T E M E N T S F O R T H E Y E A R E N D E D 3 0 J U N E 2 0 1 8
S E C T I O N 4 – C A P I T A L S T R U C T U R E A N D F I N A N C I N G
61 EVENT Hospitality & Entertainment Limited – 2018 Annual Report
4.3 – RESERVES
Available-for-sale financial assets revaluation reserve
This reserve includes the cumulative net change in the fair value of available-for-sale financial assets. Amounts are recognised
in the Income Statement when the associated assets are sold or impaired.
Investment property revaluation reserve
This reserve relates to property that has been reclassified as an investment property and represents the cumulative increase in
the fair value of the property at the date of reclassification.
Hedging reserve
This reserve comprises the effective portion of the cumulative net change in the fair value of cash flow hedging instruments
related to hedged transactions that have not yet occurred.
Share-based payments reserve
This reserve includes the cumulative fair value of the executive performance shares and performance rights which have been
recognised as an employee expense in the Income Statement. See Note 6.1 for further details regarding share-based payment
arrangements.
Foreign currency translation reserve
This reserve records the foreign currency differences arising from the translation of foreign operations, the translation of
transactions that hedge the Group’s net investment in a foreign operation or the translation of foreign currency monetary
items forming part of the net investment in a foreign operation and the Group’s share of associates’ increment or decrement
in their foreign currency translation reserve.
Movements in reserves during the year
Available-for-
sale financial
assets
revaluation
$’000
Investment
property
revaluation
$’000
Hedging
$’000
Share-based
payments
$’000
Foreign
currency
translation
$’000
Total
$’000
At 1 July 2017 13,994 5,121 (10) 29,821 6,007 54,933
Movement in fair value of available-for-sale
financial assets – net of tax 697 – – – – 697
Movement in fair value of cash flow hedging
instruments – net of tax – – 18 – – 18
Amount recognised in the Income
Statement as an employee expense – – – 2,948 – 2,948
Currency translation adjustment on
controlled entities’ financial statements – – – – 5,192 5,192
Other adjustments – – – 1,108 – 1,108
At 30 June 2018 14,691 5,121 8 33,877 11,199 64,896

N O T E S T O T H E F I N A N C I A L S T A T E M E N T S F O R T H E Y E A R E N D E D 3 0 J U N E 2 0 1 8
S E C T I O N 4 – C A P I T A L S T R U C T U R E A N D F I N A N C I N G
62 EVENT Hospitality & Entertainment Limited – 2018 Annual Report
4.4 – LOANS, BORROWINGS AND FINANCING ARRANGEMENTS
Cash and cash equivalents
Cash and cash equivalents comprise cash balances and call deposits with an original maturity of three months or less. Bank
overdrafts that are repayable on demand and form an integral part of the Group’s cash management are included as a
component of cash and cash equivalents for the purpose of the Statement of Cash Flows.
Loans and borrowings
Interest bearing and non-interest bearing loans and borrowings are recognised initially at fair value less attributable transaction
costs. Subsequent to initial recognition, loans and borrowings are stated at amortised cost with any difference between cost and
redemption value being recognised in profit or loss over the period of the borrowings using the effective interest method. The
carrying value of loans and borrowings is considered to approximate fair value.
Finance costs
Finance costs include interest, unwinding of discounts or premiums relating to borrowings, amortisation of ancillary costs
incurred in connection with arrangement of borrowings and lease finance charges. Ancillary costs incurred in connection with
the arrangement of loans and borrowings are capitalised and amortised over the life of the borrowings. Finance costs are
expensed as incurred unless they relate to qualifying assets. Qualifying assets are assets which take more than 12 months to get
ready for their intended use or sale. Where funds are borrowed specifically for the acquisition, construction or production of a
qualifying asset, the amount of borrowing costs capitalised is that incurred in relation to that borrowing, net of any interest
earned on those borrowings. Borrowing costs that are not directly attributable to the acquisition, construction or production of
qualifying assets are recognised in profit or loss using the effective interest method.
Bank debt – secured
The Group’s secured bank debt facilities were amended and restated on 15 August 2017 and comprise the following:
• $545,000,000 revolving multi-currency loan facility; and
• $15,000,000 credit support facility (for the issue of letters of credit and bank guarantees).
The above facilities mature on 15 August 2020 and are supported by interlocking guarantees from most Group entities and are
secured by specific property mortgages. Debt drawn under these facilities bears interest at the relevant inter-bank benchmark
reference rate plus a margin of between 1.15% and 2.1% per annum. At 30 June 2018, the Group had drawn $375,540,000
(2017: $323,905,000) under the debt facilities, of which $nil (2017: $nil) was subject to interest rate swaps used for hedging,
and had drawn $2,939,000 under the credit support facility (2017: $2,948,000).
Other facility – secured
Certain wholly-owned German subsidiaries have arranged a secured five year guarantee facility of €17,000,000 (A$26,797,000)
(for the issue of letters of credit and bank guarantees).
The facility is supported by interlocking guarantees from certain (non-Australian based) Group entities and is secured against a
specific property in Germany. Debt drawn under the facility bears interest at the relevant inter-bank benchmark rate plus a
margin of between 0.75% and 2.75% per annum. At 30 June 2018, the Group had drawn €14,094,000 (A$22,216,000) under
the facility.

N O T E S T O T H E F I N A N C I A L S T A T E M E N T S F O R T H E Y E A R E N D E D 3 0 J U N E 2 0 1 8
S E C T I O N 4 – C A P I T A L S T R U C T U R E A N D F I N A N C I N G
63 EVENT Hospitality & Entertainment Limited – 2018 Annual Report
4.4 – LOANS, BORROWINGS AND FINANCING ARRANGEMENTS (continued)
2018
$’000
2017
$’000
Current
Interest bearing loans and borrowings
Bank loans – secured – 323,905
Deferred financing costs – (98)
– 323,807
Non-interest bearing loans and borrowings
Loans from other companies – unsecured 1,127 1,634
1,127 325,441
Non-current
Interest bearing loans and borrowings
Bank loans – secured 375,540 –
Deferred financing costs (1,173) –
374,367 –
Non-interest bearing loans and borrowings
Loans from other companies – unsecured 1,988 2,360
376,355 2,360
4.5 – FINANCIAL RISK MANAGEMENT
Derivative financial instruments
From time to time, the Group uses derivative financial instruments to hedge its exposure to interest rate and foreign exchange
risks arising from operating activities, investing activities and financing activities. In accordance with its treasury policy, the
Group does not hold or issue derivative financial instruments for trading purposes.
Derivative financial instruments are recognised at fair value within prepayments and other current assets. The gain or loss on
remeasurement to fair value is recognised immediately in profit or loss. However, where derivatives qualify for hedge
accounting, recognition of any resultant gain or loss depends on the nature of the item being hedged.
The fair value of interest rate swaps is the estimated amount that the Group would receive or pay to terminate the swap at the
reporting date, taking into account current interest rates and the creditworthiness of the swap counterparties. The fair value of
forward exchange contracts is their quoted market price at the reporting date, being the present value of the quoted forward
price.
Available-for-sale financial assets
All investments are initially recognised at cost, being the fair value of the consideration given and including acquisition charges
associated with the investment.
After initial recognition, investments, which are classified as available-for-sale, are measured at fair value. Available-for-sale
financial assets comprise marketable equity securities.
For investments that are actively traded in organised financial markets, fair value is determined by reference to securities
exchange quoted market bid prices at the close of business at reporting date.

N O T E S T O T H E F I N A N C I A L S T A T E M E N T S F O R T H E Y E A R E N D E D 3 0 J U N E 2 0 1 8
S E C T I O N 4 – C A P I T A L S T R U C T U R E A N D F I N A N C I N G
64 EVENT Hospitality & Entertainment Limited – 2018 Annual Report
4.5 – FINANCIAL RISK MANAGEMENT (continued)
Gains or losses on available-for-sale financial assets are recognised as a separate component of equity in the available-for-sale
financial assets revaluation reserve until the investment is sold, collected or otherwise disposed of, or until the investment is
determined to be impaired, at which time the cumulative gain or loss previously reported in equity is included in profit or loss.
An impairment loss recognised in profit or loss in respect of an available-for-sale investment is reversed through profit or loss to
the extent that the investment’s carrying amount does not exceed the carrying amount that would have been determined if no
impairment loss had been recognised.
2018
$’000
2017
$’000
Available-for-sale financial assets
Investment in a listed company
20,924 19,928
The Group’s investment is in a company listed on the ASX. No reasonably possible change in the share price of this company
would have a material effect on the available-for-sale financial assets balance or the related revaluation reserve at the reporting
date.
Financial risks
The Group’s exposure to financial risks, objectives, policies and processes for managing the risks including methods used to
measure the risks, and the management of capital are presented below.
The Group’s activities expose it to the following financial risks:
• credit risk;
• liquidity risk; and
• market risk, including interest rate and foreign exchange risks.
The Board has overall responsibility for the oversight of the risk management framework. Risk management policies are
established to identify and analyse the risks faced by the Group, to set appropriate risk limits and controls, and to monitor risks
and adherence to limits. Risk management policies and systems are reviewed regularly and modified as appropriate to reflect
changes in market conditions and the Group’s activities.
The Audit and Risk Committee oversees how management has established and monitors internal compliance and control
systems and to ensure the appropriate and effective management of the above risks. The Audit and Risk Committee is assisted in
its oversight role by the Internal Audit function. The Internal Audit function undertakes reviews of risk management controls and
procedures in accordance with an annual plan approved by the Audit and Risk Committee. The results of these Internal Audit
reviews are reported to the Audit and Risk Committee.
Credit risk
Credit risk arises from trade and other receivables outstanding, cash and cash equivalents, derivative financial instruments and
deposits with banks and financial institutions. It is the risk of financial loss to the Group if a customer or counterparty to the
financial instrument fails to meet its contractual obligations, and arises principally from the Group’s trade receivables.
Information regarding the Group’s trade receivable balances is disclosed in Note 3.1. The Group’s exposure to credit risk is not
considered material.
The Group’s maximum exposure to credit risk at the reporting date was considered to approximate the carrying value of
receivables at the reporting date.
Investments and derivatives
Investments of surplus cash and deposits and derivative financial instruments are with banks with high credit ratings. Given their
high credit ratings, management does not expect any counterparty to fail to meet its obligations.
At 30 June 2018, there were no significant concentrations of credit risk. The maximum exposure to credit risk is represented by
the carrying amount of each financial asset, including derivative financial instruments, in the Statement of Financial Position.

N O T E S T O T H E F I N A N C I A L S T A T E M E N T S F O R T H E Y E A R E N D E D 3 0 J U N E 2 0 1 8
S E C T I O N 4 – C A P I T A L S T R U C T U R E A N D F I N A N C I N G
65 EVENT Hospitality & Entertainment Limited – 2018 Annual Report
4.5 – FINANCIAL RISK MANAGEMENT (continued)
Guarantees
All guarantees are in respect of obligations of subsidiaries, associates, joint ventures or joint operations in which the Group has
an interest, and principally relate to operating lease arrangements. The Group’s operating lease commitments are disclosed in
Note 7.1, and details of guarantees given by the parent entity are provided in Note 7.5.
Security deposits
Security deposits relate to the Group’s operating lease arrangements. Certain lease agreements require an amount to be placed
on deposit, which should then be returned to the Group at the conclusion of the lease term.
Liquidity risk
Liquidity risk is the risk that the Group will not be able to meet its financial obligations as they fall due. The Group manages
liquidity risk by continuously monitoring forecast and actual cash flows. The Group’s treasury function aims to maintain flexibility
in funding by maintaining committed credit lines with a number of counterparties.
The Group’s financial liabilities
The contractual maturities of the Group’s financial liabilities, including interest payments and excluding the impact of netting
agreements, are as follows:
Carrying
amount
$’000
Contractual
cash flows
$’000
6 months
or less
$’000
6 to 12
months
$’000
1 to 2
year(s)
$’000
2 to 5
years
$’000
Over 5
years
$’000
2018
Non-derivative financial
liabilities
Secured bank loans 375,540 (401,869) (6,185) (5,916) (12,792) (376,976) −
Unsecured non-interest bearing
loans from other companies 3,115 (3,115) (564) (564) (971) (763) (253)
Trade payables 30,759 (30,759) (30,759) − − − −
Other payables and accruals 76,188 (76,188) (76,188) − − − −
Derivative financial assets
Forward exchange contracts (11) 11 11 − − − −
485,591 (511,920) (113,685) (6,480) (13,763) (377,739) (253)
2017
Non-derivative financial
liabilities
Secured bank loans 323,905 (325,754) (325,754) − − − −
Unsecured non-interest bearing
loans from other companies 3,994 (3,994) (817) (817) (1,128) (1,328) 96
Trade payables 20,381 (20,381) (20,381) − − − −
Other payables and accruals 86,514 (86,514) (86,514) − − − −
Derivative financial liabilities
Forward exchange contracts 14 (14) (14) − − − −
434,808 (436,657) (433,480) (817) (1,128) (1,328) 96
For derivative financial assets and liabilities, maturities detailed in the table above approximate periods that cash flows and the
impact on profit or loss are expected to occur.

N O T E S T O T H E F I N A N C I A L S T A T E M E N T S F O R T H E Y E A R E N D E D 3 0 J U N E 2 0 1 8
S E C T I O N 4 – C A P I T A L S T R U C T U R E A N D F I N A N C I N G
66 EVENT Hospitality & Entertainment Limited – 2018 Annual Report
4.5 – FINANCIAL RISK MANAGEMENT (continued)
Market risk
Market risk is the risk that changes in market prices, such as interest rates and foreign exchange rates, will affect the Group’s
income or the value of its holdings of financial instruments. The objective of market risk management is to manage and control
market risk exposures within acceptable parameters, whilst optimising the return.
The Group uses derivative financial instruments such as interest rate swaps and forward exchange contracts to hedge exposures
to fluctuations in interest rates and foreign exchange rates. Derivatives are used exclusively for hedging purposes and are not
traded or used as speculative instruments. This is carried out under Board approved treasury policies.
Hedge of net investment in foreign operations
The portion of the gain or loss on an instrument used to hedge a net investment in a foreign operation, that is determined to be
an effective hedge, is recognised in other comprehensive income and presented in equity in the foreign currency translation
reserve. The ineffective portion is recognised immediately in profit or loss.
Interest rate risk
The Group manages interest rate exposures on borrowings in accordance with a Board approved treasury policy that specifies
parameters for hedging including hedging percentages and approved hedging instruments. The policy specifies upper and lower
hedging limits set for specific timeframes out to five years. These limits may be varied with the approval of the Board.
At reporting date, the interest rate profile of the Group’s interest bearing financial instruments was:
2018
$’000
2017
$’000
Fixed rate instruments
Financial assets – −
Financial liabilities – −
– −
Variable rate instruments
Financial assets 87,355 83,506
Financial liabilities (375,540) (323,905)
(288,185) (240,399)
The Group manages interest rate risk in accordance with a Board approved treasury policy covering the types of instruments,
range of protection and duration of instruments. The financial instruments cover interest rate swaps and forward rate
agreements. Maturities of these instruments are up to a maximum of five years. Interest rate swaps and forward rate
agreements allow the Group to raise long term borrowings at floating rates and swap a portion of those borrowings into fixed
rates.
The approved range of interest rate cover is based on the projected debt levels for each currency and reduced for each future
year. There were no interest rate hedges at 30 June 2018 (2017: no interest rate hedges).
The Group classifies interest rate swaps as cash flow hedges and recognises them at fair value in the Statement of Financial
Position.
The Group accounts for fixed rate financial assets and liabilities at fair value. The Group had no fixed rate instruments for the
year ended 30 June 2018 (2017: no fixed rate instruments) and accordingly no sensitivity analysis has been prepared in the
current or prior year.
Foreign exchange risk
The Group is exposed to currency risk on purchases, borrowings and surplus funds that are denominated in a currency other
than the respective functional currencies of Group entities, primarily the Australian dollar (“AUD”), but also the New Zealand
dollar (“NZD”), Euro (“EUR”) and Great British pound (“GBP”). Transactions undertaken by Group entities are primarily
denominated in AUD, NZD, EUR and the US dollar (“USD”).
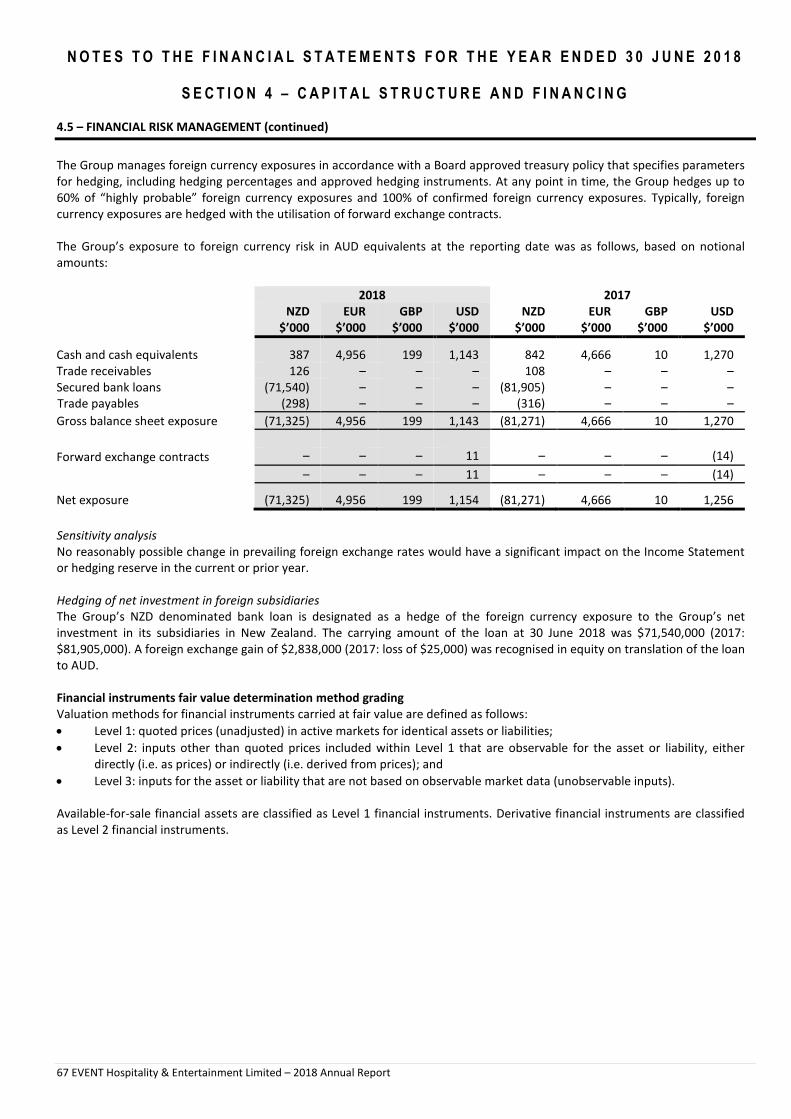
N O T E S T O T H E F I N A N C I A L S T A T E M E N T S F O R T H E Y E A R E N D E D 3 0 J U N E 2 0 1 8
S E C T I O N 4 – C A P I T A L S T R U C T U R E A N D F I N A N C I N G
67 EVENT Hospitality & Entertainment Limited – 2018 Annual Report
4.5 – FINANCIAL RISK MANAGEMENT (continued)
The Group manages foreign currency exposures in accordance with a Board approved treasury policy that specifies parameters
for hedging, including hedging percentages and approved hedging instruments. At any point in time, the Group hedges up to
60% of “highly probable” foreign currency exposures and 100% of confirmed foreign currency exposures. Typically, foreign
currency exposures are hedged with the utilisation of forward exchange contracts.
The Group’s exposure to foreign currency risk in AUD equivalents at the reporting date was as follows, based on notional
amounts:
2018 2017
NZD
$’000
EUR
$’000
GBP
$’000
USD
$’000
NZD
$’000
EUR
$’000
GBP
$’000
USD
$’000
Cash and cash equivalents 387 4,956 199 1,143 842 4,666 10 1,270
Trade receivables 126 – – – 108 – – –
Secured bank loans (71,540) – – – (81,905) – – –
Trade payables (298) – – – (316) – – –
Gross balance sheet exposure (71,325) 4,956 199 1,143 (81,271) 4,666 10 1,270
Forward exchange contracts – – – 11 – – – (14)
– – – 11 – – – (14)
Net exposure (71,325) 4,956 199 1,154 (81,271) 4,666 10 1,256
Sensitivity analysis
No reasonably possible change in prevailing foreign exchange rates would have a significant impact on the Income Statement
or hedging reserve in the current or prior year.
Hedging of net investment in foreign subsidiaries
The Group’s NZD denominated bank loan is designated as a hedge of the foreign currency exposure to the Group’s net
investment in its subsidiaries in New Zealand. The carrying amount of the loan at 30 June 2018 was $71,540,000 (2017:
$81,905,000). A foreign exchange gain of $2,838,000 (2017: loss of $25,000) was recognised in equity on translation of the loan
to AUD.
Financial instruments fair value determination method grading
Valuation methods for financial instruments carried at fair value are defined as follows:
• Level 1: quoted prices (unadjusted) in active markets for identical assets or liabilities;
• Level 2: inputs other than quoted prices included within Level 1 that are observable for the asset or liability, either
directly (i.e. as prices) or indirectly (i.e. derived from prices); and
• Level 3: inputs for the asset or liability that are not based on observable market data (unobservable inputs).
Available-for-sale financial assets are classified as Level 1 financial instruments. Derivative financial instruments are classified
as Level 2 financial instruments.
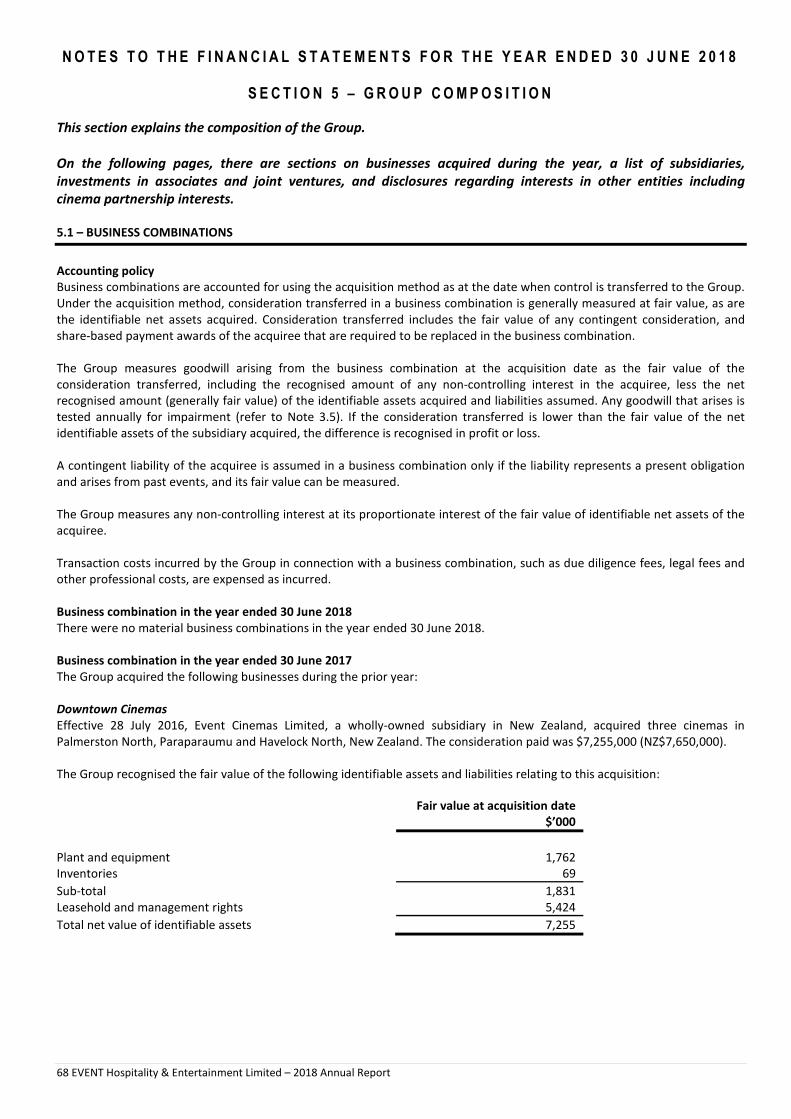
N O T E S T O T H E F I N A N C I A L S T A T E M E N T S F O R T H E Y E A R E N D E D 3 0 J U N E 2 0 1 8
S E C T I O N 5 – G R O U P C O M P O S I T I O N
68 EVENT Hospitality & Entertainment Limited – 2018 Annual Report
This section explains the composition of the Group.
On the following pages, there are sections on businesses acquired during the year, a list of subsidiaries,
investments in associates and joint ventures, and disclosures regarding interests in other entities including
cinema partnership interests.
5.1 – BUSINESS COMBINATIONS
Accounting policy
Business combinations are accounted for using the acquisition method as at the date when control is transferred to the Group.
Under the acquisition method, consideration transferred in a business combination is generally measured at fair value, as are
the identifiable net assets acquired. Consideration transferred includes the fair value of any contingent consideration, and
share-based payment awards of the acquiree that are required to be replaced in the business combination.
The Group measures goodwill arising from the business combination at the acquisition date as the fair value of the
consideration transferred, including the recognised amount of any non-controlling interest in the acquiree, less the net
recognised amount (generally fair value) of the identifiable assets acquired and liabilities assumed. Any goodwill that arises is
tested annually for impairment (refer to Note 3.5). If the consideration transferred is lower than the fair value of the net
identifiable assets of the subsidiary acquired, the difference is recognised in profit or loss.
A contingent liability of the acquiree is assumed in a business combination only if the liability represents a present obligation
and arises from past events, and its fair value can be measured.
The Group measures any non-controlling interest at its proportionate interest of the fair value of identifiable net assets of the
acquiree.
Transaction costs incurred by the Group in connection with a business combination, such as due diligence fees, legal fees and
other professional costs, are expensed as incurred.
Business combination in the year ended 30 June 2018
There were no material business combinations in the year ended 30 June 2018.
Business combination in the year ended 30 June 2017
The Group acquired the following businesses during the prior year:
Downtown Cinemas
Effective 28 July 2016, Event Cinemas Limited, a wholly-owned subsidiary in New Zealand, acquired three cinemas in
Palmerston North, Paraparaumu and Havelock North, New Zealand. The consideration paid was $7,255,000 (NZ$7,650,000).
The Group recognised the fair value of the following identifiable assets and liabilities relating to this acquisition:
Fair value at acquisition date
$’000
Plant and equipment 1,762
Inventories 69
Sub-total 1,831
Leasehold and management rights 5,424
Total net value of identifiable assets 7,255
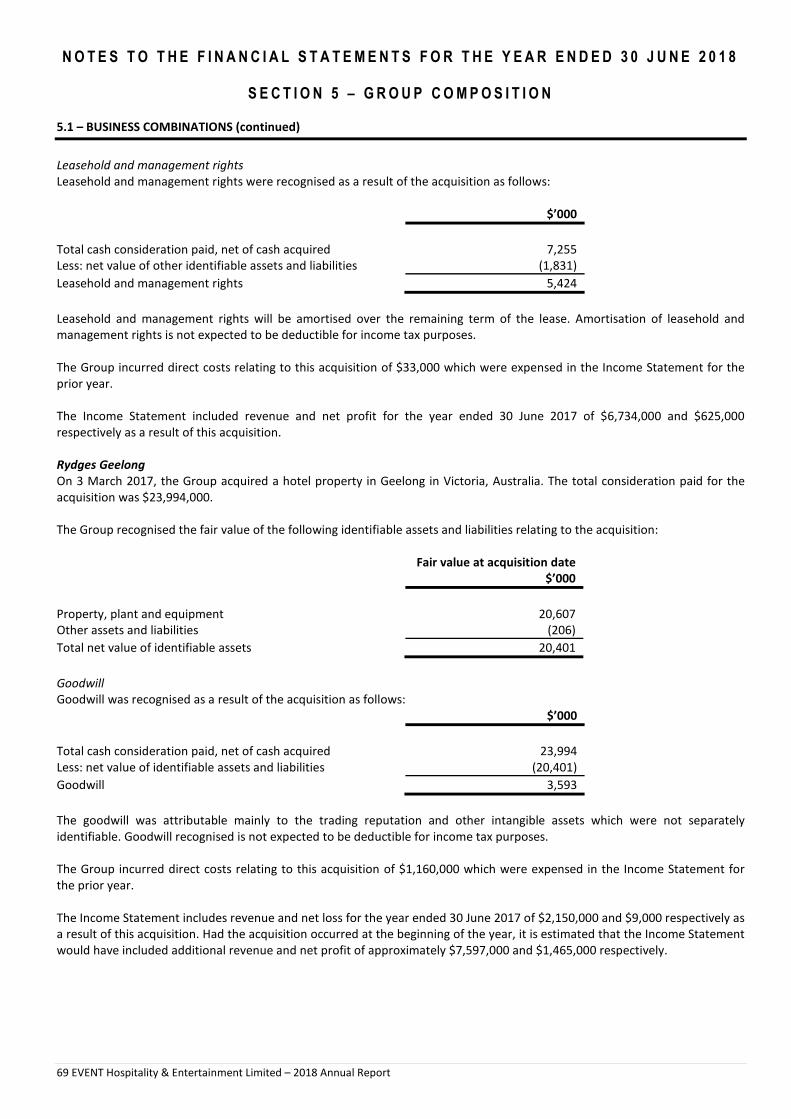
N O T E S T O T H E F I N A N C I A L S T A T E M E N T S F O R T H E Y E A R E N D E D 3 0 J U N E 2 0 1 8
S E C T I O N 5 – G R O U P C O M P O S I T I O N
69 EVENT Hospitality & Entertainment Limited – 2018 Annual Report
5.1 – BUSINESS COMBINATIONS (continued)
Leasehold and management rights
Leasehold and management rights were recognised as a result of the acquisition as follows:
$’000
Total cash consideration paid, net of cash acquired 7,255
Less: net value of other identifiable assets and liabilities (1,831)
Leasehold and management rights 5,424
Leasehold and management rights will be amortised over the remaining term of the lease. Amortisation of leasehold and
management rights is not expected to be deductible for income tax purposes.
The Group incurred direct costs relating to this acquisition of $33,000 which were expensed in the Income Statement for the
prior year.
The Income Statement included revenue and net profit for the year ended 30 June 2017 of $6,734,000 and $625,000
respectively as a result of this acquisition.
Rydges Geelong
On 3 March 2017, the Group acquired a hotel property in Geelong in Victoria, Australia. The total consideration paid for the
acquisition was $23,994,000.
The Group recognised the fair value of the following identifiable assets and liabilities relating to the acquisition:
Fair value at acquisition date
$’000
Property, plant and equipment 20,607
Other assets and liabilities (206)
Total net value of identifiable assets 20,401
Goodwill
Goodwill was recognised as a result of the acquisition as follows:
$’000
Total cash consideration paid, net of cash acquired 23,994
Less: net value of identifiable assets and liabilities (20,401)
Goodwill 3,593
The goodwill was attributable mainly to the trading reputation and other intangible assets which were not separately
identifiable. Goodwill recognised is not expected to be deductible for income tax purposes.
The Group incurred direct costs relating to this acquisition of $1,160,000 which were expensed in the Income Statement for
the prior year.
The Income Statement includes revenue and net loss for the year ended 30 June 2017 of $2,150,000 and $9,000 respectively as
a result of this acquisition. Had the acquisition occurred at the beginning of the year, it is estimated that the Income Statement
would have included additional revenue and net profit of approximately $7,597,000 and $1,465,000 respectively.

N O T E S T O T H E F I N A N C I A L S T A T E M E N T S F O R T H E Y E A R E N D E D 3 0 J U N E 2 0 1 8
S E C T I O N 5 – G R O U P C O M P O S I T I O N
70 EVENT Hospitality & Entertainment Limited – 2018 Annual Report
5.2 – SUBSIDIARIES
Accounting policy
Subsidiaries are entities controlled by the Group. The Group controls an entity when it is exposed to, or has rights to, variable
returns from its involvement with the entity and has the ability to affect those returns through its power over the entity. The
financial statements of subsidiaries are included in the consolidated financial statements from the date on which control
commences until the date on which control ceases.
Intra-Group balances and transactions, and any unrealised gains and losses or income and expenses arising from intra-Group
transactions, are eliminated in preparing the consolidated financial report.
Ownership
interest
Subsidiaries
Note
2018
%
2017
%
Albury Hotel Property Unit Trust 100 100
Amalgamated Cinema Holdings Limited (c) 100 100
Amalgamated Holdings Superannuation Fund Pty Limited 100 100
Ancona Investments Pty Limited 100 100
Atura Adelaide Airport Unit Trust 100 100
Atura Holdings Pty Limited 100 100
Atura Hotels and Resorts Pty Limited 100 100
Bay City Cinemas Limited (c) 100 100
Birch, Carroll & Coyle Limited 100 100
BLN Hotels Property Unit Trust 100 100
Bryson Centre Unit Trust 100 100
Bryson Hotel Property Unit Trust 100 100
Bryson Hotel Pty Limited 100 100
Canberra Theatres Limited 100 100
CMS Cinema Management Services GmbH & Co. KG (a)(e) 100 100
CMS Cinema Verwaltungs GmbH (a)(e) 100 100
Edge Digital Cinema Pty Limited 100 100
Edge Digital Technology Pty Limited 100 100
Edge Investments BV (a)(d) 100 100
Elsternwick Properties Pty Limited 100 100
Event Cinema Entertainment Pty Limited 100 100
Event Cinemas (Australia) Pty Limited 100 100
Event Cinemas Limited (c) 100 100
Event Cinemas Nominees Limited (c) 100 100
Event Cinemas (NZ) Limited (c) 100 100
Event Cinemas Queen Street Nominees Limited (c) 100 100
Event Hotels and Resorts Pty Limited 100 100
Event Hotels (NZ) Limited (c) 100 100
EVT Administration Pty Limited 100 100
Filmpalast am ZKM Karlsruhe Beteiligungs GmbH (a)(e) 100 100
Filmpalast Konstanz Beteiligungs GmbH (a)(e) 100 100
First Cinema Management BV (a)(d) 100 100
2015 First Holding GmbH (a)(e) 100 100
Flaggspelt Vermogensverwaltungsgesellschaft mbH (a)(e) 100 100
458 to 468 George Street Holding Pty Limited 100 −
458 to 468 George Street Holding Trust 100 −
458 to 468 George Street Development Pty Limited 100 −
458 to 468 George Street Development Trust 100 −
Glenelg Theatres Pty Limited 100 100

N O T E S T O T H E F I N A N C I A L S T A T E M E N T S F O R T H E Y E A R E N D E D 3 0 J U N E 2 0 1 8
S E C T I O N 5 – G R O U P C O M P O S I T I O N
71 EVENT Hospitality & Entertainment Limited – 2018 Annual Report
Ownership
interest
5.2 – SUBSIDIARIES (continued)
Note
2018
%
2017
%
Greater Entertainment Pty Limited 100 100
Greater Occasions Australia Pty Limited 100 100
Greater Union Betriebsmittel GmbH (a)(e) 100 100
Greater Union Filmpalast Cubix in Berlin GmbH (a)(e) 100 100
Greater Union Filmpalast Dortmund GmbH & Co. KG (a)(e) 100 100
Greater Union Filmpalast GmbH (a)(e) 100 100
Greater Union Filmpalast in der Kulturbrauerei Berlin GmbH (a)(e) 100 100
Greater Union Filmpalast in Hamburg GmbH (a)(e) 100 100
Greater Union Filmpalast Rhein-Main GmbH (a)(e) 100 100
Greater Union First Cinema BV and Co. KG (a)(e) 100 100
Greater Union International BV (a)(d) 100 100
Greater Union International GmbH (a)(e) 100 100
Greater Union International Holdings Pty Limited 100 100
Greater Union Limited (a)(b) 100 100
Greater Union Media & Event GmbH (a)(e) 100 100
Greater Union Nominees Pty Limited 100 100
Greater Union Real Estate 40 GmbH (a)(e) 100 100
Greater Union Real Estate Mainz GmbH (a)(e) 100 100
Greater Union Screen Entertainment Pty Limited 100 100
Greater Union Theaters Beteiligungs GmbH (a)(e) 100 100
Greater Union Theaters Dritte GmbH & Co. KG (a)(e) 100 100
Greater Union Theaters Dritte Verwaltungs GmbH (a)(e) 100 100
Greater Union Theaters GmbH (a)(e) 100 100
Greater Union Theaters Management Mainz GmbH (a)(e) 100 100
Greater Union Theaters Verwaltungs GmbH (a)(e) 100 100
Greater Union Theaters Zweite GmbH & Co. KG (a)(e) 100 100
Greater Union Theaters Zweite Verwaltungs GmbH (a)(e) 100 100
Greattheatre Pty Limited 100 100
GU Real Estate Mainz Management GmbH (a)(e) 100 100
GUO Investments (WA) Pty Limited 100 100
Gutace Holdings Pty Limited 100 100
Haparanda Pty Limited 100 100
Haymarket’s Tivoli Theatres Pty Limited 100 100
Kidsports Australia Pty Limited 100 100
Kosciuszko Thredbo Pty Limited 100 100
KTPL Unit Trust 100 100
Kvarken Pty Limited 100 100
Lakeside Hotel Property Unit Trust 100 100
Lakeside Hotel Pty Limited 100 100
Lakeside International Hotel Unit Trust 100 100
Mamasa Pty Limited 100 100
Multiplex Cinemas Magdeburg GmbH (a)(e) 100 100
Multiplex Cinemas Oberhausen GmbH (a)(e) 100 100
Neue Filmpalast GmbH & Co. KG (a)(e) 100 100
Neue Filmpalast Management GmbH (a)(e) 100 100
NFP Erste GmbH & Co. KG (a)(e) 100 100
NFP Erste Verwaltungs GmbH (a)(e) 100 100
Noahs Hotels (NZ) Limited (c) 100 100
Noahs Limited 100 100
Northside Gardens Hotel Property Unit Trust 100 100
Northside Gardens Hotel Pty Limited 100 100
Pantami Pty Limited 100 100

N O T E S T O T H E F I N A N C I A L S T A T E M E N T S F O R T H E Y E A R E N D E D 3 0 J U N E 2 0 1 8
S E C T I O N 5 – G R O U P C O M P O S I T I O N
72 EVENT Hospitality & Entertainment Limited – 2018 Annual Report
Ownership
interest
5.2 – SUBSIDIARIES (continued)
Note
2018
%
2017
%
203 Port Hacking Road Pty Limited 100 100
QT Gold Coast Pty Limited 100 100
QT Hotels and Resorts Pty Limited 100 100
QT Resort Port Douglas Pty Limited 100 100
RH Hotels Pty Limited 100 100
RQ Motels Pty Limited 100 100
Rydges Bankstown Pty Limited 100 100
Rydges Cronulla Pty Limited 100 100
Rydges Gladstone Hotel Property Unit Trust 100 100
Rydges Hobart Hotel Property Unit Trust 100 100
Rydges Hobart Hotel Pty Limited 100 100
Rydges Hotels Limited 100 100
Rydges Hotels Property Unit Trust 100 100
Rydges HPT Pty Limited 100 100
Rydges Property Holdings Pty Limited 100 100
Rydges Rotorua Hotel Limited (a)(c) 100 100
Rydges Townsville Hotel Property Unit Trust 100 100
Sonata Hotels Pty Limited 100 100
Southport Cinemas Pty Limited 100 100
Sunshine Cinemas Pty Limited 100 100
Tannahill Pty Limited 100 100
The Geelong Theatre Company Limited 100 100
The Greater Union Organisation Pty Limited 100 100
Thredbo Resort Centre Pty Limited 100 100
Tourism & Leisure Pty Limited 100 100
Vierte Kinoabspielstatten GmbH & Co. KG (a)(e) 100 100
Vierte Kinoabspielstatten Verwaltungs GmbH (a)(e) 100 100
Western Australia Cinemas Pty Limited 100 100
Zollverein Pty Limited 100 100
Zweite Kinoabspielstatten GmbH & Co. KG (a)(e) 100 100
Zweite Kinoabspielstatten Verwaltungs GmbH (a)(e) 100 100
(a) These companies are audited by other member firms of KPMG International.
(b) This company was incorporated in and carries on business in the United Kingdom.
(c) These companies were incorporated in and carry on business in New Zealand.
(d) These companies were incorporated in and carry on business in The Netherlands.
(e) These companies were incorporated in and carry on business in Germany.
All companies, except those stated above, were incorporated in Australia. All trusts were established in Australia.
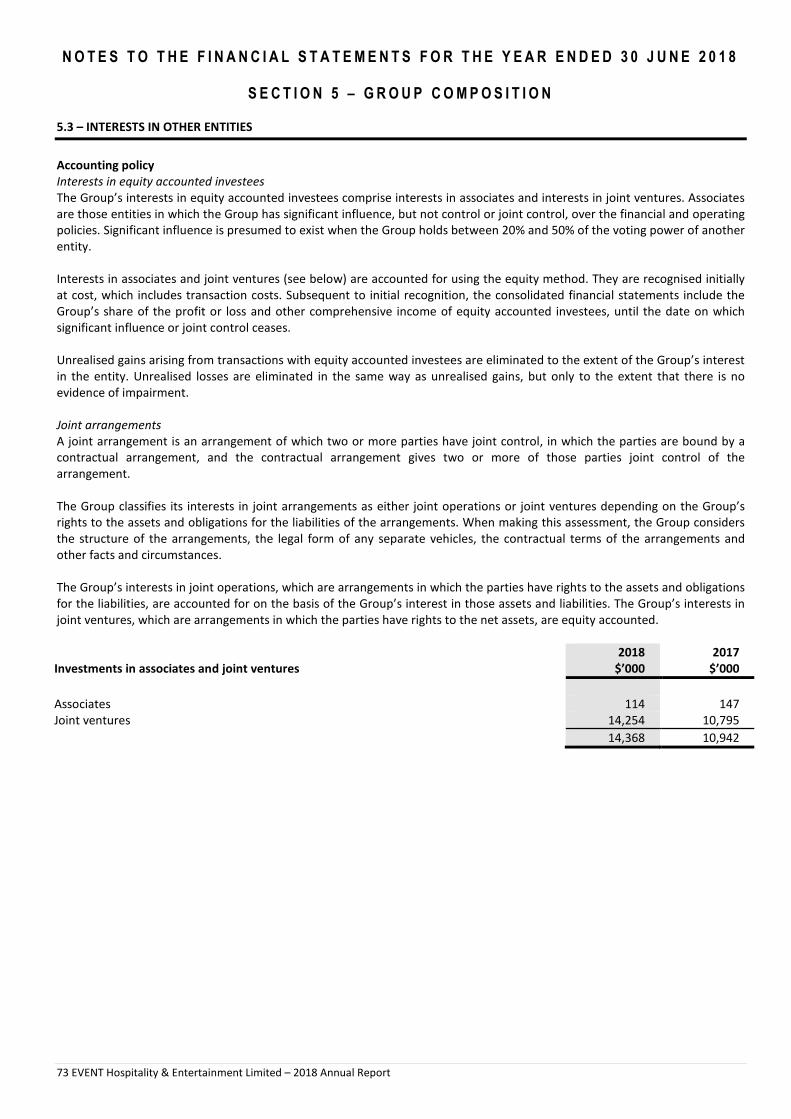
N O T E S T O T H E F I N A N C I A L S T A T E M E N T S F O R T H E Y E A R E N D E D 3 0 J U N E 2 0 1 8
S E C T I O N 5 – G R O U P C O M P O S I T I O N
73 EVENT Hospitality & Entertainment Limited – 2018 Annual Report
5.3 – INTERESTS IN OTHER ENTITIES
Accounting policy
Interests in equity accounted investees
The Group’s interests in equity accounted investees comprise interests in associates and interests in joint ventures. Associates
are those entities in which the Group has significant influence, but not control or joint control, over the financial and operating
policies. Significant influence is presumed to exist when the Group holds between 20% and 50% of the voting power of another
entity.
Interests in associates and joint ventures (see below) are accounted for using the equity method. They are recognised initially
at cost, which includes transaction costs. Subsequent to initial recognition, the consolidated financial statements include the
Group’s share of the profit or loss and other comprehensive income of equity accounted investees, until the date on which
significant influence or joint control ceases.
Unrealised gains arising from transactions with equity accounted investees are eliminated to the extent of the Group’s interest
in the entity. Unrealised losses are eliminated in the same way as unrealised gains, but only to the extent that there is no
evidence of impairment.
Joint arrangements
A joint arrangement is an arrangement of which two or more parties have joint control, in which the parties are bound by a
contractual arrangement, and the contractual arrangement gives two or more of those parties joint control of the
arrangement.
The Group classifies its interests in joint arrangements as either joint operations or joint ventures depending on the Group’s
rights to the assets and obligations for the liabilities of the arrangements. When making this assessment, the Group considers
the structure of the arrangements, the legal form of any separate vehicles, the contractual terms of the arrangements and
other facts and circumstances.
The Group’s interests in joint operations, which are arrangements in which the parties have rights to the assets and obligations
for the liabilities, are accounted for on the basis of the Group’s interest in those assets and liabilities. The Group’s interests in
joint ventures, which are arrangements in which the parties have rights to the net assets, are equity accounted.
Investments in associates and joint ventures
2018
$’000
2017
$’000
Associates 114 147
Joint ventures 14,254 10,795
14,368 10,942
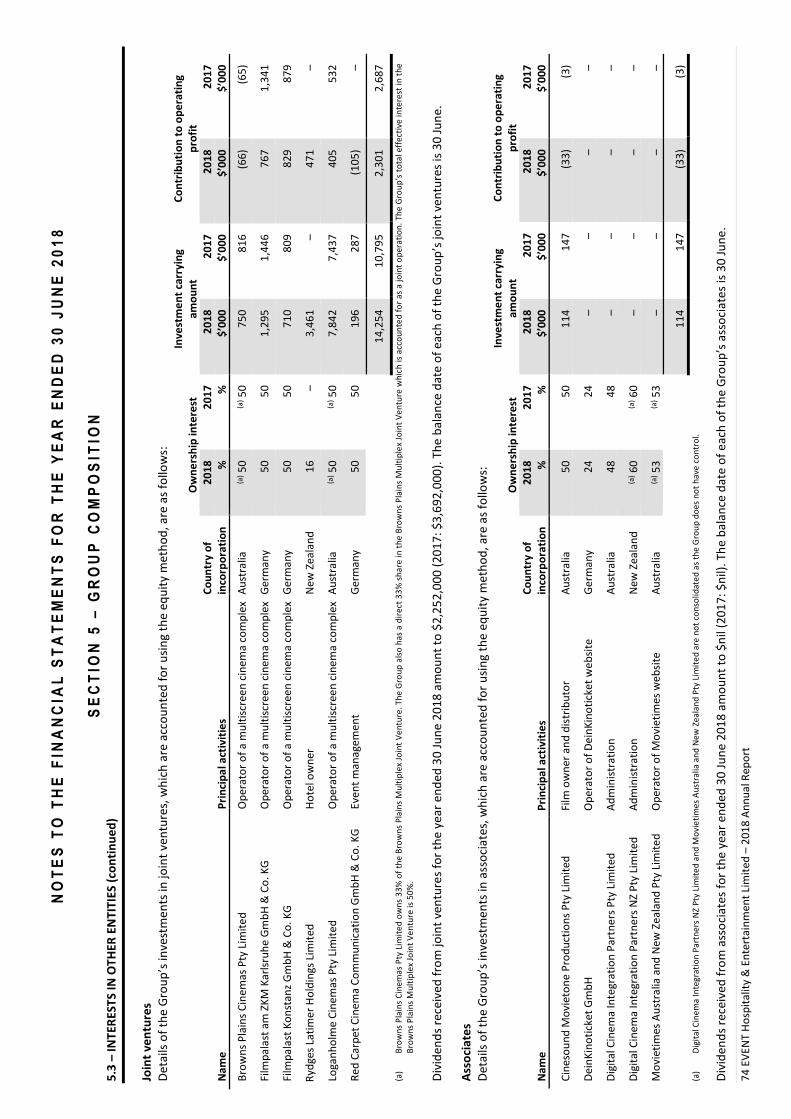
NO
TE
S T
O T
HE
F
INA
NC
IA
L S
TA
TE
ME
NT
S F
OR
T
HE
YE
AR
E
ND
ED
30
JU
NE
20
18
SE
CT
ION
5 –
G
RO
UP
C
OM
PO
SIT
ION
74
EV
EN
T H
osp
ita
lity
& E
nte
rta
inm
en
t Li
mit
ed
– 2
01
8 A
nn
ua
l Re
po
rt
5.3
– I
NT
ER
ES
TS
IN
OT
HE
R E
NT
ITIE
S (
con
tin
ue
d)
Join
t v
en
ture
s
De
tails
of
the
Gro
up
’s in
vest
me
nts
in j
oin
t ve
ntu
res,
wh
ich
are
acc
ou
nte
d f
or
usi
ng
th
e e
qu
ity
me
tho
d,
are
as
follo
ws:
Ow
ne
rsh
ip i
nte
rest
Inv
est
me
nt
carr
yin
g
am
ou
nt
Co
ntr
ibu
tio
n t
o o
pe
rati
ng
pro
fit
Co
un
try
of
20
18
2
01
7
20
18
2
01
7
20
18
2
01
7
Na
me
P
rin
cip
al
act
ivit
ies
inco
rpo
rati
on
%
%
$
’00
0
$’0
00
$
’00
0
$’0
00
Bro
wn
s P
lain
s C
ine
ma
s P
ty L
imit
ed
O
pe
rato
r o
f a
mu
ltis
cre
en
cin
em
a c
om
ple
x A
ust
ralia
(a
) 50
(a
) 50
7
50
8
16
(6
6)
(65
)
Film
pa
last
am
ZK
M K
arl
sru
he
Gm
bH
& C
o.
KG
O
pe
rato
r o
f a
mu
ltis
cre
en
cin
em
a c
om
ple
x G
erm
an
y
50
5
0
1,2
95
1
,44
6
76
7
1,3
41
Film
pa
last
Ko
nst
an
z G
mb
H &
Co
. K
G
Op
era
tor
of
a m
ult
iscr
ee
n c
ine
ma
co
mp
lex
Ge
rma
ny
50
5
0
71
0
80
9
82
9
87
9
Ryd
ge
s La
tim
er
Ho
ldin
gs
Lim
ite
d
Ho
tel o
wn
er
Ne
w Z
ea
lan
d
16
–
3
,46
1
–
47
1
–
Log
an
ho
lme
Cin
em
as
Pty
Lim
ite
d
Op
era
tor
of
a m
ult
iscr
ee
n c
ine
ma
co
mp
lex
Au
stra
lia
(a) 5
0
(a) 5
0
7,8
42
7
,43
7
40
5
53
2
Re
d C
arp
et
Cin
em
a C
om
mu
nic
ati
on
Gm
bH
& C
o.
KG
E
ven
t m
an
ag
em
en
t G
erm
an
y
50
5
0
19
6
28
7
(10
5)
–
1
4,2
54
1
0,7
95
2
,30
1
2,6
87
(a)
Bro
wn
s P
lain
s C
ine
ma
s P
ty L
imit
ed
ow
ns
33
% o
f th
e B
row
ns
Pla
ins
Mu
ltip
lex
Join
t V
en
ture
. T
he
Gro
up
als
o h
as
a d
ire
ct 3
3%
sh
are
in
th
e B
row
ns
Pla
ins
Mu
ltip
lex
Join
t V
en
ture
wh
ich
is
acc
ou
nte
d f
or
as
a j
oin
t o
pe
rati
on
. T
he
Gro
up
’s t
ota
l e
ffe
ctiv
e i
nte
rest
in
th
e
Bro
wn
s P
lain
s M
ult
iple
x Jo
int
Ve
ntu
re is
50
%.
Div
ide
nd
s re
ceiv
ed
fro
m j
oin
t ve
ntu
res
for
the
ye
ar
en
de
d 3
0 J
un
e 2
01
8 a
mo
un
t to
$2
,25
2,0
00
(2
01
7:
$3
,69
2,0
00
). T
he
ba
lan
ce d
ate
of
ea
ch o
f th
e G
rou
p’s
jo
int
ven
ture
s is
30
Ju
ne
. A
sso
cia
tes
De
tails
of
the
Gro
up
’s in
vest
me
nts
in a
sso
cia
tes,
wh
ich
are
acc
ou
nte
d f
or
usi
ng
th
e e
qu
ity
me
tho
d,
are
as
follo
ws:
Ow
ne
rsh
ip i
nte
rest
Inv
est
me
nt
carr
yin
g
am
ou
nt
Co
ntr
ibu
tio
n t
o o
pe
rati
ng
pro
fit
Na
me
Pri
nci
pa
l a
ctiv
itie
s
Co
un
try
of
inco
rpo
rati
on
20
18
%
20
17
%
20
18
$’0
00
20
17
$’0
00
20
18
$’0
00
20
17
$’0
00
Cin
eso
un
d M
ovi
eto
ne
Pro
du
ctio
ns
Pty
Lim
ite
d
Film
ow
ne
r a
nd
dis
trib
uto
r A
ust
ralia
5
0
50
1
14
1
47
(3
3)
(3)
De
inK
ino
tick
et
Gm
bH
O
pe
rato
r o
f D
ein
Kin
oti
cke
t w
eb
site
G
erm
an
y
24
2
4
–
–
–
–
Dig
ita
l Cin
em
a I
nte
gra
tio
n P
art
ne
rs P
ty L
imit
ed
A
dm
inis
tra
tio
n
Au
stra
lia
48
4
8
–
–
–
–
Dig
ita
l Cin
em
a I
nte
gra
tio
n P
art
ne
rs N
Z P
ty L
imit
ed
A
dm
inis
tra
tio
n
Ne
w Z
ea
lan
d
(a) 6
0
(a) 6
0
–
–
–
–
Mo
vie
tim
es
Au
stra
lia a
nd
Ne
w Z
ea
lan
d P
ty L
imit
ed
O
pe
rato
r o
f M
ovi
eti
me
s w
eb
site
A
ust
ralia
(a
) 53
(a
) 53
–
–
–
–
11
4
14
7
(33
) (3
)
(a)
Dig
ita
l Cin
em
a I
nte
gra
tio
n P
art
ne
rs N
Z P
ty L
imit
ed
an
d M
ovi
eti
me
s A
ust
rali
a a
nd
Ne
w Z
ea
lan
d P
ty L
imit
ed
are
no
t co
nso
lid
ate
d a
s th
e G
rou
p d
oe
s n
ot
ha
ve c
on
tro
l.
Div
ide
nd
s re
ceiv
ed
fro
m a
sso
cia
tes
for
the
ye
ar
en
de
d 3
0 J
un
e 2
01
8 a
mo
un
t to
$n
il (2
01
7:
$n
il).
Th
e b
ala
nce
da
te o
f e
ach
of
the
Gro
up
’s a
sso
cia
tes
is 3
0 J
un
e.

NO
TE
S T
O T
HE
F
INA
NC
IA
L S
TA
TE
ME
NT
S F
OR
T
HE
YE
AR
E
ND
ED
30
JU
NE
20
18
SE
CT
ION
5 –
G
RO
UP
C
OM
PO
SIT
ION
75
EV
EN
T H
osp
ita
lity
& E
nte
rta
inm
en
t Li
mit
ed
– 2
01
8 A
nn
ua
l Re
po
rt
5.3
– I
NT
ER
ES
TS
IN
OT
HE
R E
NT
ITIE
S (
con
tin
ue
d)
Join
t o
pe
rati
on
s
De
tails
of
the
Gro
up
’s in
vest
me
nts
in j
oin
t o
pe
rati
on
s, w
hic
h a
re a
cco
un
ted
fo
r o
n a
lin
e-b
y-lin
e b
asi
s, a
re a
s fo
llow
s:
O
wn
ers
hip
in
tere
st
2
01
8
20
17
Na
me
P
rin
cip
al
act
ivit
ies
Co
un
try
of
op
era
tio
n
%
%
Au
stra
lian
Th
ea
tre
s Jo
int
Ve
ntu
re
Op
era
tor
of
mu
ltis
cre
en
cin
em
a c
om
ple
xes
Au
stra
lia
50
5
0
Bro
wn
s P
lain
s M
ult
iple
x Jo
int
Ve
ntu
re
Op
era
tor
of
a m
ult
iscr
ee
n c
ine
ma
co
mp
lex
Au
stra
lia
(a) 3
3
(a) 3
3
Ca
stle
Hill
Mu
ltip
lex
Cin
em
a J
oin
t V
en
ture
O
pe
rato
r o
f a
mu
ltis
cre
en
cin
em
a c
om
ple
x A
ust
ralia
5
0
50
Ca
sua
rin
a C
ine
ma
Ce
ntr
e J
oin
t V
en
ture
O
pe
rato
r o
f a
mu
ltis
cre
en
cin
em
a c
om
ple
x A
ust
ralia
5
0
50
Ga
rde
n C
ity
Cin
em
a J
oin
t V
en
ture
O
pe
rato
r o
f a
mu
ltis
cre
en
cin
em
a c
om
ple
x A
ust
ralia
3
3
33
Ria
lto
Jo
int
Ve
ntu
re
Op
era
tor
of
mu
ltis
cre
en
cin
em
a c
om
ple
xes
Ne
w Z
ea
lan
d
50
5
0
To
ow
oo
mb
a C
ine
ma
Ce
ntr
e J
oin
t V
en
ture
O
pe
rato
r o
f a
mu
ltis
cre
en
cin
em
a c
om
ple
x A
ust
ralia
5
0
50
(a)
In a
dd
itio
n t
o t
he
33
% i
nte
rest
in
th
e B
row
ns
Pla
ins
Mu
ltip
lex
Join
t V
en
ture
he
ld d
ire
ctly
, th
e G
rou
p h
as
a 5
0%
in
tere
st i
n B
row
ns
Pla
ins
Cin
em
as
Pty
Lim
ite
d w
hic
h i
s cl
ass
ifie
d a
s a
jo
int
ve
ntu
re a
nd
eq
uit
y a
cco
un
ted
. B
row
ns
Pla
ins
Cin
em
as
Pty
Lim
ite
d o
wn
s 3
3%
of
the
Bro
wn
s P
lain
s M
ult
iple
x Jo
int
Ve
ntu
re.
Th
e G
rou
p’s
to
tal e
ffe
ctiv
e in
tere
st in
th
e B
row
ns
Pla
ins
Mu
ltip
lex
Join
t V
en
ture
is 5
0%
.
Op
era
tin
g l
ea
se c
om
mit
me
nts
of
join
t o
pe
rati
on
s
Th
e G
rou
p’s
sh
are
of
futu
re m
inim
um
op
era
tin
g le
ase
re
nta
ls in
re
spe
ct o
f th
e a
bo
ve j
oin
t o
pe
rati
on
s is
no
t p
rovi
de
d f
or
bu
t is
pa
yab
le:
2
01
8
20
17
$
’00
0
$’0
00
Wit
hin
on
e y
ea
r 3
2,7
85
3
1,5
91
Late
r th
an
on
e y
ea
r b
ut
no
t la
ter
tha
n f
ive
ye
ars
8
7,0
91
8
5,6
49
Late
r th
an
fiv
e y
ea
rs
10
6,5
62
9
2,1
52
2
26
,43
8
20
9,3
92
N O T E S T O T H E F I N A N C I A L S T A T E M E N T S F O R T H E Y E A R E N D E D 3 0 J U N E 2 0 1 8
S E C T I O N 6 – E M P L O Y E E B E N E F I T S A N D R E L A T E D P A R T Y T R A N S A C T I O N S
76 EVENT Hospitality & Entertainment Limited – 2018 Annual Report
This section explains the remuneration of executives and other employees, and transactions with related parties
including directors.
On the following pages, there are sections on share-based payments, director and executive disclosures and
related party transactions.
6.1 – SHARE-BASED PAYMENTS
The Group’s share-based payment arrangements include the Executive Performance Share Plan and the Executive Performance
Rights Plan. Grants were made under the Executive Performance Share Plan from 2007 to 2013 inclusive. The Group conducted
a review of its long term incentive (“LTI”) arrangements in 2013 and resolved that the existing performance share-based LTI
should be replaced with a performance rights-based LTI. Shareholders approved the Executive Performance Rights Plan at the
2013 Annual General Meeting. Grants have subsequently been made under the Executive Performance Rights Plan in February
2014, February 2015, February 2016, February 2017 and February 2018.
Accounting policy
The fair value of performance shares and rights granted under the Executive Performance Share Plan and the Executive
Performance Rights Plan is recognised as an employee expense over the period during which the employees become
unconditionally entitled to shares in the Company. There is a corresponding increase in equity, being recognition of a share-
based payments reserve. The fair value of performance shares and rights granted is measured at grant date.
To facilitate the operation of the Executive Performance Share Plan and Executive Performance Rights Plan, a third party
trustee is used to administer the trust which holds shares in the Company allocated under the Executive Performance Share
Plan or otherwise held or acquired on market in order to satisfy the Group’s future obligations under the Executive
Performance Rights Plan. The trust is controlled by the Group and therefore its financial statements are included in the
consolidated financial statements. The shares in the Group held by the trust are therefore shown as treasury shares (Note 4.1).
The Group incurs expenses on behalf of the trust. These expenses are in relation to administration costs of the trust and are
recorded in the Income Statement as incurred.
Performance shares and performance rights are subject to performance hurdles. The performance shares are recognised in the
Statement of Financial Position as restricted ordinary shares. Performance shares are included within the weighted average
number of shares used as the denominator for determining basic earnings per share and net tangible asset backing per share.
Performance rights are not recognised in the Statement of Financial Position, but are included within the weighted average
number of shares issued as the denominator for determining diluted earnings per share.
The Group measures the cost of the Executive Performance Share Plan and Executive Performance Rights Plan by reference to
the fair value of the equity instruments at the date at which the instruments are granted. The fair value of performance rights
granted is determined by an external valuer using a Monte Carlo simulation model and Binomial tree model using the
assumptions detailed below.
Executive Performance Rights Plan
The establishment of the Executive Performance Rights Plan was approved by shareholders at the 2013 Annual General
Meeting. Employees receiving awards under the Executive Performance Rights Plan are those of a senior level and above
(including the CEO).
An employee awarded performance rights is not legally entitled to shares in the Company before the performance rights under
the plan vest, and during the vesting period the performance rights do not carry the right to vote or to receive dividends. Once
the rights have vested, which is dependent on the Group achieving its earnings per share (“EPS”) and total shareholder return
(“TSR”) targets, participants are issued one ordinary share in the Company for each vested performance right held. Award,
vesting and the issue of ordinary shares under the plan are made for no consideration. The performance period is three years.
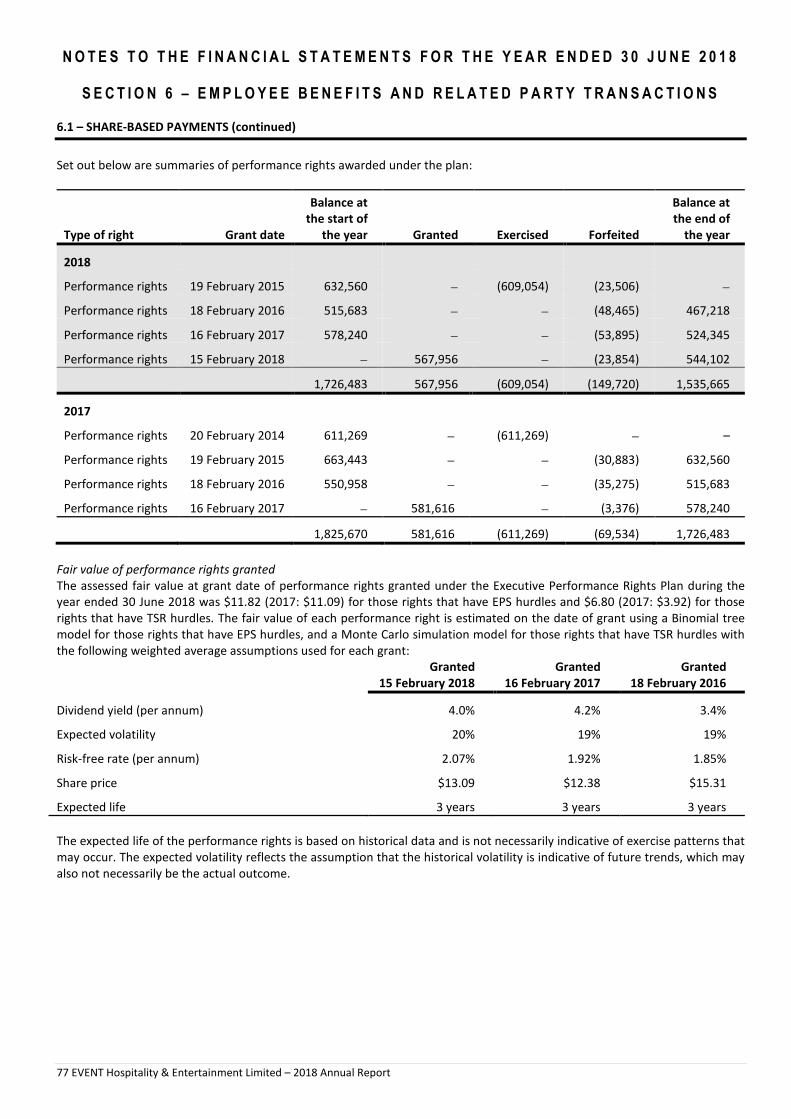
N O T E S T O T H E F I N A N C I A L S T A T E M E N T S F O R T H E Y E A R E N D E D 3 0 J U N E 2 0 1 8
S E C T I O N 6 – E M P L O Y E E B E N E F I T S A N D R E L A T E D P A R T Y T R A N S A C T I O N S
77 EVENT Hospitality & Entertainment Limited – 2018 Annual Report
6.1 – SHARE-BASED PAYMENTS (continued)
Set out below are summaries of performance rights awarded under the plan:
Type of right Grant date
Balance at
the start of
the year
Granted
Exercised
Forfeited
Balance at
the end of
the year
2018
Performance rights 19 February 2015 632,560 − (609,054) (23,506) −
Performance rights 18 February 2016 515,683 − − (48,465) 467,218
Performance rights 16 February 2017 578,240 − − (53,895) 524,345
Performance rights 15 February 2018 − 567,956 − (23,854) 544,102
1,726,483 567,956 (609,054) (149,720) 1,535,665
2017
Performance rights 20 February 2014 611,269 − (611,269) − –
Performance rights 19 February 2015 663,443 − − (30,883) 632,560
Performance rights 18 February 2016 550,958 − − (35,275) 515,683
Performance rights 16 February 2017 − 581,616 − (3,376) 578,240
1,825,670 581,616 (611,269) (69,534) 1,726,483
Fair value of performance rights granted
The assessed fair value at grant date of performance rights granted under the Executive Performance Rights Plan during the
year ended 30 June 2018 was $11.82 (2017: $11.09) for those rights that have EPS hurdles and $6.80 (2017: $3.92) for those
rights that have TSR hurdles. The fair value of each performance right is estimated on the date of grant using a Binomial tree
model for those rights that have EPS hurdles, and a Monte Carlo simulation model for those rights that have TSR hurdles with
the following weighted average assumptions used for each grant:
Granted
15 February 2018
Granted
16 February 2017
Granted
18 February 2016
Dividend yield (per annum) 4.0% 4.2% 3.4%
Expected volatility 20% 19% 19%
Risk-free rate (per annum) 2.07% 1.92% 1.85%
Share price $13.09 $12.38 $15.31
Expected life 3 years 3 years 3 years
The expected life of the performance rights is based on historical data and is not necessarily indicative of exercise patterns that
may occur. The expected volatility reflects the assumption that the historical volatility is indicative of future trends, which may
also not necessarily be the actual outcome.

N O T E S T O T H E F I N A N C I A L S T A T E M E N T S F O R T H E Y E A R E N D E D 3 0 J U N E 2 0 1 8
S E C T I O N 6 – E M P L O Y E E B E N E F I T S A N D R E L A T E D P A R T Y T R A N S A C T I O N S
78 EVENT Hospitality & Entertainment Limited – 2018 Annual Report
6.1 – SHARE-BASED PAYMENTS (continued)
Executive Performance Share Plan
Employees who received awards under the Executive Performance Share Plan were those of a senior level and above (including
the CEO). An employee awarded performance shares is not legally entitled to shares in the Company before the performance
shares allocated under the plan vest. However, the employee can vote and receive dividends in respect of shares allocated to
them. Once the shares have vested, which is dependent on the Group achieving its EPS and TSR targets, they remain in the
trust until the earliest of the employee leaving the Group, the seventh anniversary (for grants made from 2010) or the 10th
anniversary (for grants made from 2007 to 2009) of the date the performance shares were awarded, or the date the Board
approves an application for their release. Award, vesting and exercise under the plan are made for no consideration. The
performance period is three years.
Set out below are summaries of performance shares awarded under the plan:
Year Type of right
Balance at
the start of
the year Granted
Exercised
Forfeited
shares
reallocated
Balance at
the end of
the year (a)
2018 Performance shares 1,070,991 – (727,691) – 343,300
2017 Performance shares 1,827,434 – (145,174) (611,269) 1,070,991
(a) The balance at the end of the prior year included a total of 183,261 shares that had been forfeited by employees due to cessation of employment. The
forfeited shares were held within the trust and utilised in settlement of the Group’s obligation under the Executive Performance Rights Plan award on 19
February 2015.
No performance shares were granted during the year ended 30 June 2018 (2017: nil).
Share-based payment expense
Total share-based payment expense included within employee expenses for the year ended 30 June 2018 was $2,948,000
(2017: $8,042,000).

N O T E S T O T H E F I N A N C I A L S T A T E M E N T S F O R T H E Y E A R E N D E D 3 0 J U N E 2 0 1 8
S E C T I O N 6 – E M P L O Y E E B E N E F I T S A N D R E L A T E D P A R T Y T R A N S A C T I O N S
79 EVENT Hospitality & Entertainment Limited – 2018 Annual Report
6.1 – SHARE-BASED PAYMENTS (continued)
Superannuation
Group entities contribute to several defined contribution superannuation plans. The superannuation contributions recognised
as an employee expense in the Income Statement are detailed below:
2018
$’000
2017
$’000
Superannuation contributions recognised as an employee expense
16,544
15,917
6.2 – DIRECTOR AND EXECUTIVE DISCLOSURES
Information regarding individual directors’ and executives’ compensation and some equity instruments disclosures, as
permitted by the Corporations Regulations 2001, are provided in the Remuneration Report contained within the Directors’
Report. The relevant sections of the Remuneration Report are outlined below:
Section of Remuneration Report Directors’ Report page reference
Non-executive director remuneration 17
CEO and other executive remuneration 18
Fixed annual remuneration 18
Variable remuneration – short term incentive 18
Variable remuneration – long term incentive 19
Employment contracts 21
Directors’ and executives’ position and period of responsibility 22
Directors’ and executives’ remuneration 23
Performance rights holdings and transactions 26
Performance share holdings and transactions 28
Equity holdings and transactions 29

N O T E S T O T H E F I N A N C I A L S T A T E M E N T S F O R T H E Y E A R E N D E D 3 0 J U N E 2 0 1 8
S E C T I O N 6 – E M P L O Y E E B E N E F I T S A N D R E L A T E D P A R T Y T R A N S A C T I O N S
80 EVENT Hospitality & Entertainment Limited – 2018 Annual Report
6.2 – DIRECTOR AND EXECUTIVE DISCLOSURES (continued)
Key management personnel remuneration
The key management personnel remuneration included in employee expenses is as follows:
2018
$
2017
$
Employee benefits
Short term 5,613,036 9,842,862
Other long term 50,720 54,645
Termination payments − 1,959,618
Equity compensation 985,953 4,111,152
Post employment 213,740 208,077
6,863,449 16,176,354
Other transactions with the Company or its controlled entities
AG Rydge is a director of Carlton Investments Limited. Carlton Investments Limited rents office space from a controlled entity.
Rent is charged to Carlton Investments Limited at a market rate. Rent and office service charges received during the year were
$21,368 (2017: $20,240). The Company holds shares in Carlton Investments Limited. Dividends received during the year from
Carlton Investments Limited totalled $755,213 (2017: $780,420).
AG Rydge paid rent, levies and other costs to Group entities during the year amounting to $101,539 (2017: $98,527). Rent is
charged to AG Rydge at market rates.
A controlled entity has entered into a lease agreement for a cinema complex in Townsville with an entity related to KG
Chapman. Rent paid under the lease is at market rates.
Apart from the details disclosed in the Remuneration Report, no KMP has entered into a material contract with the Group
since the end of the previous year and there were no material contracts involving directors’ interests existing at reporting date.
From time to time, KMP of the Group, or their related parties, may purchase goods or services from the Group. These
purchases are usually on the same terms and conditions as those granted to other Group employees. Where the purchases are
on terms and conditions more favourable than those granted to other Group employees, the resulting benefits form part of
the total remuneration outlined within the Remuneration Report.
6.3 – RELATED PARTIES
Relationships with associates
Transactions with associates included the receipt of property rental income from an associate of $60,000 (2017: $57,000).
Costs paid on behalf of an associate totalled $92,000 (2017: $104,000) and these costs were not refundable (2017: $nil) by that
associate.
Refer also to Notes 3.1 and 5.3.
Relationships with joint ventures and joint operation partners
Refer to Note 5.3.
Key management personnel
Disclosures relating to directors of the Company and named executives are set out in the Remuneration Report contained
within the Directors’ Report, and in Note 6.2.
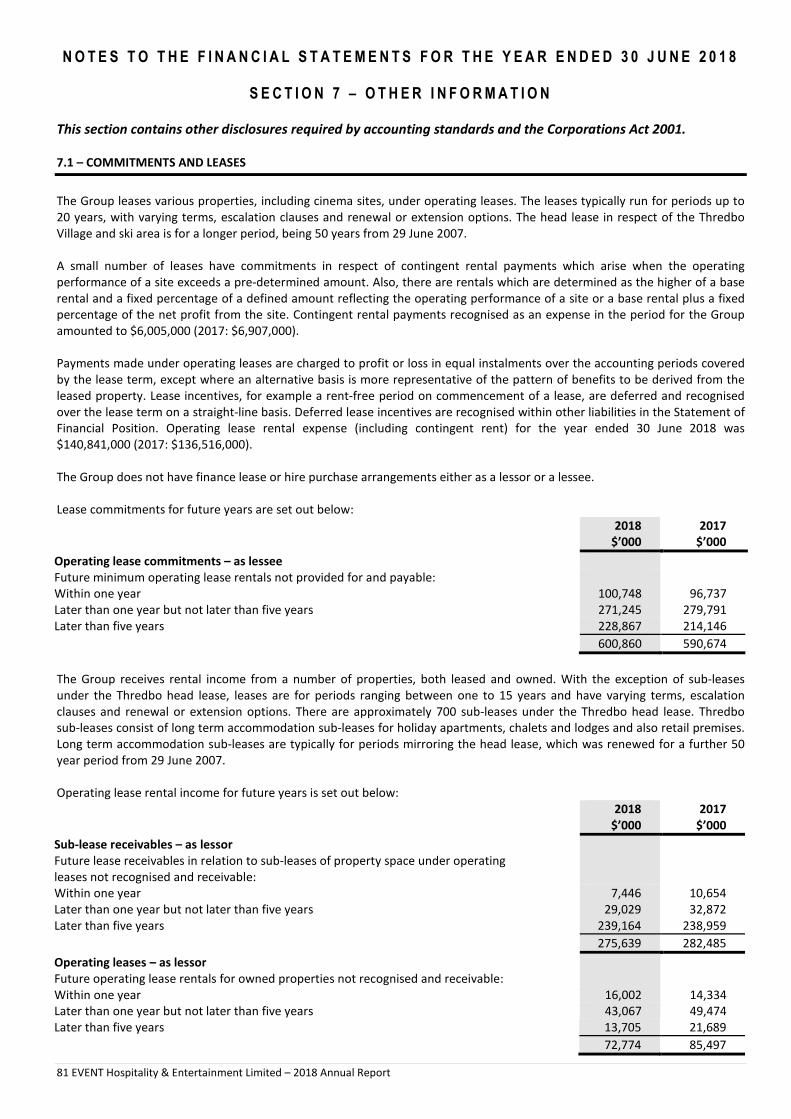
N O T E S T O T H E F I N A N C I A L S T A T E M E N T S F O R T H E Y E A R E N D E D 3 0 J U N E 2 0 1 8
S E C T I O N 7 – O T H E R I N F O R M A T I O N
81 EVENT Hospitality & Entertainment Limited – 2018 Annual Report
This section contains other disclosures required by accounting standards and the Corporations Act 2001.
7.1 – COMMITMENTS AND LEASES
The Group leases various properties, including cinema sites, under operating leases. The leases typically run for periods up to
20 years, with varying terms, escalation clauses and renewal or extension options. The head lease in respect of the Thredbo
Village and ski area is for a longer period, being 50 years from 29 June 2007.
A small number of leases have commitments in respect of contingent rental payments which arise when the operating
performance of a site exceeds a pre-determined amount. Also, there are rentals which are determined as the higher of a base
rental and a fixed percentage of a defined amount reflecting the operating performance of a site or a base rental plus a fixed
percentage of the net profit from the site. Contingent rental payments recognised as an expense in the period for the Group
amounted to $6,005,000 (2017: $6,907,000).
Payments made under operating leases are charged to profit or loss in equal instalments over the accounting periods covered
by the lease term, except where an alternative basis is more representative of the pattern of benefits to be derived from the
leased property. Lease incentives, for example a rent-free period on commencement of a lease, are deferred and recognised
over the lease term on a straight-line basis. Deferred lease incentives are recognised within other liabilities in the Statement of
Financial Position. Operating lease rental expense (including contingent rent) for the year ended 30 June 2018 was
$140,841,000 (2017: $136,516,000).
The Group does not have finance lease or hire purchase arrangements either as a lessor or a lessee.
Lease commitments for future years are set out below:
2018
$’000
2017
$’000
Operating lease commitments – as lessee
Future minimum operating lease rentals not provided for and payable:
Within one year 100,748 96,737
Later than one year but not later than five years 271,245 279,791
Later than five years 228,867 214,146
600,860 590,674
The Group receives rental income from a number of properties, both leased and owned. With the exception of sub-leases
under the Thredbo head lease, leases are for periods ranging between one to 15 years and have varying terms, escalation
clauses and renewal or extension options. There are approximately 700 sub-leases under the Thredbo head lease. Thredbo
sub-leases consist of long term accommodation sub-leases for holiday apartments, chalets and lodges and also retail premises.
Long term accommodation sub-leases are typically for periods mirroring the head lease, which was renewed for a further 50
year period from 29 June 2007.
Operating lease rental income for future years is set out below:
2018
$’000
2017
$’000
Sub-lease receivables – as lessor
Future lease receivables in relation to sub-leases of property space under operating
leases not recognised and receivable:
Within one year 7,446 10,654
Later than one year but not later than five years 29,029 32,872
Later than five years 239,164 238,959
275,639 282,485
Operating leases – as lessor
Future operating lease rentals for owned properties not recognised and receivable:
Within one year 16,002 14,334
Later than one year but not later than five years 43,067 49,474
Later than five years 13,705 21,689
72,774 85,497

N O T E S T O T H E F I N A N C I A L S T A T E M E N T S F O R T H E Y E A R E N D E D 3 0 J U N E 2 0 1 8
S E C T I O N 7 – O T H E R I N F O R M A T I O N
82 EVENT Hospitality & Entertainment Limited – 2018 Annual Report
7.2 – CONTINGENT LIABILITIES
Claims for personal injury
The nature of the Group’s operations results in claims for personal injury being received from time to time. The directors
believe that the outcome of any current claims outstanding, which are not provided against in the financial statements, will not
have a significant impact on the operating result of the Group in future reporting periods.
The directors are of the opinion that provisions are not required in respect of these matters, as it is not probable that a future
sacrifice of economic benefits will be required or the amount is not capable of reliable measurement at balance date.
7.3 – RECONCILIATION OF PROFIT FOR THE YEAR TO NET CASH PROVIDED BY OPERATING ACTIVITIES
2018
$’000
2017
$’000
Reconciliation of profit for the year to net cash provided by operating activities
Profit for the year 111,910 110,819
Adjustments for:
Depreciation and amortisation 77,862 73,605
Loss/(profit) on sale of non-current assets 820 (5)
Impairment adjustments 18,525 10,986
Fair value (increment)/decrement of investment properties (5,750) 250
Equity accounted investment dividends 2,252 3,692
Share of equity accounted investees’ net profit (2,268) (2,684)
Share-based payments expense 2,948 8,042
Receivables impairment adjustment 2 (128)
Unrealised foreign exchange (gains)/losses (312) 369
Net cash provided by operating activities before change in assets and liabilities 205,989 204,946
Change in assets and liabilities adjusted for effects of consolidation of controlled
entities acquired/disposed during the year:
Decrease/(increase) in trade and other receivables 478 (16,445)
(Increase)/decrease in inventories (1,014) 12,307
Increase in prepayments and other current assets (5,996) (1,178)
Increase/(decrease) in deferred tax items 2,018 (1,853)
Increase/(decrease) in income taxes payable 705 (19,009)
Increase in trade and other payables 1,397 7,477
Increase in provisions 1,595 1,573
Increase/(decrease) in other liabilities 1,712 (1,303)
Increase in deferred revenue 664 2,156
Increase in financing costs payable 201 10
Net cash provided by operating activities 207,749 188,681
Cash flows are included in the Statement of Cash Flows on a gross basis. The GST or equivalent tax components of cash flows
arising from investing and financing activities which are recoverable from, or payable to, taxation authorities are classified as
operating cash flows.

N O T E S T O T H E F I N A N C I A L S T A T E M E N T S F O R T H E Y E A R E N D E D 3 0 J U N E 2 0 1 8
S E C T I O N 7 – O T H E R I N F O R M A T I O N
83 EVENT Hospitality & Entertainment Limited – 2018 Annual Report
7.4 – AUDITORS’ REMUNERATION
2018
$
2017
$
Audit services:
Auditors of the Group – KPMG Australia
Audit and review of financial statements 1,276,000 1,187,000
Other assurance services 337,663 146,756
Overseas KPMG firms
Audit and review of financial statements
407,000
438,000
Other assurance services 103,717 86,192
2,124,380 1,857,948
Other auditors
Audit and review of financial statements
58,960
57,618
58,960 57,618
2,183,340 1,915,566
Other services:
Auditors of the Group – KPMG Australia
Tax compliance and advice 239,184 263,949
Other services 233,346 172,016
472,530 435,965
Overseas KPMG firms
Tax compliance and advice 245,243 362,039
Other auditors
Tax compliance and advice
18,507
3,663
Other services 8,240 75,029
26,747 78,692
744,520 876,696
7.5 – PARENT ENTITY DISCLOSURES
As at, and throughout the financial year ended, 30 June 2018, the parent entity of the Group was EVENT Hospitality &
Entertainment Limited.
2018
$’000
2017
$’000
Results of parent entity
Profit for the year 73,309 68,598
Other comprehensive income for the year 1,883 4,895
Total comprehensive income for the year 75,192 73,493
Financial position of parent entity at year end
Current assets 6,055 646
Total assets 394,209 402,095
Current liabilities
6,867 9,175
Total liabilities 11,856 14,239
Net assets 382,353 387,856
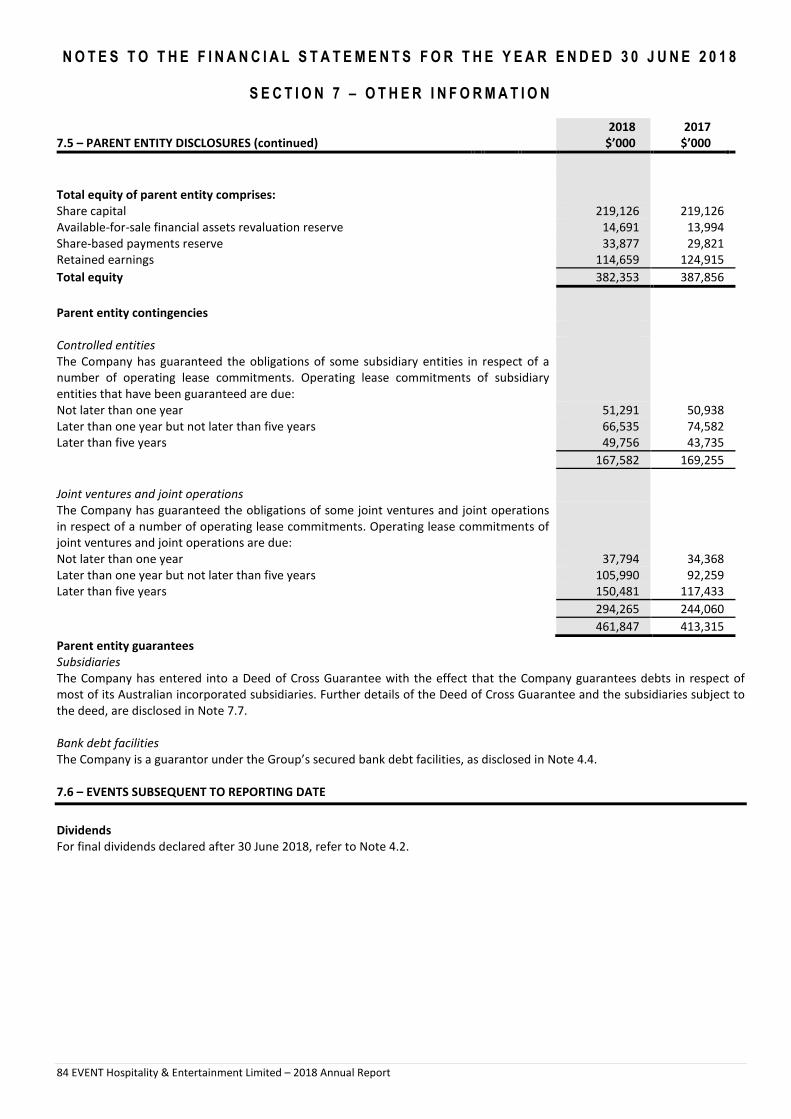
N O T E S T O T H E F I N A N C I A L S T A T E M E N T S F O R T H E Y E A R E N D E D 3 0 J U N E 2 0 1 8
S E C T I O N 7 – O T H E R I N F O R M A T I O N
84 EVENT Hospitality & Entertainment Limited – 2018 Annual Report
7.5 – PARENT ENTITY DISCLOSURES (continued)
2018
$’000
2017
$’000
Total equity of parent entity comprises:
Share capital 219,126 219,126
Available-for-sale financial assets revaluation reserve 14,691 13,994
Share-based payments reserve 33,877 29,821
Retained earnings 114,659 124,915
Total equity 382,353 387,856
Parent entity contingencies
Controlled entities
The Company has guaranteed the obligations of some subsidiary entities in respect of a
number of operating lease commitments. Operating lease commitments of subsidiary
entities that have been guaranteed are due:
Not later than one year 51,291 50,938
Later than one year but not later than five years 66,535 74,582
Later than five years 49,756 43,735
167,582 169,255
Joint ventures and joint operations
The Company has guaranteed the obligations of some joint ventures and joint operations
in respect of a number of operating lease commitments. Operating lease commitments of
joint ventures and joint operations are due:
Not later than one year 37,794 34,368
Later than one year but not later than five years 105,990 92,259
Later than five years 150,481 117,433
294,265 244,060
461,847 413,315
Parent entity guarantees
Subsidiaries
The Company has entered into a Deed of Cross Guarantee with the effect that the Company guarantees debts in respect of
most of its Australian incorporated subsidiaries. Further details of the Deed of Cross Guarantee and the subsidiaries subject to
the deed, are disclosed in Note 7.7.
Bank debt facilities
The Company is a guarantor under the Group’s secured bank debt facilities, as disclosed in Note 4.4.
7.6 – EVENTS SUBSEQUENT TO REPORTING DATE
Dividends
For final dividends declared after 30 June 2018, refer to Note 4.2.

N O T E S T O T H E F I N A N C I A L S T A T E M E N T S F O R T H E Y E A R E N D E D 3 0 J U N E 2 0 1 8
S E C T I O N 7 – O T H E R I N F O R M A T I O N
85 EVENT Hospitality & Entertainment Limited – 2018 Annual Report
7.7 – DEED OF CROSS GUARANTEE
Pursuant to ASIC Corporations (Wholly-owned Companies) Instrument 2016/785, the wholly-owned subsidiaries listed below
are relieved from the Corporations Act 2001 requirements for preparation, audit and lodgement of financial reports, and
directors’ reports.
It is a condition of the Instrument that the Company and each of the subsidiaries enter into a Deed of Cross Guarantee. The
effect of the deed is that the Company guarantees to each creditor, payment in full of any debt in the event of winding up of
any of the subsidiaries under certain provisions of the Corporations Act 2001. If a winding up occurs under other provisions of
the Act, the Company will only be liable in the event that after six months any creditor has not been paid in full. The
subsidiaries have also given similar guarantees in the event that the Company is wound up.
The subsidiaries subject to the deed are:
Atura Hotels and Resorts Pty Limited Kvarken Pty Limited
Birch, Carroll & Coyle Limited Lakeside Hotel Pty Limited
Bryson Hotel Pty Limited Mamasa Pty Limited
Canberra Theatres Limited Noahs Limited
Edge Digital Technology Pty Limited Northside Gardens Hotel Pty Limited
Elsternwick Properties Pty Limited Pantami Pty Limited
Event Cinema Entertainment Pty Limited 203 Port Hacking Road Pty Limited
Event Cinemas (Australia) Pty Limited QT Hotels and Resorts Pty Limited
Event Hotels and Resorts Pty Limited QT Resort Port Douglas Pty Limited
Glenelg Theatres Pty Limited RQ Motels Pty Limited
Greater Entertainment Pty Limited Rydges Bankstown Pty Limited
Greater Occasions Australia Pty Limited Rydges Cronulla Pty Limited
Greater Union International Holdings Pty Limited Rydges Hotels Limited
Greater Union Nominees Pty Limited Sonata Hotels Pty Limited
Greater Union Screen Entertainment Pty Limited Tannahill Pty Limited
Greattheatre Pty Limited The Geelong Theatre Company Limited
GUO Investments (WA) Pty Limited The Greater Union Organisation Pty Limited
Gutace Holdings Pty Limited Thredbo Resort Centre Pty Limited
Haparanda Pty Limited Tourism & Leisure Pty Limited
Haymarket’s Tivoli Theatres Pty Limited Western Australia Cinemas Pty Limited
Kidsports Australia Pty Limited Zollverein Pty Limited.
Kosciuszko Thredbo Pty Limited
A consolidated Statement of Comprehensive Income and a consolidated Statement of Financial Position, comprising the
Company and controlled entities which are a party to the deed, after eliminating all transactions between parties to the deed,
for the year ended, and as at, 30 June 2018 respectively are set out on the following page:

N O T E S T O T H E F I N A N C I A L S T A T E M E N T S F O R T H E Y E A R E N D E D 3 0 J U N E 2 0 1 8
S E C T I O N 7 – O T H E R I N F O R M A T I O N
86 EVENT Hospitality & Entertainment Limited – 2018 Annual Report
7.7 – DEED OF CROSS GUARANTEE (continued)
2018
$’000
2017
$’000
Statement of Comprehensive Income
Profit before tax 130,423 110,283
Income tax expense (41,480) (35,315)
Profit for the year 88,943 74,968
Retained earnings at the beginning of the year 589,859 596,777
Dividends paid (83,564) (81,886)
Retained earnings at the end of the year 595,238 589,859
Statement of Financial Position
ASSETS
Current assets
Cash and cash equivalents 32,361 29,541
Trade and other receivables 26,740 29,943
Inventories 16,011 15,627
Prepayments and other current assets 14,039 7,579
Total current assets 89,151 82,690
Non-current assets
Trade and other receivables 1,042 1,519
Loans to controlled entities 161,630 188,506
Other financial assets 1,393 1,392
Available-for-sale financial assets 20,924 19,928
Investments in controlled entities 71,227 71,227
Investments accounted for using the equity method 8,706 8,400
Property, plant and equipment 1,006,656 926,004
Investment properties 74,000 68,250
Goodwill and other intangible assets 67,780 74,034
Deferred tax assets 2,525 2,979
Other non-current assets 913 2,158
Total non-current assets 1,416,796 1,364,397
Total assets 1,505,947 1,447,087
LIABILITIES
Current liabilities
Trade and other payables 59,663 68,715
Other loans and borrowings − 324,059
Current tax liabilities 4,384 2,352
Provisions 16,888 17,193
Deferred revenue 56,161 56,358
Other current liabilities 3,753 2,216
Total current liabilities 140,849 470,893
Non-current liabilities
Loans from controlled entities 109,981 103,053
Other loans and borrowings 375,226 859
Provisions 8,957 7,339
Deferred revenue 5,519 5,936
Total non-current liabilities 499,683 117,187
Total liabilities 640,532 588,080
Net assets 865,415 859,007
EQUITY
Share capital 219,126 219,126
Reserves 51,051 50,022
Retained earnings 595,238 589,859
Total equity 865,415 859,007
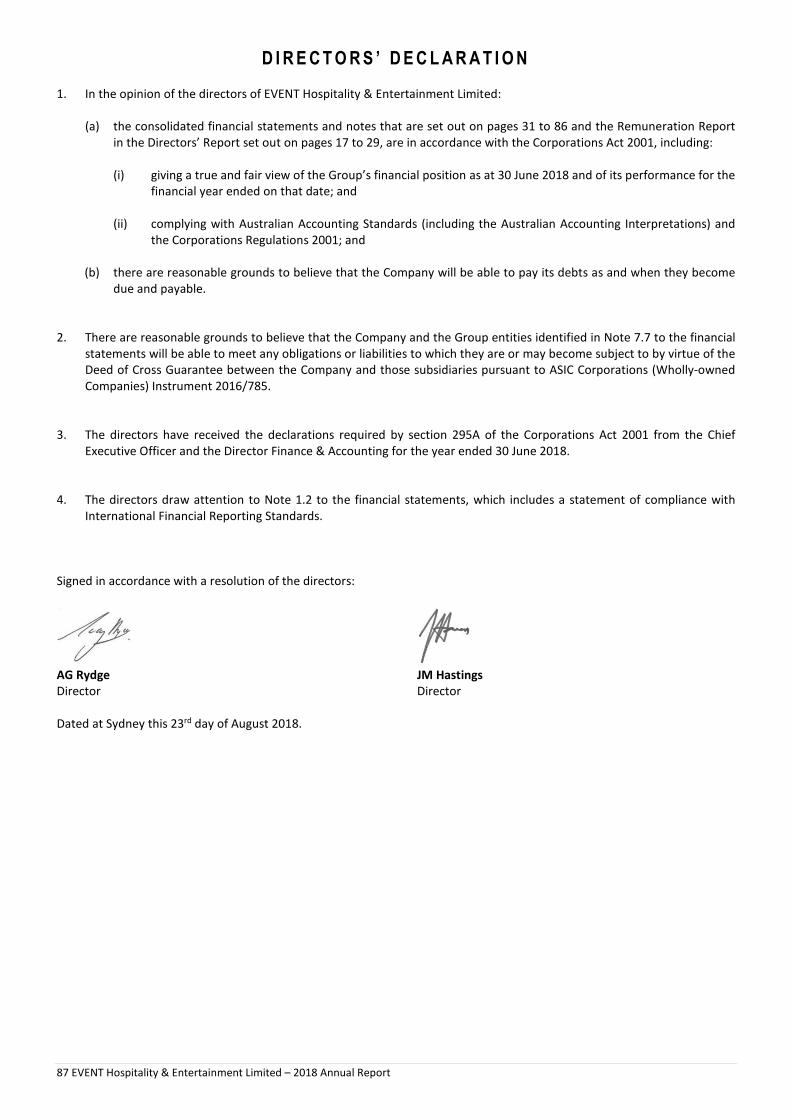
D I R E C T O R S ’ D E C L A R A T I O N
87 EVENT Hospitality & Entertainment Limited – 2018 Annual Report
1. In the opinion of the directors of EVENT Hospitality & Entertainment Limited:
(a) the consolidated financial statements and notes that are set out on pages 31 to 86 and the Remuneration Report
in the Directors’ Report set out on pages 17 to 29, are in accordance with the Corporations Act 2001, including:
(i) giving a true and fair view of the Group’s financial position as at 30 June 2018 and of its performance for the
financial year ended on that date; and
(ii) complying with Australian Accounting Standards (including the Australian Accounting Interpretations) and
the Corporations Regulations 2001; and
(b) there are reasonable grounds to believe that the Company will be able to pay its debts as and when they become
due and payable.
2. There are reasonable grounds to believe that the Company and the Group entities identified in Note 7.7 to the financial
statements will be able to meet any obligations or liabilities to which they are or may become subject to by virtue of the
Deed of Cross Guarantee between the Company and those subsidiaries pursuant to ASIC Corporations (Wholly-owned
Companies) Instrument 2016/785.
3. The directors have received the declarations required by section 295A of the Corporations Act 2001 from the Chief
Executive Officer and the Director Finance & Accounting for the year ended 30 June 2018.
4. The directors draw attention to Note 1.2 to the financial statements, which includes a statement of compliance with
International Financial Reporting Standards.
Signed in accordance with a resolution of the directors:
AG Rydge
Director
JM Hastings
Director
Dated at Sydney this 23rd day of August 2018.
88
KPMG, an Australian partnership and a member firm of the KPMG network of independent member firms affiliated with KPMG International Cooperative (“KPMG International”), a Swiss entity.
Liability limited by a scheme approved under Professional Standards Legislation.
Independent Auditor’s Report
To the shareholders of Event Hospitality & Entertainment Limited
Report on the audit of the Financial Report
Opinion
We have audited the Financial Report of Event
Hospitality & Entertainment Limited (the
Company).
In our opinion, the accompanying Financial
Report of the Company is in accordance with
the Corporations Act 2001, including:
• giving a true and fair view of the Group’s
financial position as at 30 June 2018 and
of its financial performance for the year
ended on that date; and
• complying with Australian Accounting
Standards and the Corporations
Regulations 2001.
The Financial Report comprises:
• Statement of Financial Position as at 30 June 2018
• Income Statement, Statement of Comprehensive
Income, Statement of Changes in Equity, and Statement
of Cash Flows for the year then ended
• Notes including a summary of significant accounting
policies
• Directors’ Declaration.
The Group consists of the Company and the entities it
controlled at the year-end or from time to time during the
financial year.
Basis for opinion
We conducted our audit in accordance with Australian Auditing Standards. We believe that the audit evidence
we have obtained is sufficient and appropriate to provide a basis for our opinion.
Our responsibilities under those standards are further described in the Auditor’s responsibilities for the audit of
the Financial Report section of our report.
We are independent of the Group in accordance with the Corporations Act 2001 and the ethical requirements
of the Accounting Professional and Ethical Standards Board’s APES 110 Code of Ethics for Professional
Accountants (the Code) that are relevant to our audit of the Financial Report in Australia. We have fulfilled our
other ethical responsibilities in accordance with the Code.
Key Audit Matters
Key Audit Matters are those matters that, in our professional judgement, were of most significance in our audit
of the Financial Report of the current period.
This matter was addressed in the context of our audit of the Financial Report as a whole, and in forming our
opinion thereon, and we do not provide a separate opinion on this matter.

89
Asset valuation – Hotel and Cinema Property, Plant and Equipment Assets
Refer to Note 3.3 to the Financial Report ($1,322M)
The key audit matter How the matter was addressed in our audit
This is a key audit matter due to:
• the significant value of property, plant and
equipment (being 76% of total assets); and
• the high level of judgement required by us in
assessing the significant judgements used by the
Group to determine the carrying value of property,
plant and equipment.
The Group use a combination of external valuation
experts and internal analysis to determine asset
valuations.
• External valuations were obtained by the Group in
the current year for owned hotels. External
valuations are based on value in use models.
• Internal analysis was prepared by the Group to
assess for indicators of impairment in Cinema
CGUs. Where an indicator of impairment was
present the Group prepared value in use models.
There are a number of judgements, made by the Group
and their external valuation experts when estimating
the recoverable value of these assets. Some are more
complex as they are dependent on assumptions about
the future, such as revenue and cost growth rates,
discount rates and terminal growth rates.
Examples of specific judgments made in relation to
hotel asset valuations include forecasted occupancy
and room rates. Examples of specific judgements made
in relation to cinema valuation include forecasted ticket
and merchandising revenue. For each asset valuation,
the geographic location and local economic conditions,
such as the continuing decline of mining activity in
central Queensland, are also taken into consideration
when assessing the carrying value.
These forward-looking estimations and the current
market conditions increase the range of possible
outcomes and the complexity for the audit.
Our procedures included:
• For external valuations obtained by the Group,
we assessed the competency of the valuer. We
considered evidence of capability and
objectivity along with the nature and scope of
work the valuer was engaged by the Group to
complete.
• Evaluating the valuation approach adopted in
the value in use models, external and internal,
considering the accounting standards and
industry practice.
• Comparing key amounts in the value in use
models, to a combination of board approved
budgets and business forecast plans.
• Assessing the accuracy of previous forecasting,
including cash flows and capital expenditure, to
inform our evaluation of forecasts included in
the value in use models. We applied increased
scepticism to forecasts in areas where previous
forecasts were not achieved and/or where
future uncertainty is greater, volatility is
expected, or specific local conditions are
present.
• Comparing forecasts with external data, such as
forecast tourism visitation and box office
scheduling.
• Performing sensitivity analysis on those CGU’s
with a higher risk of impairment in key areas
being the cash flow forecasts, discount rate and
terminal growth assumptions.

90
Other Information
Other Information is financial and non-financial information in Event Hospitality & Entertainment Limited’s
annual reporting which is provided in addition to the Financial Report and the Auditor’s Report. The Directors
are responsible for the Other Information.
Our opinion on the Financial Report does not cover the Other Information and, accordingly, we do not and will
not express an audit opinion or any form of assurance conclusion thereon, with the exception of the
Remuneration Report and our related assurance opinion.
In connection with our audit of the Financial Report, our responsibility is to read the Other Information. In
doing so, we consider whether the Other Information is materially inconsistent with the Financial Report or our
knowledge obtained in the audit, or otherwise appears to be materially misstated.
We are required to report if we conclude that there is a material misstatement of this Other Information, and
based on the work we have performed on the Other Information that we obtained prior to the date of this
Auditor’s Report we have nothing to report.
Responsibilities of the Directors for the Financial Report
The Directors are responsible for:
• preparing the Financial Report that gives a true and fair view in accordance with Australian Accounting
Standards and the Corporations Act 2001
• implementing necessary internal control to enable the preparation of a Financial Report that gives a true
and fair view and is free from material misstatement, whether due to fraud or error
• assessing the Group and Company’s ability to continue as a going concern and whether the use of the
going concern basis of accounting is appropriate. This includes disclosing, as applicable, matters related to
going concern and using the going concern basis of accounting unless they either intend to liquidate the
Group and Company or to cease operations, or have no realistic alternative but to do so.
Auditor’s responsibilities for the audit of the Financial Report
Our objective is:
• to obtain reasonable assurance about whether the Financial Report as a whole is free from material
misstatement, whether due to fraud or error; and
• to issue an Auditor’s Report that includes our opinion.
Reasonable assurance is a high level of assurance, but is not a guarantee that an audit conducted in
accordance with Australian Auditing Standards will always detect a material misstatement when it exists.
Misstatements can arise from fraud or error. They are considered material if, individually or in the aggregate,
they could reasonably be expected to influence the economic decisions of users taken on the basis of the
Financial Report.
A further description of our responsibilities for the audit of the Financial Report is located at the Auditing and
Assurance Standards Board website at: http://www.auasb.gov.au/auditors_responsibilities/ar1.pdf. This
description forms part of our Auditor’s Report.

91
_01 PAR_NAM_01 PAR_POS_01 PAR_DAT_01 PAR_CIT_01
Report on the Remuneration Report
Opinion
In our opinion, the Remuneration Report of
Event Hospitality & Entertainment Limited for
the year ended 30 June 2018, complies with
Section 300A of the Corporations Act 2001.
Directors’ responsibilities
The Directors of the Company are responsible for the
preparation and presentation of the Remuneration Report in
accordance with Section 300A of the Corporations Act 2001.
Our responsibilities
We have audited the Remuneration Report included in pages
17 to 29 of the Directors’ report for the year ended 30 June
2018.
Our responsibility is to express an opinion on the
Remuneration Report, based on our audit conducted in
accordance with Australian Auditing Standards.
KPMG
Anthony Travers
Partner
Sydney
23 August 2018
KPMG
Tracey Driver
Partner
Sydney
23 August 2018
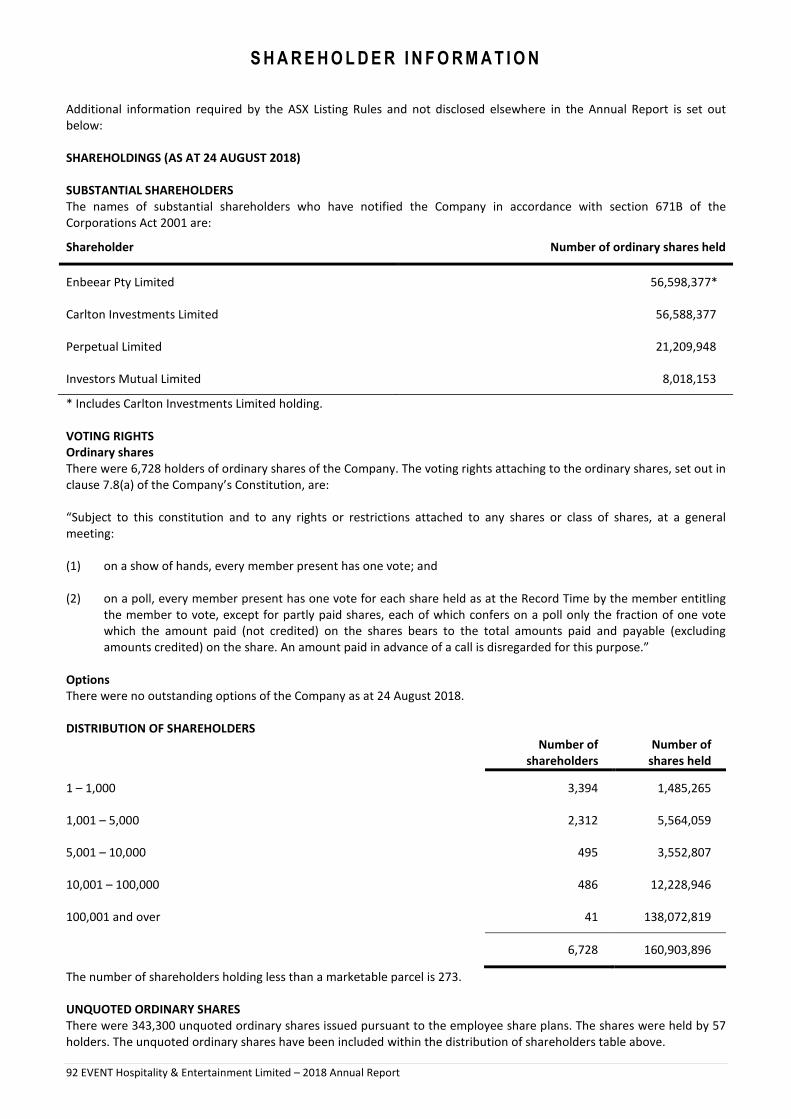
S H A R E H O L D E R I N F O R M A T I O N
92 EVENT Hospitality & Entertainment Limited – 2018 Annual Report
Additional information required by the ASX Listing Rules and not disclosed elsewhere in the Annual Report is set out
below:
SHAREHOLDINGS (AS AT 24 AUGUST 2018)
SUBSTANTIAL SHAREHOLDERS
The names of substantial shareholders who have notified the Company in accordance with section 671B of the
Corporations Act 2001 are:
Shareholder Number of ordinary shares held
Enbeear Pty Limited 56,598,377*--
Carlton Investments Limited 56,588,377
Perpetual Limited 21,209,948
Investors Mutual Limited 8,018,153
* Includes Carlton Investments Limited holding.
VOTING RIGHTS
Ordinary shares
There were 6,728 holders of ordinary shares of the Company. The voting rights attaching to the ordinary shares, set out in
clause 7.8(a) of the Company’s Constitution, are:
“Subject to this constitution and to any rights or restrictions attached to any shares or class of shares, at a general
meeting:
(1) on a show of hands, every member present has one vote; and
(2) on a poll, every member present has one vote for each share held as at the Record Time by the member entitling
the member to vote, except for partly paid shares, each of which confers on a poll only the fraction of one vote
which the amount paid (not credited) on the shares bears to the total amounts paid and payable (excluding
amounts credited) on the share. An amount paid in advance of a call is disregarded for this purpose.”
Options
There were no outstanding options of the Company as at 24 August 2018.
DISTRIBUTION OF SHAREHOLDERS
Number of
shareholders
Number of
shares held
1 – 1,000 3,394 1,485,265
1,001 – 5,000 2,312 5,564,059
5,001 – 10,000 495 3,552,807
10,001 – 100,000 486 12,228,946
100,001 and over 41 138,072,819
6,728 160,903,896
The number of shareholders holding less than a marketable parcel is 273.
UNQUOTED ORDINARY SHARES
There were 343,300 unquoted ordinary shares issued pursuant to the employee share plans. The shares were held by 57
holders. The unquoted ordinary shares have been included within the distribution of shareholders table above.

S H A R E H O L D E R I N F O R M A T I O N
93 EVENT Hospitality & Entertainment Limited – 2018 Annual Report
TWENTY LARGEST SHAREHOLDERS The names of the 20 largest shareholders of the quoted shares are: Number of Percentage of shares held capital held Enbeear Pty Limited 32,134,031 19.97% HSBC Custody Nominees (Australia) Limited 25,277,679 15.71% Eneber Investment Company Limited 19,777,772 12.29% JP Morgan Nominees Australia Limited 8,867,022 5.51% Citicorp Nominees Pty Limited 7,748,389 4.82% Alphoeb Pty Limited 6,027,315 3.75% The Manly Hotels Pty Limited 5,732,812 3.56% Carlton Hotel Limited 5,276,103 3.28% Mr Alan Graham Rydge 4,431,663 2.75% National Nominees Limited 3,940,860 2.45% Argo Investments Limited 3,012,387 1.87% BNP Paribas Noms Pty Limited <DRP> 2,366,158 1.47% BNP Paribas Nominees Pty Limited <Agency Lending DRP Account> 1,758,434 1.09% Australian United Investment Company Limited 1,500,000 0.93% Citicorp Nominees Pty Limited <Colonial First State Investment Account> 1,447,575 0.90% TN Phillips Investments Pty Limited 1,346,000 0.84% Australian Foundation Investment Company Limited 1,030,258 0.64% Milton Corporation Limited 1,010,921 0.63% HSBC Custody Nominees (Australia) Limited <NT-Comnwlth Super Corp Account>
875,515 0.54%
Mr David Christopher Seargeant 453,490 0.28%
134,014,384 83.28%
ON-MARKET BUY-BACK There is no current on-market buy-back. SECURITIES EXCHANGE EVENT Hospitality & Entertainment Limited, incorporated and domiciled in Australia, is a publicly listed company limited by shares. Shares are listed on the ASX under the code EVT.

O T H E R I N F O R M A T I O N
94 EVENT Hospitality & Entertainment Limited – 2018 Annual Report
ANNUAL GENERAL MEETING
The Annual General Meeting will be held at 10:00am on Friday 19 October 2018 at:
Event Cinemas
505 – 525 George Street
Sydney NSW 2000.
REGISTERED OFFICE
478 George Street
Sydney NSW 2000
Telephone +61 2 9373 6600
Facsimile +61 2 9373 6534
www.evt.com
SHARE REGISTRY
Computershare Investor Services Pty Limited
Level 4
60 Carrington Street
Sydney NSW 2000
GPO Box 2975
Melbourne VIC 3001
Telephone 1300 850 505
Facsimile +61 3 9473 2500
www.computershare.com
For more information on EVENT Hospitality & Entertainment Limited, please refer to our website at www.evt.com.