1959 Survivor Valuation Report Ending June 30, 2015 · PDF file1 – By definition, under...
49
c 1959 Survivor Benefit Program Actuarial Valuation as of June 30, 2015
Transcript of 1959 Survivor Valuation Report Ending June 30, 2015 · PDF file1 – By definition, under...

c
1959 Survivor Benefit Program
Actuarial Valuation as of
June 30, 2015

CalPERS 1959 Survivor Benefit Program Actuarial Valuation – June 30, 2015
1
Table of Contents
Actuarial Certification.................................................................................................................. 2 Highlights and Executive Summary ............................................................................................ 3
Purpose of the Report.............................................................................................. 4 Funded Status of the Plan ....................................................................................... 4 Required Employer and Employee Monthly Premiums ......................................... 5 Changes Since Prior Valuation ............................................................................... 6
Assets .............................................................................................................................................. 7 State 5th Level Pool ................................................................................................. 8 School 5th Level Pool .............................................................................................. 8 Public Agency 1st Level Pool .................................................................................. 9 Public Agency 2nd Level Pool ................................................................................. 9 Public Agency 3rd Level Pool ............................................................................... 10 Public Agency 4th Level Pool ............................................................................... 10 Public Agency Indexed Level Pool....................................................................... 11
Liabilities and Funding Requirements...................................................................................... 12 Comparison of Current and Prior Results ............................................................. 13 Development of Funding Requirements ............................................................... 17 Schedule of Amortization Bases …………………………………………………21 Gain/(Loss) Analysis ............................................................................................ 22
Risk Analysis ……………………………………………………………………………………29
Analysis of Future Investment Return Scenarios.................................................. 30 Analysis of Discount Rate Sensitivity .................................................................. 31
Appendix A - Statement of Actuarial Methods and Assumptions .............................................. A-1 Appendix B - Summary of Principal Plan Provisions ................................................................ B-1 Appendix C - Demographic and Experience Information .......................................................... C-1 Appendix D - 1959 Survivor Deaths Per Year ........................................................................... D-1 Appendix E - Glossary of Actuarial Terms ................................................................................. E-1
CalPERS 1959 Survivor Benefit Program Actuarial Valuation – June 30, 2015
2
Actuarial Certification Certification To the best of our knowledge, this report is complete and accurate and
contains sufficient information to fully and fairly disclose the funded condition of the 1959 Survivor Program for Public Agency 1st, 2nd, 3rd, 4th, and Indexed Level, and the State and Schools 5th Level Pools. This valuation is based on the beneficiary and membership data provided to the Actuarial Office, the statement of assets provided by the CalPERS Financial Office, and the benefits provided under this program. It is our opinion that this valuation has been performed by qualified actuaries in accordance with generally accepted actuarial principles, in accordance with standards of practice prescribed by the Actuarial Standards Board, and that the assumptions and methods are internally consistent and reasonable for this program. The undersigned are actuaries for CalPERS, who are members of the American Academy of Actuaries and the Society of Actuaries and meet the Qualification Standards of the American Academy of Actuaries to render the actuarial opinion contained herein. KERRY J. WORGAN, FSA, FCIA, MAAA Senior Pension Actuary ALAN MILLIGAN, FSA, FCIA, MAAA, FCA Chief Actuary

CalPERS 1959 Survivor Benefit Program Actuarial Valuation – June 30, 2015
3
Highlights and Executive Summary
Contents This section contains the following topics:
Topic See Page
Purpose of the Report 4 Funded Status of the Plan 4 Required Employer and Employee Monthly Premiums 5 Changes Since Prior Valuation 6

CalPERS 1959 Survivor Benefit Program Actuarial Valuation – June 30, 2015
4
Highlights & Executive Summary Purpose of the Report
This actuarial valuation of the 1959 Survivor Program for Public Agency 1st, 2nd, 3rd, 4th and Indexed level and the State and Schools 5th level pools within the California Public Employees’ Retirement System (CalPERS) was performed by CalPERS staff actuaries as of June 30, 2015 in order to:
• Set forth the funded status of the program, reflecting the assets and funding liabilities of this program as of June 30, 2015.
• Establish the actuarially required premiums for all levels and employee premiums in the Indexed, and State and Schools 5th Level for the Fiscal Year July 1, 2016 through June 30, 2017; and
• Provide actuarial information as of June 30, 2015 to the CalPERS Board of Administration and other interested parties.
The use of this report for any other purposes may be inappropriate.
Funded Status of the Plan
Shown below are the Accrued Liability, Market Value of Assets, and Funded Ratio of all pools within the 1959 Survivor Benefit Program as of June 30, 2015.
Plan
Accrued Liability1
Market Value of Assets (MVA)
Funded Ratio
State 5th Level Pool $ 142,864,757 $ 109,619,378 76.7%
Schools 5th Level Pool $ 13,498,624 $ 71,525,517 529.9%
PA 1st Level Pool $ 2,585,287 $ 43,637,106 1,687.9%
PA 2nd Level Pool $ 2,474,187 $ 10,589,764 428.0%
PA 3rd Level Pool $ 27,969,382 $ 106,293,464 380.0%
PA 4th Level Pool $ 128,491,218 $ 145,999,937 113.6%
PA Indexed Level Pool $ 18,279,091 $ 23,270,090 127.3%
Total $ 336,162,546 $ 510,935,256 152.0% 1 – By definition, under the Term Insurance Method, the present value of future benefits and the accrued liability are equal. Under the Entry Age Normal Method, which is being used to fund the benefit in the Indexed Pool, the accrued liability is defined as the difference between the present value of future benefits and the present value of future normal costs.

CalPERS 1959 Survivor Benefit Program Actuarial Valuation – June 30, 2015
5
Required Employer and Employee Monthly Premiums
The actuarially required employer and employee monthly premiums per covered member per month for the 1959 Survivor Program for the Fiscal Year July 1, 2016 through June 30, 2017 are shown below. The results for Fiscal Year July 1, 2015 through June 30, 2016 are shown for comparison. Except for the Public Agency Indexed Level pool, these monthly premiums are determined using a Modified Term Insurance funding method. Monthly premiums for the Public Agency Indexed Level pool are determined using the Entry Age Normal funding method.
Required Monthly Premiums
2015-16 Premium
2016-17 Premium Plan Employer Employee Total Employer Employee Total
State 5th Level Pool* $5.20 $5.20 $10.40 $5.15 $5.15 $10.30 Schools 5th Level Pool* $0.00 $2.00 $2.00 $0.00 $2.00 $2.00 PA 1st Level Pool** $0.00 $2.00 $2.00 $0.00 $2.00 $2.00 PA 2nd Level Pool** $0.00 $2.00 $2.00 $0.00 $2.00 $2.00 PA 3rd Level Pool** $0.00 $2.00 $2.00 $0.00 $2.00 $2.00 PA 4th Level Pool** $3.50 $2.00 $5.50 $4.30 $2.00 $6.30 PA Indexed Level Pool* $2.40 $2.40 $4.80 $2.75 $2.75 $5.50
* Section 21581 of the California Public Employees’ Retirement Law requires mandatory cost sharing when the total premium
exceeds $4.00. Mandatory $2.00 member monthly premium required. ** Mandatory $2.00 member monthly premium required. The required employee premium for the State 5th level pool will change from $5.20 to $5.15 per member, per month (or from $2.40 to $2.38 for biweekly paid members) for Fiscal Year 2016-17. This is in accordance with Statute 21581(c), which specifies that when the total required premium (after amortization of surplus/unfunded liability) exceeds $4.00, the employer and the member shall evenly share the required monthly premium. The required employee premium for the Indexed level pool will change from $2.40 to $2.75 per member, per month (or from $1.11 to $1.27 for biweekly paid members) for Fiscal Year 2016-17. This is in accordance with Statute 21581(b), which specifies that when the total required premium (after amortization of surplus/unfunded liability) exceeds $4.00, the employer and the member shall evenly share the required monthly premium. Employee required premiums for all of the other pools shall remain the same, $2.00, as in the prior year.

CalPERS 1959 Survivor Benefit Program Actuarial Valuation – June 30, 2015
6
Changes Since the Prior Year’s Valuation
Actuarial Assumptions - No changes were made since the prior valuation. A complete description of the actuarial assumptions used in the June 30, 2015 valuation may be found in Appendix A of this report. Actuarial Methods - No changes were made since the prior valuation. A complete description of the actuarial methods used in the June 30, 2015 valuation may be found in Appendix A of this report. Plan Provisions - No changes were made since the prior valuation. A complete description of the principal plan provisions used in the June 30, 2015 valuation may be found in Appendix B of this report. Other Changes - CalPERS adopted a Funding Risk Mitigation Policy that will reduce the funding risk over time. Under this policy, good investment performance that significantly outperforms the discount rate triggers adjustments to the discount rate, expected investment return and strategic asset allocation targets. This has no impact on the current valuation results, but will have an impact on the Risk Analysis presented on Page 30.

CalPERS 1959 Survivor Benefit Program Actuarial Valuation – June 30, 2015
7
Assets
Contents This section contains the following topics:
Topic See Page Reconciliation of the Market Value of Assets for the State 5th Level Pool
8
Reconciliation of the Market Value of Assets for the Schools 5th Level Pool
8
Reconciliation of the Market Value of Assets for the Public Agency 1st Level Pool
9
Reconciliation of the Market Value of Assets for the Public Agency 2nd Level Pool
9
Reconciliation of the Market Value of Assets for the Public Agency 3rd Level Pool
10
Reconciliation of the Market Value of Assets for the Public Agency 4th Level Pool
10
Reconciliation of the Market Value of Assets for the Public Agency Indexed Level Pool
11

CalPERS 1959 Survivor Benefit Program Actuarial Valuation – June 30, 2015
8
Reconciliation of the Market Value of Assets State 5th Level Pool
Reconciliation of the Market Value of Assets from the Prior Fiscal Year The following table shows the changes in the market value of assets for the State 5th Level Pool. June 30, 2014
June 30, 2015
Beginning Balance $ 102,751,222 $ 113,878,478 Contributions (Employer and Employee) Received during fiscal year
9,056,427
9,328,084 Benefit Payments during fiscal year
(15,366,076)
(15,755,900)
Net Transfer of Assets into and out of this pool
0
0
Investment Earnings credited
17,436,905
2,168,716
Ending Balance
$ 113,878,478
$ 109,619,378
Fund Return for Year
17.5%
2.0%
Schools 5th Level Pool
Reconciliation of the Market Value of Assets from the Prior Fiscal Year The following table shows the changes in the market value of assets for the Schools 5th Level Pool. June 30, 2014 June 30, 2015 Beginning Balance $ 61,870,390 $ 71,331,499 Contributions (Employer and Employee)
Received during fiscal year 213,065 210,282 Benefit Payments during fiscal year
(1,441,413)
(1,458,812)
Net Transfer of Assets into and out of this pool
0
0
Investment Earnings credited
10,689,457
1,442,549
Ending Balance
$ 71,331,499
$ 71,525,517
Fund Return for Year
17.5%
2.0%

CalPERS 1959 Survivor Benefit Program Actuarial Valuation – June 30, 2015
9
Public Agency 1st Level Pool
Reconciliation of the Market Value of Assets from the Prior Fiscal Year The following table shows the changes in the market value of assets for the Public Agency 1st Level Pool. June 30, 2014 June 30, 2015 Beginning Balance $ 36,668,679 $ 43,028,607 Contributions (Employer and Employee)
Received during fiscal year 182,409 177,824 Benefit Payments during fiscal year
(279,071)
(231,026)
Net Transfer of Assets into and out of this pool
0
(212,216)
Investment Earnings credited
6,456,590
873,917
Ending Balance
$ 43,028,607
$ 43,637,106
Fund Return for Year
17.6%
2.0%
Public Agency 2nd Level Pool
Reconciliation of the Market Value of Assets from the Prior Fiscal Year The following table shows the changes in the market value of assets for the Public Agency 2nd Level Pool. June 30, 2014 June 30, 2015 Beginning Balance $ 9,100,668 $ 10,527,005 Contributions (Employer and Employee)
Received during fiscal year 85,369 92,682 Benefit Payments during fiscal year
(227,496)
(236,761)
Net Transfer of Assets into and out of this pool
0
(4,443)
Investment Earnings credited
1,568,464
211,281
Ending Balance
$ 10,527,005
$ 10,589,764
Fund Return for Year
17.4%
2.0%

CalPERS 1959 Survivor Benefit Program Actuarial Valuation – June 30, 2015
10
Public Agency 3rd Level Pool
Reconciliation of the Market Value of Assets from the Prior Fiscal Year The following table shows the changes in the market value of assets for the Public Agency 3rd Level Pool. June 30, 2014 June 30, 2015 Beginning Balance $ 92,079,207 $ 106,304,466 Contributions (Employer and Employee)
Received during fiscal year 949,783 984,836 Benefit Payments during fiscal year
(2,598,703)
(2,623,553)
Net Transfer of Assets into and out of this pool
0
(497,448)
Investment Earnings credited
15,874,179
2,125,163
Ending Balance
$ 106,304,466
$ 106,293,464
Fund Return for Year
17.4%
2.0%
Public Agency 4th Level Pool
Reconciliation of the Market Value of Assets from the Prior Fiscal Year The following table shows the changes in the market value of assets for the Public Agency 4th Level Pool. June 30, 2014 June 30, 2015 Beginning Balance $ 133,865,159 $ 149,327,096 Contributions (Employer and Employee)
Received during fiscal year 5,358,263 5,701,601 Benefit Payments during fiscal year
(12,467,414)
(12,677,733)
Net Transfer of Assets into and out of this pool
0
704,436
Investment Earnings credited
22,571,088
2,944,537
Ending Balance
$ 149,327,096
$ 145,999,937
Fund Return for Year
17.3%
2.0%

CalPERS 1959 Survivor Benefit Program Actuarial Valuation – June 30, 2015
11
Public Agency Indexed Level Pool
Reconciliation of the Market Value of Assets from the Prior Fiscal Year The following table shows the changes in the market value of assets for the Public Agency Indexed Level Pool. June 30, 2014 June 30, 2015 Beginning Balance $ 20,411,771 $ 23,230,521 Contributions (Employer and Employee)
Received during fiscal year 619,614 792,091 Benefit Payments during fiscal year
(1,297,992)
(1,223,796)
Net Transfer of Assets into and out of this pool
0
9,671
Investment Earnings credited
3,497,128
461,602
Ending Balance
$ 23,230,521
$ 23,270,090
Fund Return for Year
17.4%
2.0%

CalPERS 1959 Survivor Benefit Program Actuarial Valuation – June 30, 2015
12
Liabilities and Funding Requirements
Contents This section contains the following topics:
Topic See Page Comparison of Current and Prior Year Results 13 Development of Funding Requirements 17 Schedule of Amortization Bases 21 Gain/(Loss) Analysis 22

CalPERS 1959 Survivor Benefit Program Actuarial Valuation – June 30, 2015
13
Comparison of Current and Prior Year Results
Shown below are the comparisons of key valuation results for the current valuation date compared to corresponding values from the prior valuation date.
State 5th Level Pool
June 30, 2014 June 30, 2015 Covered Active Members 72,848 74,372 Beneficiaries Included in the Valuation
Deferred (eligible, but not yet receiving benefits) 272 290 Receiving Benefits 1,433 1,437 Total 1,705 1,727
Present Value of Benefits $ 139,400,186 $ 142,864,757 Market Value of Assets (MVA) $ 113,878,478 $ 109,619,378 (Unfunded Liability)/Excess Assets $ (25,521,708) $ (33,245,379) Required Employer Monthly Premium Per Member
Before Amortization of (Unfunded Liability)/Excess Assets $ 7.00 $ 7.00 After Amortization of (Unfunded Liability)/Excess Assets $10.40 $10.30 After employer/employee premium sharing $ 5.20 $ 5.15
Funded Ratio based on MVA 81.7% 76.7%
Schools 5th Level Pool
June 30, 2014 June 30, 2015 Covered Active Members 10,287 10,490 Beneficiaries Included in the Valuation
Deferred (eligible, but not yet receiving benefits) 18 18 Receiving Benefits 144 154 Total 162 172
Present Value of Benefits $ 12,599,127 $ 13,498,624 Market Value of Assets (MVA) $ 71,331,499 $ 71,525,517 (Unfunded Liability)/Excess Assets $ 58,732,372 $ 58,026,893 Required Employer Monthly Premium Per Member
Before Amortization of (Unfunded Liability)/Excess Assets $ 4.90 $ 4.70 After Amortization of (Unfunded Liability)/Excess Assets $ 0.00 $ 0.00 After employer/employee premium sharing $ 0.00 $ 0.00
Funded Ratio based on MVA 566.2% 529.9%

CalPERS 1959 Survivor Benefit Program Actuarial Valuation – June 30, 2015
14
Comparison of Current and Prior Results (continued)
Shown below are the comparisons of key valuation results for the current valuation date compared to corresponding values from the prior valuation date.
Public Agency 1st Level Pool
June 30, 2014 June 30, 2015 Covered Active Members 7,409 7,413 Beneficiaries Included in the Valuation
Deferred (eligible, but not yet receiving benefits) 31 33 Receiving Benefits 92 94 Total 123 127
Present Value of Benefits $ 2,478,062 $ 2,585,287 Market Value of Assets (MVA) $ 43,028,607 $ 43,637,106 (Unfunded Liability)/Excess Assets $ 40,550,545 $ 41,051,819 Required Employer Monthly Premium Per Member
Total premium required $ 1.50 $ 1.40 Premium required after Employee Contributions $ 0.00 $ 0.00 Employer premium after Amortization of $ 0.00 $ 0.00
(Unfunded Liability)/Excess Assets Funded Ratio based on MVA 1,736.4% 1,687.9%
Public Agency 2nd Level Pool
June 30, 2014 June 30, 2015 Covered Active Members 3,939 3,945 Beneficiaries Included in the Valuation
Deferred (eligible, but not yet receiving benefits) 29 25 Receiving Benefits 67 73 Total 96 98
Present Value of Benefits $ 2,340,934 $ 2,474,187 Market Value of Assets (MVA) $ 10,527,005 $ 10,589,764 (Unfunded Liability)/Excess Assets $ 8,186,071 $ 8,115,577 Required Employer Monthly Premium Per Member
Total premium required $ 1.80 $ 1.80 Premium required after Employee Contributions $ 0.00 $ 0.00 Employer premium after Amortization of $ 0.00 $ 0.00
(Unfunded Liability)/Excess Assets Funded Ratio based on MVA 449.7% 428.0%

CalPERS 1959 Survivor Benefit Program Actuarial Valuation – June 30, 2015
15
Comparison of Current and Prior Results (continued)
Shown below are the comparisons of key valuation results for the current valuation date compared to corresponding values from the prior valuation date.
Public Agency 3rd Level Pool
June 30, 2014 June 30, 2015 Covered Active Members 41,701 42,933 Beneficiaries Included in the Valuation
Deferred (eligible, but not yet receiving benefits) 185 186 Receiving Benefits 532 547 Total 717 733
Present Value of Benefits $ 27,317,573 $ 27,969,382 Market Value of Assets (MVA) $106,304,466 $106,293,464 (Unfunded Liability)/Excess Assets $ 78,986,893 $ 78,324,082 Required Employer Monthly Premium Per Member
Total premium required $ 2.80 $ 2.80 Premium required after Employee Contributions $ 0.80 $ 0.80 Employer premium after Amortization of $ 0.00 $ 0.00
(Unfunded Liability)/Excess Assets Funded Ratio based on MVA 389.1% 380.0%
Public Agency 4th Level Pool
June 30, 2014 June 30, 2015 Covered Active Members 68,814 70,072 Beneficiaries Included in the Valuation
Deferred (eligible, but not yet receiving benefits) 239 234 Receiving Benefits 904 936 Total 1,143 1,170
Present Value of Benefits $ 125,014,115 $ 128,491,218 Market Value of Assets (MVA) $ 149,327,096 $ 145,999,937 (Unfunded Liability)/Excess Assets $ 24,312,981 $ 17,508,719 Required Employer Monthly Premium Per Member
Total premium required $ 7.70 $ 7.60 Premium required after Employee Contributions $ 5.70 $ 5.60 Employer premium after Amortization of $ 3.50 $ 4.30
(Unfunded Liability)/Excess Assets Funded Ratio based on MVA 119.4% 113.6%

CalPERS 1959 Survivor Benefit Program Actuarial Valuation – June 30, 2015
16
Comparison of Current and Prior Results (continued)
Shown below are the comparisons of key valuation results for the current valuation date compared to corresponding values from the prior valuation date.
Public Agency Indexed Level Pool
June 30, 2014 June 30, 2015 Covered Active Members 10,161 10,516 Beneficiaries Included in the Valuation
Deferred (eligible, but not yet receiving benefits) 22 21 Receiving Benefits 106 110 Total 128 131
Entry Age Normal Accrued Liability $ 17,887,365 $ 18,279,091 Market Value of Assets (MVA) $ 23,230,521 $ 23,270,090 (Unfunded Liability)/Excess Assets $ 5,343,156 $ 4,990,999 Required Employer Monthly Premium Per Member
Before Amortization of (Unfunded Liability)/Excess Assets $ 8.20 $ 8.20 After Amortization of (Unfunded Liability)/Excess Assets $ 4.80 $ 5.50 After employer/employee premium sharing $ 2.40 $ 2.75
Funded Ratio based on MVA 129.9% 127.3%

CalPERS 1959 Survivor Benefit Program Actuarial Valuation – June 30, 2015
17
The following table develops the annual premiums required for 2016-17 for the State 5th and Schools 5th Level Pools.
State 5th Level
School 5th Level
1) Development of Unfunded Liabilitya. Present Value of Future Survivor Benefits $142,864,757 $13,498,624b. Market Value of Assets $109,619,378 $71,525,517c. Unfunded Accrued Liability/(Excess Assets) $33,245,379 ($58,026,893) [1(a)-1(b)]
2) Development of Normal Costa. Present Value of Benefits for 2011-2014 Deaths $24,342,833 $2,062,433b. Number of 2011-2014 Member Months 3,522,012 481,980c. Total per member, per month 2015/2016 Term Insurance Normal Cost $7.00 $4.90d. Total per member, per month 2016/2017 Term Insurance Normal Cost $7.00 $4.70 [.25 * 2(a)/2(b) + .75 * (c)], rounded to nearest $0.10
3) 2016 Projected Unfunded Liabilitya. 2015 Unfunded Accrued Liability/(Excess Assets) as of June 30, 2016 $35,738,782 ($62,378,910) [1(c)*1.075]b. Projected Normal Cost Accrual 2015-2016 with interest $6,786,685 $639,225c. Projected Employer Contributions 2015-2016 with interest $4,864,361 $0d. Projected Employee Contributions 2015-2016 with interest $4,864,361 $262,399e. Total Projected UAL/(Excess Assets) as of June 30, 2016 $32,796,746 ($62,002,084) [3(a)+3(b)-3(c)-3(d)]
4) 2016/2017 Required Contributiona. Required Normal Cost per member, per month $7.00 $4.70 [2(d)]b. Projected Active Members as of 6/30/2016 76,000 10,600c. Required Normal Cost Contribution $6,619,072 $619,854 [12*4(a)*4(b)*1.075^1/2]d. Amortization of the UAL/(Excess Assets)1 $2,756,102 ($619,854)e. Total Required Contribution per member, per month $10.30 $0.00 [(4(c)+4(d))/(4(b)*12)], rounded to nearest $0.10
f. Amortization Period see table on Pg. 21 30 yr.
5) 2016/2017 Required Employer and Employee Premiums With CostSharing Provisiona. Required Employee Premium per member, per month $5.15 $2.00 [maximum($2,4(e)/2)]b. Required Employer Premium per member, per month $5.15 $0.00 [maximum($0,4(e)-5(a))]
Notes:1 - See amortization schedule on Page 21
June 30, 2015 Annual Valuation of 1959 Survivor Program
Development of Funding Requirementsfor State 5th and Schools 5th Level Pools

CalPERS 1959 Survivor Benefit Program Actuarial Valuation – June 30, 2015
18
The following table develops the annual premiums required for 2016-17 for the Public Agency 1st and 2nd Level Pools.
Public Agency Level 1
Public Agency Level 2
1) Development of Unfunded Liabilitya. Present Value of Future Survivor Benefits $2,585,287 $2,474,187b. Market Value of Assets $43,637,106 $10,589,764c. Unfunded Accrued Liability/(Excess Assets) ($41,051,819) ($8,115,577) [1(a)-1(b)]
2) Development of Normal Costa. Present Value of Benefits for 2011-2014 Deaths1 $9,313,886 $11,642,358b. Number of 2011-2014 Member Months1 6,345,948 6,345,948c. Total per member, per month 2015/2016 Term Insurance Normal Cost $1.40 $1.80d. Total per member, per month 2016/2017 Term Insurance Normal Cost $1.40 $1.80 [.25 * 2(a)/2(b) + .75 * (c)], rounded to nearest $0.10
3) 2016 Projected Unfunded Liabilitya. 2015 Unfunded Accrued Liability as of June 30, 2016 ($44,130,705) ($8,724,245) [1(c)*1.075]b. Projected Normal Cost Accrual 2015-2016 with interest $133,766 $92,219c. Projected Employer Contributions 2015-2016 with interest $0 $0d. Projected Employee Contributions 2015-2016 with interest $184,301 $98,851e. Total Projected UAL as of June 30, 2016 ($44,181,241) ($8,730,877) [3(a)+3(b)-3(c)-3(d)]
4) 2016/2017 Required Contributiona. Required Normal Cost per member, per month $1.40 $1.80 [2(d)]b. Projected Active Members as of 6/30/2016 7,400 4,000c. Required Normal Cost Contribution $128,898 $89,581 [12*4(a)*4(b)*1.075^1/2]d. Amortization of the UAL/(Excess Assets) ($128,898) ($89,581)e. Total Required Contribution Per Member, Per Month $0.00 $0.00 [(4(c)+4(d))/(4(b)*12)], rounded to nearest $0.10
f. Amortization Period N/A N/A
5) 2016/2017 Required Employer and Employee Premiumsa. Required Employee Premium per member, per month $2.00 $2.00b. Required Employer Premium per member, per month $0.00 $0.00 [maximum($0,4(e)-5(a))]
Notes:1 - Mortality experience and survivor distribution are assumed to be homogeneous across all Public Agency pools and are added together to develop normal costs in order to improve credibility of the data. This is further explained in the Actuarial Funding Methods section.
Development of Funding Requirements
June 30, 2015 Annual Valuation of 1959 Survivor Programfor Public Agency 1st and 2nd Level Pools

CalPERS 1959 Survivor Benefit Program Actuarial Valuation – June 30, 2015
19
The following table develops the annual premiums required for 2016-17 for the Public Agency 3rd and 4th Level Pools.
Public Agency Level 3
Public Agency Level 4
1) Development of Unfunded Liabilitya. Present Value of Future Survivor Benefits $27,969,382 $128,491,218b. Market Value of Assets $106,293,464 $145,999,937c. Unfunded Accrued Liability/(Excess Assets) ($78,324,082) ($17,508,719) [1(a)-1(b)]
2) Development of Normal Costa. Present Value of Benefits for 2011-2014 Deaths1 $18,110,334 $49,156,622b. Number of 2011-2014 Member Months1 6,345,948 6,345,948c. Total per member, per month 2015/2016 Term Insurance Normal Cost $2.80 $7.60d. Total per member, per month 2016/2017 Term Insurance Normal Cost $2.80 $7.60 [.25 * 2(a)/2(b) + .75 * (c)], rounded to nearest $0.10
3) 2016 Projected Unfunded Liabilitya. 2015 Unfunded Accrued Liability as of June 30, 2016 ($84,198,388) ($18,821,872) [1(c)*1.075]b. Projected Normal Cost Accrual 2015-2016 with interest $1,567,584 $6,946,829c. Projected Employer Contributions 2015-2016 with interest $0 $3,086,839d. Projected Employee Contributions 2015-2016 with interest $1,080,364 $1,763,908e. Total Projected UAL as of June 30, 2016 ($83,711,168) ($16,725,790) [3(a)+3(b)-3(c)-3(d)]
4) 2016/2017 Required Contributiona. Required Normal Cost per member, per month $2.80 $7.60 [2(d)]b. Projected Active Members as of 6/30/2016 43,900 71,700c. Required Normal Cost Contribution $1,529,354 $6,779,821 [12*4(a)*4(b)*1.075^1/2]d. Amortization of the UAL/(Excess Assets) ($1,529,354) ($1,365,898)e. Total Required Contribution Per Member, Per Month $0.00 $6.30 [(4(c)+4(d))/(4(b)*12)], rounded to nearest $0.10
f. Amortization Period N/A 30-year
5) 2016/2017 Required Employer and Employee Premiumsa. Required Employee Premium per member, per month $2.00 $2.00b. Required Employer Premium per member, per month $0.00 $4.30 [maximum($0,4(e)-5(a))]
Notes:1 - Mortality experience and survivor distribution are assumed to be homogeneous across all Public Agency pools and are added together to develop normal costs in order to improve credibility of the data. This is further explained in the Actuarial Funding Methods section.
June 30, 2015 Annual Valuation of 1959 Survivor Program
Development of Funding Requirementsfor Public Agency 3rd and 4th Level Pools

CalPERS 1959 Survivor Benefit Program Actuarial Valuation – June 30, 2015
20
The following table develops the annual premiums required for 2016-17 for the Public Agency Indexed Level Pools.
Public Agency Indexed Level
1) Development of Unfunded Liabilitya. Present Value of Future Benefits for Active Members $11,628,956b. Present Value of Future Benefits for Current Survivors $13,826,557c. Total Present Value of Future Benefits [1(a)+1(b)] $25,455,513
d. Present Value of Future Normal Costs $7,176,422e. Entry Age Normal Total Accrued Liability [1(c)-1(d)] $18,279,091
f. Market Value of Assets $23,270,090g. Unfunded Accrued Liability/(Excess Assets) [1(e)-1(f)] ($4,990,999)
2) Development of Normal Costa. Required Entry Age Normal Cost $1,033,065b. Active Members as of June 30, 2015 10,516c. Total per member per month Entry Age Normal Cost $8.20 [2(a)/2(b)*12], rounded to nearest $0.10
3) 2016 Projected Unfunded Liabilitya. 2015 Unfunded Accrued Liability/(Excess Assets) as of June 30, 2016 ($5,365,324) [1(g)*1.075]b. Projected Normal Cost Accrual 2015-2016 with interest $1,131,971c. Projected Employer Contributions 2015-2016 with interest $319,746d. Projected Employee Contributions 2015-2016 with interest $319,746e. Total Projected UAL as of June 30, 2016 ($4,872,845) [3(a)+3(b)-3(c)-3(d)]
4) 2016/2017 Required Contributiona. Required Normal Cost per member, per month $8.20 [2(c)]b. Projected Active Members as of June 30, 2016 10,900c. Required Normal Cost Contribution $1,112,054 [12*4(a)*4(b)*1.075^1/2]d. Amortization of the UAL/(Excess Assets) ($397,937)e. Total Required Contribution per member, per month $5.50 [(4(c)+4(d))/(4(b)*12)], rounded to nearest $0.10
f. Amortization Period 30-year
5) 2016/2017 Employer and Employee Premiums with Cost Sharing Provisiona. Required Employee Premium per member, per month $2.75 [maximum(2,4(e)/2)]b. Required Employer Premium per member, per month $2.75 [maximum(0,4(e)-5(a))]
June 30, 2015 Annual Valuation of 1959 Survivor Program
Development of Funding Requirementsfor Public Agency Indexed Level Pool

CalPERS 1959 Survivor Benefit Program Actuarial Valuation – June 30, 2015
21
Schedule of Amortization Bases The schedule below shows the development of the required payments on the Amortization Bases in accordance with the Amortization Policy. In accordance with Board policy, a plan with a funding excess will have their funding excess amortized over a minimum of 30 years.
State 5th Level Pool
Date
Established Remaining
Period
Projected Balance
6/30/2015 Payment 2015-16
Projected Balance
6/30/2016 Payment 2016-17
Projected Balance
6/30/2017
Projected Payment 2017-18
Unfunded Liability
6/30/2013 28 $37,510,628 $3,093,190 $37,116,838 $3,093,190 $36,693,513 $3,093,190
Experience (Gain)/Loss
6/30/2014 29 ($13,599,404) ($ 266,892) ($14,342,641) ($ 533,783) ($ 14,864,900) ($ 800,675)
Experience (Gain)/Loss
6/30/2015 30 $ 10,022,549 $ 196,695 $ 10,570,302 $ 393,390
Total $23,911,224 $2,826,298 $32,796,746 $2,756,102 $32,398,914 $2,685,905

CalPERS 1959 Survivor Benefit Program Actuarial Valuation – June 30, 2015
22
Gain/(Loss) Analysis 6/30/2014 – 6/30/2015
State 5th Level Pool
The following table develops the asset and demographic gain and losses between June 30, 2014 and June 30, 2015 for the State 5th Level Pool.
Amounts as of 6/30/2014
1) Present Value of Benefits $ 139,400,186 2) Market Value of Assets 113,878,478 3) Unfunded Liability/(Excess Assets) [(1)-(2)] 25,521,708
Amounts During the Period 6/30/2014 – 6/30/2015 4) Expected Claims for the Fiscal Year 6,174,407 5) Employer and Employee Premiums Collected 9,328,084 6) Benefit Payments (15,755,900) 7) Net Liabilities Transferred into the State 5th level pool 0 8) Net Assets Transferred into the State 5th level pool 0
Expected Amounts as of 6/30/2015 9) Expected Present Value of Benefits 139,920,896
[(1) * 1.075 + ((4) + (6) + (7)) * (1.075)1/2 ] 10) Expected Market Value of Assets 115,754,862
[(2) * 1.075 + ((5) + (6) + (8)) * (1.075)1/2 ] 11) Expected Unfunded Liability/(Excess Assets) [(9)-(10)] 24,166,034
Amounts as of 6/30/2015 12) Present Value of Benefits 142,864,757 13) Market Value of Assets 109,619,378 14) Unfunded Liability/(Excess Assets) [(12)-(13)] 33,245,379
Gain/(Loss) for the Period 6/30/2014 – 6/30/2015 15) Liability Gain/(Loss) [(9) – (12)] (2,943,861) 16) Asset Gain/(Loss) [(13) – (10)] (6,135,484) 17) Total Gain/(Loss) [(15) + (16)] $ (9,079,345)
CalPERS 1959 Survivor Benefit Program Actuarial Valuation – June 30, 2015
23
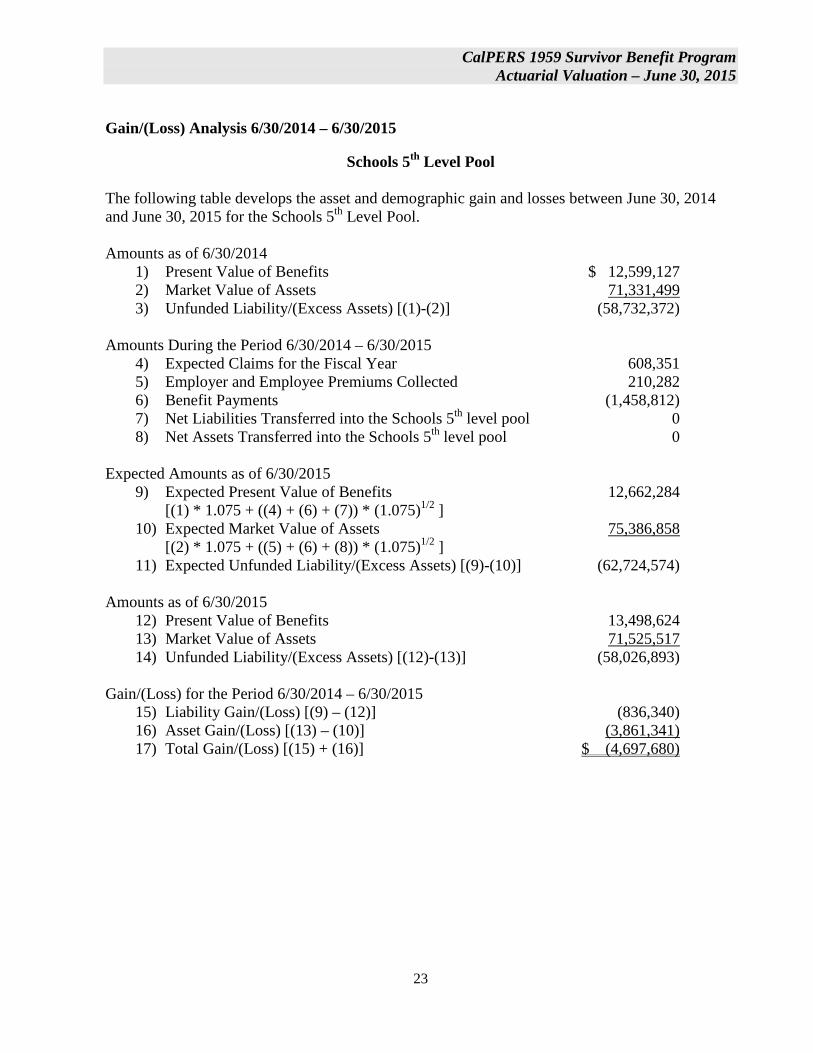
Gain/(Loss) Analysis 6/30/2014 – 6/30/2015
Schools 5th Level Pool
The following table develops the asset and demographic gain and losses between June 30, 2014 and June 30, 2015 for the Schools 5th Level Pool.
Amounts as of 6/30/2014
1) Present Value of Benefits $ 12,599,127 2) Market Value of Assets 71,331,499 3) Unfunded Liability/(Excess Assets) [(1)-(2)] (58,732,372)
Amounts During the Period 6/30/2014 – 6/30/2015 4) Expected Claims for the Fiscal Year 608,351 5) Employer and Employee Premiums Collected 210,282 6) Benefit Payments (1,458,812) 7) Net Liabilities Transferred into the Schools 5th level pool 0 8) Net Assets Transferred into the Schools 5th level pool 0
Expected Amounts as of 6/30/2015 9) Expected Present Value of Benefits 12,662,284
[(1) * 1.075 + ((4) + (6) + (7)) * (1.075)1/2 ] 10) Expected Market Value of Assets 75,386,858
[(2) * 1.075 + ((5) + (6) + (8)) * (1.075)1/2 ] 11) Expected Unfunded Liability/(Excess Assets) [(9)-(10)] (62,724,574)
Amounts as of 6/30/2015 12) Present Value of Benefits 13,498,624 13) Market Value of Assets 71,525,517 14) Unfunded Liability/(Excess Assets) [(12)-(13)] (58,026,893)
Gain/(Loss) for the Period 6/30/2014 – 6/30/2015 15) Liability Gain/(Loss) [(9) – (12)] (836,340) 16) Asset Gain/(Loss) [(13) – (10)] (3,861,341) 17) Total Gain/(Loss) [(15) + (16)] $ (4,697,680)

CalPERS 1959 Survivor Benefit Program Actuarial Valuation – June 30, 2015
24
Gain/(Loss) Analysis 6/30/2014 – 6/30/2015
Public Agency 1st Level Pool The following table develops the asset and demographic gain and losses between June 30, 2014 and June 30, 2015 for the Public Agency 1st Level Pool.
Amounts as of 6/30/2014
1) Present Value of Benefits $ 2,478,062 2) Market Value of Assets 43,028,607 3) Unfunded Liability/(Excess Assets) [(1)-(2)] (40,550,545)
Amounts During the Period 6/30/2014 – 6/30/2015 4) Expected Claims for the Fiscal Year 128,951 5) Employer and Employee Premiums Collected 177,824 6) Benefit Payments (231,026) 7) Net Liabilities Transferred into the 1st level pool 0 8) Net Assets Transferred into the 1st level pool (212,216)
Expected Amounts as of 6/30/2015 9) Expected Present Value of Benefits 2,558,083
[(1) * 1.075 + ((4) + (6) + (7)) * (1.075)1/2 ] 10) Expected Market Value of Assets 45,980,562
[(2) * 1.075 + ((5) + (6) + (8)) * (1.075)1/2 ] 11) Expected Unfunded Liability/(Excess Assets) [(9)-(10)] (43,422,478)
Amounts as of 6/30/2015 12) Present Value of Benefits 2,585,287 13) Market Value of Assets 43,637,106 14) Unfunded Liability/(Excess Assets) [(12)-(13)] (41,051,819)
Gain/(Loss) for the Period 6/30/2014 – 6/30/2015 15) Liability Gain/(Loss) [(9) – (12)] (27,204) 16) Asset Gain/(Loss) [(13) – (10)] (2,343,456) 17) Total Gain/(Loss) [(15) + (16)] $ (2,370,659)

CalPERS 1959 Survivor Benefit Program Actuarial Valuation – June 30, 2015
25
Gain/(Loss) Analysis 6/30/2014 – 6/30/2015
Public Agency 2nd Level Pool The following table develops the asset and demographic gain and losses between June 30, 2014 and June 30, 2015 for the Public Agency 2nd Level Pool.
Amounts as of 6/30/2014
1) Present Value of Benefits $ 2,340,934 2) Market Value of Assets 10,527,005 3) Unfunded Liability/(Excess Assets) [(1)-(2)] (8,186,071)
Amounts During the Period 6/30/2014 – 6/30/2015 4) Expected Claims for the Fiscal Year 85,620 5) Employer and Employee Premiums Collected 92,682 6) Benefit Payments (236,761) 7) Net Liabilities Transferred into the 2nd level pool 0 8) Net Assets Transferred into the 2nd level pool (4,443)
Expected Amounts as of 6/30/2015 9) Expected Present Value of Benefits 2,359,798
[(1) * 1.075 + ((4) + (6) + (7)) * (1.075)1/2 ] 10) Expected Market Value of Assets 11,162,539
[(2) * 1.075 + ((5) + (6) + (8)) * (1.075)1/2 ] 11) Expected Unfunded Liability/(Excess Assets) [(9)-(10)] (8,802,741)
Amounts as of 6/30/2015 12) Present Value of Benefits 2,474,187 13) Market Value of Assets 10,589,764 14) Unfunded Liability/(Excess Assets) [(12)-(13)] (8,115,577)
Gain/(Loss) for the Period 6/30/2014 – 6/30/2015 15) Liability Gain/(Loss) [(9) – (12)] (114,389) 16) Asset Gain/(Loss) [(13) – (10)] (572,775) 17) Total Gain/(Loss) [(15) + (16)] $ (687,164)

CalPERS 1959 Survivor Benefit Program Actuarial Valuation – June 30, 2015
26
Gain/(Loss) Analysis 6/30/2014 – 6/30/2015
Public Agency 3rd Level Pool The following table develops the asset and demographic gain and losses between June 30, 2014 and June 30, 2015 for the Public Agency 3rd Level Pool.
Amounts as of 6/30/2014
1) Present Value of Benefits $ 27,317,573 2) Market Value of Assets 106,304,466 3) Unfunded Liability/(Excess Assets) [(1)-(2)] (78,986,893)
Amounts During the Period 6/30/2014 - 6/30/2015 4) Expected Claims for the Fiscal Year 1,426,929 5) Employer and Employee Premiums Collected 984,836 6) Benefit Payments (2,623,553) 7) Net Liabilities Transferred into the 3rd level pool (101,243) 8) Net Assets Transferred into 3rd level pool (497,448)
Expected Amounts as of 6/30/2015
9) Expected Present Value of Benefits 28,020,734 [(1) * 1.075 + ((4) + (6) + (7)) * (1.075)1/2 ]
10) Expected Market Value of Assets 112,062,478 [(2) * 1.075 + ((5) + (6) + (8)) * (1.075)1/2 ]
11) Expected Unfunded Liability/(Excess Assets) [(9)-(10)] (84,041,743)
Amounts as of 6/30/2015 12) Present Value of Benefits 27,969,382 13) Market Value of Assets 106,293,464 14) Unfunded Liability/(Excess Assets) [(12)-(13)] (78,324,082)
Gain/(Loss) for the Period 6/30/2014 – 6/30/2015 15) Liability Gain/(Loss) [(9) – (12)] 51,352 16) Asset Gain/(Loss) [(13) – (10)] (5,769,014) 17) Total Gain/(Loss) [(15) + (16)] $ (5,717,662)

CalPERS 1959 Survivor Benefit Program Actuarial Valuation – June 30, 2015
27
Gain/(Loss) Analysis 6/30/2014 – 6/30/2015
Public Agency 4th Level Pool The following table develops the asset and demographic gain and losses between June 30, 2014 and June 30, 2015 for the Public Agency 4th Level Pool.
Amounts as of 6/30/2014
1) Present Value of Benefits $ 125,014,115 2) Market Value of Assets 149,327,096 3) Unfunded Liability/(Excess Assets) [(1)-(2)] (24,312,981)
Amounts During the Period 6/30/2014 – 6/30/2015 4) Expected Claims for the Fiscal Year 6,366,534 5) Employer and Employee Premiums Collected 5,701,601 6) Benefit Payments (12,677,733) 7) Net Liabilities Transferred into the 4th level pool 274,803 8) Net Assets Transferred into the 4th level pool 704,436
Expected Amounts as of 6/30/2015 9) Expected Present Value of Benefits 128,131,505
[(1) * 1.075 + ((4) + (6) + (7)) * (1.075)1/2 ] 10) Expected Market Value of Assets 154,023,996
[(2) * 1.075 + ((5) + (6) + (8)) * (1.075)1/2 ] 11) Expected Unfunded Liability/(Excess Assets) [(9)-(10)] (25,892,490)
Amounts as of 6/30/2015 12) Present Value of Benefits 128,491,218 13) Market Value of Assets 145,999,937 14) Unfunded Liability/(Excess Assets) [(12)-(13)] (17,508,719)
Gain/(Loss) for the Period 6/30/2014 – 6/30/2015 15) Liability Gain/(Loss) [(9) – (12)] (359,713) 16) Asset Gain/(Loss) [(13) – (10)] (8,024,059) 17) Total Gain/(Loss) [(15) + (16)] $ (8,383,772)

CalPERS 1959 Survivor Benefit Program Actuarial Valuation – June 30, 2015
28
Gain/(Loss) Analysis 6/30/2014 – 6/30/2015
Public Agency Indexed Level Pool The following table develops the asset and demographic gain and losses between June 30, 2014 and June 30, 2015 for the Public Agency Indexed Level Pool.
Amounts as of 6/30/2014
1) Accrued Liability $ 17,887,365 2) Market Value of Assets 23,230,521 3) Unfunded Liability/(Excess Assets) [(1)-(2)] (5,343,156)
Amounts During the Period 6/30/2014 – 6/30/2015 4) Normal Cost for the Fiscal Year 1,033,436 5) Employer and Employee Premiums Collected 792,091 6) Benefit Payments (1,223,796) 7) Net Liabilities Transferred into the Indexed Level pool 0 8) Net Assets Transferred into the Indexed Level pool 9,671
Expected Amounts as of 6/30/2015 9) Expected Present Value of Benefits 19,031,549
[(1) * 1.075 + ((4) + (6) + (7)) * (1.075)1/2 ] 10) Expected Market Value of Assets 24,535,236
[(2) * 1.075 + ((5) + (6) + (8)) * (1.075)1/2 ] 11) Expected Unfunded Liability/(Excess Assets) [(9)-(10)] (5,503,688)
Amounts as of 6/30/2015 12) Present Value of Benefits 18,279,091 13) Market Value of Assets 23,270,090 14) Unfunded Liability/(Excess Assets) [(12)-(13)] (4,990,999)
Gain/(Loss) for the Period 6/30/2014 – 6/30/2015 15) Liability Gain/(Loss) [(9) – (12)] 752,458 16) Asset Gain/(Loss) [(13) – (10)] (1,265,146) 17) Total Gain/(Loss) [(15) + (16)] $ (512,689)

CalPERS 1959 Survivor Benefit Program Actuarial Valuation – June 30, 2015
29
Risk Analysis
Contents This section contains the following topics:
Topic See Page Analysis of Future Investment Return Scenarios 30 Analysis of Discount Rate Sensitivity 31

CalPERS 1959 Survivor Benefit Program Actuarial Valuation – June 30, 2015
30
Analysis of Future Investment Return Scenarios
The following analysis looks at what the 2017-18 contribution rates would be under four different investment return scenarios. This type of analysis can give the reader a sense of the short-term risk to the contribution rates. The first scenario is what one would expect if the markets were to give us a 5th percentile return without considering we are already at an approximate return of -6% so far for the 2015-16 Fiscal Year (thru January 31, 2016). The 5th percentile return corresponds to a -12% return for the 2015-16 Fiscal Year. The second scenario assumed the return would be our assumed 7.50%. The third scenario assumes an approximate return of -6%, the rate of return attained so far this fiscal year. The last scenario is what one would expect if the markets were to give us a 95th percentile return notwithstanding the -6% year-to-date return for the current fiscal year. This 95th percentile return is equivalent to around 27%. A 27% return would trigger a reduction in the discount rate by .25% in accordance with the Risk Mitigation Policy which is reflected under that scenario. The tables below shows 2017-18 projected employee and employer contribution rates under the return scenarios mentioned above. -12% Return 7.50% Return
2017-18 Employer Monthly Premium
2017-18 Employee Monthly Premium
2017-18 Employer Monthly Premium
2017-18 Employee Monthly Premium
PA 1 $0.00 $2.00 $0.00 $2.00 PA 2 $0.00 $2.00 $0.00 $2.00 PA 3 $0.00 $2.00 $0.00 $2.00 PA 4 $7.10 $2.00 $4.30 $2.00 Indexed $4.10 $4.10 $2.75 $2.75 State $5.35 $5.35 $5.10 $5.10 School $0.00 $2.00 $0.00 $2.00
-6% Return 27% Return1
2017-18 Employer Monthly Premium
2017-18 Employee Monthly Premium
2017-18 Employer Monthly Premium
2017-18 Employee Monthly Premium
PA 1 $0.00 $2.00 $0.00 $2.00 PA 2 $0.00 $2.00 $0.00 $2.00 PA 3 $0.00 $2.00 $0.00 $2.00 PA 4 $6.30 $2.00 $2.10 $2.00 Indexed $3.70 $3.70 $1.20 $2.00 State $5.25 $5.25 $4.90 $4.90 School $0.00 $2.00 $0.00 $2.00
1 – reflects reduction in discount rate of .25%

CalPERS 1959 Survivor Benefit Program Actuarial Valuation – June 30, 2015
31
Analysis of Discount Rate Sensitivity
The following analysis looks at what the 2016-17 contribution premiums would be under two different discount rate scenarios. We determined the required contribution premiums using discount rates that are 1% lower and 1% higher than the valuation discount rate of 7.50%. This analysis will give an indication of the potential required premium rates if the PERF had investment returns of 6.50% or 8.50% over the long-term. This type of analysis can give employers a sense of the long-term risk to the contribution rates. 6.50% Discount Rate (-1%) Increase in Premium
2016-17 Employer Monthly Premium
2016-17 Employee Monthly Premium
2016-17 Employer Monthly Premium
2016-17 Employee Monthly Premium
PA 1 $0.00 $2.00 $0.00 $0.00 PA 2 $0.00 $2.00 $0.00 $0.00 PA 3 $0.00 $2.00 $0.00 $0.00 PA 4 $6.00 $2.00 $1.70 $0.00 Indexed $4.05 $4.05 $1.30 $1.30 State $5.80 $5.80 $0.65 $0.65 School $0.00 $2.00 $0.00 $0.00
8.50% Discount Rate (+1%) Decrease in Premium
2016-17 Employer Monthly Premium
2016-17 Employee Monthly Premium
2016-17 Employer Monthly Premium
2016-17 Employee Monthly Premium
PA 1 $0.00 $2.00 $0.00 $0.00 PA 2 $0.00 $2.00 $0.00 $0.00 PA 3 $0.00 $2.00 $0.00 $0.00 PA 4 $2.80 $2.00 ($1.50) $0.00 Indexed $1.00 $2.00 ($1.75) ($0.75) State $4.45 $4.45 ($0.70) ($0.70) School $0.00 $2.00 $0.00 $0.00

CalPERS 1959 Survivor Benefit Program Actuarial Valuation – June 30, 2015
A-1
Appendix A - Statement of Actuarial Methods and Assumptions Actuarial Funding Method for Public Agency 1st, 2nd, 3rd and 4th Level, and State and Schools 5th Level Pools
The actuarial funding method used, as provided in State statute for public agency 1st, 2nd, 3rd and 4th level, and State and Schools 5th level pools, is called the Term Insurance method. This is a terminal funding arrangement with no pre-funding of the survivor benefits payable on account of deaths expected to occur beyond those in the coming year. The Normal Cost for the year is equal to the Expected Claims (present value of benefits arising from deaths) that will occur in the coming fiscal year. The expected claims for the coming fiscal year is determined as the expected claim per member, per month multiplied by the expected member months for the coming fiscal year. The normal cost (or expected claims) per member, per month for the coming fiscal year is equal to a weighted average of the prior year and current year normal cost. Specifically, the current year’s normal cost is calculated as the present value of member deaths for the past 4 years divided by the total number of members exposed to the death benefit over the same period. Then the normal cost (expected claims) for the coming year is simply 25% of the current year’s normal cost and 75% of the prior year’s normal cost. The reason for this methodology is that when new deaths occur each year, it is often unknown which benefit will ultimately apply (i.e., 1957 Survivor, Industrial Death, Pre-Retirement Option 2 or 1959 Survivor). Many times, new deaths are initially placed under the 1959 Survivor roll, but ultimately are reclassified to another roll some time later. This can create extreme volatility in the normal cost calculation between valuation years, especially for smaller pools. The consequence of this approach is that less weight is given to the most recent year’s data and more weight is given to previous years. In fact, as this methodology matures or reaches a steady state, all data from the past would have some impact on the calculated normal cost. The following matrix shows ultimate weights for the past ten year’s data as the methodology approaches its steady state: Data t years ago Weights 1 6.3% 2 10.9 3 14.5 4 17.1 5 12.8 6 9.6 7 7.2 8 5.4 9 4.1 10 3.0

CalPERS 1959 Survivor Benefit Program Actuarial Valuation – June 30, 2015
A-2
For Public Agency 1st, 2nd, 3rd and 4th Levels, the Present Value of Benefits for 2011-2014 Deaths for each level are calculated as if all members of all four levels who died from 2011-2014 were members of that particular level. The Accrued Liability is equal to the Present Value of Benefits payable to current survivors. If the Accrued Liability exceeds the Actuarial Value of Assets, the difference is called the Unfunded Liability. On the other hand, if the Actuarial Value of Assets exceeds the Accrued Liability, the difference is called Excess Assets. The required employer monthly premium is the total required monthly premium less the $2.00 per month member contributions as required by State Statute Section 21581. For all levels, existing excess assets in the pool will be amortized and directly used to offset required employer contributions. However, for the State and Schools 5th Level pool, if the total required monthly premium after amortization of excess assets exceeds $4, the member and the employer shall evenly share the required monthly premium. For the current valuation date, the unfunded liability for the State 5th Level pool was amortized using CalPERS amortization policy. Excess assets for the Schools 5th Level pool, and Public Agency 1st, 2nd, and 3rd Level pools were sufficient to offset required employer contributions indefinitely, based on June 30, 2015 data and assumptions. Excess assets for the Public Agency 4th Level were amortized over a 30-year period, and are not sufficient to fully offset the required employer contribution. The resulting employer contribution for the 4th Level is $4.30 per covered member per month.
Actuarial Funding Method for Public Agency Indexed Level Pool
The funding method used for the Public Agency Indexed Level pool is the Entry Age Normal method. Under this method, projected benefits are determined for all members and the associated liabilities are spread in a manner that produces an annual cost that increases by approximately 2% in each year. The Normal Cost for the Public Agency Indexed Level pool is the portion of the total Entry Age Normal Cost, as described in the preceding paragraph that is allocated to the current fiscal year. Since there is no cost allocated to the current fiscal year for those already receiving benefits or are in a deferred status, only active members have a Normal Cost. The population demographics, excluding population growth, are assumed to remain stable for purposes of projecting the Normal Cost to the year for which the contribution requirement is being determined. The Accrued Liability is equal to the Present Value of Future Benefits for both current survivors and active members, less the Present Value of Future Normal Costs.

CalPERS 1959 Survivor Benefit Program Actuarial Valuation – June 30, 2015
A-3
The total required monthly premium is the sum of the individual Normal Costs divided by the number of member months. The required employer monthly premium is the total required monthly premium less the $2.00 per month member contributions as required by State Statute Section 21581. Existing excess assets in the pool is amortized and directly used to offset required employer contributions. However, if the total required monthly premium after amortization of excess assets exceeds $4.00, the member and the employer evenly share the required monthly premium. Excess assets for the Public Agency Indexed Level are amortized over a 30-year period. The resulting employer contribution for the Indexed Level is $2.75 per covered member per month.
Asset Valuation Method
Commencing with the June 30, 2013 valuation, assets were and continue to be valued on a Market Value basis.
Method for Projecting Active Counts
In the past, actuarial staff has found that two particular methods have worked well in predicting future active member counts for the pools. Projected counts are necessary to determine employer premiums. The two methods that are normally used are linear trend or autoregressive models. For this valuation year, we will continue to use these models for the Public Agency Pools. They continue to model slow and even declining growth in the Levels 1, 2 and 3 pools and less positive growth in Level 4 and Indexed. This is to be expected, since the first three levels are closed to new entrants and Levels 4 and Indexed are still open to amending and new contracting. These methods when applied to the State and Schools Pools are also predicting modest growth for Schools and for State. This is consistent with the current state of the economy, current hiring practices of the State and the fact that new migration into and out of these pools do not take place.

CalPERS 1959 Survivor Benefit Program Actuarial Valuation – June 30, 2015
A-4
Actuarial Assumptions
The primary actuarial assumptions used in this valuation include the investment return rate and the mortality rates for current beneficiaries. The investment return for the PERF was adopted by the CalPERS Board on March 14, 2012 based upon recommendations from both CalPERS actuarial staff and outside consulting actuaries. Agenda Item 4 to the Pension and Health Benefits Committee meeting on March 13, 2012 provides the background information for the adopted rate. The mortality assumptions are based on mortality rates resulting from the most recent CalPERS Experience Study adopted by the CalPERS Board. For purposes of the mortality rates, the revised rates include 20 years of projected on-going mortality improvement using Scale BB published by the Society of Actuaries. For more details about the mortality assumptions and demographic assumptions related to the Indexed Level pool, please refer to the Experience Study report found on the CalPERS website in the Forms and Publications section. Actual mortality rates for active members of all pools combined are shown in Appendix D and are used in the calculation of the annual normal costs, except for the Public Agency Indexed Level. Economic Assumptions:
Investment Return 7.50% compounded annually (net of administrative expenses).
Demographic Assumptions:
Attained Age Male Mortality Rate Female Mortality Rate 25 .0003 .0002 30 .0004 .0003 35 .0006 .0005 40 .0011 .0009 45 .0023 .0020 50 .0050 .0047 55 .0060 .0042 60 .0071 .0044 65 .0083 .0059 70 .0131 .0099 75 .0221 .0172 80 .0390 .0290 85 .0697 .0524 90 .1297 .0989 95 .2244 .1849 100 .3254 .3002

CalPERS 1959 Survivor Benefit Program Actuarial Valuation – June 30, 2015
A-5
Additional Actuarial Assumptions Applicable to the Public Agency Indexed Level
The Public Agency Indexed Level’s Accrued Liability and Entry Age Normal cost for active members are calculated based on the actuarial assumptions for our Public Agency miscellaneous 2% @ 55 and police 2% @ 50 pension plans. The final valuation results equals the sum of the results valued on the basis of a miscellaneous 2% @ 55 plan plus the results valued on the basis of a police 2% @ 50 plan, where all miscellaneous employees are valued using miscellaneous 2% @ 55 assumptions, and all safety employees are valued using police 2% @ 50 assumptions. The actuarial assumptions for each of these plans are as follows:
Eligible Survivor Status
For active members of both the Miscellaneous and Safety Police plans, the probability of having eligible survivor(s) at the date of death is assumed according to the following table:
Age at Death
Percent having Eligible Survivor(s)
Age 20 and under 30% Between ages 21 and 24 50% Between ages 25 and 29 70% Between ages 30 and 39 90% Between ages 40 and 49 95% Between ages 50 and 54 90% Age 55 and above 85%
Average claims are developed at every age using actual experience from the program. These average claims are then multiplied by the percentages in the above table. The results are used to estimate expected claims in the active population.
Benefit amounts and Present Value of benefits were based on average claim experience. A sample of the average claim experience is shown in the table below:
Age at Death
Present Value of Average Claim at the Time of Death*
20 and below $31,707 25 $93,090 30 $125,004 35 $118,385 40 $111,656 45 $96,873 50 $79,591 55 $67,140 60 $63,054 65 $62,093 70 $62,147 75 $59,820
80 and above $50,429

CalPERS 1959 Survivor Benefit Program Actuarial Valuation – June 30, 2015
A-6
Average claims were calculated using actual experience from the 1959 Survivor program and smoothed using a polynomial regression model.
*Values are based on an initial benefit of $500/$1,000/$1,500 for one, two, or three survivors, respectively. This was the benefit level on June 30, 2000, when the Indexed Level first became effective. The valuation program increases these amounts by 2% per year up to the current valuation year.
Public Agency Miscellaneous 2% @ 55
Non-Industrial (Not Job-Related) Death and Non-Industrial (Not Job-Related) Disability
Rates vary by age and sex. See sample rates in table below. Male Female
Attained
Non-Industrial (Not Job-Related)
Non-Industrial (Not Job-Related)
Non-Industrial (Not Job-Related)
Non-Industrial (Not Job-Related)
Age Death Disability Death Disability 20 25 30 35 40 45 50 55 60
0.00031 0.00040 0.00049 0.00057 0.00075 0.00106 0.00155 0.00228 0.00308
0.00017 0.00017 0.00019 0.00049 0.00122 0.00191 0.00213 0.00221 0.00222
0.00020 0.00023 0.00025 0.00035 0.00050 0.00071 0.00100 0.00138 0.00182
0.00010 0.00010 0.00024 0.00081 0.00155 0.00218 0.00229 0.00179 0.00135
Service Retirement
Rates vary by age and service. See table sample below. Service Retirement Duration of Service
Age 50 51 52 53 54 55 56 57 58 59 60 61 62 63 64 65 66 67 68 69 70
5 Years 0.0140 0.0120 0.0130 0.0150 0.0260 0.0480 0.0420 0.0440 0.0490 0.0570 0.0670 0.0810 0.1160 0.1140 0.1080 0.1550 0.1320 0.1220 0.1110 0.1140 0.1300
10 Years 0.0180 0.0140 0.0170 0.0200 0.0330 0.0610 0.0530 0.0560 0.0620 0.0720 0.0860 0.1030 0.1470 0.1440 0.1380 0.1970 0.1680 0.1550 0.1410 0.1440 0.1650
15 Years 0.0210 0.0170 0.0190 0.0230 0.0380 0.0740 0.0630 0.0670 0.0740 0.0860 0.1030 0.1240 0.1780 0.1740 0.1660 0.2380 0.2030 0.1890 0.1700 0.1740 0.2000
20 Years 0.0250 0.0200 0.0230 0.0270 0.0450 0.0880 0.0750 0.0810 0.0890 0.1030 0.1230 0.1480 0.2140 0.2080 0.1990 0.2850 0.2430 0.2250 0.2040 0.2090 0.2400
25 Years 0.0270 0.0210 0.0250 0.0300 0.0510 0.1000 0.0850 0.0910 0.1000 0.1180 0.1390 0.1680 0.2430 0.2370 0.2270 0.3250 0.2760 0.2560 0.2320 0.2380 0.2720
30 Years 0.0310 0.0250 0.0280 0.0340 0.0590 0.1170 0.1000 0.1070 0.1180 0.1380 0.1640 0.1990 0.2880 0.2810 0.2680 0.3860 0.3280 0.3040 0.2740 0.2820 0.3230

CalPERS 1959 Survivor Benefit Program Actuarial Valuation – June 30, 2015
A-7
Public Agency Miscellaneous 2% @ 55 (continued)
Termination with Refund
Rates vary by entry age and service. See sample rates in table below.
Termination with Refund Duration of Entry Age
Service 20 25 30 35 40 45 0 1 2 3 4 5
10 15 20 25 30
0.1742 0.1545 0.1348 0.1151 0.0954 0.0212 0.0138 0.0060 0.0037 0.0017 0.0005
0.1674 0.1477 0.1280 0.1083 0.0886 0.0193 0.0121 0.0051 0.0029 0.0011 0.0001
0.1606 0.1409 0.1212 0.1015 0.0818 0.0174 0.0104 0.0042 0.0021 0.0005 0.0001
0.1537 0.1339 0.1142 0.0945 0.0748 0.0155 0.0088 0.0032 0.0013 0.0001 0.0001
0.1468 0.1271 0.1074 0.0877 0.0680 0.0136 0.0071 0.0023 0.0005 0.0001 0.0001
0.1400 0.1203 0.1006 0.0809 0.0612 0.0116 0.0055 0.0014 0.0001 0.0001 0.0001
Termination with Vested Deferred Benefits Rates vary by entry age and service. See sample rates in table below.
Termination with Vested Deferred Benefits Duration of Entry Age
Service 20 25 30 35 40 5
10 15 20 25 30
0.0656 0.0530 0.0443 0.0333 0.0212 0.0000
0.0597 0.0466 0.0373 0.0261 0.0000 0.0000
0.0537 0.0403 0.0305 0.0000 0.0000 0.0000
0.0477 0.0339 0.0000 0.0000 0.0000 0.0000
0.0418 0.0000 0.0000 0.0000 0.0000 0.0000
Public Agency Police 2% @ 50
Non-Industrial (Not Job-Related) Death and Non-Industrial (Not Job-Related) Disability
Rates vary by age and sex. See sample rates in table below.
Male Female
Attained
Non-Industrial (Not Job-Related)
Non-Industrial (Not Job-Related)
Non-Industrial (Not Job-Related)
Non-Industrial (Not Job-Related)
Age Death Disability Death Disability 20 25 30 35 40 45 50 55 60
0.00031 0.00040 0.00049 0.00057 0.00075 0.00106 0.00155 0.00228 0.00308
0.00010 0.00010 0.00020 0.00030 0.00040 0.00050 0.00080 0.00130 0.00200
0.00020 0.00023 0.00025 0.00035 0.00050 0.00071 0.00100 0.00138 0.00182
0.00010 0.00010 0.00020 0.00030 0.00040 0.00050 0.00080 0.00130 0.00200
CalPERS 1959 Survivor Benefit Program Actuarial Valuation – June 30, 2015
A-8
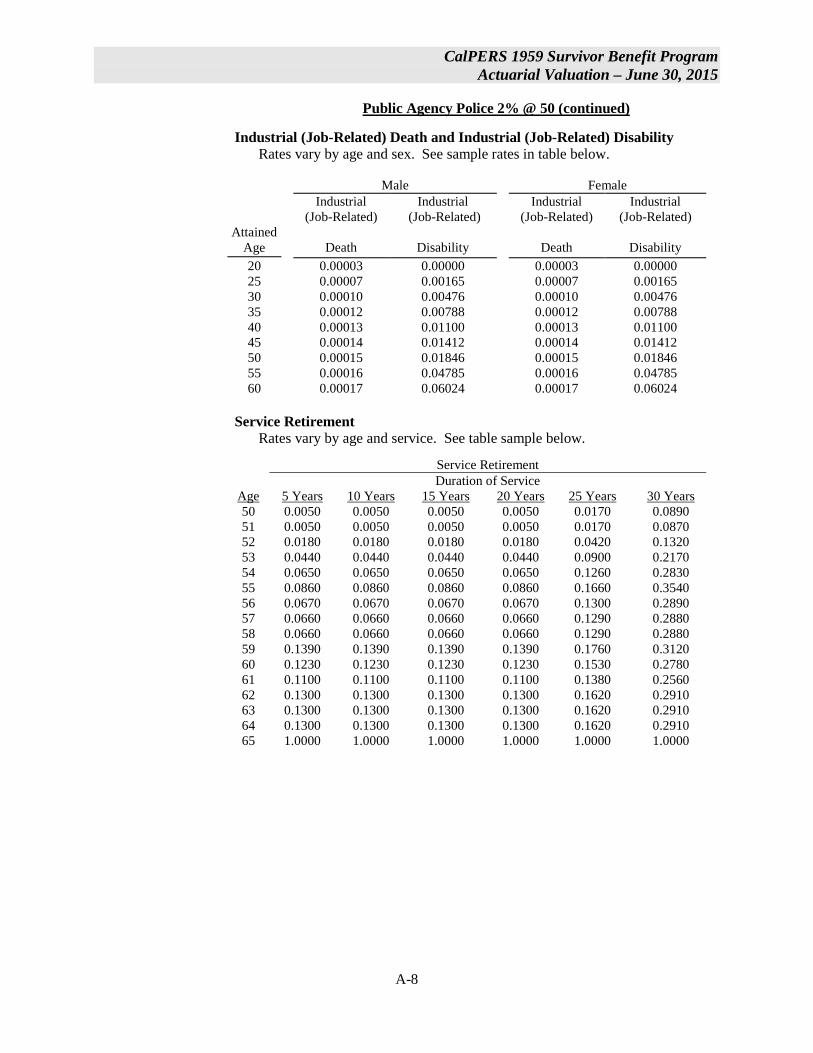
Public Agency Police 2% @ 50 (continued)
Industrial (Job-Related) Death and Industrial (Job-Related) Disability Rates vary by age and sex. See sample rates in table below.
Male Female
Attained
Industrial (Job-Related)
Industrial (Job-Related)
Industrial (Job-Related)
Industrial (Job-Related)
Age Death Disability Death Disability 20 25 30 35 40 45 50 55 60
0.00003 0.00007 0.00010 0.00012 0.00013 0.00014 0.00015 0.00016 0.00017
0.00000 0.00165 0.00476 0.00788 0.01100 0.01412 0.01846 0.04785 0.06024
0.00003 0.00007 0.00010 0.00012 0.00013 0.00014 0.00015 0.00016 0.00017
0.00000 0.00165 0.00476 0.00788 0.01100 0.01412 0.01846 0.04785 0.06024
Service Retirement
Rates vary by age and service. See table sample below.
Service Retirement Duration of Service
Age 50 51 52 53 54 55 56 57 58 59 60 61 62 63 64 65
5 Years 0.0050 0.0050 0.0180 0.0440 0.0650 0.0860 0.0670 0.0660 0.0660 0.1390 0.1230 0.1100 0.1300 0.1300 0.1300 1.0000
10 Years 0.0050 0.0050 0.0180 0.0440 0.0650 0.0860 0.0670 0.0660 0.0660 0.1390 0.1230 0.1100 0.1300 0.1300 0.1300 1.0000
15 Years 0.0050 0.0050 0.0180 0.0440 0.0650 0.0860 0.0670 0.0660 0.0660 0.1390 0.1230 0.1100 0.1300 0.1300 0.1300 1.0000
20 Years 0.0050 0.0050 0.0180 0.0440 0.0650 0.0860 0.0670 0.0660 0.0660 0.1390 0.1230 0.1100 0.1300 0.1300 0.1300 1.0000
25 Years 0.0170 0.0170 0.0420 0.0900 0.1260 0.1660 0.1300 0.1290 0.1290 0.1760 0.1530 0.1380 0.1620 0.1620 0.1620 1.0000
30 Years 0.0890 0.0870 0.1320 0.2170 0.2830 0.3540 0.2890 0.2880 0.2880 0.3120 0.2780 0.2560 0.2910 0.2910 0.2910 1.0000

CalPERS 1959 Survivor Benefit Program Actuarial Valuation – June 30, 2015
A-9
Public Agency Police 2% @ 50 (continued) Termination with Refund
Rates vary by entry age and service. See sample rates in table below.
Termination with Refund Duration of Entry Age
Service 20 25 30 35 40 45 0 1 2 3 4 5
10 15 20 25 30
0.1013 0.0636 0.0271 0.0258 0.0245 0.0086 0.0053 0.0027 0.0017 0.0012 0.0009
0.1013 0.0636 0.0271 0.0258 0.0245 0.0086 0.0053 0.0027 0.0017 0.0012 0.0009
0.1013 0.0636 0.0271 0.0258 0.0245 0.0086 0.0053 0.0027 0.0017 0.0012 0.0009
0.1013 0.0636 0.0271 0.0258 0.0245 0.0086 0.0053 0.0027 0.0017 0.0012 0.0009
0.1013 0.0636 0.0271 0.0258 0.0245 0.0086 0.0053 0.0027 0.0017 0.0012 0.0009
0.1013 0.0636 0.0271 0.0258 0.0245 0.0086 0.0053 0.0027 0.0017 0.0012 0.0009
Termination with Vested Deferred Benefits
Rates vary by entry age and service. See sample rates in table below.
Termination with Vested Deferred Benefits Duration of Entry Age
Service 20 25 30 35 40 5
10 15 20 25 30
0.0163 0.0126 0.0082 0.0065 0.0058 0.0000
0.0163 0.0126 0.0082 0.0065 0.0000 0.0000
0.0163 0.0126 0.0082 0.0000 0.0000 0.0000
0.0163 0.0126 0.0000 0.0000 0.0000 0.0000
0.0163 0.0000 0.0000 0.0000 0.0000 0.0000
CalPERS 1959 Survivor Benefit Program Actuarial Valuation – June 30, 2015
B-1
Appendix B - Principal Plan Provisions
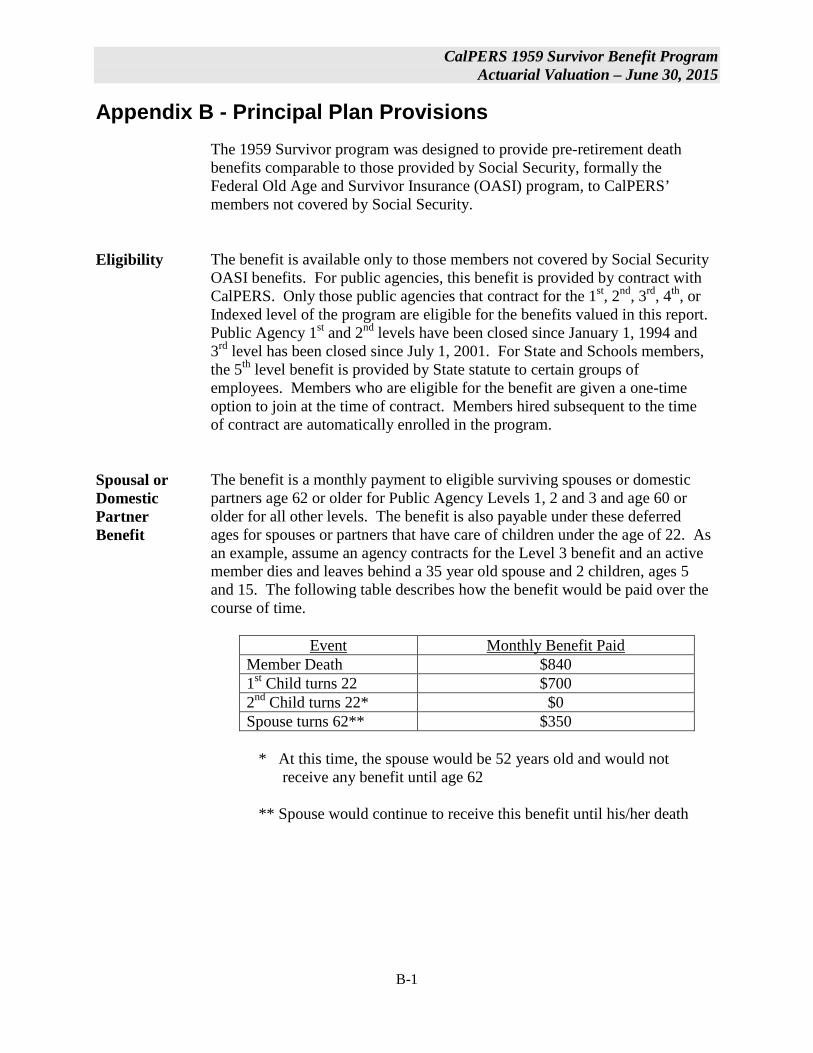
The 1959 Survivor program was designed to provide pre-retirement death benefits comparable to those provided by Social Security, formally the Federal Old Age and Survivor Insurance (OASI) program, to CalPERS’ members not covered by Social Security.
Eligibility
The benefit is available only to those members not covered by Social Security OASI benefits. For public agencies, this benefit is provided by contract with CalPERS. Only those public agencies that contract for the 1st, 2nd, 3rd, 4th, or Indexed level of the program are eligible for the benefits valued in this report. Public Agency 1st and 2nd levels have been closed since January 1, 1994 and 3rd level has been closed since July 1, 2001. For State and Schools members, the 5th level benefit is provided by State statute to certain groups of employees. Members who are eligible for the benefit are given a one-time option to join at the time of contract. Members hired subsequent to the time of contract are automatically enrolled in the program.
Spousal or Domestic Partner Benefit
The benefit is a monthly payment to eligible surviving spouses or domestic partners age 62 or older for Public Agency Levels 1, 2 and 3 and age 60 or older for all other levels. The benefit is also payable under these deferred ages for spouses or partners that have care of children under the age of 22. As an example, assume an agency contracts for the Level 3 benefit and an active member dies and leaves behind a 35 year old spouse and 2 children, ages 5 and 15. The following table describes how the benefit would be paid over the course of time.
Event Monthly Benefit Paid
Member Death $840 1st Child turns 22 $700 2nd Child turns 22* $0 Spouse turns 62** $350
* At this time, the spouse would be 52 years old and would not
receive any benefit until age 62 ** Spouse would continue to receive this benefit until his/her death

CalPERS 1959 Survivor Benefit Program Actuarial Valuation – June 30, 2015
B-2
Child Benefit Children are eligible under the age of 22 whether a spouse or domestic partner exists. For 3 or more children, the 3 survivor benefit is paid; for 2 children, the 2 survivor benefit is paid and so forth (see tables below). In all cases, unless a child is disabled, the benefit stops at age 22. If a child is disabled, the benefit is paid until the disability ceases.
Parental Benefit
If there is no eligible spouse or domestic partner or children, parent(s) dependent for at least half of their subsistence from the deceased member may be eligible for benefits. The parent(s) must be over age 62 for Public Agency Levels 1, 2 and 3 and over age 60 for all other levels.
Monthly Benefit Amounts
The monthly benefit amount depends upon the coverage level within the program. Level 1 (For Members of Public Agencies who Contract) a. spouse or domestic partner with two or more eligible children; or three or more eligible children $430 b. spouse with one eligible child; or two eligible children only $360 c. one eligible child only; or spouse age 62 or older;
or eligible dependent parents $180 Level 2 (For Members of Public Agencies who Contract) a. spouse or domestic partner with two or more eligible children; or three or more eligible children $538 b. spouse with one eligible child; or two eligible children only $450 c. one eligible child only; or spouse age 62 or older;
or eligible dependent parents $225 Level 3 (For Members of Public Agencies who Contract) a. spouse or domestic partner with two or more eligible children; or three or more eligible children $840 b. spouse with one eligible child; or two eligible children only $700 c. one eligible child only; or spouse age 62 or older;
or eligible dependent parents $350 Level 4 (For Members of Public Agencies who Contract) a. spouse or domestic partner with two or more eligible children; or three or more eligible children $2,280 b. spouse with one eligible child; or two eligible children only $1,900 c. one eligible child only; or spouse age 60 or older;
or eligible dependent parents $950

CalPERS 1959 Survivor Benefit Program Actuarial Valuation – June 30, 2015
B-3
Indexed Level (For Members of Public Agencies who Contract) a. spouse or domestic partner with two or more eligible children; or three or more eligible children $2,0591 b. spouse with one eligible child; or two eligible children only $1,3731 c. one eligible child only; or spouse age 60 or older;
or eligible dependent parents $6861 Level 5 – (For State and Schools Members) a. spouse or domestic partner with two or more eligible children; or three or more eligible children $1,800 b. spouse with one eligible child; or two eligible children only $1,500 c. one eligible child only; or spouse age 60 or older;
or eligible dependent parents $750 1 - These figures indicate calendar year benefit amounts for the Indexed Level in effect for calendar year 2016. Benefit amounts will increase by 2 percent each January 1.
Comparison of Social Security and CalPERS 1959 Survivor Benefits
The following tables compare current Social Security survivor benefits with current benefit levels paid under the 1959 Survivor Program. Social Security Survivor Group Low Average High One Survivor $ 755 $ 1,139 $ 1,676 Two Survivors $ 1,510 $ 2,278 $ 3,352 Three Survivors $ 1,512 $ 2,798 $ 3,913
Unlike the 1959 Survivor Benefit (with the exception of the Indexed level), federal Social Security benefits normally receive an automatic cost-of-living adjustment every year. Also, unlike the 1959 Survivor Benefit, Social Security benefits are based on a worker’s actual earnings up to the maximum covered. The values shown assume death at age 45 (benefits slightly higher at lower ages, lower at higher ages), and steady earnings. “Low” is 2015 salary of $25,000, “Average” is $50,000, and “High” is $90,000. CalPERS 1959 Survivor Benefit Survivor Group
First
Second
Third
Fourth
Indexed2
Schools/ State 5th
One Survivor $ 180 $ 225 $ 350 $ 950 $ 686 $ 750 Two Survivors $ 360 $ 450 $ 700 $ 1,900 $ 1,373 $ 1,500 Three Survivors $ 430 $ 538 $ 840 $ 2,280 $ 2,059 $ 1,800
2 – Amounts effective January 1, 2016

CalPERS 1959 Survivor Benefit Program Actuarial Valuation – June 30, 2015
B-4
Summary of Plan Changes
Existing public agency employers joining the Public Agency 4th or Indexed Level Pool during the 2016-17 Fiscal Year are required to pay only the Unfunded Liability based on their own membership (amortized over a period of 5 years) which exists at the time they join plus the agency’s normal cost for all members at the new benefit level for the first five years. If they have excess assets, then they will be allowed to use as much of it as necessary to offset any increased liabilities incurred at the higher level and required employer premiums incurred at the higher level.

CalPERS 1959 Survivor Benefit Program Actuarial Valuation – June 30, 2015
C-1
Appendix C - Demographic and Experience Information Current and Deferred Beneficiaries – All Levels of the 1959 Survivor Program for Public Agencies, State and Schools Currently, there are 4,158 cases where liability exists. These cases include widows or widowers in deferred status even though presently there are no benefits being paid. There are 9 possible beneficiary combinations that can be associated with each case. The combinations presented below are given as of the date of the valuation, for all levels of the 1959 Survivor program. Status Number Percent Widow deferred 807 19.4% Widow only receiving 2,510 60.4% Widow with one child 325 7.8% Widow with two or more children 274 6.6% One child 159 3.8% Two children 53 1.3% Three or more children 19 0.5% One parent 11 0.3% Two parents 0 0.0% Totals 4,158 100.0%1 Beneficiary Combinations at Date of Death – All Levels of the 1959 Survivor Program for Public Agencies, State and Schools There exist 7,478 cases of death associated with the 1959 Survivor program since its inception where 1959 Survivor benefits became payable. With this data, a historical account of each combination can be made. Further, probabilities can be approximated with respect to these combinations when a member dies. Below is a list of all combinations on record, numbers and associated percentages as of the time of death, for all levels of the 1959 Survivor program. Status Number Percent Widow deferred 2,162 28.9% Widow only receiving 1,050 14.0% Widow with one child 1,235 16.5% Widow with two or more children 2,012 26.9% One child 439 5.9% Two children 339 4.5% Three or more children 214 2.9% One parent 24 0.3% Two parents 3 0.0% Totals 7,478 100.0%1 1 – Percentages may not sum to 100% due to rounding

CalPERS 1959 Survivor Benefit Program Actuarial Valuation – June 30, 2015
D-1
Appendix D - 1959 Survivor Deaths Per Year
1959 Survivor Deaths Per Year
Displayed on the following page is a year-by-year account of the number of deaths under the program since 1959 and the death rate each year since 1980 for public agencies, State, and Schools. The historic covered active counts are not available prior to 1980. Deaths given in the exhibit are on a calendar year basis. Counts represent mid-year active exposure. The historic covered active counts may not match those reported in the prior year’s valuation. This is due to the fact that in some cases there is a time gap between a member’s death and the determination of which type of death benefit that member will receive.

CalPERS 1959 Survivor Benefit Program Actuarial Valuation – June 30, 2015
D-2
Appendix D - continued 1959 Survivor Deaths Per Year
Death counts may change from previous valuations due mainly to reclassification of the benefit that ultimately gets paid to the beneficiary.
Calendar Mid-year Death Mid-year Death Mid-year Death Year Deaths Active Counts Rate Deaths Active Counts Rate Deaths Active Counts Rate
1959 2 * 1 * 1 *1960 2 * 65 * 10 *1961 1 * 79 * 10 *1962 8 * 61 * 15 *1963 12 * 49 * 9 *1964 14 * 62 * 14 *1965 18 * 76 * 8 *1966 25 * 60 * 5 *1967 39 * 66 * 12 *1968 20 * 79 * 9 *1969 35 * 86 * 12 *1970 39 * 72 * 10 *1971 37 * 66 * 11 *1972 46 * 67 * 10 *1973 52 * 70 * 13 *1974 53 * 66 * 5 *1975 56 * 89 * 11 *1976 52 * 67 * 3 *1977 57 * 67 * 18 *1978 71 * 91 * 13 *1979 56 * 81 * 7 *1980 60 * 81 * 6 *1981 72 54,354 0.13% 73 38,192 0.19% 10 7,843 0.13%1982 75 56,401 0.13% 79 37,030 0.21% 10 7,987 0.13%1983 77 59,917 0.13% 68 37,186 0.18% 8 7,685 0.10%1984 74 65,480 0.11% 63 38,488 0.16% 4 7,104 0.06%1985 68 66,927 0.10% 80 39,175 0.20% 5 6,842 0.07%1986 64 68,500 0.09% 40 39,391 0.10% 8 6,500 0.12%1987 60 69,340 0.09% 51 40,315 0.13% 11 6,200 0.18%1988 72 84,808 0.08% 50 41,980 0.12% 9 7,100 0.13%1989 66 82,046 0.08% 60 44,069 0.14% 6 6,899 0.09%1990 85 86,196 0.10% 59 45,502 0.13% 7 7,942 0.09%1991 95 91,574 0.10% 41 47,708 0.09% 7 7,752 0.09%1992 83 95,840 0.09% 45 48,872 0.09% 8 6,823 0.12%1993 74 97,752 0.08% 52 46,872 0.11% 3 6,776 0.04%1994 68 98,088 0.07% 56 47,323 0.12% 11 6,653 0.17%1995 72 99,235 0.07% 51 47,689 0.11% 10 6,751 0.15%1996 82 100,494 0.08% 53 51,746 0.10% 6 6,726 0.09%1997 69 102,475 0.07% 59 55,084 0.11% 4 6,794 0.06%1998 85 112,389 0.08% 57 55,435 0.10% 6 6,956 0.09%1999 90 118,850 0.08% 58 59,406 0.10% 3 7,444 0.04%2000 78 121,538 0.06% 57 60,349 0.09% 7 8,338 0.08%2001 83 116,161 0.07% 58 64,309 0.09% 5 7,884 0.06%2002 84 129,355 0.06% 47 65,558 0.07% 5 9,195 0.05%2003 91 129,620 0.07% 70 68,791 0.10% 6 9,390 0.06%2004 93 131,633 0.07% 59 64,252 0.09% 3 9,325 0.03%2005 101 133,510 0.08% 65 70,193 0.09% 7 9,402 0.07%2006 84 137,095 0.06% 68 71,742 0.09% 13 9,469 0.14%2007 104 140,012 0.07% 69 76,902 0.09% 5 10,131 0.05%2008 103 144,828 0.07% 50 81,369 0.06% 8 10,550 0.08%2009 97 143,207 0.07% 60 82,434 0.07% 7 10,562 0.07%2010 83 138,470 0.06% 54 79,587 0.07% 7 10,203 0.07%2011 108 134,255 0.08% 56 77,714 0.07% 7 9,811 0.07%2012 90 132,754 0.07% 50 71,759 0.07% 6 10,123 0.06%2013 77 129,796 0.06% 56 71,180 0.08% 4 9,944 0.04%2014 65 132,024 0.05% 53 72,848 0.07% 3 10,287 0.03%
Public Agency State School

CalPERS 1959 Survivor Benefit Program Actuarial Valuation – June 30, 2015
E-1
Appendix E - Glossary of Actuarial Terms Accrued Liability
The portion of the actuarial present value of projected benefits allocated to service before the valuation date in accordance with the actuarial cost method.
Actuarial Assumptions
Assumptions made about the occurrence of future events that will affect pension costs. Assumptions generally can be broken down into two categories: demographic and economic. Demographic assumptions include such things as mortality, disability and retirement rates. Economic assumptions include investment return, salary growth and inflation.
Actuarial Cost Method
A procedure employed by actuaries for the allocation of the actuarial present value of projected benefits to time periods, usually in the form of a normal cost and an actuarial accrued liability to achieve certain funding goals for a pension plan. Sometimes this is referred to as the “funding method.”
Actuarial Valuation
The determination, as of a valuation date, of the normal cost, actuarial accrued liability, actuarial value of assets and related actuarial present values for a pension plan.
Actuarial Value of Assets
The value of assets used for funding purposes. The actuarial value of assets has been set to equal the fair market value of assets for this System.
Amortization Period
The period of time used for determining the amount, timing, and pattern of recognition of contributions.
Normal Cost
The portion of the actuarial present value of projected benefits that is allocated to a period, typically twelve months, under the actuarial cost method. The normal cost may include a provision for expenses.
Pension Actuary
A person who is responsible for the calculations necessary to properly fund a pension plan.
Present Value of Benefits
Sometimes called the “actuarial present value of benefits,” the total dollars needed as of the valuation date to make future payments of all benefits, earned in the past or expected to be earned in the future, for current members by application of a particular set of actuarial assumptions.


![Accrued Interest en[1]](https://static.fdocuments.us/doc/165x107/577d231d1a28ab4e1e99053c/accrued-interest-en1.jpg)