19571105jec Fedexpenditure Long
22
WELFARE PROGRAMS AND ECONOMIC GROWTH AND STABILITY Clarence D. Long, professor of economics, and Selma Mushkin, re- search associate, School of Hygiene and Public Health and Depart- ment of Political Economy, Johns Hopkins University The present report is concerned with the relation of health, educa- tion, and social-security programs to long-term economic growth and economic stability. It is also concerned with the size and problems of financing welfare expenditures—present and prospective. L ong-T erm E conomic G rowth The social-welfare programs contribute to growth in a number of different ways. They help to improve the quality of living and en- hance economic well-being. They help to provide the scientific and managerial talent on which private investment depends for stimulus and support. They influence the numbers available for gainful em- ployment and the productivity of the work force. They generate need for a supporting volume of public investment and give stability to consumer markets. Each of these facets of the interrelation of social- welfare programs and economic growth is discussed briefly below. Economic well-being and growth Rapid economic development has been accepted as a goal. But men attach value not only to accumulation of goods but also to the purpose of that accumulation. Good health, education, and family security are essential parts of the quality of living and of the objec- tives of an expanding economy in a political democracy. In centuries past there has been economic growth and at the same time high mor- tality rates. There has been economic growth and high illiteracy rates. But once having reached a level of economic production which meets the basic necessities without long hours of work, the question of priorities between purchases of education and of health services, and of additional goods becomes a real one. Munoz-Marm, the Gov- ernor of Puerto Rico who has provided the leadership which has raised Puerto Rico from a slum to a symbol of progress, recently proposed an Operation Serenity through which society “would use its economic power increasingly for the extension of freedom, of knowl- edge, and of understanding imagination rather than a rapid multi- plication of wants.” 1 Operation Serenity deserves careful thought lest in the concern with economic growth, the purposes of economic growth are overlooked. 1 Quoted In Henry van Zile Hyde. Public Health and the Social Sciences. Public Health Reports, May 1957, p. 425. 1010 Digitized for FRASER http://fraser.stlouisfed.org/ Federal Reserve Bank of St. Louis
-
Upload
fraser-federal-reserve-archive -
Category
Documents
-
view
221 -
download
0
Transcript of 19571105jec Fedexpenditure Long

WELFARE PROGRAMS AND ECONOMIC GROWTH ANDSTABILITY
Clarence D. Long, professor of economics, and Selma Mushkin, research associate, School of Hygiene and Public Health and Department of Political Economy, Johns Hopkins University
The present report is concerned with the relation of health, education, and social-security programs to long-term economic growth and economic stability. I t is also concerned with the size and problems of financing welfare expenditures—present and prospective.
L ong-T erm E conomic G rowth
The social-welfare programs contribute to growth in a number of different ways. They help to improve the quality of living and enhance economic well-being. They help to provide the scientific and managerial talent on which private investment depends for stimulus and support. They influence the numbers available for gainful employment and the productivity of the work force. They generate need for a supporting volume of public investment and give stability to consumer markets. Each of these facets of the interrelation of social- welfare programs and economic growth is discussed briefly below.Economic well-being and growth
Rapid economic development has been accepted as a goal. But men attach value not only to accumulation of goods but also to the purpose of that accumulation. Good health, education, and family security are essential parts of the quality of living and of the objectives of an expanding economy in a political democracy. In centuries past there has been economic growth and at the same time high mortality rates. There has been economic growth and high illiteracy rates. But once having reached a level of economic production which meets the basic necessities without long hours of work, the question of priorities between purchases of education and of health services, and of additional goods becomes a real one. Munoz-Marm, the Governor of Puerto Rico who has provided the leadership which has raised Puerto Rico from a slum to a symbol of progress, recently proposed an Operation Serenity through which society “would use its economic power increasingly for the extension of freedom, of knowledge, and of understanding imagination rather than a rapid multiplication of wants.” 1 Operation Serenity deserves careful thought lest in the concern with economic growth, the purposes of economic growth are overlooked.
1 Q uoted In H enry van Zile Hyde. Public H ealth an d th e Social Sciences. P ub lic H ea lth R eports, May 1957, p. 425.
1010
Digitized for FRASER http://fraser.stlouisfed.org/ Federal Reserve Bank of St. Louis

ECONOMIC GROWTH AND STABILITY 1011
The time for basic decisions on these priorities may have been some years ago. However, decisions on welfare spending—notably in education—have been made not in the market but in the political arena of legislative decision. Decisions on health programs have waited, in large part, on the progress of medicine, that is, on achieving effective therapies for specific diseases. Our present ordering of priorities may be illustrated in many ways. Prof. Alvin Hansen has put it this way:
Quality and social priorities at long last must concern us or perish in the midst of material plenty. Just now we are starving our schools while we race up and down 6-, 8-, and 10-lane highways in ever newer and longer cars.2
We turn out chrome-finish refrigerators, dishwashing machines, dryers, home air conditioners, self-rolling vacuum cleaners to improve family living, yet preventable childhood illness and infant deaths still occur, and appropriations for maternal and child health services are restricted.
There seems to be little doubt that better criteria are needed to determine priorities in the public and private spheres so that a more balanced set of social priorities can be attained. New institutional approaches may be required, calling for the inventive skills of the political scientists, sociologists, and economists working jointly to this end.Growth of private investment
Levels of education, health, and social security not only are implicit components of a standard of living but they are means to economic growth and to prevention of public dependency. One important way the social-welfare programs contribute to economic growth is by financing the education and training of scientific and managerial manpower.
Scientific advance and invention are increasingly recognized as important supports for new private investment—the investment required to produce increased material goods. Progress in science and invention, in turn, depends upon our national pool of scientific talent. Current concern about a shortage of engineering and scientific personnel, about the inadequacies of education in mathematics and the sciences in the public-school system, and about the qualified young people who are not attending college grows out of the dramatic achievements in applied science in the past decade. Governmental research and development programs for military purposes more than doubled after the Korean conflict, and further increases are projected with the emphasis on nuclear weapons, guided missiles, and high-speed aircraft. In industry, research and development activity has grown rapidly and, as a concomitant, there has been rapid obsolescence of existing products and development of new products. The new products require retooling and new installations and because of the greater technical complexity of products and production methods, new demands are created for engineers and scientifically or technically trained personnel.
2 Alvin H. H ansen. S ta tem en t in Federal T ax Policy fo r Economic G row th and S tability . Subcom m ittee on T ax Policy of the Jo in t Com m ittee on th e Economic Report, 84th Cong., 1st sess., 1956.
Digitized for FRASER http://fraser.stlouisfed.org/ Federal Reserve Bank of St. Louis

1012 ECONOMIC GROWTH AND STABILITY
Partly in response to labor-market conditions and prospective earnings scale, and to GI and other educational aids, and partly in response to higher family income levels, there has been a considerable increase in the proportion of persons of college age attending college. College enrollments increased from about 1.4 million at the beginning of the school year 1939 to almost 3 million the beginning of the school year 1956. The number of 18-year-olds in the population in 1957, however, was less than the number of same age in 1940. During this time period, the population increased by 39 million.3 The low number of additional young entrants into the labor force reflects the depression birthrate. I t is from this present relatively small manpower pool that immediate needs for additional professional, scientific, and technical leadership must come, as well as other trained personnel.
To provide the scientific manpower required for economic growth and to make maximum use of intellectual resources curriculums will have to be enlarged, the supply of trained teachers will have to be increased, and there will have to be additional opportunities for college training and advanced degrees.Labor force ancl 'productivity
A second important contribution of social welfare programs to economic growth results from their impact on the size of the effective work force and on productivity. For centuries, economic and political theorists have emphasized the cost to society of premature death. In 1835, Quetelet, a Belgian mathematician, wrote:
In his early years, man lives at the expense of society; he contracts a debt which he must one day discharge; and if he dies before he has succeeded in doing so, his life will have been a burden rather than a benefit to his fellow citizens * * *.4
Measures directed to reduce losses in productive capacity through premature death and disability essentially require no elaboration as a part of governmental policy for economic growth.
Between 1900 and 1917, the overall age-adjusted death rates decreased at 1.074 percent per annum, a higher rate of decrease than in the subsequent period from 1921-37. The decline in the first part of the century is largely attributable to environmental public health expenditures. Through these expenditures diseases such as typhoid, diarrhea, and dysentery, commonly transmitted by water, milk, food, and by insects, were controlled by public-health programs.
Between 1938 and 1950 the average rate of decline in mortality was more than twice that of the first part of the century. Acceleration in reduction of mortality starting about 1938 is attributable mainly to the dramatic use of the new drugs in treatment of conditions involving infections. As the National Office of Vital Statistics concluded in its analysis of mortality reports:
The increasing availability and use of these new therapeutic products have all but closed the history of many infectious diseases as causes of death.5
3 Testim ony of R alph C. M. F lyn t, D irector of H igher E ducation P rog ram s B ranch, Office of E ducation before Subcom m ittee on Special E ducation , U. S. House of R epresen tatives, Com m ittee on E ducation and Labor, A ugust 12, 1957, pp. 5, 6.
4 Quoted in Ren6 Sand. T he A dvance to Social Medicine. S tap les Press, 1952, p. 584.5 N ational Office of V ital S ta tis tic s . V ita l S ta tis tic s of th e U nited S ta tes, 1950, vol. 1,
p. 169.Digitized for FRASER http://fraser.stlouisfed.org/ Federal Reserve Bank of St. Louis

ECONOMIC GROWTH AND STABILITY 1013
W hat have these gains meant for labor force participation and production ? Reduced death rates have resulted in a decline in separations from the labor force at all ages up to age 65. Despite the marked delay in entry into the labor force by young people, and the earlier exit from the labor force by those in the older age groups, the male worker today puts in many more years of work than did his counterpart 50 years ago.
These achievements can be traced to a wide variety of factors, paramount among which is the series of technological advances which resulted in the great productivity increases we have witnessed in the past 50 years. But it is difficult to see how these factors would have operated without the two long-term trends we have described above; that is, without the manpower potential of our population at least approximately keeping pace with the other factors of growth.6
The improvement in health status reflected in lower mortality has been one of a complex of factors facilitating the employment of women, especially of women with children.
Improved health status also leads to an increase in effective labor force participation by reducing the manpower force required to meet the contingency of absenteeism. Illness of the employee or his family is an important cause of absence from work, and reduction in such absences is reflected in improved efficiency and in reduced work-foreo requirements. Elimination of such absences would be the equivalent of the addition of at least 1.3 million workers to the labor force.7
Industrial advance and urbanization have been accompanied by a twofold change in occupational patterns and skills which direct attention to the public education system.s On the one hand it has enhanced the importance of skills and of specialists in the sciences, engineering and related technical fields. On the other hand, new production techniques both in industry and agriculture have for some groups of workers meant a depreciation, a downgrading, and a dividing of skills, and old skills have become redundant.
Both types of occupational change suggest greater emphasis on educational and related services and as a consequence, higher public expenditures. As indicated earlier, the increased need for professional workers and technicians requires more advanced training for a larger number of people. Increasing mechanization and the growing diffusion of automatic or semiautomatic, multipurpose and high-precision machines require retraining opportunities, counseling services, and financial aids to facilitate new training and mobility within a community and necessary movement to new areas when “uprooting” occurs.
The strategic political and economic role in our society of the educational system leads to concern not only with advanced education
6 Seymour L. W olfbein. The Length of W orking Life. D ivision of M anpower and Employm ent, D epartm ent of Labor. Ju ly 1957, pp. 5, 8 (processed).
7 E stim ated from d a ta presented in George W. Bachm an & Associates. H ealth Resources in the U nited S ta tes. The Brookings In s titu tio n , 1952, p. 273.
8 The price of illite racy and ignorance is high, especially in a society in w hich th e basic concept is th a t of self-governm ent and w hich depends upon an educated citizenry to use th a t system of governm ent and m ake the selections and choices presum ed. Economic m otivation and enterprise , m oreover, require a system of un iversal education to offer grea ter equality of opportun ity and flexibility of m ovem ent in th e labor force.
Digitized for FRASER http://fraser.stlouisfed.org/ Federal Reserve Bank of St. Louis

1014 ECONOMIC GROWTH AND STABILITY
and vocational training but with the education program basic to these. Deficiencies in elementary and secondary school facilities and in funds to attract necessary teaching staffs pose urgent problems for communities and the Nation.
Thus far the discusison has dealt largely with aggregate numbers in the work force and rates of production. Education and health services and supporting income maintenance programs such as the program of aid to dependent children and the survivors insurance can help to improve the productive capacity of the low-income groups and at the same time contribute toward the elimination of poverty and future public delinquency.
Educational attainment is one of the most important factors determining occupational and income status. The 1950 census data, for example, indicate a progressive increase in the average income with increased education. Average annual income in 1949 of men 45 to 54 years of age who had no elementary schooling was $1,588; it was $3,112 for those who completed elementary school and $4,519 for those who completed high school. Average income of college graduates was $3,388 above the average for high-school graduates.9 Thus, investment in education appears to pay substantial dividends in earning power required for self-support.
The interrelationships between income and health status are difficult to disentangle. Some of the infectious diseases, like tuberculosis and rheumatic fever, have been closely identified with poor housing conditions and low income. Low income may be associated with neglect of conditions requiring medical attention. Low income also may be the result of illness of the primary wage earner or of interruption of earnings due to sickness of other family members. Sufficient experience has been accumulated in the administration of the public- assistance programs to suggest that illness is an important factor in public dependency. Dependency of between one-fourth and one-third of the 6 million persons receiving public assistance is attributable at least in part to illness. Expanded efforts to prevent illness, to provide early access to medical care, to improve disease therapy and rehabilitation services would reduce the long-run burden of illness on public resources. At the same time, these efforts would increase the effective work force.Public investment
A third way in which the social welfare programs contribute to economic growth is by generating public investment opportunities.
Approximately one-third of new public works construction has been for health and educational facilities, including in the health category sewer and water facilities. Wartime curtailment of public construction, postwar population increases, and technological changes in the physical facilities associated with altered public services created large deficits in building needs. Hospital and health facility requirements are in the magnitude of $12 billion; expenditures required for waste- treatment works, both public and industrial, are estimated at about $10 billion; to meet the existing deficit in elementary and secondary school facilities would call for about $6 billion in construction out
8 P au l C. Glick an d H erm an P . M iller, E ducational Level an d P o te n tia l Income, A m erican Sociological Review, Ju n e 1956.
Digitized for FRASER http://fraser.stlouisfed.org/ Federal Reserve Bank of St. Louis

lays. Education, health, and water facilities support public functions in these areas but they also are important to private plant location, as even a summary review of industrial location surveys emphasizes.
Federal support of facilities for education and health services has a direct bearing on the capacity to provide services. First, support of needed construction releases for current operation some funds which otherwise would go into buildings. Second, public aid for construction provides a stimulus to private giving to charitable educational and health agencies. Concern about National Government controls and interference has often directed national program proposals into support of brick-and-mortar programs rather than support of teaching staffs or hospital operation. However, services and facilities and their financing are patently interrelated.
Decision on timing of public works involve not only the acceleration or postponement of public works in the light of private investment activity but also the timing and priorities of various types of public works and the relative urgency of a public facility as a part of a service program. Should new highways be built now, and schools later ? Should the costs of cleaning up polluted waters be left to a future generation as this one bears the burden of a depression and wartime backlog of construction needs in education ? Should construction of educational facilities associated with research and scientific manpower take precedence over basic education ?Consumer markets and growth
A fourth way the social welfare programs contribute to economic growth is by enhancing the stability of consumer income and improving the equity of its distribution. Welfare expenditures are essentially redistributive outlays which tend to reduce inequities in command over goods and services. While redistribution has not been pursued as a positive policy, there is a redistributive effect which follows from the selection of the beneficiary groups, the limitation of payments and services to needy groups, and from the characteristic distribution of economic risks and of population by income groups.
The social-insurance payments go to those who have suffered a reduction in income due to retirement, death, disability, or unemployment of the primary wage earner. Public-assistance payments are conditioned on the meeting of a needs test. While not all health services have an income qualification, public services are more attractive to those who cannot afford any others, and most expenditures are made for services subject to a need or medical indigency standard. Veterans’ benefits are more attractive to those in the lower income groups, and non-service-connected payments and medical benefits are restricted to those who meet an income test.10
The net redistributive effect, however, depends not only on the income status of beneficiaries but also upon the distributive impact of taxes levied to finance the programs. Several studies have been made of the redistributive effects of total budgetary income and outgo.11 These several studies indicate that, on balance, the total
10 H ow ard G. Schaller, V eterans T ran sfe r Paym ents and S ta te P e r C apita Incomes, 1929, 1939, and 1949, Review of Economics and S ta tistics , November 1953, pp. 325-332.
11 A lfred H . Conrad, T he M ultip lier Effects of R edistributive Public Budgets, Review of Economics and S ta tis tics , May 1955, pp. 160-173; see also A. H. Conrad, R edistribu tion T hrough Governm ent B udgets in th e U nited S ta tes, 1950, in Incom e R edistribu tion and Social Policy (A lan T. Peacock, ed .), London, 1954, pp. 178-261; see also Jo h n H. A dler and Eugene R. Schlesinger, The F isca l System, th e D istribu tion of Income, an d Public W elfare, in F isca l Policies and th e Am erican Economy (K enyon Poole, ed.)» 1951.
ECONOMIC GROWTH AND STABILITY 1015
Digitized for FRASER http://fraser.stlouisfed.org/ Federal Reserve Bank of St. Louis
1016 ECONOMIC GROWTH AND STABILITY
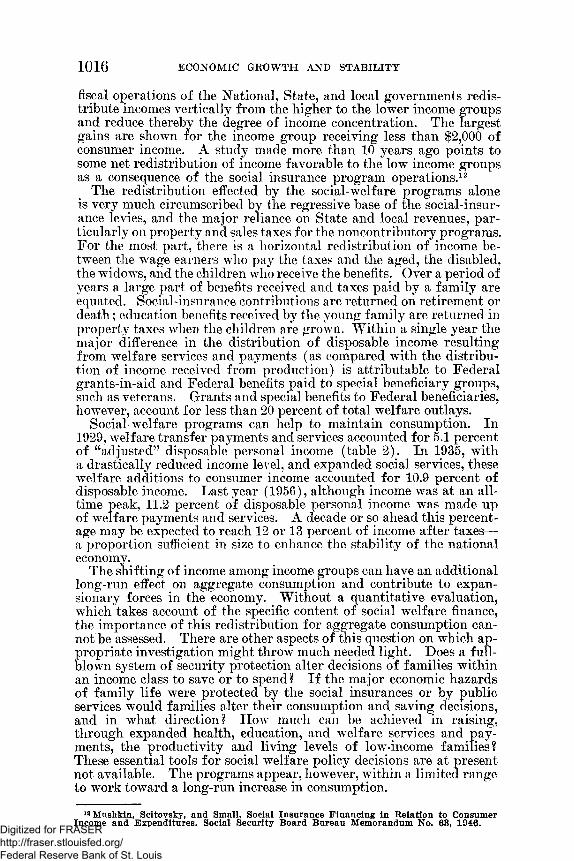
fiscal operations of the National, State, and local governments redistribute incomes vertically from the higher to the lower income groups and reduce thereby the degree of income concentration. The largest gains are shown for the income group receiving less than $2,000 of consumer income. A study made more than 10 years ago points to some net redistribution of income favorable to the low income groups as a consequence of the social insurance program operations.12
The redistribution effected by the social-welfare programs alone is very much circumscribed by the regressive base of the social-insurance levies, and the major reliance on State and local revenues, particularly on property and sales taxes for the noncontributory programs. For the most part, there is a horizontal redistribution of income between the wage earners who pay the taxes and the aged, the disabled, the widows, and the children who receive the benefits. Over a period of years a large part of benefits received and taxes paid by a family are equated. Social-insurance contributions are returned on retirement or death; education benefits received by the young family are returned in property taxes when the children are grown. W ithin a single year the major difference in the distribution of disposable income resulting from welfare services and payments (as compared with the distribution of income received from production) is attributable to Federal grants-in-aid and Federal benefits paid to special beneficiary groups, such as veterans. Grants and special benefits to Federal beneficiaries, however, account for less than 20 percent of total welfare outlays.
Social-welfare programs can help to maintain consumption. In 1929, welfare transfer payments and services accounted for 5.1 percent of “adjusted” disposable personal income (table 2). In 1935, with a drastically reduced income level, and expanded social services, these welfare additions to consumer income accounted for 10.9 percent of disposable income. Last year (1956), although income was at an alltime peak, 11.2 percent of disposable personal income was made up of welfare payments and services. A decade or so ahead this percentage may be expected to reach 12 or 13 percent of income after taxes— a proportion sufficient in size to enhance the stability of the national economy.
The shifting of income among income groups can have an additional long-run effect on aggregate consumption and contribute to expansionary forces in the economy. Without a quantitative evaluation, which takes account of the specific content of social welfare finance, the importance of this redistribution for aggregate consumption cannot be assessed. There are other aspects of this question on which appropriate investigation might throw much needed light. Does a fullblown system of security protection alter decisions of families within an income class to save or to spend? I f the major economic hazards of family life were protected by the social insurances or by public services would families alter their consumption and saving decisions, and in what direction? How much can be achieved in raising, through expanded health, education, and welfare services and payments, the productivity and living levels of low-income families? These essential tools for social welfare policy decisions are at present not available. The programs appear, however, within a limited range to work toward a long-run increase in consumption.
u M ushkin, Scltovsky, and Small, Social In su ran ce F inan c in g In R ela tion to Consum er Incom e and E xpenditures. Social Security Board B ureau M em orandum No. 63, 1946.
Digitized for FRASER http://fraser.stlouisfed.org/ Federal Reserve Bank of St. Louis

ECONOMIC GROWTH AND STABILITY 1017
Tax burdensThe potential contribution of health, education, and social-security
programs to economic growth has to be assessed against the tax load required to finance these programs and the damper on national growth which the tax burdens may represent. There is a vital choice to be made between tax reduction and added government programs, between leaving money in the pockets of individuals and corporations for disbursement in such directions as they deem best, or for public direction of these funds into governmental activities through the compulsion of taxation. The balancing of forces of growth germinated by welfare programs against the deterrents to growth set off by tax requirements is only one ratio which must be drawn from the profit and loss statement.13
Not all welfare programs contribute directly to economic growth. Education is not concerned exclusively with work-force skills, with inventiveness and scientific advance; it is concerned too with transmitting our cultural traditions, with elevating man, with broadening horizons. A large share of the National, State, and local health dollar goes to finance services for the chronically ill, many of whom will make no further contribution to production. More than 2.5 million of the public-assistance caseload is made up of old-age-assistance recipients; and half of these assistance recipients are at least 75 years of age.14 There are now about 14.5 million persons aged 65 and over in the United States. The number of aged is expected at least to double within a 40-year period.15 With the increases in the number of aged, the number of persons eligible for retirement benefits under the old-age and survivors' insurance program and other retirement systems will rise. The percentage increase in beneficiaries will be even more steep since benefits are largely deferred rights which accumulate over a long period of time. As of May 1957 over 10 million persons were receiving old-age and survivors’ insurance benefits; some 8.5 million of these were aged 65 and over.
I t has been stated earlier that in a society struggling for subsistence, prolonged educational training, voluntary retirement, and extensive welfare services are not possible. But in a high level economy capable of producing the wide variety of consumer goods which we have come to accept as our standard of living, the choices are of a different order. One type of choice is between (a) added economic output, (b) more leisure hours for the worker, and (c ) added improvements in welfare services and income. In the decades ahead, the choice may be between how quickly we move to a 30-liour week or how fast toward meeting- human needs more adequately.
When the 1935 Social Security Act was under discussion, emphasis was placed on preventive rather than ameliorative measures. The emphasis has continued to be on preventing public dependency and dealing with causes of dependency. To reduce the weight on public funds funds of preventable illness (physical and mental) and of preventable illiteracy and poor education, to restore larger numbers
13 See discussion of th is issue in Eveline M. Burns, Social Security and Public Policy. M cGraw-Hill Book Co., 1956, ch. 14.
11 F ra n k J . H anm er, R ecipients of Old-Age A ssistance : Personal and Social C harac te ristics. Social Security B ulletin , A pril 1957, pp. 3-13.
15 T. N. E. G reville, I llu s tra tiv e U nited S ta tes P opulation P rojections. Social Security A dm inistration , A ctuaria l S tudy No. 46, May 1957, p. 23. ‘
Digitized for FRASER http://fraser.stlouisfed.org/ Federal Reserve Bank of St. Louis
1018 ECONOMIC GROWTH AND STABILITY
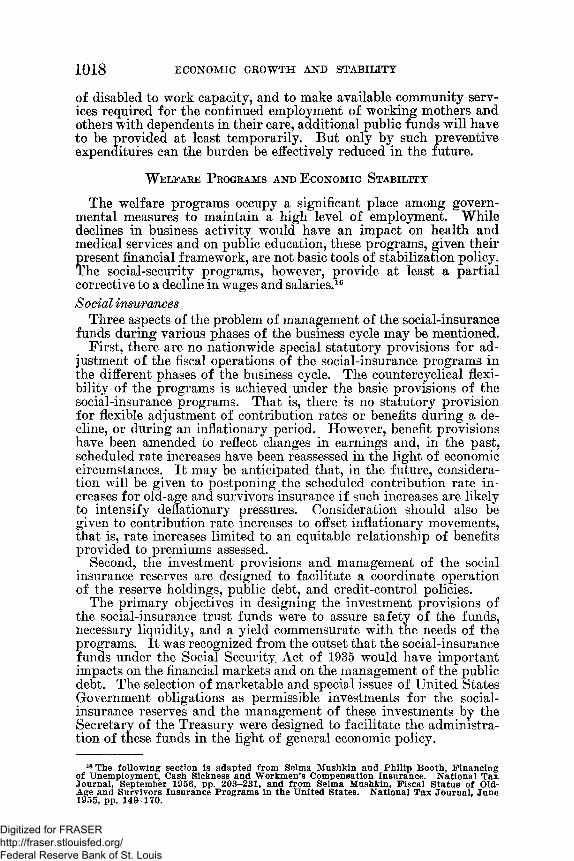
of disabled to work capacity, and to make available community services required for the continued employment of working mothers and others with dependents in their care, additional public funds will have to be provided at least temporarily. But only by such preventive expenditures can the burden be effectively reduced in the future.
W e l f a r e P r o g r a m s a n d E c o n o m i c S t a b i l i t y
The welfare programs occupy a significant place among governmental measures to maintain a high level of employment. While declines in business activity would have an impact on health and medical services and on public education, these programs, given their present financial framework, are not basic tools of stabilization policy. The social-security programs, however, provide at least a partial corrective to a decline in wages and salaries.16Social insurances
Three aspects of the problem of management of the social-insurance funds during various phases of the business cycle may be mentioned.
First, there are no nationwide special statutory provisions for adjustment of the fiscal operations of the social-insurance programs in the different phases of the business cycle. The countercyclical flexibility of the programs is achieved under the basic provisions of the social-insurance programs. That is, there is no statutory provision for flexible adjustment of contribution rates or benefits during a decline, or during an inflationary period. However, benefit provisions have been amended to reflect changes in earnings and, in the past, scheduled rate increases have been reassessed in the light of economic circumstances. I t may be anticipated that, in the future, consideration will be given to postponing the scheduled contribution rate increases for old-age and survivors insurance if such increases are likely to intensify deflationary pressures. Consideration should also be given to contribution rate increases to offset inflationary movements, that is, rate increases limited to an equitable relationship of benefits provided to premiums assessed.
Second, the investment provisions and management of the social insurance reserves are designed to facilitate a coordinate operation of the reserve holdings, public debt, and credit-control policies.
The primary objectives in designing the investment provisions of the social-insurance trust funds were to assure safety of the funds, necessary liquidity, and a yield commensurate with the needs of the programs. I t was recognized from the outset that the social-insurance funds under the Social Security, Act of 1935 would have important impacts on the financial markets and on the management of the public debt. The selection of marketable and special issues of United States Government obligations as permissible investments for the social- insurance reserves and the management of these investments by the Secretary of the Treasury were designed to facilitate the administration of these funds in the light of general economic policy.
10 The follow ing section is adap ted from Selma M ushkin and P h ilip Booth, F inancing of Unem ploym ent, Cash Sickness and W orkm en’s Com pensation Insurance. N ational Tax Jo u rn a l, Septem ber 1956, pp. 203-231, an d from Selm a M ushkin, F isca l S ta tu s of Old- Age and S urvivors In su rance P rog ram s In th e U nited S ta tes. N ational T ax Jo u rn a l, Ju n e 1955, pp. 149-170.
Digitized for FRASER http://fraser.stlouisfed.org/ Federal Reserve Bank of St. Louis

ECONOMIC GROWTH AND STABILITY 1019
The various Government investment accounts, at least potentially, provide the Treasury with authority and resources for maintaining stability in the Government bond market and with an important instrument of economic and fiscal policy. As the Secretary of the Treasury indicated in his 1949 report:
Beginning in the spring of 1947, the Treasury took action to control an incipient boom in the Government bond market—by selling long-term bonds from some of the Government investment accounts, by offering the investment series of bonds to institution investors, and by increasing short-term interest rates. All of these operations combined to take upward pressures off the market. When conditions changed, and a downward pressure on bond prices developed, the market was stabilized through purchases of long-term bonds.17
W ith relatively minor exceptions, in terms of volume of market transactions, the Government investment accounts used for market stabilization purposes were not trust funds such as the social insurance trust funds. Holdings of social insurance trust funds and other similar trust funds in which moneys are held in trustee capacity by the Treasury for the benefit of covered employees or States are not considered suitable at present for market operations.
Third, under basic laws, the social-insurance programs tend to compensate for changes in other sectors of the economy. The financial operations of the combined social-insurance programs furthered the general anti-inflationary economic program of the administration during World W ar II , the Korean conflict and in the years following. In the fiscal year 1956, for example, a toal of $2.5 billion was added to reserve investment holdings of Federal trust accounts. The old- age and survivors insurance trust fund accounted for $1.5 billion, or 58 percent of the total.18 The increments to these reserves, largely financed from the excess of payroll taxes, aided in reducing the inflationary pressures of high demand.
Temporarily, additions to the old-age and survivors insurance trust fund have been curtailed. In recent months, the rate of benefit disbursements has exceeded the rate of contribution income. Unless action is taken to advance the scheduled stepup from 1960 to an earlier date net payments to the public rather than net receipts from the public to this fund may be anticipated. While long-range financial stability of the old-age and survivors insurance system does not require an acceleration of the contribution time schedule, the need for new measures to combat inflationary forces may suggest such action.
During a period of downswing, particularly in the early phases of decline, the social-insurance programs work automatically as compensatory economic devices. I t is estimated, for example, that a decline of 10 percent in employment would lead to a rise of approximately 5 to 10 percent or about 300 to 600 million dollars in old-age and survivors insurance benefits, at present disbursement levels. A decline in employment opportunities for the aged would increase the number of eligible persons who are forced into retirement and who would
17 A m ore recen t s ta tem en t of the T reasury policy regarding investing Governm ent accounts is contained in the rep o rt of th e C om ptroller G eneral of th e U nited S ta tes on th e P o sta l Savings System , tran sm itted to th e Congress on November 4, 1954.
18 S ecretary of th e T reasury . A nnual R eport on the S ta te of the F inances fo r the fiscal year ended Ju n e 30, 1956, p. 367.
Digitized for FRASER http://fraser.stlouisfed.org/ Federal Reserve Bank of St. Louis

1020 ECONOMIC GROWTH AND STABILITY
apply for old-age benefits. A t present, about 25 percent of persons aged 65 and over who have insured status under the program have chosen to remain in active employment and are not drawing benefits.19
The countercyclical adjustments of social-insurance programs are further augmented by the responsiveness of contributions to changes in employment and earnings. Contributions which are geared to payrolls and earnings quickly reflect changes in these payrolls. A 10- percent decline in earnings would tend to be reflected in a somewhat smaller percentage decline in taxable earnings within the $4,200 maximum, and in tax collections.
Although the unemployment-insurance program was adopted during the depression of the thirties, when the problems of widespread unemployment and depressed economic activity were sharply before the Nation, the program was designed as a partially corrective measure. A t the time the program was developed, proponents of unemployment insurance were divided sharply into those who emphasized the purpose of stabilization of employment through employer incentives and those who emphasized the purpose of mitigating the hardships of the unemployed and of maintaining buying power by an adequate benefit structure. Experience rating (with its variation of rates from employer to employer) emerged from the emphasis on employer incentive toward stabilization; these rate variations have had a continuing effect on program development. Emphasis on employer incentives also has facilitated the integration of guaranteed annual wage plans with the unemployment benefit structure. In creasingly, however, attention has been directed to the adequacy of benefits and the effects of these payments on consumption expenditures.
Several factors have contributed to the recently increased general concern with benefit adequacy. The Social Security Act of 1935 contemplated unemployment benefits at 50 percent of current wages. Benefits have failed to keep pace with changing levels of gross national output and earnings, despite liberalizations under State laws. For 4 consecutive years, the Council of Economic Advisers in its reports to the President has urged States to increase benefits so that the great majority of the beneficiaries will be eligible for payments “that at least equal half their regular earnings.”
Despite growing disparity between average wage levels and unemployment benefits, the unemployment-insurance program contributed toward easing the toll of economic transition. During four periods in the past decade and a half, the changes in the volume and amount of unemployment benefits have clearly demonstrated the usefulness of the program in stabilizing consumption. In the tooling up from peacetime activity to war production during the early 1940’s, in the transition in 1946 to civilian production, and again in the postwar industrial readjustments of 1949 and 1954, the unemployment insurance system evidenced its responsiveness to changes in employment opportunities. During the 6 months from April through September 1954, benefit payments were $1.1 billion compared with $0.4 billion in the corresponding months of 1953. The contribution of the program toward easing the effects of production retooling and setbacks
19 B ureau of Old-Age and S urvivors Insurance . Q uarterly Sum m ary of E arn ings, E m ploym ent and Benefit D ata , A ugust 1957, p. 12.
Digitized for FRASER http://fraser.stlouisfed.org/ Federal Reserve Bank of St. Louis

also served to underscore the weaknesses in the benefit structure—■ weaknesses not only in benefit amounts but also in duration and in coverage—which reduced the compensatory economic effects of the program.
The potentially compensatory effects of the program have also been offset somewhat by the fact that under experience rating operations, tax rates have tended to rise in periods of increased benefit expenditure and to decline in prosperous years. Increased attention to the need for correcting this weakness in the tax structure has led a few States to adopt tax schedules designed to provide a uniform annual yield expressed as a percentage of wages. This device merely prevents tax rate changes from accentuating business cycle movements but it does not actually counter such movements. The 1956 action by Congress setting up a loan fund for States whose employment insurance reserves are in danger of exhaustion provides some additional safeguards to States in their attempt to improve the cyclical movement of contributions.
Studies of the economic effects of the unemployment insurance program have served to define different ways of measuring compensation for wage loss and to clarify their uses. A t least two yardsticks need to be distinguished: 20 the proportion of income loss of individual workers and their families which is compensated; and the net change in national disposable income (taking account of the net change m benefit outlays and earnings). Various studies of the offset to income loss suggest that, in a period of downturn of fairly short duration such as the 1948-50 downswing, unemployment benefits amount to one-quarter or one-fifth of the net income loss. The difference between compensation for an individual worker’s income loss and compensation for the economy as a whole is suggested perhaps most sharply by the potential financial operation of the program after a period of prolonged downswing. I f the period of decline depresses wage rates, benefits paid to eligible unemployed workers may be expected to be a proportionately higher percent of their wages. However, an increasing number of unemployed workers would have lost eligibility for benefits which is based on recent attachment to the covered labor m arket; those qualifying for benefits would in increasing numbers exhaust their rights to benefits,21 and the total benefit disbursements in a 12-month period might in fact be reduced despite a continuing rise in the volume of unemployment. The net effect as compared with a previous period may be a negative—rather than a positive—addition to income.22
Depression experience with workmen's compensation payments points up the different meanings of compensation for wage loss. Weekly maximum benefits for an Illinois worker with one child were almost 85 percent of average weekly earnings in 1933 as compared
ECONOMIC GROWTH AND STABILITY 1021
20 See M arvin K. Bloom. M easuring th e Effect of Unem ploym ent Benefits on the Economy. Research Council fo r Economic Security publication No. 102 fo r a description of various m ethods of m easurem ent.
21 In 37 S ta tes, du ra tio n of benefits varies w ith th e w orker’s earn ings o r employment experience (or both) in th e base period used fo r determ ining h is benefit r igh ts . I f he had considerable unem ploym ent in th e base period, h is weeks of benefits in the nex t yearwould be correspondingly reduced, th u s increasing th e likelihood th a t if again unemployed, he would exhaust h is benefit r ig h ts before getting an o th er job.
23 The upw ard ad ju s tm en t of em ployer tax ra te s coupled w ith cyclical changes in tax sh ifting would appear to reinforce th is effect.
97735—57------66Digitized for FRASER http://fraser.stlouisfed.org/ Federal Reserve Bank of St. Louis

1022 ECONOMIC GROWTH AND STABILITY
with a range of about 50 to 55 percent during the 1920’s and even lower percentages during the early 1940’s.23 Accidents for which compensation was received were relatively few because of the low level of employment and the retention of only the best workers. In West Virginia, with an exclusive State fund program, total accidents in 1932-33 among insured workers were at about two-thirds the 1928-29 number. Total benefit disbursements amounted to $3.8 million in 1933 as compared with $4.8 million in 1929. I t is important to note that low levels of earnings and employment necessitated premium adjustments in many State workmen’s compensation programs during the depression. In their recent volume of workmen’s compensation, the Somers have pointed out th a t:
Prosperity has meant low (premium) rates, depression high rates. * * * Throughout the forties rate reductions were general and substantial, reflecting the vast increase in payrolls, the relative inelasticity of benefit maximums against rising wage levels, and the development of other social- security programs which have, in part, taken the pressure off workmen’s compensation.24
Despite upward rate adjustments during the depression, disbursements for benefits exceeded premium payments in some States at least.
An important step forward in understanding the economic operation of the program has been taken through the recent initiation of studies of income and consumption patterns of beneficiaries under the unemployment-insurance program in selected communities.25 A start has been made in the case of the unemployment-insurance program to evaluate the cyclical response patterns of the social insurances. Similar studies are needed in the case of the other social-insurance programs.Public assistance
The public-assistance programs backstop the social-insurance benefits by providing income maintenance for those in need, for those who have exhausted their unemployment benefit rights, and for those whose social-insurance benefits in addition to other income resources fall below the standards of asisstance. W ithin narrow limits, the public- assistance caseload may be expected to vary with changes in unemployment level as long as the open-end grants are maintained. Federal participation depends upon the size of the program in the States as determined by the numbers of needy persons in the federally aided categories; however, it also depends upon the amount of State and local funds devoted to the assistance programs. While under present Federal grant-in-aid provisions there may be some automatic increase in the proportion of financing out of Federal funds, the increase in the Federal share is contingent on a reduction in average payments under the pressure of an increased number of claimants and of declining State and local revenues.
Repeatedly the imbalance between development of general assistance provisions and of the growth of federally aided categories has been
23 H erm an Miles Somers and A nne Ram say Somers, W orkm en’s Com pensation, P revention , Insurance , and R ehab ilita tion of O ccupational D isability , Jo h n Wiley & Sons, Inc., 1954, p. 78.
“ Ibid., p. 114.® P h ilip B ooth, R ecent S tudies of Benefit Adequacy, paper p resen ted a t an n u a l m eet
ing of A m erican S ta tis tic a l Association, New York C ity, December 27, 1955.Digitized for FRASER http://fraser.stlouisfed.org/ Federal Reserve Bank of St. Louis
ECONOMIC GROWTH AND STABILITY 1023
pointed out. The majority report to the Commission on Intergovernmental Relations of the Study Committee Report on Federal Aid to Welfare urged abandonment of the categorical approach and substitution of a single Federal grant for public assistance to the needy.
A single Federal grant program for all State and local welfare will encourage States to give attention to the needs of all needy persons. The present arrangement of Federal aid for several rather narrowly defined programs means that help to needy persons or families ineligible for assistance under these programs may be, and frequently is, much less than that provided to those qualifying for federally aided public assistance.26
I t is the general assistance program which is the most sensitive to economic changes. During the post-World W ar I I industrial readjustment which occurred in the first part of 1949, for example, the general assistance caseload rose 20 percent.
As long as the present State-Federal, local-State fiscal arrangements for grant-in-aid purposes continue in force, a solution to the problem of maintaining welfare expenditures for the four aid categories and of meeting increased general assistance caseloads in the face of shrinking State and local revenues will wait on emergency action.Health and education programs
The service programs as contrasted with the transfer programs are not designed to stabilize economic activity. Moreover, the Federal outlays under these programs are not very significant in terms of economic adjustments. Apart from veteran education allowances and medical services, the total Federal expenditures for these purposes are less than a cent and a half per dollar of budget outlay.27 While there may be some increase in demand for types of public health services with a decline in family income or increased unemployment, e. g., tuberculosis, cancer, and other disease casefinding, public health nursing, immunizations, and other clinic services provided under the public health programs, the total Federal support of such activities is in the neighborhood of about $12 million. With the exception of a few States, medical assistance to those in need is provided by public hospital agencies or welfare departments. Similarly education programs supported by the National Government would not be enlarged appreciably by decline in employment. Increases in demand for vocational training and a decline in dropouts from school by youngsters entering the labor force might be anticipated, but the Federal support programs are such that these changes would not influence Federal expenditures without new appropriation and legislative authorizations.
Operation of the federally aided welfare programs is dependent upon the basic grant-in-aid provisions. Increased attention needs to
26 A Study Com m ittee R eport on F ederal Aid to W elfare subm itted to the Commission on In tergovernm enta l R elations, Ju n e 1955, p. 14.
27 Com puted from expenditure estim ates fo r the fiscal year 1957 in the budget message of the P re sid en t fo r th e fiscal year 1958, pp. M4 and M58.
Digitized for FRASER http://fraser.stlouisfed.org/ Federal Reserve Bank of St. Louis

1024 ECONOMIC GROWTH AND STABILITY
be focused on the ways to improve existing grant provisions so that they may be more useful as an instrument of fiscal policy. As a minimum it would appear desirable to amend these provisions so that program levels could be maintained in the face of declining State and local revenues. Proposals have been advanced to vary the proportion of Federal financial participation in grant programs with changes in economic activity.28 A major objective of these countercyclical grant proposals is to maintain the level of services and payments under grant programs by safeguarding these program levels against the impact of reduced State and local revenues. More extensive and detailed study is needed of countercyclical grant proposals to assess their practicability as a fiscal policy device. The three provisions of grant programs which influence their fiscal operations need to be appraised, namely, appropriation provisions, allotment provisions, and matching requirements (statutory or administrative) .
W elfare P rograms : P rojected C ost a n d F in a n c in g
In the preceding discussion of the contribution of social welfare programs to economic growth and stability brief reference has been made to the future development of the social welfare programs. The section which follows discusses the emerging problems of social welfare finance for the decade or so ahead.Outlays under existing programs
Increased social-welfare costs are projected under existing legislative authority. The two primary pressures on social-welfare expenditures are the growth in child population of school age and in the aged population who will qualify for benefits under retirement systems. In 1955 there were 27.7 million children enrolled in elementary school and 7.4 million in high school. By 1965 it is expected that there will be 35.7 million enrolled in elementary grades and 11.9 million in high school.29 Continued increases in the birth rate as well as the still to come impact of the postwar baby boom on the high schools and colleges of the country are the basic factors which presage growing expenditures for public education even as shortages of facilities and teachers may become more acute. As indicated earlier the basic old-age and survivors insurance program is far from a mature program. At present, benefit outlays amount to about 4 percent of taxable payrolls, the level premium cost of the system, however, is estimated at 7.4 percent of payroll. Long-range actuarial estimates of the Social Security Administration indicate a long-run trend of mounting old-age and survivors payments; benefit outlays are estimated to reach $12 billion by 1965, $17 billion by 1980, $22 billion by 2000, and to increase beyond that time.30 Pension costs under other public retirement programs will also increase with the rise in the number of qualified retired employees. There are other factors which indicate higher welfare outlays in the years ahead, within present statu
28 Jam es A. Maxwell, F ederal G ran ts and th e Business Cycle, N ational B ureau of Economic R esearch, 1952.
29 U. S. D epartm ent of Labor, O ur M anpow er F u tu re , — 1955-65.30 R obert J . Myers, A ctuaria l Cost E stim ates fo r the Old-Age Survivors and D isability
In su rance System as Modified by A m endm ents to th e Social Security A ct in 1956. (P re pared fo r the use of th e Com m ittee on W ays and M eans, Ju ly 23, 1956, pp. 8 an d 14.)
Digitized for FRASER http://fraser.stlouisfed.org/ Federal Reserve Bank of St. Louis
ECONOMIC GROWTH AND STABILITY 1025
tory authority—pressures for example of competitive earnings levels on salary levels of public employees, of scientific change, and of changing standards of living.
.Social-welfare expenditures in 1956 totaled about $34 billion. The services represented by these outlays accounted for about 11 percent of consumer income that year. To finance the social-welfare services a revenue burden amounting to 9 percent of gross national product was imposed.
Tables 1 and 2 present illustrative projections of the social-welfare budget in 1965 based on existing legislative authorizations, known population changes, and a continuation of past economic trends. Education outlays are estimated for 1965 at almost $5 billion more than 1956 level; social-insurance benefits, primarily due to retirement benefits to a larger number of aged are estimated at about $8 billion above the 1956 payments; other welfare expenditures are estimated at about $2 billion above the 19o6 expenditure levels.
Does a social welfare budget of almost $50 billion mean a larger revenue load on the national economy? With an increase in population, employment, and earnings of the projected amounts, social- welfare-program revenue requirements (including additions to social- insurance reserves) are estimated at $53 billion. For the most part the growth in social-welfare-revenue requirements would be proportional to the gains in national output. The United States Department of Labor estimated the manpower demand and gross output for 1965, based on a projection of past trends to 1955, and on a 25 percent increase in gross output per capita.” The Bureau of Labor Statistics estimates, adjusted only for price increases since 1955, indicate a gross product of $585 billion in 19(55 as compared with a gross product of $434 billion in the second quarter of 1957. Thus, the growth in social-welfare outlays under existing legislative authority would not be at the expense of a higher aggregate tax load on gross production of the economy.
Will the increased social welfare budget require new taxes? Will it require an expanded Federal budget? The classification of program expenditures shown in table 2 provides an approximate approach to answers to these questions. Over half of the projected increases are in social-insurance benefits financed through trust-fund operations, and by special earmarked social-insurance contributions now provided under existing statutory authority.
Federal programs for special beneficiary groups and those programs in which the Federal Government provides over half the funds are estimated to represent a smaller rather than an increased taxload on the national output. Total expenditures in these two classifications are estimated at $7.6 billion for 1965 as compared with $7.1 billion for 1956, a far smaller rise than the projected rise in gross national product. Thus as far as the Federal administrative budget is concerned the projection is for reduced Federal tax-rate requirements.
Almost 45 percent of the projected $15 billion increase in the social- welfare budget represents higher outlays for programs financed primarily out of State and local taxes. While these predominantly State and local programs are estimated to increase $6.6 billion and reach $23.2 billion by 1965, the proportion of gross product devoted to
31 Our M anpower F u tu re , 1955-65. op. cit.Digitized for FRASER http://fraser.stlouisfed.org/ Federal Reserve Bank of St. Louis

1026 ECONOMIC GROWTH AND STABILITY
their finance would remain at the 1956 level—4 percent of gross national product.
Increased State and local revenues under existing tax legislation proportionate to gains in economic activity and output are not indicated, however, by past trends. Several recent studies, for example, have emphasized the inflexibility of property taxes which still account for about 45 percent of State and local tax collections.32 Property-tax collections over the past decades have failed to keep up with expanded national output. The host of complex issues involved in expanding property-tax collections, including impact on housing values and effect on new housing construction, the relation of property assessments to market values and equalization of property assessments, suggest problems ahead in financing education, public hospital and medical care, general assistance, and the other related programs. While considerable, progress is being made in methods and procedures of property taxation and in removing constitutional and legal barriers to effective property-tax utilization, it may be anticipated that a substantial gap will exist between State and local revenues and amounts required to finance welfare-program outlays. I t is this gap which points to continued public debate of State-local and national-State fiscal relations in the years ahead.Types o f new proposals and approximate costs
The social-welfare programs are developing programs. Technological and scientific advances, the growth of metropolitan areas, altered patterns of family life, and the rising standard of living contribute to changing welfare standards and create new social problems. In the operation of social-welfare programs gaps in protection are brought to light and new approaches to social problems are identified. In view of these forces which underlie proposals for extension of existing welfare activities, it is not sufficient to measure the fiscal impact of existing programs; an attempt must be made to anticipate developments in the immediate years ahead.
Many different proposals have been advanced to enlarge and improve social-welfare services. The proposals advanced are directed in the first instance, at least, to one of several of the following:
Research (scientific and social)Physical facilities necessary to the service function Manpower required to provide services Methods of organization of servicesMethods of financing the provision of services, or cash payments
I t is possible within the scope of this paper to take account only of several major proposals from among the many advanced. Among the more important of the proposals are extension of the social insurances to provide more adequate protection against the hazards of unemployment, industrial accidents, sickness, and severe disability, and against unexpected and large hospital-care costs, enlargement of educational and health facilities, and improved organization of these services, improvement in the quality of education in the public schools, and in opportunities for higher education, and assistance to voluntary health plans to facilitate the broadening of coverage and benefits to the aged
32 Mabel Newcomer, S ta te and Local F inancing in R elation to Economic F luctuations, N ational Tax Jou rnal, Ju n e 1954, pp. 97-109. Also Melvin and Anne W hite, Im pact of Economic F lu c tu a tio n s on M unicipal Finance, N ational T ax Jo u rn a l, M arch 1954, pp. 17-39.Digitized for FRASER
http://fraser.stlouisfed.org/ Federal Reserve Bank of St. Louis

ECONOMIC GROWTH AND STABILITY 1027
and other medically indigent groups in the population. An illustrative listing of program proposals follows:
Social-insurance programsExtension of cash sickness-disability benefit protection Improved workmen’s compensation protection Increased unemployment-insurance benefits Extension of severe disability benefits to persons in younger
age groupsHospitalization insurance for old-age and survivors’ insur
ance beneficiaries Programs for special Federal beneficiary groups
(No change)Programs financed primarily by Federal funds
Extended vocational and other rehabilitation services Programs financed primarily by State and local funds
Education proposalsScholarship or other support for college and graduate
studentsConstruction aid for new or expanded higher education
facilitiesConstruction aid for elementary and secondary schools Operation aid for elementary and secondary schools Extended educational services for handicapped children
Health maintenance proposalsImproved organization of medical services; for example,
care of mentally ill, rural health services Construction or operation support to increase health man
power; for example, homemakers, laboratory technicians
Aid to voluntary health insurance plans to increase coverage and scope of benefits; for example, for low-income groups for aged, etc.33
Without a specific description of program content it is patently not possible to estimate with any precision’ funds required to finance the proposed programs. However, the approximate order of magnitude of additional annual revenue requirements, National, State, and local, is illustrated based on a continuation of economic and demographic trends.
Adoption of these proposals is estimated to increase the social welfare budget about $7.5 billion, from the $49.5 billion projected for 1965 to about $57 billion. W ith the new benefits added, the revenue requirements of the social welfare program would be increased by 1965 to 10.4 percent of gross product, as compared with 9 percent for 1956.
I f the problem of hospitalized illness expense of aged persons is met in the next decade through extension of the social insurances, about 55 percent of the $7.5 billion increase in social welfare outlays would be financed out of social insurance contributions. The remaining 45 percent would represent additional revenue required by programs primarily financed by States and localities. I f the hospital cost problem of the aged is met in some other way, for example, by
83 P roposals for aid to vo lun tary h ealth p lans and fo r provision of hosp ita liza tion in su rance fo r old-age and surv ivors’ insurance beneficiaries m ay be considered as a lte rn a tiv e p ro posals, involving about th e same am ount of public expenditures.Digitized for FRASER
http://fraser.stlouisfed.org/ Federal Reserve Bank of St. Louis

1028 ECONOMIC GROWTH AND STABILITY
aid to voluntary health plans under a Federal-State grant program, the division of costs between the social insurances and State and local programs would be reversed. About 40 percent of the additional outlay would represent social insurance charges and 60 percent a charge primarily on State-local funds.
Expansion of the social insurances would require a stepping up of contributions, from an average rate of about 9 percent in 1965 to about 11 percent, and an increase in the taxable wage maximums. Willingness of employed groups and their employers to assume the new contribution obligations will be a direct factor in the political discussions and decisions of benefit extensions. I t may be noted that not all of the increase in contributions would represent a new charge on covered employees and their employers. A t present employers are contributing $5.7 billion annually to private pension and welfare funds, including contributions for cash sickness, disability benefits, and health insurance for their employees.
In a recent survey of 3,100 firms employing 6.8 million employees the National Industrial Conference Board found that 85 percent of hourly workers and 75 percent of salaried workers were covered under group accident and sickness insurance and all but 2 or 3 percent were covered for basic hospitalization insurance. The companies surveyed were financing the entire cost of group accident and sickness insurance for almost 4 out of each 10 workers while for over 5 of each 10 the plans were financed jointly by employers and employees. In the case of hospitalization insurance, employers financed the entire cost for more than one-third of the employees and participated in the financing of protection for nearly an additional one-half of the employees.
A part of the present employer contributions to private welfare plans would be offset against additional social insurance contributions by the altered arrangements for dealing with protection against sickness, and with hospitalization coverage of retired employes. (A t the same time, improved labor mobility would result by removal of at least a part of the fringe benefit barrier to shifts in employment.)
As indicated earlier $6.6 billion in additional funds would be required by 1965 for programs primarily financed by State and local funds, without additions to existing activities. Although the tax load on gross national product would not be enlarged, financing of these programs will require marked changes in methods of raising funds and a reordering of National-State-local responsibilities. Additional health and education programs along the lines of those proposed before legislative committees and by various study groups would add $3.3 billion to $4.5 billion to the budget of these programs. The additional State and local program obligations can be expected to intensify the search for new revenue sources and to make more persistent demands for State aids to localities, and for Federal aids.Revenue relief or public programs
I t is important to bear in mind that the proposals for public action in social welfare program areas at times take the form of tax relief measures. The Revenue Code of 1954, for example, increased deductions for personal medical expenditures as a method of offsetting the hardships to families occasioned by unpredictable severe illness. This authorized deduction is designed to provide a measure of tax relief to families suffering expensive illness. The 1954 code introduced a
Digitized for FRASER http://fraser.stlouisfed.org/ Federal Reserve Bank of St. Louis
ECONOMIC GROWTH AND STABILITY 1029
new category of deductions up to $600 for expenses incurred in the care of an incapacitated dependent, or children under 12 years of age, by employed mothers, widows, or widowers. The new code, furthermore, provided some relief to taxpayers against the cost of higher education by eliminating the $600 gross income test for determining the dependency status of children under 19 years of age, of those over 19 still attending school, and by excluding scholarship aid in determining whether a taxpayer provides over half the support of a child or stepchild. Other changes were made relating to welfare programs. The code authorized the claiming of an exemption for support of parents where several children contributed to this support but no one taxpayer contributed over half the support. The authorization was broadened for widows and widowers with dependent children to split incomes for 2 years after the death of their spouse, and single persons who support one or more parents in a separate home became eligible for half the benefits of income splitting. A tax credit of 20 percent was provided for the first $1,200 of retirement income. Provisions on the deductibility of cash sickness benefits and sick leave pay were clarified.
Earlier—in 1948—taxpayers over 65 years of age, and blind persons were allowed an additional personal exemption of $600; in 1950 aged persons were permitted to deduct all medical expenses from gross income.
In discussion of tax law modification to provide special deductions, exemptions, and credits for special family situations, for the economic and personal hazards of life the question of equity among taxpayers has been the major issue. Within this context, there are many other special family economic risks and circumstances which can create differences in capacity of taxpayers. These situations are occasioning demands for further extension of tax relief provisions. Important among proposals now current are those calling for tax credits for voluntary health insurance premiums, and for tuition paid to colleges and universities; for additional personal exemptions for all disabled persons; for a broadening of business expenses to include transportation and other extra work expenses of handicapped persons, advanced training expenditures of teachers, physicians, and other professional groups, and expenses associated with changes of employment such as employment agency fees, moving expenses, etc. The possibilities of such special provisions are legion for there are innumerable family relationships and ways of meeting family economic and employment problems.
There is an additional equity problem sometimes lost from sight in these proposals for tax relief. Such special provisions for exemptions, deductions and credits involve a loss in revenue—a loss which is an indirect subsidy of the aged, of chlidren who provide parental support, of young people attending colleges and universities and of disabled persons. I t appears necessary to inquire, therefore, whether the groups who would receive the benefits of tax reduction are the most appropriate beneficiaries of a public program, whether public expenditure programs in the amount of the projected revenue loss would provide welfare aid more equally to all groups in the population, or whether a direct expenditure program would more equitably
Digitized for FRASER http://fraser.stlouisfed.org/ Federal Reserve Bank of St. Louis

1030 ECONOMIC GROWTH AND STABIUTY
provide aid to the 45 million or so in the population whose economic status is so low that they are not Federal income taxpayers or dependents of these taxpayers.
T a b le 1.— Social welfare revenue requirements:1 Amount and percent of gross national product, selected years
ProgramAmount (in millions) Percent of gross national product
1929 1935 1956 1965 2 1929 1935 1956 1965 2
$4,596 $6, 754 $37,137 $53,200 4.4 9.3 9.0 9.1
529 435 13,357 22,300 .5 .6 3.2 3.8
Old-age, survivors, and dis-6,521 6,836
14,300 8,000
1.6 2.4529 435 .5 .6 1.6 1.4
Veterans’ and other Federal bene-494 489 4,415 4,650 .5 .7 1.1 .8
484 470 4,311 4,500150
.5 .6 1.0 .810 19 104 (3) (3) (3) (3)
Programs financed primarily by2 1,828 2,718 3,000 (3) 2.5 .7 .5
Public assistance, special cate-115 2,367
3512,500
500.2 .6 .4
2 1,713 (3) 2.4 .1 .1
Programs financed primarily by3,571 4,002 16,647 23, 250 3.4 5.5 4.0 4.0
2,800 500
2,300 661
12,300 3,428
17,200 5,000
2.7 3.2 3.0 2.9.5 .9 .8 .9
71 841 196 250 .1 1.2 (3).2
(3).1200 200 723 800 .2 .3
1 Represents contributions assessed for social insurance programs and revenues required to cover cost of other programs.
2 Illustrative estimates.3 Less than 0.05 percent.N o t e .— P e rc e n ts m a y n o t a d d to t o ta l s b e c a u se of ro u n d in g .Source: Amounts shown for social insurance contributions, 1929,1935, and 1956, from Survey of Current
Business, July issues; other amounts for 1935 and 1956 from Social Security Bulletin, September and October issues; 1929 figures from report of the Committee on the Costs of Medical Care and from official agencies.
Digitized for FRASER http://fraser.stlouisfed.org/ Federal Reserve Bank of St. Louis

ECONOMIC GROWTH AND STABILITY 1031
T a b l e 2.— Social welfare benefits:' Amount and percent of personal disposable income (including value of public services)
Program
Amount (in millions) Percent of personal disposable income2
1929 1935 1956 1965 3 1929 1935 1956 1965 3
$4, 435 $6, 706 $34,287 $49,500 5.1 10.9 11.2 11.9
368 387 10, 507 18,600 .4 .6 3.4 4.5
Old-age, survivors, and disability5,652 4,855
12,000 6,600
1.9 2.9368 387 .4 .6 1.6 1.6
Veterans’ and other Federal beneficiary494 489 4,415 4,650 .6 .8 1.4 1.1
484 470 4,311104
4,500150
.6 .8 1.4 1.110 19 (4) (4) (4) (4)
Programs financed primarily by Federal2 1,828 2,718 3,000 (4) 3.0 .9 .7
115 2,367 2,500500
.2 .8 .62 1,713 351 M 2.8 .1 .1
Programs financed primarily by State3,571 4,002 16,647 23,250 4.1 6.5 5.5 5.6
2,800 2,300 12,300 3,428
196
17,200 3.2 3.7 4.0 4.1500 661 5,000 .6 1.1 1.1 1.271 841 250 . 1 1.4 . 1 .1
200 200 723 800 .2 .3 .2 .2
1 Amounts shown for social insurance and public assistance represent transfer payments and exclude administrative costs, except for grants to States; surplus food distributions to needy persons and public institutions are also excluded.
2 Personal disposable income estimates are adjusted so that they include not only transfer payments, but also value of services received under health and welfare programs. Value of other public services has not been added.
* Illustrative estimates.4 Less than 0.05 percent.N o t e .—Percents may not add to totals because of rounding.Source: Amounts shown for social security payments, 1929,1935, and 1956, from Survey of Current Busi
ness, July issues; other amounts for 1935 and 1956 from Social Security Bulletin, September and October issues; 1929 figures from report of the Committee on the Costs of Medical Care and from official agencies.
Digitized for FRASER http://fraser.stlouisfed.org/ Federal Reserve Bank of St. Louis