
1936378
16
Responses of Annual Vegetation to Temperature and Rainfall Patterns in Northern California Author(s): M. D. Pitt and H. F. Heady Source: Ecology, Vol. 59, No. 2 (Mar., 1978), pp. 336-350 Published by: Ecological Society of America Stable URL: http://www.jstor.org/stable/1936378 . Accessed: 18/05/2014 21:17 Your use of the JSTOR archive indicates your acceptance of the Terms & Conditions of Use, available at . http://www.jstor.org/page/info/about/policies/terms.jsp . JSTOR is a not-for-profit service that helps scholars, researchers, and students discover, use, and build upon a wide range of content in a trusted digital archive. We use information technology and tools to increase productivity and facilitate new forms of scholarship. For more information about JSTOR, please contact [email protected]. . Ecological Society of America is collaborating with JSTOR to digitize, preserve and extend access to Ecology. http://www.jstor.org This content downloaded from 130.123.96.63 on Sun, 18 May 2014 21:17:37 PM All use subject to JSTOR Terms and Conditions
Transcript of 1936378
Responses of Annual Vegetation to Temperature and Rainfall Patterns in Northern CaliforniaAuthor(s): M. D. Pitt and H. F. HeadySource: Ecology, Vol. 59, No. 2 (Mar., 1978), pp. 336-350Published by: Ecological Society of AmericaStable URL: http://www.jstor.org/stable/1936378 .
Accessed: 18/05/2014 21:17
Your use of the JSTOR archive indicates your acceptance of the Terms & Conditions of Use, available at .http://www.jstor.org/page/info/about/policies/terms.jsp
.JSTOR is a not-for-profit service that helps scholars, researchers, and students discover, use, and build upon a wide range ofcontent in a trusted digital archive. We use information technology and tools to increase productivity and facilitate new formsof scholarship. For more information about JSTOR, please contact [email protected].
.
Ecological Society of America is collaborating with JSTOR to digitize, preserve and extend access to Ecology.
http://www.jstor.org
This content downloaded from 130.123.96.63 on Sun, 18 May 2014 21:17:37 PMAll use subject to JSTOR Terms and Conditions
Ecology, 59(2), 1978, pp. 336-350 ? 1978 by the Ecological Society of America
RESPONSES OF ANNUAL VEGETATION TO TEMPERATURE AND RAINFALL PATTERNS IN
NORTHERN CALIFORNIA'
M. D. PITT Department of Plant Science, University of British Columbia,
Vancouver, British Columbia V6T I W5 Canada
AND
H. F. HEADY
University of California, Berkeley, 145 Mulford Hall, Berkeley, California 94720 USA
Abstract. Weather patterns significantly influence annual vegetation, both within and between years. The impact of these weather patterns on standing crop, cover, and botanical composition were investigated during the years 1955-1973 inclusive. Standing crop increased as the growing season progressed from March to June, while cover declined. Erodium spp. Carduus pycnocephalus, Ge- ranium spp. and Hypochoeris glabra all declined between these 2 calendar dates.
Other annual species increased in botanical composition as the growing season progressed. Weath- er patterns primarily influenced total standing crop during the initial period of plant growth. Following germination, temperatures were typically warm and conducive to plant growth; drought at this time suppressed total standing crop. Consistent precipitation following fall germination, and again during the period of rapid plant growth in spring, contributes to a "grass year" in the annual type. The sequence of freezing temperatures in relation to phenology of developing grass seedlings determines the relative proportion of annual grass species from one year to the next. Botanical composition of Trifolium spp. and Medicago hispida depends upon mild autumn weather, particularly when such fall weather favors none of the annual grass species. Botanical composition of Erodium spp. positively correlated with weather patterns associated with dry fall conditions. Multiple regressions of standing crop on weather patterns produced useful guidelines for manipulating animal units to achieve complete utilization of available forage, particularly when these equations were implemented in seasonal stages.
Key words: Annual type; California; precipitation; season; temperature; weather.
INTRODUCTION
The annual grassland of California is located pri- marily below 1,200 metres elevation in the foothills surrounding the Great Central Valley, but occurs in- termittently throughout the Coast Ranges (Heady 1958, Janes 1969). The climate of this annual grassland is of the Mediterranean type, characterized by mild, wet winters and long, hot, dry summers (Biswell 1956). Precipitation typically begins in October or No- vember and ends in April or early May, with approx- imately two thirds falling between December and March. Average rainfall varies in amount from =150 millimetres in the foothills surrounding the southern tip of the San Joaquin Valley and along its west side, to nearly 2,000 millimetres near the Oregon border (Bentley and Talbot 1948, Biswell 1956, Heady 1956). From approximately May to September there is little or no precipitation (Bentley and Talbot 1948, Biswell 1956). Total precipitation from 1 yr to the next varies as much as 500 to 760 millimetres depending upon the particular locale (Bentley and Talbot 1948).
Temperatures below freezing may occur any time between November and March, but winter tempera- tures <- 20'C are exceedingly rare (Heady 1956). Dur-
ing the dry summer, days are mostly clear with max- imum temperatures frequently >30'C along the coast to >40'C in the central valley (Heady 1956).
Weather patterns play a very significant role in an- nual grasslands, both within and between years. Wide fluctuations in standing crop and relative botanical composition from one year to the next are the direct result of both temperature and precipitation patterns (Talbot et al. 1939, Bentley and Talbot 1948, 1951, Talbot and Biswell 1942, Heady 1956, 1958, Naveh 1967, McNaughton 1968, Hooper and Heady 1970, Murphy 1970, Duncan and Woodmansee 1975).
Bentley and Talbot (1951) analyzed maximum herb- age productivity at the San Joaquin Experimental Range in terms of these weather patterns, and con- cluded in qualitative terms that standing crop was ap- proximately average in 4 of 6 seasons when total pre- cipitation exceeded 510 millimetres. Shallow-rooted annuals could not take advantage of excess rain which fell largely during the winter months before air tem- peratures became favorable for plant growth.
Greater-than-average yield occurred during a year receiving 823 millimetres of rain which fell predomi- nantly during the warm spring months. A year receiv- ing only 737 millimetres of rain occurring throughout the fall and spring months produced exceptional herb- age yield. Bentley and Talbot (1951) also concluded
1 Manuscript received 10 March 1977; accepted 16 Septem- ber 1977.
This content downloaded from 130.123.96.63 on Sun, 18 May 2014 21:17:37 PMAll use subject to JSTOR Terms and Conditions

Early Spring 1978 ANNUAL VEGETATION 337
that winter temperatures may have affected herbage yields more than was readily apparent because effects of temperature were closely correlated with effects of precipitation.
Murphy (1970) studied the effect of fall precipitation on herbage productivity and found a correlation coef- ficient of .70 (significant at .01) between observed low, medium and high forage production and the amount of rain received before the 3rd week in November. This correlation reflects the interaction of temperature and precipitation at the time of germination and plant growth immediately following germination. If germi- nation occurs early in the fall, when temperatures are still high, total standing crop increases relative to standing crop produced in a year when germination occurs later in the fall when temperatures are colder and less favorable for plant growth. In South Austra- lia, where climate and vegetation are similar to con- ditions and sites producing the California annual type, initiation of growth early in the year also added to the absolute length of the growing season, encouraging greater total herbage productivity (Trumble and Cor- nish 1936).
Hooper and Heady (1970) studied the effect of weather patterns on total herbage productivity and described the importance of a second period for plant growth that occurs later in the growing season during the months of March, April and May. Warm temper- atures combined with plentiful moisture during this period greatly enhanced total standing crop. Duncan and Woodmansee (1975), working at the San Joaquin Experimental Range, also concluded that precipitation must be adequately distributed throughout the growing season to ensure abundant forage yield.
Weather patterns also influence relative botanical composition of the annual type within each growing season. Ratliff and Heady (1962) studied the effect of phenological development of annual species and ob- served that some species began their most rapid period of growth earlier than others, and some lost weight earlier than others. The sequence of maturity was con- sistent and predictable from one year to the next. The first plant species to reach its maximum weight was Bromus mollis L., followed by Erodium cicutarium (L.) L'Her., Avena fatua L., and Lolium multiflorum Lam. in that order (botanical nomenclature follows Munz and Keck [1965]).
In a study at the Hopland Field Station, Heady (1958) determined that, in virtually all cases, a reduc- tion occurred in total plant numbers as the growing season progressed. Most of this reduction took place early in the growing year between December and Feb- ruary, but the relative proportion of plants by species for the entire growing season was determined prior to December of each year.
Heady (1958) also found that different patterns of loss in plant numbers occurred between plant species and groups of plant species. Bromus mollis and Bro-
mus rigidus Roth. composed more of the vegetation in June than in December on all 3 study sites, whereas Erodium botrys (Cav.) Bertol. maintained approxi- mately the same proportion at all 4 sampling dates. Legumes were least abundant in June and most abun- dant in April, although this generalization was not con- sistent from one year to the next.
Workers in the California annual type generally agree that early fall rains followed by drought in late fall and early winter favor a vegetative cover relatively high in Erodium spp. which possesses a deep taproot that supplies water to the aboveground portions of the plant during times of drought. In contrast to Erodium spp. the more shallowly rooted annual grasses depend upon a continual supply of moisture for optimal growth. However, Duncan and Woodmansee (1975) concluded that yield of annual grasses, legumes, and forbs other than legumes in the grasslands of central California only poorly correlated with precipitation during any particular month of the growing season. These correlations were improved by using the best 2- or 3-mo precipitation with multiple regression anal- ysis.
The objective of this study is to improve upon these correlations of annual vegetation with monthly precip- itation by including temperature and drought patterns in the regression analyses. Hopefully these analyses will provide a quartitative basis for predicting standing crop and botanical composition in the annual type both within and between years. These predictions are par- ticularly valuable if livestock operators are to suc- cessfully equate yearly animal stocking rates with available forage.
METHODS AND FIELD PROCEDURES
The study was conducted at the Hopland Field Sta- tion (38?58'N, 123?08'W), a research unit owned and operated by the University of California, located in Mendocino County in the central portion of the coastal mountain ranges.
The climate of the area is subhumid to humid me- sothermal. The winters are mild with occasional frost in valley bottoms, and infrequent, light snow at higher elevations. The average annual rainfall is 889 milli- metres with virtually no rain falling between June and September. Fog occurs frequently in valley bottoms during late fall, winter and early spring, and, occa- sionally, during summer. Average summer and fall temperatures are between 20? and 25?C (Heady 1956).
The experimental area, known as Watershed II, is a fenced, 86.2-ha drainage basin with a west-facing orientation draining into the Russian River. Elevations range from 183 to 396 metres.
Geologically, the watershed is composed of soils -
metre thick overlying sandstone and shale rock of the Franciscan Formation. This formation is extremely shattered and jointed, with intrusions of basic rock and interlaced with faults, and very typical of the
This content downloaded from 130.123.96.63 on Sun, 18 May 2014 21:17:37 PMAll use subject to JSTOR Terms and Conditions

338 M. D. PITT AND H. F. HEADY Ecology, Vol. 59, No. 2
coastal mountain ranges (Gowans 1958, Burgy and Papazafiriou 1974). Identifiable soils on the watershed include 8 series: 46% Josephine, 28% Sutherland- Laughlin complex, 9% Maymen, 8% Yorkville, 4% Laughlin, 3% Los Gatos, 1% Sutherland, and 1% Montara (Burgy and Papazafiriou 1974).
Vegetational sampling on the watershed began in the spring of 1954 when 63 sheep exclosures, 1.07 m in diameter constructed of 3.8 cm mesh stucco netting, were located throughout the watershed. The first ex- closure was randomly located near the center of the watershed, and each successive exclosure fell on a predetermined line 522.8 m away from the previous exclosure. This line was irregularly located throughout the watershed, following contours when possible, to achieve 2 objectives: (1) facilitate ease of placement, relocation, and sampling of cages; and (2) ensure that only those vegetative types of interest were repre- sented, while those of no concern in the study, pri- marily pure stands of Adenostoma fasciculatum H. & A., were excluded. In addition to 9.3 ha of Adenos- toma fasciculatum, the vegetation of the watershed in 1954 consisted of 5.3 ha of annual, open grassland (principally Bromus mollis, Aira caryophyllea L., Ave- na barbata Brot., Gastridium ventricosum (Gouan) Schinz and Thell., and Erodium spp.; 19.8 ha of mixed grass with a Quercus lobata Nee. overstory; and 50.6 ha of Quercus kellogii Newb., Quercus agrifolia Nee., Quercus wislizenii A. DC., Quercus douglasii H. & A., and Arbutus menziesii Pursh.)
The stratification of cages within the study area re- sulted in 25 being placed on semidense sites charac- terized by oak-woodland vegetation, while the re- maining 38 cages were located on open sites characterized by annual grassland. The semidense sites were on predominantly Josephine soils but the open sites occurred on predominantly Sutherland/ Laughlin soils. In spring 1960, 10 more exclosures were established on sites adjacent to the stream drain- ing the central portion of the watershed.
Moderate sheep grazing, from approximately 1 March through 1 June of each year, began in the spring of 1955 and continued through the summer of 1973. Throughout this period, vegetation was sampled 2x each year: once immediately before grazing, and again immediately after grazing in June. Biomass of the ae- rial, herbaceous vegetation (standing crop) was esti- mated by clipping .099 m2 of herbage to ground level at each location. Clipped samples were then ovendried and weighed. Botanical composition, cover, and height of annual vegetation were estimated with 30 points taken with a 10-point frame (Brown 1954). March samples were collected only at outside stakes which marked vegetation selected visually to be sim- ilar to vegetation inside the cages. Each stake was placed at a distance far enough from its associated cage so that vegetation surrounding the stake was not unduly influenced by the trampling activities of curi-
ous or hungry sheep congregating about the cages. June samples were collected both inside the cages and at the outside stakes. Outside June and March sam- pling occurred on opposite sides of the stake.
Each exclosure was located in a relatively homo- genous sampling unit -8.0 metres in diameter. Exclo- sures and outside stakes were moved prior to the 1 March sampling date each year to a different but veg- etationally similar spot within particular sampling units. Changes noted in botanical composition or standing crop from one year to the next were therefore not the result of repeated sampling on the same loca- tion.
Heady (1957) studied the effect of these exclosures on standing crop at the Hopland Field Station and re- ported an increase in plant growth within the cage dur- ing the period of slow winter growth. With the onset of warm, spring temperatures, however, these differ- ences soon disappeared. Heady (1957) further con- cluded that when the plants reached maturity, the cage effect on plant growth, relative botanical composition, and foliar cover became insignificant. Estimates of standing crop, botanical composition, and cover on Watershed II, obtained from exclosures sampled in March and June, are therefore assumed valid.
RESULTS AND DISCUSSION
Although all plant species were recorded during sampling, only 26 vegetative groups were analyzed in this study (Table 1). These 26 groups were selected on the basis of I or more of the following 3 characteris- tics: (1) the vegetative group, such as annual Festuca spp., comprised a consistent, significant portion of the annual vegetation on the watershed; (2) the vegetative group, such as Baeria chrysostoma F. & M., is an ecological indicator of overgrazing and/or disturbance; and (3) the vegetative group, such as Bromus mollis, is managerially important in terms of palatability and/ or selectivity.
Botanical data were collected by several field sam- plers during the course of this study. Whereas the total number of "hits" with a point frame varies from one person to another, the relative proportion of these hits among plant species remains relatively constant (Brown 1954). Botanical analyses were therefore based upon proportions of total cover by species rath- er than total plant hits (numbers).
Influence of season on annual vegetation
Table 2 summarizes the average percent botanical composition, cover, and standing crop in 1 March and 1 June vegetation of the watershed for the years 1955- 1973 inclusive. The following discussion comparing differences in March and June vegetation centers upon differences significant at p < .05.
Standing crop in March averaged 85.7 g/m2 and cov- er equaled 45.1%. Of the total vegetative cover, annual grasses, legumes, and nonleguminous forbs comprised
This content downloaded from 130.123.96.63 on Sun, 18 May 2014 21:17:37 PMAll use subject to JSTOR Terms and Conditions

Early Spring 1978 ANNUAL VEGETATION 339
TABLE 1. Vegetative groups analyzed in Watershed II study
01) Aira caryophyllea 02) Avena barbata 03) Bromus mollis 04) Bromus rigidus 05) Bromus rubens 06) Festuca spp. 07) Gastridium ventricosum 08) Hordeum spp. 09) Other annual grasses 10) Other perennial grasses & grasslike plants 11) Medicago hispida 12) Trifolium spp. 13) Vicia spp. 14) Other legumes 15) Baeria chrysostoma 16) Carduus pycnocephalus 17) Daucus pusillus 18) Erodium spp. 19) Geranium spp. 20) Hypochoeris glabra 21) Other perennial forbs 22) Other early annual forbs 23) Other late annual forbs 24) Unknown forbs 25) Cover 26) Standing crop
35.3, 12.4, and 47.6% of the botanical composition, respectively. Erodium spp. and Bromus mollis, 20.9 and 16.6%, respectively, dominated the vegetation in terms of individual plant species.
Standing crop in June averaged 224.8 g/m2 and cover measured 39.6%. Annual grasses, 52.4%, furnished the largest proportion of this vegetative cover, and legumes and other nonleguminous forbs contributed 12.5 and 30.5%, respectively. Bromus mollis, Erodium spp. and annual Festuca spp., 20.9, 10.2 and 9.2%, respectively, attained the largest proportion of plant species sampled.
Comparisons between March and June vegetation
The observed decline in total plant cover from March to June reflects individual plant mortality as the growing season progressed. Greater standing crop in June resulted from increased individual growth of sur- viving plants. Annual grasses furnished much of this increase in standing crop as Aira caryophyllea, Bro- mus mollis, Bromus rigidus, Bromus rubens L., Fes- tuca spp. Gastridium ventricosum and Hordeum spp. all attained greatest botanical composition in June. Aira caryophyllea, a particularly late-maturing spe- cies, increased nearly 10-fold from 0.6 to 5.8% botan- ical composition during this 3-mo period.
Trifolium spp. and Vicia spp. also increased in per- cent botanical composition as the growing season pro- gressed from March to June. Vicia spp. mature late in the year, and in selected spots on the watershed such as springs and other seep areas, often provided the only available green forage as summer approached. In contrast to Vicia spp., Trifolium spp. mature earlier in the growing season. However, the involucres of the
TABLE 2. Average percent composition of vegetative groups (Table 1), cover and standing crop in March and June veg- etation on Watershed II, Hopland Field Station, for the years 1955 through 1973 inclusive
Signifi- cancel
1 1 of dif- Vegetative groups March June ference
Aira caryophyllea 0.6 5.8 * Avena barbata 5.6 6.1 NS Bromus mollis 16.6 20.9 * Bromus rigidus 4.9 6.6 ***
Bromus rubens 0.1 0.6 *
Festuca spp. 6.0 9.2 **** Gastridium ventricosum 0.2 1.7 * Hordeum spp. 0.4 0.8 **
Other annual grasses 1.0 1.3 NS Perennial grasses and 2.9 3.3 NS
grasslike plants
Medicago hispida 2.4 1.6 NS Trifolium spp. 5.0 5.3 * Vicia spp. 0.9 2.4 ****
Other legumes 4.1 3.2 NS Baeria chrysostoma 0.2 0.2 NS
Carduus pycnocephalus 1.0 0.9 ** Daucus pusillus 2.5 3.4 * Erodium spp. 20.9 10.2 **** Geranium spp. 4.5 0.5 * Hypochoeris glabra 6.3 2.2 *
Perennial forbs 2.9 0.9 ****
Other early annual forbs 4.8 8.9 **** Other late annual forbs 0.3 2.2 * Unknown forbs 4.2 1.1 *
Cover (%) 45.1 39.6 *
Standing crop (g/m2) 85.7 224.8 I **** = significant at p < .01; *** = significant at p
< .05; ** = significant atp < .10;* = significant atp < .20; NS = not significant.
seed heads of Trifolium spp. are quite persistent after the leaves shatter, and, therefore, these plant species consistently appeared in the data at both sampling dates.
Medicago hispida provided a situation very similar to that of Trifolium spp. as this plant species also ma- tures very early and shatters easily in response to both light rainfall and the trampling activities of grazing an- imals. Following shattering, however, the burs remain intact on the ground throughout the dry season and therefore the percent botanical composition of Medi- cago hispida in March, 2.4%, did not significantly dif- fer from the 1.6% botanical composition of Medicago hispida in June (Table 2).
In contrast to annual grasses and legumes, nonle- guminous forbs typically decreased in percent botan- ical composition as the growing season progressed from March to June. Carduus pycnocephalus L., Ero- dium spp., Geranium spp., and Hypochoeris glabra L. all declined in botanical composition during this 3- mo period (Table 2). These 4 plant species comprised 32.7% of the vegetative cover on 1 March, but aver-
This content downloaded from 130.123.96.63 on Sun, 18 May 2014 21:17:37 PMAll use subject to JSTOR Terms and Conditions

340 M. D. PITT AND H. F. HEADY Ecology, Vol. 59, No. 2
g Im2 , .Standing crop
500 100 -
400 80 / P
*s I \ t.. A
I, -r
300 60 - \Al
A I
.- I I I I
100 20 A' -VI
55 57 59 61 63 65 67 69 71 73
YEAR (19 )
FIG. 1. Standing crop (g/m2) and foliar cover (%) on Wa- tershed II, Hopland Field Station, during the years 1955 through 1973.
aged only 13.8% of the vegetative cover on 1 June of each year. This drastic reduction in composition of these species, particularly Erodium spp. and Gerani- um spp., partially accounts for the de facto increase in percent botanical composition of annual grasses.
The vegetative groups, early and late annual forbs, comprised those nonleguminous forbs not analyzed individually. Munz and Keck (1965), combined with field observations, provided the criteria for determin- ing whether a forb matured late or early in the growing season.
Interestingly, early annual forbs did not describe a
100
.Annual grasses 80 a
60 -
Z /~~~~~~~~A -
40 I Pa * ' " , 40
A/
\ I
20
, ' - - I r Clovers
55 57 59 61 63 65 67 69 71 73
YEAR (19
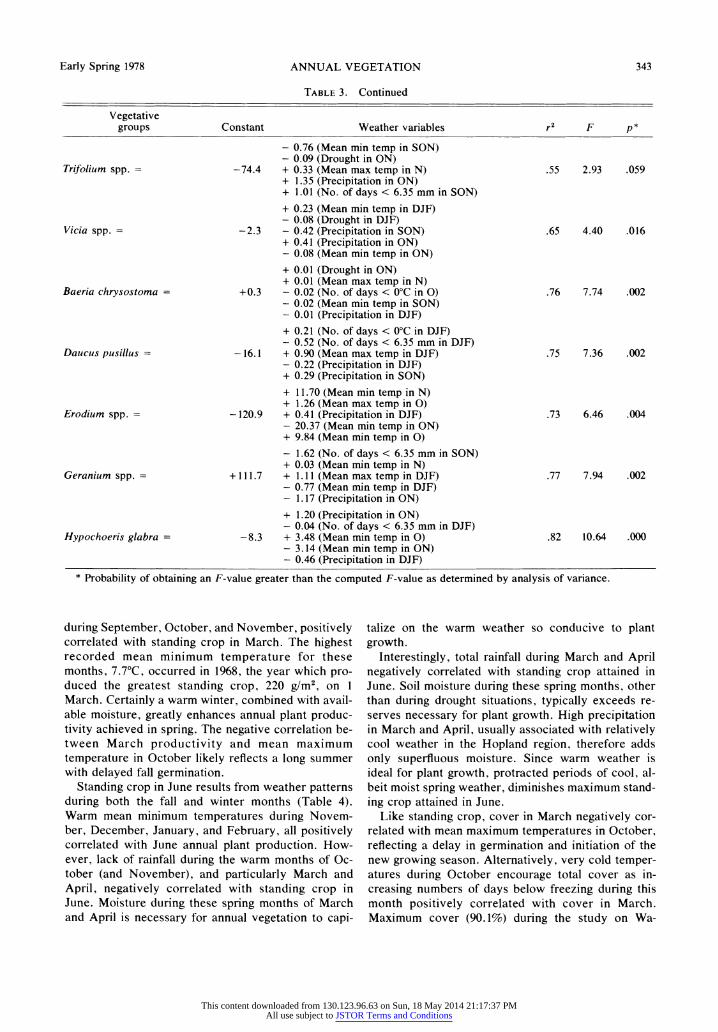
FIG. 2. Percent botanical composition of annual grasses and clovers (Medicago hispida and Trifolium spp.) on Wa- tershed II, Hopland Field Station, during the years 1955 through 1973.
5o -
40 -
30 -
e 20 z : !
10 _
55 57 59 61 63 65 67 69 71 73
YEAR (19
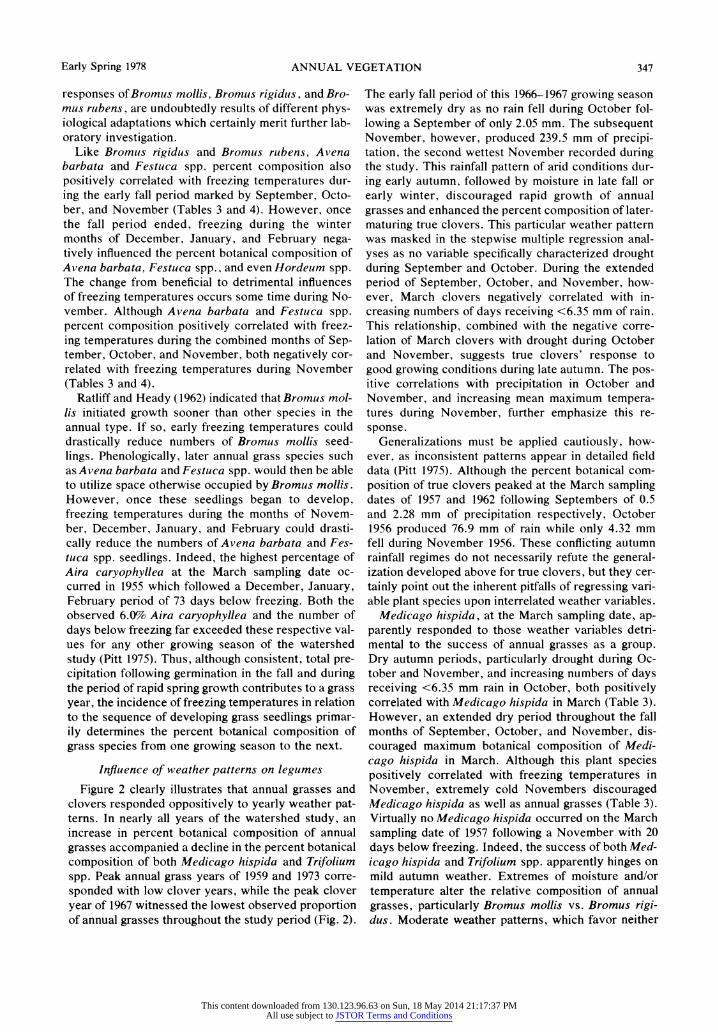
FIG 3. Percent botanical composition of filaree (Erodium spp.) on Watershed II, Hopland Field Station, during the years 1955 through 1973.
meaningful group of plant species in terms of the 2 seasons analyzed in this study. Early annual forbs joined late annual forbs, as both of these vegetative groups became relatively more abundant as the grow- ing season progressed from 1 March to 1 June.
Yearly variability of annual vegetation
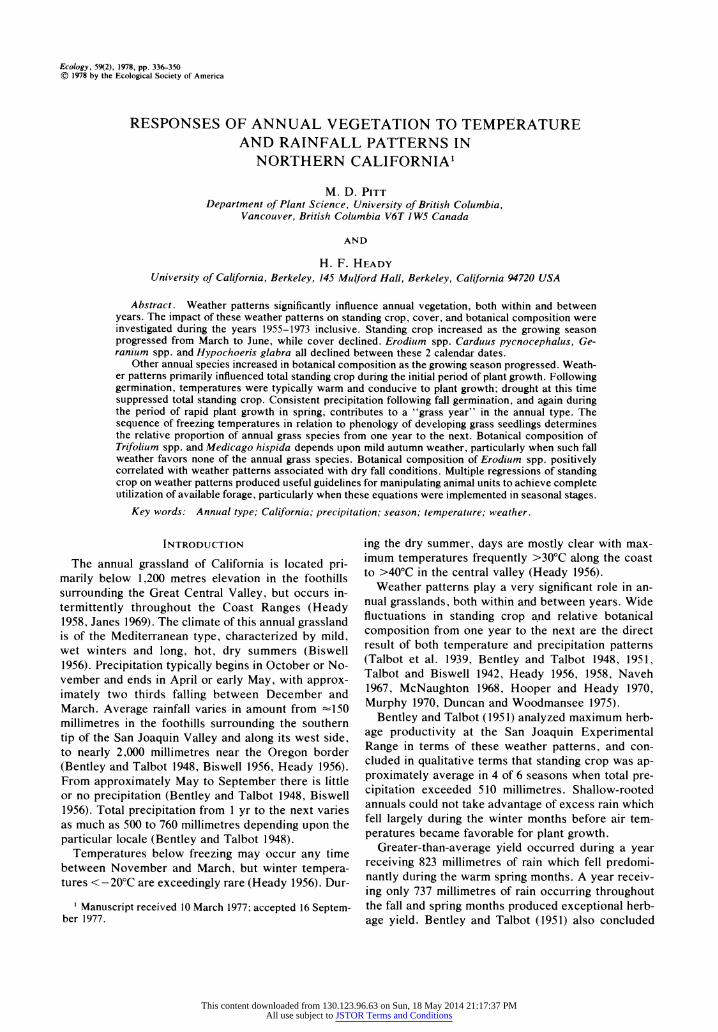
Gross vegetational characteristics such as standing crop and cover varied tremendously throughout the watershed study. Standing crop fluctuated from 106 to 562 g/m2, and cover ranged from a low of 8.3% to a high of 67.7% (Fig. 1). The apparent upward trends in both standing crop and cover likely reflect poor and excellent growing conditions at the beginning and end of the study, respectively. Annual vegetation through- out the Hopland Field Station displayed similar trends, even in areas of different elevations, soil types, and experimental regimes (Pitt 1975).
Within the annual variability of standing crop and cover, workers in the California annual type typically refer to "grass, filaree, or clover years" (Talbot et al. 1939). These 3 types of botanical years, which de- scribe a qualitative impression of the vegetation in terms of relative abundance, also varied dramatically on the watershed. Botanical composition of annual grasses ranged from 24.1% to 82.1%, and botanical composition of clovers ranged from 2.5% to a high of 20.1% (Fig. 2). Filaree (Erodium spp.) fluctuated in botanical composition from a high of 48.1% to a low of 3.6% of the total vegetative cover (Fig. 3).
Interestingly, the year in which annual grasses peaked in percent botanical composition was the year (1958) in which filaree contributed its lowest percent botanical composition. The year of 1958 was the wet- test during the watershed study (Pitt 1975), receiving
This content downloaded from 130.123.96.63 on Sun, 18 May 2014 21:17:37 PMAll use subject to JSTOR Terms and Conditions

Early Spring 1978 ANNUAL VEGETATION 341
1,294 mm of rain. Such data support hypotheses that annual grasses do relatively well in years receiving a continual supply of moisture. In contrast, early rains followed by a long period of dry weather favors drought-tolerant species and leads to a death of annual grass as well as clover seedlings (Rossiter 1966). In- deed, the lowest percent botanical composition of clo- vers on the watershed occurred in 1959, a year which received the lowest precipitation (40.6 mm), subse- quent to germination, during the months of Septem- ber, October, and November.
These botanical responses to changing moisture pat- terns are also influenced by soil nutrient status as McKell et al. (1959) demonstrated that fertilization of annual vegetation increased the rate of soil moisture depletion. Nitrogen fertilization when temperatures are low favor annual grasses which assimilate 90W of the available N (Donald 1963). Annual clovers become dependent upon symbiotic nitrogen, suffer reduced growth, and are shaded out by taller annual grasses (Stern and Donald 1962; Stern 1965). However, if ni- trogen is applied when temperatures are high, clovers incorporate as much as 50W% of the available N, and therefore comprise a larger proportion of the total veg- etative cover (Donald 1963).
In addition to soil fertility, the sequence of grass, clover, and filaree years is also affected by other fac- tors such as annual plant population density (Gerakis et al. 1975), grazing pressure, and fire (Biswell 1956). Nonetheless, these factors tend to influence only the magnitude rather than the direction of botanical changes produced in response to changing weather patterns (Pitt 1975). Therefore, to better understand the impact of these weather patterns on annual vege- tation, fluctuations in standing crop, cover, and se- lected plant species were analyzed in relationship to annual variability of 76 weather variables.
The 76 weather variables chosen for analysis in- cluded mean minimum and maximum temperatures, numbers of days receiving <6.35 mm of rain, total precipitation, total number of days below freezing, drought, (longest successive number of days beginning in the time period for which each day received < 1.27 mm of rain), and germination date (number of days after 31 August for first storm of 19.0 mm). All of these variables occurTed within selected months and groups of months throughout the growing season (see Pitt [1976] for field data). Only the first 18 yr (1955-1972) of data were used in the regression analyses so that 1973 data could be utilized to evaluate the predictive capabilities of regression equations. Tables 3 and 4 summarize the influences of weather patterns, as de- termined by stepwise, multiple regression, on March and June vegetation, respectively.
These multiple regressions of standing crop, cover, and botanical composition as influenced by weather patterns, produced some inconsistencies which prob- ably resulted for the following reasons. (1) Values for
vegetative groups were collected only in March and June, whereas botanical composition in the California annual type is greatly influenced by weather patterns during and immediately following germination in the fall (Heady 1958). This critical period determining bo- tanical composition may even be shorter than the monthly categories characterizing weather patterns in these regression analyses. (2) Temperature and mois- ture patterns in the soil during this critical period fol- lowing germination certainly influence annual vegeta- tion. Ambient temperatures and incoming precipitation only indirectly correlate with these very important soil weather patterns. (3) Total precipitation exceeding waterholding capacity of the soil yields unusable mois- ture. (4) Many of the 76 weather variables are corre- lated with each other; hot fall temperatures are typi- cally associated with little or no rainfall in the Hopland area. However, stepwise multiple regression tech- niques assume no correlation exists among the inde- pendent factors (weather variables). These problems of correlation among independent factors are com- pounded when standard deviations of the regression equations are greater than either the average, ob- served, or predicted values of the dependent, botani- cal variables (Table 5). Therefore, results from step- wise multiple regression analyses must always be carefully evaluated; botanical conclusions must cer- tainly be tempered with common sense, ecological cri- teria, and factual support. With these restrictions in mind, the following relationships emerged from the regressions of vegetative groups on weather variables.
Influence of weather patterns on standing crop and cover
The quantity of standing crop on 1 March, the be- ginning of the second period of plant growth, results from an intimate combination of temperature and rain- fall patterns during the initial period of plant growth throughout the fall and early winter months. Following germination, temperatures are typically warm and conducive to plant growth. However, many of the plants still possess small, developing root systems. Lack of rainfall during the months of October and November therefore, negatively correlated with stand- ing crop attained in March (Table 3). The lowest 1 March productivity, 24.2 g/m2, observed on the wa- tershed, occurred in 1960 following the only October/ November period for which all 61 days received <6.35 mm of rain. Alternatively, total precipitation during the mid-winter months of December, January, and February, positively correlated with standing crop in March. In the Hopland region of California, lack of winter precipitation coincides with cold temperatures. Therefore, the positive correlation of March standing crop with increasing total precipitation during the months of December, January, and February also re- flects a positive correlation with relatively mild win- ters. Correspondingly, mean minimum temperatures
This content downloaded from 130.123.96.63 on Sun, 18 May 2014 21:17:37 PMAll use subject to JSTOR Terms and Conditions

342 M. D. PITT AND H. F. HEADY Ecology, Vol. 59, No. 2
TABLE 3. Summary of results obtained from stepwise multiple regressions of vegetative groups at the March sampling date on weather variables
Vegetative groups Constant Weather variables r2 F p*
+ 2.61 (Mean min temp in SON) - 0.55 (Mean max temp in 0)
Standing crop = +35.8 - 1.81 (Mean min temp in 0) .73 6.73 .003 + 0.16 (Precipitation in DJF) - 0.41 (No. of days < 6.35 mm in ON) - 1.77 (Mean max temp in 0) + 4.64 (No. of days < 0?C in O)
Cover = + 121.5 - 0.63 (No. of days < 0?C in DJF) .84 12.83 .000 + 0.77 (Precipitation in DJF) + 1.48 (Mean min temp in N)
+ 0.10 (No. of days < 0?C in DJF) - 0.14 (Mean max temp in 0)
Aira caryophyllea = +9.6 + 0.22 (Mean max temp in DJF) .71 5.92 .006 - 0.48 (No. of days < 6.35 mm in 0) - 0.29 (Precipitation in 0) - 0.53 (No. of days < 6.35 mm in DJF) + 0.70 (Mean max temp in N)
Avena barbata = +7.1 - 1.38 (No. of days < 0?C in N) .84 12.81 .000 + 0.82 (No. of days < 0?C in ON) - 0.14 (No. of days < 0?C in DJF)
+ 3.11 (No. of days < 6.35 mm in N) + 2.36 (Mean max temp in DJF)
Bromus mollis = +2.1 - 2.36 (Mean min temp in DJF) .66 4.67 .014 - 1.80 (Mean max temp in N) - 0.89 (No. of days < 0?C in 0)
+ 1.02 (No. of days < 0?C in ON) + 1.04 (Mean min temp in SON)
Bromus rigidus = -85.9 - 0.04 (Days beyond 31 August for germ.) .75 7.29 .002 + 0.76 (Mean min temp in N) + 0.47 (No. of days < 6.35 mm in N)
+ 0.52 (No. of days < 0?C in ON) + 0.61 (Mean min temp in N)
Bromus rubens = -34.1 - 0.58 (No. of days < 6.35 mm in 0) .86 15.37 .000 + 0.30 (Mean max temp in N) + 0.08 (No. of days < 6.35 mm in DJF)
+ 0.89 (No. of days < 0?C in 0) + 0.77 (Mean min temp in N)
Festuca spp. = + 14.4 - 0.50 (Precipitation in ON) .78 8.35 .001 - 0.15 (No. of days < 0?C in DJF) - 0.56 (Mean max temp in DJF) + 0.07 (Mean max temp in DJF) + 0.01 (Precipitation in 0)
Gastridium ventricosum = -6.4 - 0.13 (Mean max temp in N) .55 2.94 .058 + 0.12 (No. of days < 6.35 mm in SON) + 0.02 (No. of days < 6.35 mm in DJF)
+ 0.18 (Mean min temp in DJF) + 0.36 (No. of days < 0?C in 0)
Hordeum spp. = +4.1 - 0.23 (No. of days < 0?C in N) .55 2.91 .060 - 0.14 (No. of days < 6.35 mm in DJF) + 0.02 (No. of days after 31 August for germ.)
+ 0.13 (Mean max temp in SON) - 0.09 (No. of days < 6.35 mm in DJF)
Other annual grasses = -14.6 + 0.24 (Mean max temp in DJF) .42 1.71 .207 - 0.15 (Mean min temp in DJF) + 0.08 (Mean min temp in ON) - 0.92 (No. of days < 6.35 mm in SON) + 0.10 (Drought in ON)
Medicago hispida = +46.4 + 0.59 (No. of days < 6.35 mm in 0) .69 5.40 .008 + 0.25 (Mean max temp in DJF) + 0.09 (No. of days < 0?C in N)
This content downloaded from 130.123.96.63 on Sun, 18 May 2014 21:17:37 PMAll use subject to JSTOR Terms and Conditions
Early Spring 1978 ANNUAL VEGETATION 343
TABLE 3. Continued
Vegetative groups Constant Weather variables r2 F p*
- 0.76 (Mean min temp in SON) - 0.09 (Drought in ON)
Trifolium spp. = -74.4 + 0.33 (Mean max temp in N) .55 2.93 .059 + 1.35 (Precipitation in ON) + 1.01 (No. of days < 6.35 mm in SON)
+ 0.23 (Mean min temp in DJF) - 0.08 (Drought in DJF)
Vicia spp. - -2.3 - 0.42 (Precipitation in SON) .65 4.40 .016 + 0.41 (Precipitation in ON) - 0.08 (Mean min temp in ON)
+ 0.01 (Drought in ON) + 0.01 (Mean max temp in N)
Baeria chrysostoma = +0.3 - 0.02 (No. of days < 0?C in 0) .76 7.74 .002 - 0.02 (Mean min temp in SON) - 0.01 (Precipitation in DJF)
+ 0.21 (No. of days < 0?C in DJF) - 0.52 (No. of days < 6.35 mm in DJF)
Daucus pusillus = -16.1 + 0.90 (Mean max temp in DJF) .75 7.36 .002 - 0.22 (Precipitation in DJF) + 0.29 (Precipitation in SON) + 11.70 (Mean min temp in N) + 1.26 (Mean max temp in 0)
Erodium spp. = -120.9 + 0.41 (Precipitation in DJF) .73 6.46 .004 - 20.37 (Mean min temp in ON) + 9.84 (Mean min temp in 0) - 1.62 (No. of days < 6.35 mm in SON) + 0.03 (Mean min temp in N)
Geranium spp. = + 111.7 + 1.11 (Mean max temp in DJF) .77 7.94 .002 - 0.77 (Mean min temp in DJF) - 1.17 (Precipitation in ON)
+ 1.20 (Precipitation in ON) - 0.04 (No. of days < 6.35 mm in DJF)
Hypochoeris glabra = -8.3 + 3.48 (Mean min temp in 0) .82 10.64 .000 - 3.14 (Mean min temp in ON) - 0.46 (Precipitation in DJF)
* Probability of obtaining an F-value greater than the computed F-value as determined by analysis of variance.
during September, October, and November, positively correlated with standing crop in March. The highest recorded mean minimum temperature for these months, 7.7?C, occurred in 1968, the year which pro- duced the greatest standing crop, 220 g/m2, on 1 March. Certainly a warm winter, combined with avail- able moisture, greatly enhances annual plant produc- tivity achieved in spring. The negative correlation be- tween March productivity and mean maximum temperature in October likely reflects a long summer with delayed fall germination.
Standing crop in June results from weather patterns during both the fall and winter months (Table 4). Warm mean minimum temperatures during Novem- ber, December, January, and February, all positively correlated with June annual plant production. How- ever, lack of rainfall during the warm months of Oc- tober (and November), and particularly March and April, negatively correlated with standing crop in June. Moisture during these spring months of March and April is necessary for annual vegetation to capi-
talize on the warm weather so conducive to plant growth.
Interestingly, total rainfall during March and April negatively correlated with standing crop attained in June. Soil moisture during these spring months, other than during drought situations, typically exceeds re- serves necessary for plant growth. High precipitation in March and April, usually associated with relatively cool weather in the Hopland region, therefore adds only superfluous moisture. Since warm weather is ideal for plant growth, protracted periods of cool, al- beit moist spring weather, diminishes maximum stand- ing crop attained in June.
Like standing crop, cover in March negatively cor- related with mean maximum temperatures in October, reflecting a delay in germination and initiation of the new growing season. Alternatively, very cold temper- atures during October encourage total cover as in- creasing numbers of days below freezing during this month positively correlated with cover in March. Maximum cover (90. 1%) during the study on Wa-
This content downloaded from 130.123.96.63 on Sun, 18 May 2014 21:17:37 PMAll use subject to JSTOR Terms and Conditions

344 M. D. PITT AND H. F. HEADY Ecology, Vol. 59, No. 2
TABLE 4. Summary of results obtained from stepwise multiple regressions of vegetative groups at the June sampling date on weather variables
Vegetative groups Constant Weather variables r2 F p*
+ 2.01 (Mean min temp in N) + 1.46 (Mean min temp in DJF)
Standing crop = + 188.4 + 2.57 (No. of days < 6.35 mm in ON) .90 22.60 .000 - 4.11 (Precipitation in March, A) - 3.69 (No. of days < 6.35 mm in ONMA)
+ 3.06 (No. of days < 0?C in 0) + 3.02 (Mean min temp in DJF)
Cover = -75.4 + 5.70 (No. of days < 6.35 mm in 0) .79 9.17 .001 - 2.45 (Mean max temp in ON) + 1.49 (Precipitation in A)
+ 1.14 (No. of days < 0?C in ONMA) - 0.72 (No. of days < 0?C in SONMA)
Aira caryophyllea = -71.6 + 2.01 (Precipitation in March) .82 11.24 .000 + 1.01 (Mean max temp in March, A) - 0.25 (Drought in DJF)
+ 4.10 (Mean min temp in SON) - 0.76 (Mean max temp in DJF)
Avena barbata = -33.7 - 2.43 (Mean min temp in ON) .81 10.46 .000 + 0.91 (No. of days < 0?C in 0) + 0.16 (Precipitation throughout the growing season)
+ 2.37 (No. of days < 6.35 mm in N) + 2.12 (No. of days < 6.35 mm in MAM)
Bromus mollis = -315.4 + 1.67 (Precipitation SONMA) .83 11.80 .000 - 0.38 (Drought in MAM) + 1.25 (Mean max temp in MAM)
+ 0.53 (No. of days < 0?C in ON) + 1.33 (Mean min temp in ON)
Bromus rigidus = -90.2 + 1.39 (Mean max temp during growing season) .92 26.65 .000 - 0.66 (No. of days < 6.35 mm in 0) - 0.76 (Mean min temp in SON)
+ 0.10 (No. of days < 0?C in ON) - 0.30 (No. of days < 0?C in AM)
Bromus rubens = +27.5 - 0.34 (Mean min temp in March, A) .87 16.44 .000 - 0.21 (Mean max temp in March) - 0.08 (Precipitation in SONMA) - 2.04 (No. of days < 0?C in N) + 1.79 (Mean max temp in MAM)
Festuca spp. = +1.9 + 0.65 (No. of days < 0?C in SON) .69 5.34 .008 - 0.41 (No. of days < 0?C in DJF) - 2.21 (Mean min temp in SON)
+ 0.61 (Precipitation in March, A) - 0.21 (Mean min temp in N)
Gastridium ventricosum = -9.0 - 0. 1 1 (Drought in DJF) .89 20.09 .000 + 0.22 (No. of days < 6.35 mm in March, A) + 0.07 (Mean max temp in A)
- 0.45 (No. of days < 6.35 mm in ON) + 0.43 (Mean max temp in DJF)
Hordeum spp. = + 13.8 - 0.29 (Precipitation in March, A) .79 9.28 .001 - 0.06 (No. of days < 0?C in DJF) - 0.20 (Mean min temp in 0)
- 0.24 (Mean min temp in 0) - 0.16 (No. of days < 0?C in 0)
Other annual grasses = +8.4 + 0.08 (Mean min temp in MAM) .90 21.65 .000 - 0.02 (Drought in MAM) - 0.02 (Drought in DJF) + 0.05 (Drought in ON) - 0.29 (Mean max temp in AM)
Medicago hispida = +9.7 + 0.05 (Drought in MAM) .76 7.65 .002 + 0.28 (Mean min temp in A) + 0.22 (No. of days < 0?C in A)
This content downloaded from 130.123.96.63 on Sun, 18 May 2014 21:17:37 PMAll use subject to JSTOR Terms and Conditions

Early Spring 1978 ANNUAL VEGETATION 345
TABLE 4. Continued
Vegatative groups Constant Weather variables r2 F p*
- 1.05 (Mean max temp in March) + 0.91 (Mean max temp in 0)
Trifolium spp. = +43.3 - 2.54 (Mean max temp in ONMA) .95 43.65 .000 - 0.45 (Precipitation in SON) + 1.85 (Mean max temp in SONMAM)
+ 0.73 (Mean min temp in SON) - 1.36 (No. of days < 6.35 mm in ONMAM)
Vicia spp. = +73.59 - 0.76 (Precipitation in SONMAM) .87 16.55 .000 + 1.28 (Mean max temp in SON) + 0.44 (No. of days < 0?C in AM)
- 0.10 (Mean min temp in ON) - 0.02 (No. of days < 0?C in SON)
Baeria chrysostoma = -1.1 + 0.06 (Precipitation in March, A) .81 10.31 .001 + 0.04 (No. of days < 6.35 mm in SONMA) - 0.01 (No. of days after 31 August for germ)
- 1.30 (Mean min temp in SON) + 0.91 (Mean min temp in 0)
Daucus pusillus = +37.5 - 0.56 (Mean max temp in AM) .90 21.27 .000 + 0.14 (No. of days < 6.35 mm in ONMAM) + 0.06 (No. of days < 0?C in DJF)
+ 0.21 (Mean min temp in N) - 2.04 (Precipitation in A)
Erodium spp. = + 194.0 - 1.66 (No. of days < 6.35 mm in ONMA) .73 6.45 .004 - 0.92 (Precipitation in ONMA) + 0.20 (Drought in MAM) - 0.36 (Mean min temp in SON) + 0.28 (Mean min temp in ON)
Geranium spp. = +8.0 - 0.08 (Precipitation in SON) .82 11.11 .000 - 0.03 (No. of days < 0?C in DJF) - 0.07 (Mean min temp in DJF)
+ 0.23 (Mean min temp in A) - 0.47 (Mean max temp in AM)
Hypochoeris glabra = +3.0 + 0.17 (No. of days < 6.35 mm in MAM) .59 3.46 .036 + 0.22 (Precipitation in 0) + 0.13 (Mean max temp in A)
* Probability of obtaining an F-value greater than the computed F-value as determined by analysis of variance.
tershed II occurred on 1 March 1957 following the coldest recorded October (Pitt 1975). Apparently these freezing temperatures discouraged individual plant growth, minimizing individual plant mortality due to competition for nutrients and moisture. Once plant growth began, however, freezing temperatures and possible structural damage to growing cells discour- aged total cover as increasing numbers of days below freezing during the months of December, January, and February negatively correlated with cover in March. Warm temperatures during the month of November, and rainfall in the winter months of December, Janu- ary, and February, typically associated with warm weather at the Hopland Field Station, all positively correlated with cover in March. Freezing tempera- tures in October continued to exert a strong, residual influence on cover throughout the growing season, as this weather variable entered the regression equation of June cover on weather patterns prior to all other weather variables.
Influence of weather patterns on annual grasses
Bromus mollis, the most common annual grass on the watershed in terms of percent botanical composi- tion, was positively correlated with increasing num- bers of days in November receiving <6.35 mm of pre- cipitation (Tables 3 and 4). The fewest number of days (20) receiving <6.35 mm during this month occurred in the 1966-1967 growing season, when Bromus mollis comprised only 5.3% of the vegetation. Indeed, drought throughout the fall period of October and No- vember may encourage Bromus mollis relative to other annual plants as the low 1966-1967 year was associ- ated with a drought of only 5 days. In contrast, Bro- mus mollis attained a high of 33.9Wo botanical com- position in 1958-1959 when the longest drought during October and November equaled 30 days (Pitt 1975). Following this fall drought, however, Bromus mollis requires warm winters which are often associated with
This content downloaded from 130.123.96.63 on Sun, 18 May 2014 21:17:37 PMAll use subject to JSTOR Terms and Conditions

346 M. D. PITT AND H. F. HEADY Ecology, Vol. 59, No. 2
TABLE 5. Average (1955-1972), observed (1973), and predicted (1973) March and June standing crop (grams per square metre), cover (%), and percent botanical composition of Watershed II, Hopland Field Station
Average Observed Predicted, 1973 Vegetative group 1955-1975 1973 (standard error)
March standing crop 93.07 56.70 14.02 (3.17) June standing crop 306.66 401.35 436.80 (51.02) March cover 42.27 72.90 56.16 (8.30) June cover 30.94 66.90 10.71 (6.89) March Aira caryophyllea 0.85 0.00 2.34 (1.09) June Aira caryophyllea 6.55 6.80 3.19 (3.79) March Avena barbata 5.72 6.80 10.88 (2.09) June Avena barbata 7.00 4.40 11.57 (2.64) March Bromus mollis 15.03 16.02 7.90 (5.62) June Bromus mollis 18.26 24.00 8.08 (3.42) March Bromus rigidus 4.50 10.70 1.65 (2.91) June Bromus rigidus 5.93 18.30 6.27 (1.21) March Bromus rubens 0.86 1.60 -0.56 (1.47) June Bromus rubens 0.73 0.10 1.48 (0.57) March Festuca spp. 4.54 17.20 6.29 (2.32) June Festuca spp. 7.63 15.30 15.50 (4.24) March Gastridium ventricosum 0.16 0.00 -0.04 (0.27) June Gastridium ventricosum 1.77 0.60 1.87 (0.61) March Hordeum spp. 0.77 4.40 2.33 (1.34) June Hordeum spp. 1.02 8.00 2.49 (1.04) March Medicago hispida 2.96 0.30 5.16 (1.72) June Medicago hispida 2.89 1.10 0.94 (0.90) March Trifolium spp. 6.37 4.30 -2.22 (3.35) June Trifolium spp. 6.00 2.60 7.76 (1.07) March Vicia spp. 0.66 0.70 1.07 (0.56) June Vicia spp. 3.80 1.00 5.45 (1.89) March Baeria chrysostoma 0.27 0.00 -0.16 (0.06) June Baeria chrysostoma 0.26 0.10 0.05 (0.17) March Daucus pusillus 2.29 0.80 3.79 (1.44) June Daucus pusillus 3.41 0.20 -0.60 (1.20) March Erodium spp. 26.39 20.80 20.07 (6.80) June Erodium spp. 11.89 9.90 27.26 (3.72) March Geranium spp. 5.02 2.10 11.30 (2.07) June Geranium spp. 0.22 0.90 -0.26 (0.18) March Hypochoeris glabra 6.58 3.10 12.34 (3.93) June Hypochoeris glabra 1.71 1.10 0.26 (1.11)
regular precipitation in the Hopland region of Califor- nia. At the March sampling date, Bromus mollis pos- itively correlated with mean maximum temperatures in December, January, and February (Table 3), and attained 31.0W% composition in March of 1958 following a winter drought of only 8 days. Apparently, however, survival of Bromus mollis during the spring period of rapid plant growth requires warm weather with at least periodic inputs of precipitation. Bromus mollis percent composition in June positively correlated with mean maximum temperatures in March, April, and May, and was negatively associated with drought during this same time period (Table 4). The lowest mean maxi- mum temperature (17.7?C) observed during these months, occurred during the low Bromus mollis year of 1967, while Bromus mollis peaked in June 1959 sub- sequent to a mean maximum temperature of 22.7?C during March, April, and May (Pitt 1975).
In summary, Bromus mollis, a very important grass species in the annual type, increases in percent botan- ical composition during years of dry autumn periods following germination, relatively warm winters, and timely inputs of moisture in spring when temperatures become more conducive to rapid plant growth.
Although warm winter temperatures encouraged the survival of Bromus mollis, both Bromus rigidus and Bromus rubens percent composition positively corre- lated with freezing temperatures in October and No- vember (Tables 3 and 4). These 2 grass species at- tained their highest percent botanical composition on the March and June sampling dates of 1957, subse- quent to an October-November period with 34 days below freezing (Pitt 1975). Thirty-four days below freezing represents an exceptionally cold fall, as no other growing season throughout the study produced as much as 22 days during this time period, whereas the mean number of days below freezing in October and November equaled 8.4. Additionally, Bromus mollis and Bromus rigidus displayed opposite re- sponses to cold fall temperatures during and immedi- ately following germination. Although Bromus mollis percent composition negatively correlated with num- ber of days below freezing in October (Table 3), Bro- mus rigidus percent composition attained highs of 18.5 and 15.1% of the vegetative cover at the March and June sampling dates of 1957 following the lowest mean minimum temperature recorded during September, October, and November (Pitt 1975). These opposite
This content downloaded from 130.123.96.63 on Sun, 18 May 2014 21:17:37 PMAll use subject to JSTOR Terms and Conditions
Early Spring 1978 ANNUAL VEGETATION 347
responses of Bromus mollis, Bromus rigidus, and Bro- mus rubens, are undoubtedly results of different phys- iological adaptations which certainly merit further lab- oratory investigation.
Like Bromus rigidus and Bromus rubens, Avena barbata and Festuca spp. percent composition also positively correlated with freezing temperatures dur- ing the early fall period marked by September, Octo- ber, and November (Tables 3 and 4). However, once the fall period ended, freezing during the winter months of December, January, and February nega- tively influenced the percent botanical composition of Avena barbata, Festuca spp., and even Hordeum spp. The change from beneficial to detrimental influences of freezing temperatures occurs some time during No- vember. Although Avena barbata and Festuca spp. percent composition positively correlated with freez- ing temperatures during the combined months of Sep- tember, October, and November, both negatively cor- related with freezing temperatures during November (Tables 3 and 4).
Ratliff and Heady (1962) indicated that Bromus mol- lis initiated growth sooner than other species in the annual type. If so, early freezing temperatures could drastically reduce numbers of Bromus mollis seed- lings. Phenologically, later annual grass species such as Avena barbata and Festuca spp. would then be able to utilize space otherwise occupied by Bromus mollis. However, once these seedlings began to develop, freezing temperatures during the months of Novem- ber, December, January, and February could drasti- cally reduce the numbers of Avena barbata and Fes- tuca spp. seedlings. Indeed, the highest percentage of Aira caryophyllea at the March sampling date oc- curred in 1955 which followed a December, January, February period of 73 days below freezing. Both the observed 6.0% Aira caryophyllea and the number of days below freezing far exceeded these respective val- ues for any other growing season of the watershed study (Pitt 1975). Thus, although consistent, total pre- cipitation following germination in the fall and during the period of rapid spring growth contributes to a grass year, the incidence of freezing temperatures in relation to the sequence of developing grass seedlings primar- ily determines the percent botanical composition of grass species from one growing season to the next.
Influence of weather patterns on legumes
Figure 2 clearly illustrates that annual grasses and clovers responded oppositively to yearly weather pat- terns. In nearly all years of the watershed study, an increase in percent botanical composition of annual grasses accompanied a decline in the percent botanical composition of both Medicago hispida and Trifolium spp. Peak annual grass years of 1959 and 1973 corre- sponded with low clover years, while the peak clover year of 1967 witnessed the lowest observed proportion of annual grasses throughout the study period (Fig. 2).
The early fall period of this 1966-1967 growing season was extremely dry as no rain fell during October fol- lowing a September of only 2.05 mm. The subsequent November, however, produced 239.5 mm of precipi- tation, the second wettest November recorded during the study. This rainfall pattern of arid conditions dur- ing early autumn, followed by moisture in late fall or early winter, discouraged rapid growth of annual grasses and enhanced the percent composition of later- maturing true clovers. This particular weather pattern was masked in the stepwise multiple regression anal- yses as no variable specifically characterized drought during September and October. During the extended period of September, October, and November, how- ever, March clovers negatively correlated with in- creasing numbers of days receiving <6.35 mm of rain. This relationship, combined with the negative corre- lation of March clovers with drought during October and November, suggests true clovers' response to good growing conditions during late autumn. The pos- itive correlations with precipitation in October and November, and increasing mean maximum tempera- tures during November, further emphasize this re- sponse.
Generalizations must be applied cautiously, how- ever, as inconsistent patterns appear in detailed field data (Pitt 1975). Although the percent botanical com- position of true clovers peaked at the March sampling dates of 1957 and 1962 following Septembers of 0.5 and 2.28 mm of precipitation respectively, October 1956 produced 76.9 mm of rain while only 4.32 mm fell during November 1956. These conflicting autumn rainfall regimes do not necessarily refute the general- ization developed above for true clovers, but they cer- tainly point out the inherent pitfalls of regressing vari- able plant species upon interrelated weather variables.
Medicago hispida, at the March sampling date, ap- parently responded to those weather variables detri- mental to the success of annual grasses as a group. Dry autumn periods, particularly drought during Oc- tober and November, and increasing numbers of days receiving <6.35 mm rain in October, both positively correlated with Medicago hispida in March (Table 3). However, an extended dry period throughout the fall months of September, October, and November, dis- couraged maximum botanical composition of Medi- cago hispida in March. Although this plant species positively correlated with freezing temperatures in November, extremely cold Novembers discouraged Medicago hispida as well as annual grasses (Table 3). Virtually no Medicago hispida occurred on the March sampling date of 1957 following a November with 20 days below freezing. Indeed, the success of both Med- icago hispida and Trifolium spp. apparently hinges on mild autumn weather. Extremes of moisture and/or temperature alter the relative composition of annual grasses, particularly Bromus mollis vs. Bromus rigi- dus. Moderate weather patterns, which favor neither
This content downloaded from 130.123.96.63 on Sun, 18 May 2014 21:17:37 PMAll use subject to JSTOR Terms and Conditions

348 M. D. PITT AND H. F. HEADY Ecology, Vol. 59, No. 2
Bromus rigidus nor Bromus mollis, may encourage success of annual clovers. The apparent contradic- tions in the stepwise regression analyses summarizing the impacts of weather variables on true and bur-clo- ver, suggest the dependence of these plant species on moderate weather patterns.
Botanical composition of Medicago hispida and Tri- folium spp. on the June sampling date positively cor- related with spring drought and negatively correlated with inicreasing mean maximum temperatures during the period of rapid plant growth of March, April, and May (Table 4). The burs of Medicago hispida and in- volucres of Trifolium spp. are very persistent and re- main intact on the ground throughout the dry season. Therefore, poor growing conditions such as drought or cool weather during the normal period of rapid plant growth produces a de facto increase in percent botan- ical composition of annual clovers as determined with a 10-point frame.
Plants of annual Vicia spp. were only occasionally sampled during the first 5 yr of study on the watershed. After 1959, however, these plant species commonly abounded in springs and seep areas where late spring and early summer moisture accumulated.
Influence of weather patterns on other nonleguminous forbs
The analyses of nonleguminous forbs as a function of weather patterns produced statistically significant but inconsistent results (Tables 3 and 4). The percent botanical composition of Erodium spp. ebbed during the extremely wet growing season of 1957-1958, and peaked on the March sampling dates of 1966 and 1968 which both followed relatively dry Octobers. Although neither precipitation nor drought during the months immediately following germination entered the regres- sion equation of March Erodium spp. on weather vari- ables, the positive correlations with increasing mean minimum temperatures in November, increasing mean maximum temperatures in October, and increasing mean minimum temperatures in October are all asso- ciated with dry fall conditions at the Hopland Field Station, and suggest the beneficial influence of fall drought on the relative botanical composition of Ero- dium spp. These plant species readily shatter after maturation in early spring and are, therefore, nega- tively correlated with increasing rainfall during the month of April.
Erodium spp. also possess relatively large taproot systems and consequently June Erodium spp. posi- tively correlated with extended drought during March, April, and May. June Erodium spp. peaked in 1968 following the longest spring drought (40 days) record- ed during the study of the watershed (Pitt 1975).
In contrast to Erodium spp., Hypochoeris glabra positively correlated with moisture during the fall months of October and November (Table 3). The con- tribution of Hypochoeris glabra to botanical compo-
sition on 1 March exceeded 15% only during 1963, 1964, and 1965. These 3 growing seasons contained the only October-November periods during which precipitation exceeded 250 mm. Hypochoeris glabra, like Erodium spp., shatters quickly following maturity and therefore never comprised as much as 5% of the vegetation at the June sampling date.
The analyses of Baeria chrysostoma, a botanically minor component of the annual vegetation on the wa- tershed, Daucus pusillus, and Geranium spp., all pro- duced inconsistent results. The percent botanical com- position of Geranium spp., which peaked on the March sampling date, positively correlated with in- creasing mean maximum temperatures in December, January, and February, yet negatively correlated with increasing mean minimum temperatures during this same period. Moreover, March Geranium spp. nega- tively correlated with both increasing numbers of days receiving <6.35 mm of rain in September, October, and November, and increasing total rainfall during October and November (Table 3). Daucus pusillus also displayed contradictory responses to weather pat- terns, as this plant species negatively correlated with increasing mean minimum temperatures in September, October, and November, but positively correlated with increasing mean minimum temperatures in Oc- tober (Table 4). Baeria chrysostoma and Geranium spp. are successional plant species and therefore may depend upon seasonally available disturbed microsites as much as or more than annual weather patterns for maximum botanical composition.
Prediction of yearly variation in annual vegetation
A major, perennial problem facing ranchers in the California annual grassland is the wide discrepancy in standing crop early in the growing season as opposed to late in the growing season. During the mid-winter months of December, January, and February, plant growth is very slow and forage availability is conse- quently limited. In contrast to these mid-winter months, standing crop increases dramatically during and following the rapid period of plant growth begin- ning approximately 1 March at the Hopland Field Sta- tion. If animal units are determined for moderate stocking rates during the mid-winter months, under- utilization necessarily occurs during the period of rap- id plant growth. If animal units are determined for moderate stocking rates during the period of rapid plant growth and high forage availability, these ani- mals must either be supplied supplemental feed or pas- tured elsewhere to avoid overgrazing and weight loss during the period of slow plant growth. Annual jug- gling of animal units to obtain complete utilization of available forage presents a chronic and persistent chal- lenge. The results of multiple regression of standing crop on annual weather patterns provide a useful tech- nique to meet this challenge.
This content downloaded from 130.123.96.63 on Sun, 18 May 2014 21:17:37 PMAll use subject to JSTOR Terms and Conditions

Farlv Snring 1978 ANNUAL VEGETATION 349
The multiple regressions in this study excluded data collected in 1973. Therefore, observed values for standing crop in 1973 can be compared to values pre- dicted for 1973 by the regression equations for stand- ing crop (Table 5). In June of 1973, standing crop equaled 401.3 g/m2, although the regression equation predicted 436.8 g/m2 (r2 = .90). This excellent predic- tion should allow ranchers to adjust stocking rates ac- cordingly and graze just enough animals to obtain complete utilization of the expected forage. However, most ranchers must make decisions concerning animal stocking rates early in the grazing year, certainly be- fore the onset of the rapid period of plant growth be- ginning in late winter to early spring. The regression equation of standing crop in June on weather patterns in Table 4 includes 5 weather variables, 2 of which characterize weather patterns in March and April. Obviously this regression equation becomes useless for managers making decisions no later into the grow- ing season than December or January.
Therefore, these relationships of standing crop and weather patterns are best used in incremental, season- al stages. The first weather variable entering the equa- tion for standing crop in June is mean minimum tem- peratures in November. The resulting equation, June standing crop = 59.21 + 2.34X (mean minimum tem- peratures in November), predicts 332.5 g/m2 for stand- ing crop in June of 1973. This prediction is obtained early in the growing season and compares very well with the actual standing crop on open sites in ungrazed vegetation of 401.3 g/m2 in June of 1973. Although the r2 of the above equation is only .50, the relationship is significant at the .01 level of significance.
Animal units sufficient to fully utilize expected for- age based upon the above equation can then be ad- justed at the end of February, market conditions per- mitting, immediately prior to the period of rapid plant growth. The predicted value of standing crop in June based upon mean minimum temperatures in Novem- ber has been subsequently altered by mean minimum temperatures in December, January, and February, and the number of days receiving <6.35 mm of pre- cipitation in October and November. The regression equation of June standing crop based upon these 3 weather variables, June standing crop = -27.42 + 1.53X (mean minimum temperatures in November) + 1.64 (mean minimum temperatures in December, Jan- uary, and February) -1.06X (the number of days re- ceiving <6.35 mm of precipitation in October and No- vember), predicts 419 g/m2 for standing crop in June of 1973. This prediction is extremely compatible with the actual value of 401.3 g/m2 of standing crop in June of 1973. The r2 of this relationship is .64 and is signif- icant at the .01 level of significance. Animal units are now adjusted accordingly to properly utilize the forage anticipated from this revised prediction.
The results in Table 5 suggest that the regression equations of botanical composition on weather vari-
ables do not greatly aid prediction of the relative pro- portion of plant species from 1 yr to the next. Although many of the predicted values for 1973 botanical com- position are within 2 standard deviations of the ob- served 1973 botanical values, average botanical com- position for the years 1955-1973 often provided closer "predictions" than these regression equations. Cer- tainly, many of the plant species on the Hopland Field Station, including Aira caryophyllea, Avena barbata, Bromus rubens, Gastridium ventricosum, Hordeum spp., Vicia spp., Baeria chrysostoma, Daucus pusil- lus, Geranium spp., and Hypochoeris glabra, com- prise a relatively small component of the annual veg- etation. Even though individual species composition may vary > 100%O from one yr to the next, the absolute change very often represents <5% of the total vege- tative cover. Even annual changes in the percent com- position of clovers, other than in extreme years, are likely more visual than actual. Clover years necessar- ily correspond with poor grass years when grassy veg- etation is reduced and prostrate clover species become more visible.
Therefore, the regression equations are most useful for those plant species which comprise a relatively large proportion of the annual vegetation, particularly during years of extreme variability. Erodium spp. comprised 48. 1% of the vegetative cover on 1 March 1966, but only 14.0% by the following June (Pitt 1975). Erodium spp. provides nutritious forage early in the growing season, but rapidly disintegrates after matu- rity. Therefore, filaree years often produce serious shortages of nutritious forage for animals grazing with- out supplemental feed to the end of the growing sea- son. Predicting these filaree years when supplemental hay may be necessary, becomes an important mana- gerial tool. The regression equation for the percent botanical composition of Erodium spp. in March, March Erodium spp. = -120.9 + 11.7X (mean mini- mum temperatures in November) + 1.3X (mean max- imum temperatures in October) + 0.4X (precipitation in December, January, and February) -- 20.4X (mean minimum temperatures in October and November) + 9.8X (mean minimum temperatures in October), pre- dicts 20.07% which is virtually identical with the actual value of 20.8% botanical composition of March Ero- dium spp. in 1973. This very good prediction of a fil- aree year becomes particularly important, in terms of supplemental feed, if associated predictions for total standing crop are low.
Bromus mollis, the second most abundant plant spe- cies on the watershed, averaged 15.03% of the vege- tative cover on the March first sampling date (Table 5). This average value much more closely approxi- mated the observed 1973 value of 16.02% than did the regression equation which predicted 7.90%. Even though the percent botanical composition of Bromus mollis ranged from 5.3 to 35.4 on the watershed, the average value of Bromus mollis may be as useful as
This content downloaded from 130.123.96.63 on Sun, 18 May 2014 21:17:37 PMAll use subject to JSTOR Terms and Conditions

350 M. D. PITT AND H. F. HEADY Ecology, Vol. 59, No. 2
the regression equation for predicting botanical com- position during any particular growing season for 2 reasons: (1) the standard error of the regression equa- tion, 5.62, is nearly as large as the predicted value of 7.90; and (2) variability in the percent botanical com- position of Bromus mollis is often offset by variability in the botanical composition of Bromus rigidus or oth- er annual grasses. The total proportion of annual grasses often assumes more importance to range man- agers than the proportion of any particular grass spe- cies. Unfortuantely, successful prediction of total an- nual grasses based upon regression equations is very difficult because of variable grass species response to the same weather patterns (Duncan and Woodmansee 1975, Pitt 1975).
The regression analyses presented in this paper gen- erally support both qualitative and quantitative con- clusions of previous workers in the annual type, par- ticularly in terms of standing crop, grass, clover, and filaree years. Correlations of specific annual species with weather variables have provided more detailed understanding of the impacts of weather patterns on annual vegetation.
Even though the regression equations, particularly standing crop, apply specifically to only the immediate Hopland region, the concepts are applicable through- out the annual type and need to be further developed. The weather variables are easily measured and pro- vide reasonable estimates of standing crop throughout the growing season. Such estimates are extremely im- portant for managerial units flexible enough to alter animal units during the course of a growing season and/or from one year to the next.
LITERATURE CITED
Bentley, J. R., and M. W. Talbot. 1948. Annual-plant veg- etation of the California foothills as related to range man- agement. Ecology 29:72-79.
. 1951. Efficient use of annual plants on cattle ranges in the California foothills. United States Department of Agriculture Circular 870.
Biswell, H. H. 1956. Ecology of California grasslands. Jour- nal of Range Management 9:19-24.
Brown, D. 1954. Methods of surveying and measuring veg- etation. Commonwealth Bureau of Pastures Field Crops Great Britain Bulletin 42.
Burgy, R. H., and Z. G. Papazafiriou. 1974. Vegetative mar- agement and water yield relationships. Pages 315-331, in Proceedings, 3rd International Seminar for Hydrology Pro- fessors, Purdue University, 18-30 July 1971. Purdue Uni- versity Press, Lafayette, Indiana, USA.
Donald, C. M. 1963. Competition among crop and pasture plants. Pages 1-118, in A. G. Norman, editor. Advances in Agronomy, Volume 15, Academic Press, New York, New York, USA.
Duncan, D. A., and R. G. Woodmansee. 1975. Forecasting forage yield from precipitation in California's annual range- land. Journal of Range Management 28:327-329.
Gerakis, P. A., F. P. Guerrero, and W. A. Williams. 1975. Growth, water relations, and nutrition of three grassland annuals as affected by drought. Journal of Applied Ecology 12: 125-135.
Gowans, K. D. 1958. Soil survey of the Hopland Field Sta- tion. California Agricultural Experimental Station. Bulle- tin.
Heady, H. F. 1956. Evaluation and measurement of the Cal- ifornia annual type. Journal of Range Management 9:25- 27.
. 1957. Effect of cages on yield and composition in the California annual type. Journal of Range Management 10:175-177.
. 1958. Vegetational changes in the California annual type. Ecology 39:402-415.
Hooper, J. F., and H. F. Heady. 1970. An economic anal- ysis of optimum rates of grazing in the California annual- type grassland. Journal of Range Management 23:307-311.
Janes, E. B. 1969. Botanical composition and productivity in the California annual grassland in relation to rainfall. Master's thesis. University of California, Berkeley, Cali- fornia, USA.
McKell, C. M., J. Major, and E. R. Perrier. 1959. Annual- range fertilization in relation to soil moisture depletion. Journal of Range Management 12:189-193.
McNaughton, S. J. 1968. Structure and function in Califor- nia grasslands. Ecology 49:962-972.
Munz, P. A., and D. D. Keck. 1965. A California flora. University of California Press, Berkeley and Los Angeles, California, USA.
Murphy, A. H. 1970. Predicted forage yield based on fall precipitation in California annual grasslands. Journal of Range Management 23:363-365.
Naveh, Z. 1967. Mediterranean ecosystems and vegetation types in California and Israel. Ecology 48:445-459.
Pitt, M. D. 1975. The effects of site, season, weather pat- terns, grazing, and brush conversion on annual vegetation, Watershed II, Hopland Field Station. Doctorial thesis, University of California, Berkeley, California, USA.
Ratliff, R. D., and H. F. Heady. 1962. Seasonal changes in herbage weight in an annual grass community. Journal of Range Management 15:146-149.
Rossiter, R. C. 1966. Ecology of the Mediterranean annual- type pasture. Advances in Agronomy 18:1-56.
Stern, W. R. 1965. The effect of density on the performance of individual plants in subterranean clover swards. Austra- lian Journal of Agricultural Research 16:541-555.
Stern, W. R., and C. M. Donald. 1962. Light relationships in grass-clover swards. Australian Journal of Agricultural Research 13:599-614.
Talbot, M. W., and H. H. Biswell. 1942. The forage crop and its management. California Agricultural Experimental Station Bulletin 663:13-49.
Talbot, M. W., H. H. Biswell, and A. L. Hormay. 1939. Fluctuations in the annual vegetation of California. Ecol- ogy 20:394-402.
Trumble, H. C., and E. A. Cornish. 1936. The influence of rainfall on the yield of a natural pasture. Journal of the Council for Scientific and Industrial Research Australia 9:19-28.
This content downloaded from 130.123.96.63 on Sun, 18 May 2014 21:17:37 PMAll use subject to JSTOR Terms and Conditions


