1913 IOS Press Use of basis images for detection and ... · Use of basis images for detection and...
11
Use of basis images for detection and classification of celiac disease Edward J. Ciaccio a,∗ , Christina A. Tennyson a , Govind Bhagat a,b , Suzanne K. Lewis a and Peter H. Green a a Department of Medicine–Celiac Disease Center, Columbia University, New York, USA b Department of Pathology and Cell Biology, Columbia University, New York, USA Abstract. Celiac disease commonly occurs in approximately 1% of populations, but it can be difficult to diagnose. The standard method to diagnose celiac disease includes analysis of endoscopy images of the small intestinal mucosa to detect presence of villous atrophy, which can be subtle. We have devised a means to improve the image-based detection of villous atrophy and other abnormality in videocapsule endoscopy by means of incorporating basis images. Basis images were extracted from a series of 200 consecutive image frames acquired over 100 seconds at the level of the duodenal bulb in 13 celiac patients and in 13 controls. They were converted from color to 256 grayscale levels (gsl; 0 = black, 255 = white). Eight basis images were used for analysis. A histogram was constructed for each basis image, and the mean and standard deviation of the histogram values were tabulated. The significance of the difference in histogram mean level for celiacs versus controls was determined. Then the histogram mean was plotted versus the standard deviation, separately for all eight basis images, and also averaged for all bases combined. The mean histogram level for celiacs was 127.59+6.05 gsl versus 129.25+5.53 gsl for controls (p< 0.05). Thus celiac basis images tended to be darker and also more variable as compared with controls. For nonlinear classification, using the average of combined basis images, the sensitivity was 84.6% while the specificity was 92.3%. Using the single most important basis image for nonlinear classification, the sensitivity was 84.6% while the specificity was 76.9%. Construction of basis images can be useful to condense videocapsule image series into salient information, for detection of differences in grayscale level mean and variation in celiac versus control image series, and for classification of celiac versus control videoclips with nonlinear discriminant functions. Keywords: Basis images, celiac disease, classification, histogram, nonlinear discriminant function 1. Introduction Celiac disease is a common malady that affects approximately 1% of populations worldwide [1]. There is no cure for the disease, however the treatment, maintenance of a gluten-free diet, can enable the patient to live a normal life. Typically, the disease is difficult to diagnosis because the symptoms can be occult, and it can be even more difficult to diagnose in young male patients [2]. A major endoscopic and histopathologic feature is the presence of villous atrophy of the patient’s small intestine, which causes malabsorption, but not all patients manifest severe degrees of mucosal alterations [3]. The presence of villous atrophy may be patchy and subtle, and it can occur at distal ∗ Corresponding author: Edward J. Ciaccio, Department of Medicine–Celiac Disease Center, Columbia University, New York, USA. Tel.: 212 305 5447; Fax: 212 342 0447; E-mail: [email protected]. 0959-2989/14/$27.50 © 2014 – IOS Press and the authors. DOI 10.3233/BME-141000 IOS Press Bio-Medical Materials and Engineering 24 (2014) 1913–1923 This article is published with Open Access and distributed under the terms of the Creative Commons Attribution and Non-Commercial License. 1913
Transcript of 1913 IOS Press Use of basis images for detection and ... · Use of basis images for detection and...
Use of basis images for detection and
classification of celiac disease
Edward J. Ciaccio
a,∗, Christina A. Tennyson
a, Govind Bhagat
a,b, Suzanne K. Lewis
a
and Peter H. Green
a
a Department of Medicine–Celiac Disease Center, Columbia University, New York, USA
b Department of Pathology and Cell Biology, Columbia University, New York, USA
Abstract. Celiac disease commonly occurs in approximately 1% of populations, but it can be difficult to diagnose. The standard method to diagnose celiac disease includes analysis of endoscopy images of the small intestinal mucosa to detect presence of villous atrophy, which can be subtle. We have devised a means to improve the image-based detection of villous atrophy and other abnormality in videocapsule endoscopy by means of incorporating basis images. Basis images were extracted from a series of 200 consecutive image frames acquired over 100 seconds at the level of the duodenal bulb in 13 celiac patients and in 13 controls. They were converted from color to 256 grayscale levels (gsl; 0 = black, 255 = white). Eight basis images were used for analysis. A histogram was constructed for each basis image, and the mean and standard deviation of the histogram values were tabulated. The significance of the difference in histogram mean level for celiacs versus controls was determined. Then the histogram mean was plotted versus the standard deviation, separately for all eight basis images, and also averaged for all bases combined. The mean histogram level for celiacs was 127.59+6.05 gsl versus 129.25+5.53 gsl for controls (p< 0.05). Thus celiac basis images tended to be darker and also more variable as compared with controls. For nonlinear classification, using the average of combined basis images, the sensitivity was 84.6% while the specificity was 92.3%. Using the single most important basis image for nonlinear classification, the sensitivity was 84.6% while the specificity was 76.9%. Construction of basis images can be useful to condense videocapsule image series into salient information, for detection of differences in grayscale level mean and variation in celiac versus control image series, and for classification of celiac versus control videoclips with nonlinear discriminant functions.
Keywords: Basis images, celiac disease, classification, histogram, nonlinear discriminant function
1. Introduction
Celiac disease is a common malady that affects approximately 1% of populations worldwide [1].
There is no cure for the disease, however the treatment, maintenance of a gluten-free diet, can enable
the patient to live a normal life. Typically, the disease is difficult to diagnosis because the symptoms
can be occult, and it can be even more difficult to diagnose in young male patients [2]. A major
endoscopic and histopathologic feature is the presence of villous atrophy of the patient’s small
intestine, which causes malabsorption, but not all patients manifest severe degrees of mucosal
alterations [3]. The presence of villous atrophy may be patchy and subtle, and it can occur at distal
∗Corresponding author: Edward J. Ciaccio, Department of Medicine–Celiac Disease Center, Columbia University, New
York, USA. Tel.: 212 305 5447; Fax: 212 342 0447; E-mail: [email protected].
0959-2989/14/$27.50 © 2014 – IOS Press and the authors.
DOI 10.3233/BME-141000IOS Press
Bio-Medical Materials and Engineering 24 (2014) 1913–1923
This article is published with Open Access and distributed under the terms of the Creative Commons Attribution and Non-Commercial License.
1913
portions of the small intestine where a standard endoscope cannot reach. Villous atrophy may persist
even after treatment with a gluten-free diet [4].
More recently, videocapsule endoscopy has been used in an effort to detect villous atrophy [5–11].
The videocapsule has the capability to image the small intestine at all levels. The frame rate for this
camera device is currently 2 images per second. Some drawbacks to the method include the fact that
the camera angle and lighting cannot currently be determined manually. Thus many of the
automatically acquired images may be blurred, they may have poor lighting, and/or they may provide
oblique angles with respect to the mucosal surface of the small intestine. Moreover, extraneous fluids
can cloud the view of the small intestinal mucosa during image acquisition. It can therefore be a
challenge to use these images for the detection of villous atrophy.
It would be desirable to develop an automated method to quantitate videocapsule data, which is
robust to presence of extraneous substances and poor camera view. Such a method would encompass
the entire image series of a videoclip in such a way that salient information would be retained, while
random noise and extraneous features would be removed. In previous work, a new spectral estimator
(NSE) and transform have been developed, which have since been applied to videocapsule endoscopy
[9]. The transform works as follows. A series of images are analyzed, typically 200 frames (100
seconds). The ensemble average of image frames is calculated at different periods. For example, if
every 10th frame is averaged, then the period for averaging, at a frame rate of 2 per second, is 5
seconds. Frames are averaged with different periodicities, in the range of approximately 1 second
periods (every 2nd
frame is averaged) to 20 second periods (every 40th frame is averaged). The power
of each resulting ensemble mean image is plotted versus period, or versus frequency (= 1/period). If
the images are correlated at a particular period for averaging, they will reinforce, so that the power in
the ensemble average is greater. Thus these ensemble averages are basis images which can be used for
power spectral estimation, and also for reconstruction of the original image.
In this study, basis images are computed for a celiac versus control population. Since the basis
images only retain the salient information that is present at the period used for ensemble averaging,
extraneous features and random noise are removed. By comparing celiac versus control basis images,
we hypothesized that differences would be evident due to the changes that would be expected in the
basis images. In celiacs, abnormalities in the form of villous atrophy, fissuring, and mottled
appearance in videoclips would be expected to be manifested as darker and more varied basis images,
as compared to control basis images which would be expected to be less varied and more uniform and
bright.
2. Materials and methods
2.1. Acquisition and preprocessing of clinical data
Videocapsule endoscopic images were obtained after patients provided written informed consent.
The indications for videocapsule endoscopy included suspected bowel disease, obscure bleeding, iron-
deficient anemia, and chronic diarrhea. Excluded from analysis were children, women who were
pregnant, and patients with a history of intestinal obstruction, those who had an implanted cardiac
pacemaker, and patients with recent use of non-steroidal anti-inflammatory drugs (NSAIDs). Only
those videocapsule endoscopy studies in which the videocapsule reached the colon were included in
the analysis. Videocapsule images were analyzed retrospectively from data that had already been
acquired, and was approved by the Institutional Review Board of Columbia University Medical Center.
E.J. Ciaccio et al. / Use of basis images for detection and classification of celiac disease1914
The imaging camera used was the PillCamSB2 videocapsule (Given Imaging, Yoqneam, Israel).
Besides videocapsule, there was a recorder unit, real-time viewer, battery pack, antenna lead set,
recorder unit cradle and harness, battery charger, and real-time viewer cable [12]. The capsule itself
measures 26 × 11 millimeters in dimension. The capsule includes a light source which is used to
illuminate the luminal wall in line with the camera direction. Each patient swallowed the PillCam SB2
videocapsule with radio transmitter after a 12 hour fast, and wore a small portable recording device
during the day of the procedure. The recorder received the images that were transmitted by
videocapsule as it passed through the gastrointestinal tract. The capsule was swallowed in early
morning with approximately 200 milliliters of water, and investigation was completed either upon
arrival of the capsule at the cecum, or after 8 hours. Subjects were allowed to drink water two hours
after ingesting the capsule, and to eat a light meal after four hours. The videocapsule movie clips were
reviewed and interpreted by an experienced gastroenterologist using an HIPAA-compliant PC-based
console equipped with analysis software. The console was also used to export videos for quantitation.
Retrospective data were obtained from 13 control patients, and from 13 celiac patients on a regular
diet or within 3 months of starting a gluten-free diet. In the celiac patients, the diagnostic biopsy
revealed Marsh grade II-IIIC lesions [13]. All patients were evaluated at Columbia University Medical
Center, New York, from May 1, 2008 to July 31, 2009. The videocapsule frame rate was set to acquire
two digital images per second with the image dimension being 576 × 576 pixels.
Videoclips of length 200 image frames (100 seconds) were obtained from one location in the small
intestine of each patient. The region was the duodenal bulb. The recorded digital information was
downloaded to the computer console. The sequence of images was extracted from each videoclip
using for Matlab (ver. 7.7, The MathWorks, 2008, Natick, MA).The videocapsule endoscopic images
of celiac patients that were used for analysis were taken from areas that appeared abnormal. All image
sequences used for analysis were selected to have minimal presence of extraneous substances
including air bubbles and opaque fluids. From the portions of each videoclip meeting these criteria, the
200 image sequence used for analysis was randomly extracted. The actual image resolution depended
on the camera–lumen distance. Each image obtained from the videoclip was initially in RGB color
format. For simplicity in processing, the extracted images were converted to 256 grayscale levels (0 =
black, 255 = white), and stored in Portable Gray Map (pgm) specification via a commercial software
program (Matlab ver. R2009b, The MathWorks, Natick MA). The preprocessed images were viewed
using the ImageJ software program [14].
2.2. Quantitative analysis
Construction of the new spectral estimator or NSE basis has been described in detail elsewhere [8].
Videoclips of 200 image sequence length (100 seconds) were used for analysis. All videoclips were
obtained from the proximal duodenum (duodenal bulb). Basis images were constructed from these
videoclips in the range of period for averaging = 3 images (1.5 seconds) to period for averaging = 10
images (5 seconds). Thus eight basis images were constructed for each videoclip. The basis images
were analyzed with the ImageJ software program [14]. The ImageJ histogram was constructed, and the
mean and standard deviation for the histogram of each basis image was recorded. This was repeated
for all eight basis images, for all 13 celiac patient videoclips and 13 control patient videoclips. Thus 13
× 8 = 104 basis images were analyzed from celiac patients and 104 basis images were analyzed from
control patients in total.
E.J. Ciaccio et al. / Use of basis images for detection and classification of celiac disease 1915
The unpaired t-test was used to determine the significance of the difference in the mean histogram
level in celiacs versus controls (SigmaPlot 2004 for Windows Ver. 9.01, Systat Software, MedCalc
Statistical Software 2008, ver. 9.5 Belgium). The values of mean and standard deviation in histogram
level were also plotted for each basis image. For example, for basis image 1, for a particular celiac
patient videoclip, the histogram mean value was plotted versus the histogram standard deviation value
as measured by ImageJ. This was repeated for all 13 celiac patient videoclips. Then the same
procedure was used to plot mean versus standard deviation in histogram level for all control patients.
The celiacs were differentiated from controls by using a different color in the scatterplot. The same
procedure was repeated for all eight basis images, with separate scatterplots used for each. Also, celiac
histogram values were plotted versus controls for the mean from all eight basis images. A nonlinear
discriminant function was used to best separate celiac from control points in each scatterplot. The
sensitivity and specificity for classification were calculated. The sensitivity was calculated as the
number of celiac points correctly classified versus all celiac points in the scatterplot. The specificity
was calculated as the number of control points correctly classified versus all control points in the
scatterplot.
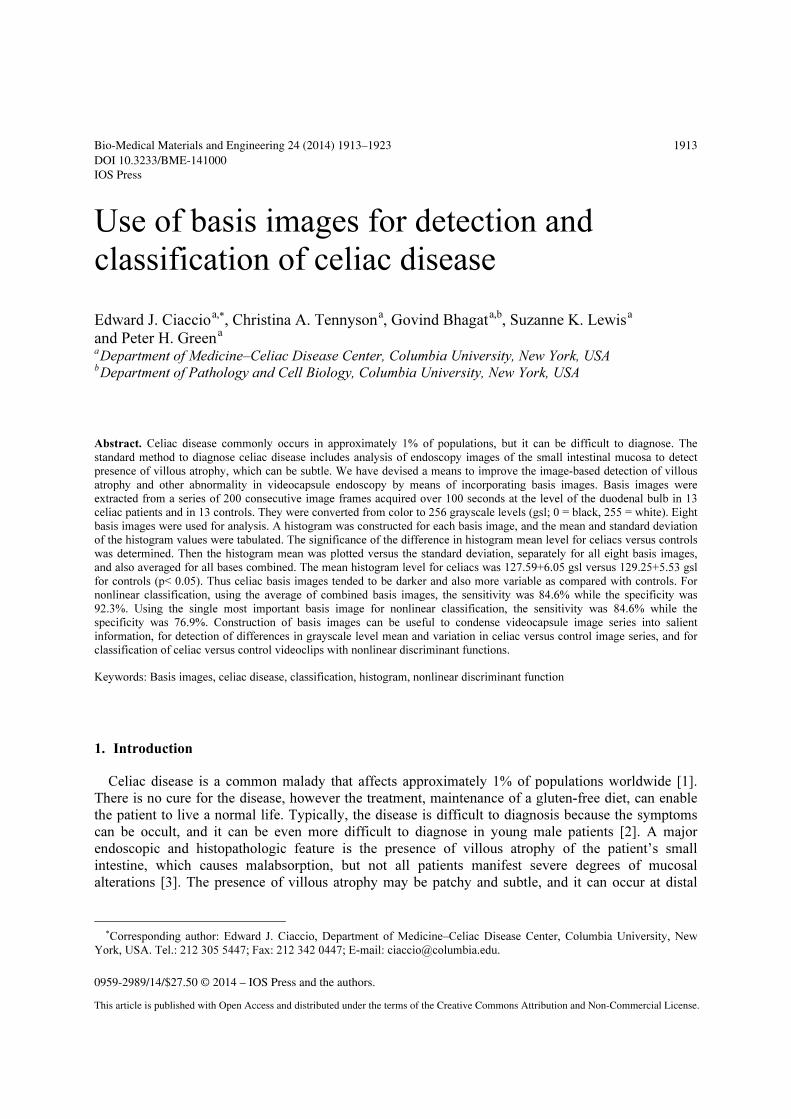
Fig. 1. Grayscale images from a celiac patient at the level of the proximal duodenum. These photos were converted from RGB color images. The timing between photos is approximately 25 seconds (50 image frames at rate of 2 frames per second).
E.J. Ciaccio et al. / Use of basis images for detection and classification of celiac disease1916
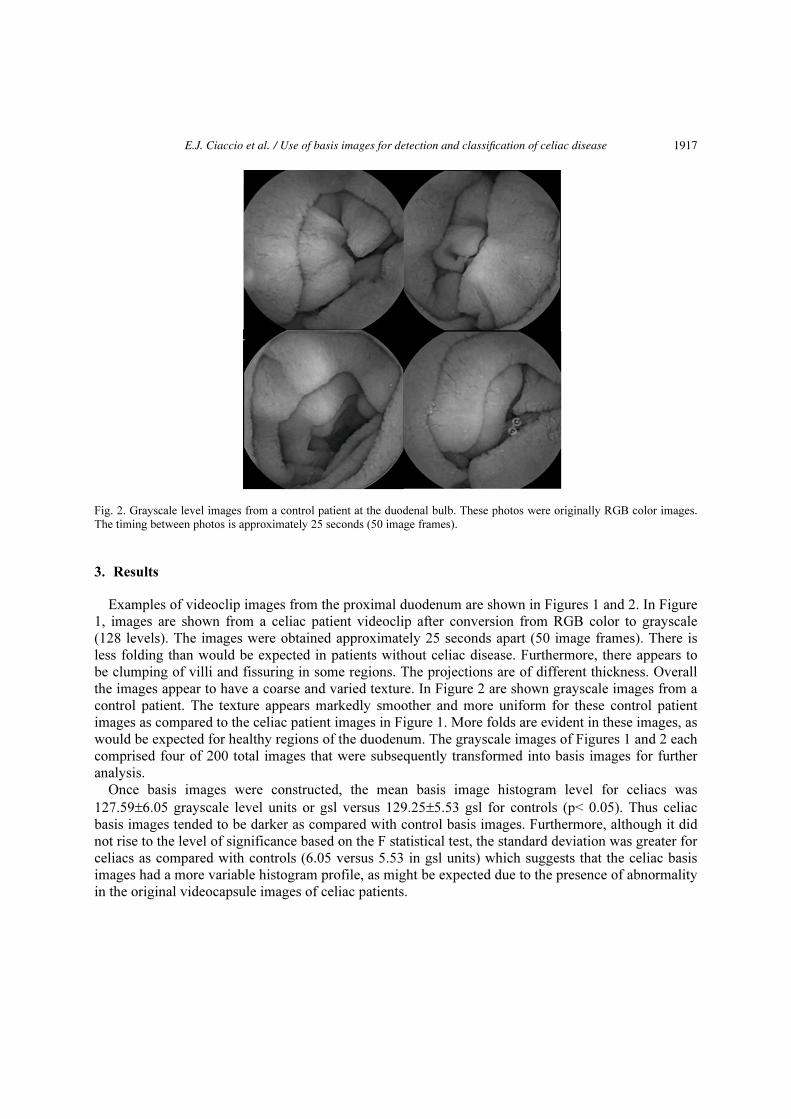
Fig. 2. Grayscale level images from a control patient at the duodenal bulb. These photos were originally RGB color images. The timing between photos is approximately 25 seconds (50 image frames).
3. Results
Examples of videoclip images from the proximal duodenum are shown in Figures 1 and 2. In Figure
1, images are shown from a celiac patient videoclip after conversion from RGB color to grayscale
(128 levels). The images were obtained approximately 25 seconds apart (50 image frames). There is
less folding than would be expected in patients without celiac disease. Furthermore, there appears to
be clumping of villi and fissuring in some regions. The projections are of different thickness. Overall
the images appear to have a coarse and varied texture. In Figure 2 are shown grayscale images from a
control patient. The texture appears markedly smoother and more uniform for these control patient
images as compared to the celiac patient images in Figure 1. More folds are evident in these images, as
would be expected for healthy regions of the duodenum. The grayscale images of Figures 1 and 2 each
comprised four of 200 total images that were subsequently transformed into basis images for further
analysis.
Once basis images were constructed, the mean basis image histogram level for celiacs was
127.59±6.05 grayscale level units or gsl versus 129.25±5.53 gsl for controls (p< 0.05). Thus celiac
basis images tended to be darker as compared with control basis images. Furthermore, although it did
not rise to the level of significance based on the F statistical test, the standard deviation was greater for
celiacs as compared with controls (6.05 versus 5.53 in gsl units) which suggests that the celiac basis
images had a more variable histogram profile, as might be expected due to the presence of abnormality
in the original videocapsule images of celiac patients.
E.J. Ciaccio et al. / Use of basis images for detection and classification of celiac disease 1917
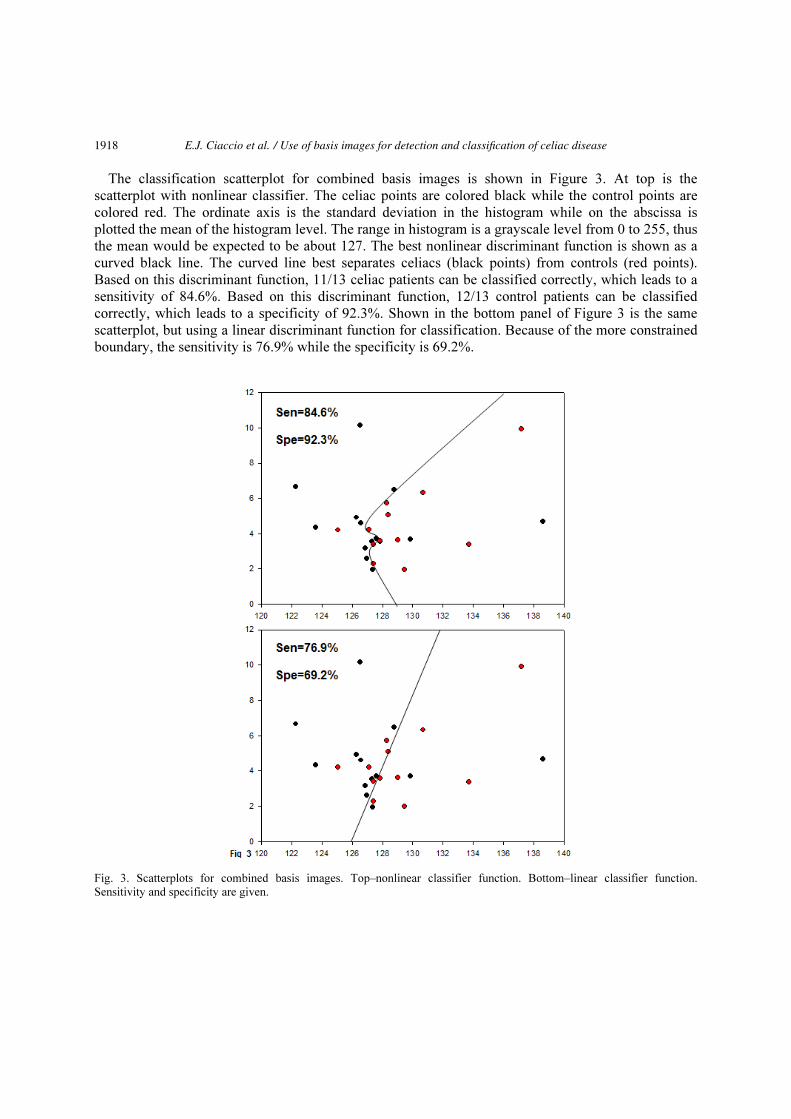
The classification scatterplot for combined basis images is shown in Figure 3. At top is the
scatterplot with nonlinear classifier. The celiac points are colored black while the control points are
colored red. The ordinate axis is the standard deviation in the histogram while on the abscissa is
plotted the mean of the histogram level. The range in histogram is a grayscale level from 0 to 255, thus
the mean would be expected to be about 127. The best nonlinear discriminant function is shown as a
curved black line. The curved line best separates celiacs (black points) from controls (red points).
Based on this discriminant function, 11/13 celiac patients can be classified correctly, which leads to a
sensitivity of 84.6%. Based on this discriminant function, 12/13 control patients can be classified
correctly, which leads to a specificity of 92.3%. Shown in the bottom panel of Figure 3 is the same
scatterplot, but using a linear discriminant function for classification. Because of the more constrained
boundary, the sensitivity is 76.9% while the specificity is 69.2%.
Fig. 3. Scatterplots for combined basis images. Top–nonlinear classifier function. Bottom–linear classifier function. Sensitivity and specificity are given.
E.J. Ciaccio et al. / Use of basis images for detection and classification of celiac disease1918

Fig. 4. Basis images 1 to 4 are plotted for celiac videoclips (black) and control videoclips (red). The videoclips were taken from the level of the duodenal bulb. Nonlinear discriminant functions are shown for classification.
Fig. 5. Basis images 5 through 8 are plotted for celiac videoclips (black) and control videoclips (red). The best nonlinear discriminant functions are shown, and the resulting sensitivity and specificity are printed at top right in each panel.
E.J. Ciaccio et al. / Use of basis images for detection and classification of celiac disease 1919
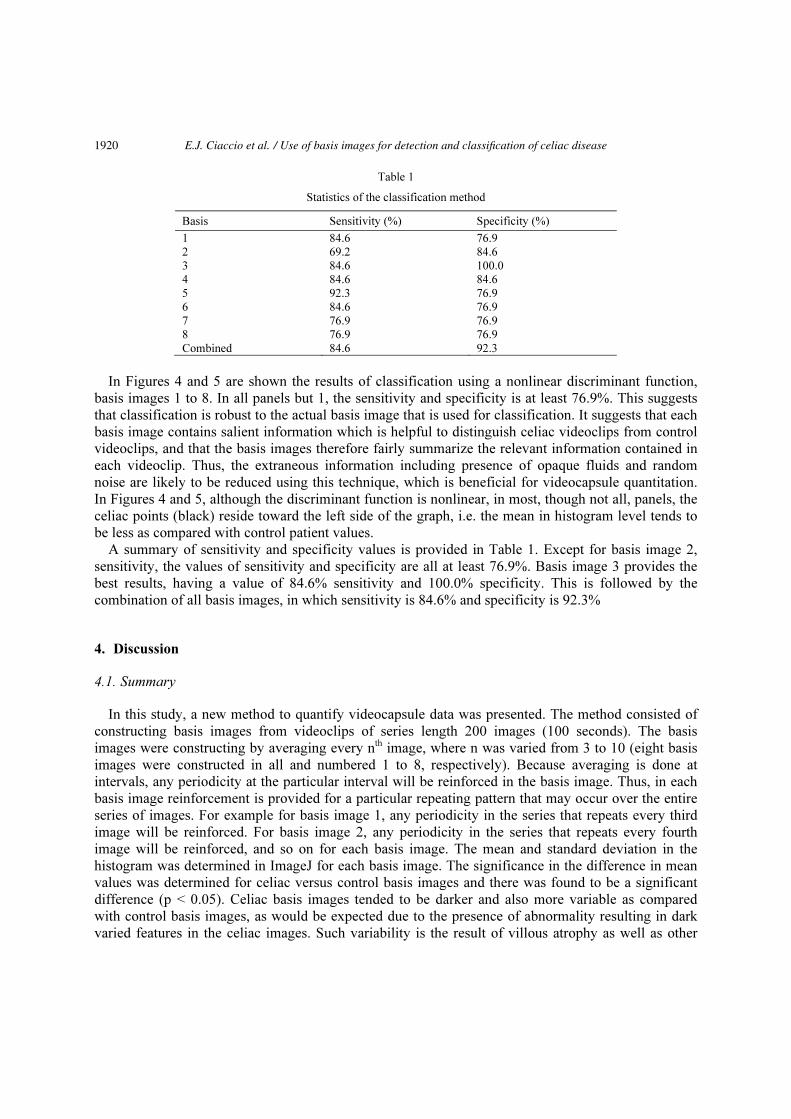
Table 1
Statistics of the classification method
Basis Sensitivity (%) Specificity (%)
1 84.6 76.9 2 69.2 84.6 3 84.6 100.0 4 84.6 84.6 5 92.3 76.9 6 84.6 76.9 7 76.9 76.9 8 76.9 76.9 Combined 84.6 92.3
In Figures 4 and 5 are shown the results of classification using a nonlinear discriminant function,
basis images 1 to 8. In all panels but 1, the sensitivity and specificity is at least 76.9%. This suggests
that classification is robust to the actual basis image that is used for classification. It suggests that each
basis image contains salient information which is helpful to distinguish celiac videoclips from control
videoclips, and that the basis images therefore fairly summarize the relevant information contained in
each videoclip. Thus, the extraneous information including presence of opaque fluids and random
noise are likely to be reduced using this technique, which is beneficial for videocapsule quantitation.
In Figures 4 and 5, although the discriminant function is nonlinear, in most, though not all, panels, the
celiac points (black) reside toward the left side of the graph, i.e. the mean in histogram level tends to
be less as compared with control patient values.
A summary of sensitivity and specificity values is provided in Table 1. Except for basis image 2,
sensitivity, the values of sensitivity and specificity are all at least 76.9%. Basis image 3 provides the
best results, having a value of 84.6% sensitivity and 100.0% specificity. This is followed by the
combination of all basis images, in which sensitivity is 84.6% and specificity is 92.3%
4. Discussion
4.1. Summary
In this study, a new method to quantify videocapsule data was presented. The method consisted of
constructing basis images from videoclips of series length 200 images (100 seconds). The basis
images were constructing by averaging every nth image, where n was varied from 3 to 10 (eight basis
images were constructed in all and numbered 1 to 8, respectively). Because averaging is done at
intervals, any periodicity at the particular interval will be reinforced in the basis image. Thus, in each
basis image reinforcement is provided for a particular repeating pattern that may occur over the entire
series of images. For example for basis image 1, any periodicity in the series that repeats every third
image will be reinforced. For basis image 2, any periodicity in the series that repeats every fourth
image will be reinforced, and so on for each basis image. The mean and standard deviation in the
histogram was determined in ImageJ for each basis image. The significance in the difference in mean
values was determined for celiac versus control basis images and there was found to be a significant
difference (p < 0.05). Celiac basis images tended to be darker and also more variable as compared
with control basis images, as would be expected due to the presence of abnormality resulting in dark
varied features in the celiac images. Such variability is the result of villous atrophy as well as other
E.J. Ciaccio et al. / Use of basis images for detection and classification of celiac disease1920
abnormality including fissuring of the mucosa, and a mottled appearance that might result from
clumping of the individual villi.
The histogram values of the basis images were also used for nonlinear classification. Except for one
value, the sensitivity and specificity levels were at least 76.9% for all basis images individually as well
as for a classification using combined basis image. The best basis image for classification was #3, with
a value of 84.6% for sensitivity and 100.0% for specificity, and the pooled basis images, for which
sensitivity was 84.6% and specificity was 92.3%. Thus, it can be useful to transform each videoclip
image series into basis images for classification into celiacs for controls. Although not done in this
study, this work could be extended by mapping the entire small intestine using basis images. Because
they are robust to extraneous fluids and random features, it would be possible to use these specialized,
salient images in the presence of opaque fluids and when camera angle is poor. The randomness of the
extraneous features would tend to be cancelled out during formation of basis images, so that they
would not interfere with statistical consideration or with classification.
4.2. Clinical correlates
It is possible using videocapsule endoscopy to determine the extent of mucosal atrophy in celiac
disease [15]. A benefit of using videocapsule endoscopy is its ability to visualize the entire small
bowel [16]. Mucosal abnormalities can be observed with videocapsule endoscopy in patients with both
nonresponsive and uncomplicated celiac disease [17]. The videocapsule images can be used to detect
complications of patients with nonresponsive celiac disease, which might not be possible with
conventional endoscopy [17]. Recently, a scoring index for small bowel mucosal inflammatory change
has been developed using videocapsule endoscopy images [18]. An evaluation of small-bowel
cleansing should be incorporated into the videocapsule endoscopy report, as the degree of cleanliness
can greatly affect image quality [19]. Although faster reading mode may be somewhat useful for
quicker clinical and manually-derived analysis of capsule videos [20], the methodology that has been
presented in this study works by automated computer algorithm, and therefore can be calculated in a
few seconds without introducing observer bias. Therefore, based on clinical considerations,
videocapsule endoscopy is a promising tool for analysis and screening of celiac disease, and the use of
quantitation can greatly enhance the analysis by enabling fast reduction times that are robust to
extraneous image features.
4.3. Limitations
Although in this study, data was pooled from the proximal duodenum in 13 celiac patients and in 13
control patients, for completeness, other small intestinal levels could be checked to determine the
statistical and classification properties of the basis images. For example, videoclips acquired at the
anatomic levels of distal duodenum, jejunum, and ileum could also be converted to basis images, and
the bases used for statistical comparison and for classification at these levels. Differences may exist
between anatomical levels, in part because there may be differences in pathology at different levels,
including differences in the quality and character of villous atrophy, changes in mucosal folds,
fissuring, and mosaic patterns. Moreover, for greater statistical power, the same tests should be done
using a greater pooled data set with more celiac and control patients. Although eight basis images
were studied for this analysis, additional basis images can be constructed and used for more detailed
analysis. Use of other basis images might show additional improved significances and classifications
that can be used for quantitating videocapsule data in celiacs versus controls.
E.J. Ciaccio et al. / Use of basis images for detection and classification of celiac disease 1921
5. Conclusion
Videocapsule endoscopy is a noninvasive method helpful for detecting small intestinal villous
atrophy throughout the small intestine. It is possible to automate the detection process by converting
the original color videoclip images to a series of grayscale basis images with retention of salient
information. By analyzing the statistics of the histogram of these basis images, it is possible to
quantify the original series in such a way that celiac images with villous atrophy can be distinguished
from control patient images.
Acknowledgement
The implementation of this study was made possible in part with a grant from the Celiac Sprue
Association Peer Review Research Grant Program.
References
[1] K. Barada, R.H. Habib, A. Malli, J.G. Hashash, H. Halawi, K. Maasri, A. Tawil, F. Mourad, A.I. Sharara, A. Soweid, I. Sukkarieh, Z. Chakhachiro, M. Jabbour, A. Fasano, D. Santora, C. Arguelles, J.A. Murray and P.H. Green, Prediction of celiac disease at endoscopy, Endoscopy 46 (2014), 110–119.
[2] R. Dixit, B. Lebwohl, J.F. Ludvigsson, S.K. Lewis, N. Rizkalla-Reilly and P.H. Green, Celiac disease is diagnosed less frequently in young adult males, Dig. Dis. Sci. 59 (2014), 1509–1512.
[3] B. Lebwohl, K. Michaëlsson, P.H. Green and J.F. Ludvigsson, Persistent mucosal damage and risk of fracture in celiac disease, J. Clin. Endocrinol. Metab. 99 (2014), 609–616.
[4] B. Lebwohl, J.A. Murray, A. Rubio-Tapia, P.H. Green and J.F. Ludvigsson, Predictors of persistent villous atrophy in coeliac disease: A population-based study, Aliment. Pharmacol. Ther. 39 (2014), 488–495.
[5] E.J. Ciaccio, C.A. Tennyson, G. Bhagat, S.K. Lewis and P.H. Green, Implementation of a polling protocol for predicting celiac disease in videocapsule analysis, World J. Gastrointest. Endosc. 5 (2013), 313–322
[6] M.S. Chang, M. Rubin, S.K. Lewis and P.H. Green, Diagnosing celiac disease by video capsule endoscopy (VCE) when esophagogastroduodenoscopy (EGD) and biopsy is unable to provide a diagnosis: A case series, BMC Gastroenterol. 12 (2012), 90.
[7] E.J. Ciaccio, C.A. Tennyson, G. Bhagat, S.K. Lewis and P.H. Green, Quantitative estimates of motility from videocapsule endoscopy are useful to discern celiac patients from controls, Dig. Dis. Sci. 57 (2012), 2936–2943.
[8] E.J. Ciaccio, C.A. Tennyson, G. Bhagat, S.K. Lewis and P.H. Green, Transformation of videocapsule images to detect small bowel mucosal differences in celiac versus control patients, Comput. Methods Programs Biomed. 108 (2012), 28–37.
[9] E.J. Ciaccio, C.A. Tennyson, G. Bhagat, S.K. Lewis and P.H. Green, Robust spectral analysis of videocapsule images acquired from celiac disease patients, BioMed. Eng. OnLine 10 (2011), 78.
[10] E.J. Ciaccio, C.A. Tennyson, G. Bhagat, S.K. Lewis and P.H. Green, Classification of videocapsule endoscopy image patterns: Comparative analysis between patients with celiac disease and normal individuals, BioMed. Eng. OnLine 9 (2010), 44.
[11] E.J. Ciaccio, C.A. Tennyson, S.K. Lewis, S. Krishnareddy, G. Bhagat and P.H. Green, Distinguishing patients with celiac disease by quantitative analysis of videocapsule endoscopy images, Comput. Methods Programs Biomed. 100 (2010), 39–48.
[12] Y.C. Metzger, S.N. Adler, A.B. Shitrit, B. Koslowsky and I. Bjarnason, Comparison of a new PillCam™ SB2 video capsule versus the standard PillCam™ SB for detection of small bowel disease, Reports in Medical Imaging 2 (2009), 7–11.
[13] B.C. Dickson, C.J. Streutker and R. Chetty, Coeliac disease: An update for pathologists, J. Clin. Pathol. 59 (2006), 1008–1016.
[14] M.D. Abramoff, P.J. Magalhaes and S.J. Ram, Image processing with ImageJ, Biophotonics International 11 (2004), 36–42.
E.J. Ciaccio et al. / Use of basis images for detection and classification of celiac disease1922
[15] J.A. Murray, A. Rubio-Tapia, C.T. Van Dyke, D.L. Brogan, M.A. Knipschield, B. Lahr, A. Rumalla, A.R. Zinsmeister and C.J. Gostout, Mucosal atrophy in celiac disease: Extent of involvement, correlation with clinical presentation, and response to treatment, Clin. Gastroenterol. Hepatol. 6 (2008), 186–193.
[16] L. Maiden, T. Elliott, S.D. McLaughlin and P. Ciclitira, A blinded pilot comparison of capsule endoscopy and small bowel histology in unresponsive celiac disease, Dig. Dis. Sci. 54 (2009), 1280–1283.
[17] D.S. Atlas, A. Rubio-Tapia, C.T.V. Dyke, B.D. Lahr and J.A. Murray, Capsule endoscopy in nonresponsive celiac disease, Gastrointest. Endosc. 74 (2011), 1315–1322.
[18] I.M.1. Gralnek, R. Defranchis, E. Seidman, J.A. Leighton, P. Legnani and B.S. Lewis, Development of a capsule endoscopy scoring index for small bowel mucosal inflammatory change, Aliment Pharmacol. Ther. 27 (2008), 146–154.
[19] C. Brotz, N. Nandi, M. Conn, C. Daskalakis, M. DiMarino, A. Infantolino, L.C. Katz, T. Schroeder and D. Kastenberg, A validation study of 3 grading systems to evaluate small-bowel cleansing for wireless capsule endoscopy: A quantitative index, a qualitative evaluation, and an overall adequacy assessment, Gastrointest. Endosc. 69 (2009), 262–270.
[20] U. Günther, S. Daum, M. Zeitz and C. Bojarski, Capsule endoscopy: Comparison of two different reading modes, Int. J. Colorectal. Dis. 27 (2012), 521–525.
E.J. Ciaccio et al. / Use of basis images for detection and classification of celiac disease 1923