
1/9/09 System Level Design Review January 16, 2009 Aaron Heyman – Lead Adam Cook Jose Rodriguez...
12
1/9/09 System Level Design Review January 16, 2009 Aaron Heyman – Lead Adam Cook Jose Rodriguez Abraham Taleb
-
date post
22-Dec-2015 -
Category
Documents
-
view
215 -
download
0
Transcript of 1/9/09 System Level Design Review January 16, 2009 Aaron Heyman – Lead Adam Cook Jose Rodriguez...

1/9/09
System Level Design ReviewJanuary 16, 2009
Aaron Heyman – LeadAdam Cook
Jose Rodriguez Abraham Taleb

Team Expectations for Design Review
• Learn if Costumer Needs are being met
• Catch any mistakes in design
• Receive input on user interface
• Confirm coherence between all involved parties to create the best end product
1/9/09

1/9/09
Agenda• Review Goals of Project
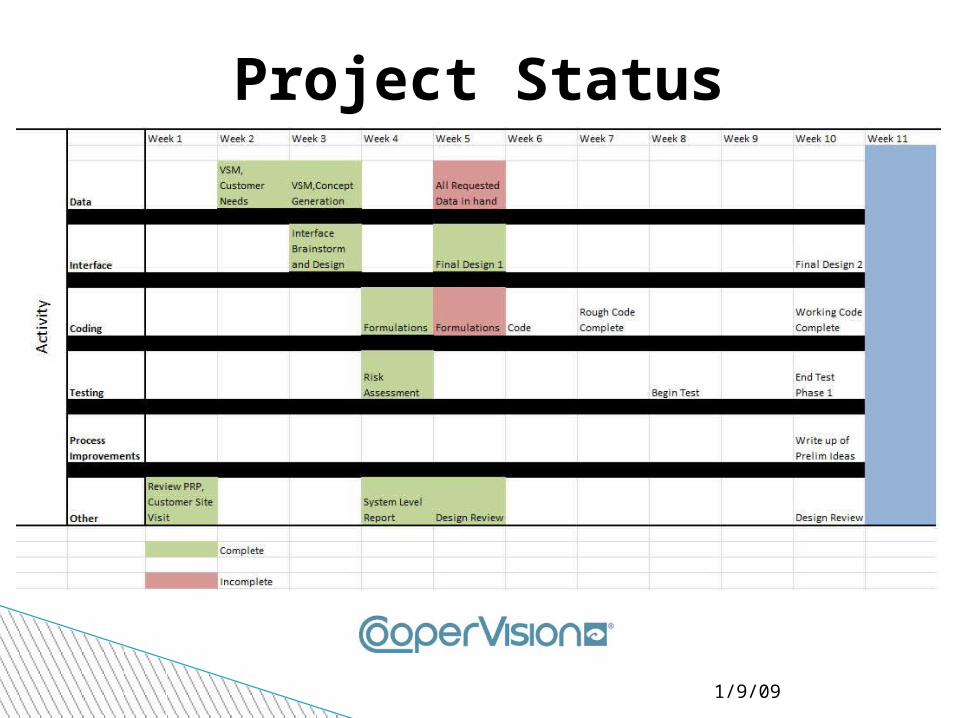
• Project Status
• Customer Needs
• Assumptions, Constraints and Risk Assessment
• Discussion of User Interface

1/9/09
Goals of Project• Be able to answer the following question:
o How many labor hours does CooperVision need per pick area given demand in terms of lines for a particular time segment (daily, weekly, monthly, yearly)?
• Process Improvements will be identified and investigated beginning in March
1/9/09
Project Status
Aaron's Screen Shot

Customer Need #
Importance Description Comments/Status
CN1 5 The time required to train users is minimal. Not Met
CN2 5 The computer tool is user friendly. Not Met
CN3 3The computer tool is able to be upgraded and/or modified in the future.
Not Met
CN4 5 The computer tool represents the real world. Not Met
CN5 3 The computer tool identifies invalid data inputs. Not Met
CN6 1 The computer tool executes commands quickly. Not Met
CN7 3The computer tool alerts the user when a given demand input is not realizable given actual capacity. Not Met
CN8 3The computer tool allows the user to visualize all the information on a single screen.
Not Met
CN9 3The computer tool provides the option to print a report of the output.
Not Met
Customer Needs
Importance Scale: 5= Must Have 3= Nice To Have 1= Preferential

1/9/09
Assumptions & Constraints• Pick per area distribution is constant
• Capacity analysis only applies to pick areas not packing/shipping
• SKUs are always in stock
• Unable to pull data with out IT assistance
• No budget to make improvements unless approved
• Picking system and design constraints

1/9/09
Risk Assessment Risk Item Level Owner Status and/or Contingency Plans
Optimizing part of the system and not the whole.
Medium CooperVision The team will optimize the pick area to the best of their ability. The entire distribution process is beyond the project scope.
Validating the computer tool.
High Team The team plans on using historical data to validate the model.
Creating an easily modifiable computer tool.
Medium Team The team will use excel for the computer tool due to its popularity with the customer.
Missing data that is needed for calculations.
Low Team The team has requested all data and has been receiving it in a timely manner from the customer.

1/9/09
User Interface Discussion

• Demand
• Timeframe for which demand is evaluated.
Inputs
Outputs• Output labor hours for each picking area.
• Output aggregated labor hours required to meet specified demand.

General Information
Max. # of employees per area per shiftADM 1
Pick to Voice 30
Pick to Light 24
Carousel 4
Note: all data is accurate as of 1/1/09.
September October November PickArea Lines Units Lines Units Lines UnitsADMPCK 12% 8% 12% 7% 13% 9%CAGEPCK 1% 1% 2% 2% 1% 1%CARPCK 7% 4% 7% 4% 7% 5%LISTPCK 12% 43% 12% 48% 7% 39%MEZVRF 8% 5% 8% 4% 10% 5%PTLPCK 52% 34% 51% 30% 52% 34%VRFPCK 8% 5% 9% 5% 10% 6%
Hits By Picking Method

1/9/09
Questions & Discussion
?


