19015 PAKISTAN ECONOMIC UPDATE - World...
70
19015 PAKISTAN ECONOMIC UPDATE ADJUSTMENT AND REFORMS FOR A BETTER FUTURE April 22, 1998 The World Bank South Asia Region Public Disclosure Authorized Public Disclosure Authorized Public Disclosure Authorized Public Disclosure Authorized Public Disclosure Authorized Public Disclosure Authorized Public Disclosure Authorized Public Disclosure Authorized
Transcript of 19015 PAKISTAN ECONOMIC UPDATE - World...

19015
PAKISTAN ECONOMIC UPDATE
ADJUSTMENT AND REFORMSFOR A BETTER FUTURE
April 22, 1998
The World BankSouth Asia Region
Pub
lic D
iscl
osur
e A
utho
rized
Pub
lic D
iscl
osur
e A
utho
rized
Pub
lic D
iscl
osur
e A
utho
rized
Pub
lic D
iscl
osur
e A
utho
rized
Pub
lic D
iscl
osur
e A
utho
rized
Pub
lic D
iscl
osur
e A
utho
rized
Pub
lic D
iscl
osur
e A
utho
rized
Pub
lic D
iscl
osur
e A
utho
rized

PAKISTAN ECONOMIC UPDATE
ADJUSTMENT AND REFORMSFOR A BETTER FUTURE
Table of Contents Page
Executive Summary .................................................. i
Recent Economic Performance and Near-Term Outlook ......................................1
2. Key Structural Issues, Reforms, and Priorities for Action. l Fiscal Adjustment and Reform 12External Sector Reforms 18Banking and Capital Market Reforms 20Public Enterprises and Privatization 22Agriculture and Manufacturing 25Governance and Civil Service Reform 27Poverty and Human Resource Development 30
3. Medium-Term Prospects and Financing Requirements .34
Statistical Appendix
Tables, Figures, and Boxes in Text
Table 1.1 Summary of Macroeconomic Indicators 2Table 1.2 Fiscal Adjustment 4Table 1.3 Total External Debt, 1992/93 - 1996/97 10Table 3.1 Pakistan: Key Economic Indicators, 1995/96 -1999/2000 38Table 3.2 Pakistan: External Financing, 1996/97 - 1999-2000 39
Figure 1.1 Annual Price Inflation (1995-98) 7Figure 2.1 Revenue and Expenditure Composition 13Figure 2.2 Composition of Provincial Revenue and Current Expenditure 16Figure 2.3 Composition and Destination of Exports, 1996/97 18
Box 1.1 Implications of the Financial Crisis in East Asia for Pakistan 8Box 2.1 The 1997 NFC Award 17
This report was prepared by a World Bank team led by Ghulam Qadir and including WilliamByrd, Hanid Mukhtar, M. K. Niazi, Ahmad Jamshidi, Rashid Aziz, Shahnaz Arshad, Usman Qamar,and Mudassir Khan. Besides providing initial drafts on several sections for the report, WilliamByrd provided extensive editorial help and helped greatly in improving the quality of the report.Shaheen Malik and Faqir Hussain Shamsi prepared Statistical Appendix and text tables andprovided research assistance. The report was processed by Shams ur Rehman and Abdul Qadir. Thetask was carried out under the overall supervision of Roberto Zagha (Sector Manager, SASPR).
Tercan Baysan of the World Bank and Ajay Chopra of the IMF served as peer reviewers andprovided very useful comments. In addition, extensive comments were provided by Sadiq Ahmed(Country Director for Pakistan and Afghanistan), Rui Coutinho, Roberto Zagha, and AntonioFurtado (IMF), and also by Shahrokh Fardoust who as Team Leader for the Pakistan EconomicManagement Cluster also provided overall guidance.
Assistance from the Government of Pakistan in providing data required for the report and theStatistical Appendix is gratefully acknowledged. The report was discussed with the Governmentbefore being finalized.
LIST OF ACRONYMS
AWBs Area Water BoardsBOP Balance of PaymentsBOO Build Own and OperateBOT Build Operate and TransferCBR Central Board of RevenueCDL Cash Development LoanCPI Consumer Price IndexDFI Development Finance InstitutionEFF Extended Fund FacilityESAF Enhanced Structural Adjustment FacilityFATA Federally Administered Tribal AreasFCDs Foreign Currency DepositsFOs Fanner OrganizationsGDP Gross Domestic ProductGHS Golden Handshake SchemeGST General Sales TaxIDB Islarnic Development BankIDBP Industrial Development Bank of PakistanIME International Monetary FundKESC Karachi Electric Supply CorporationNCBs Nationalized Commercial BanksNDFC National Development Finance CorporationNFC National Finance CommiissionNGOs Non-Governmental OrganizationsNHA National Highway AuthorityNWFP North-West Frontier ProvinceO&M Operations and MaintenanceOGDC Oil and Gas Development CorporationPEs Public EnterprisesPIA Pakistan International AirlinesPIDAs Provincial Irrigation and Drainage AuthoritiesPOL Petroleum, Oil and LubricantsPRS Pakistan Revenue ServicePSDP Public Sector Development ProgramPTCL Pakistan Telecommunication Company LimitedREER Real Effective Exchange RateRWSS Rural Water Supply and SanitationSAP Social Action ProgramSBP State Bank of PakistanSPI Sensitive Price IndexWAPDA Water and Power Development AuthorityWPI Wholesale Price Index

EXECUTIVE SUMMARY
1. Over the past thirteen months, Pakistan's government has initiated a comprehensive, "home-grown" reform program to address the country's persistent macroeconomic imbalances and seriousstructural problems. Based on tighter demand management policies and an exchange rateadjustment, good progress has been achieved in reducing Pakistan's unsustainably high fiscal andexternal current account deficits and inflation (which has fallen to the single-digit range). However,with its large burden of external debt, the economy remains highly vulnerable on the externalfront, and the capital account of the balance of payments has deteriorated in the aftermath ofthe recent developments in East Asia and continuing weak market confidence related to policyuncertainties and law and order problems. Moreover, the expected recovery of economic growthhas been modest so far, and shrinkage of the tax base as a result of stabilization-related importcompression has complicated the task of achieving revenue targets.
2. Good initial progress has been made with structural reforms in a number of areas,including trade liberalization (reduction and rationalization of tariffs), comprehensive reform of thebanking system, tax policy reforms (lowering rates and base-broadening efforts), capital marketreforms, and pricing and initial institutional reforms in agriculture. The government is also makingrenewed efforts to accelerate and broaden the privatization program, whose pace has slowed downduring the past two years, and drastically improve tax administration, whose weakness is the keyconstraint to raising Pakistan's tax-GDP ratio, which is among the lowest in Asia and still highlydependent on trade taxes. A reform program to address the serious (and macroeconomicallysignificant) financial problems of the power sector is being put in place. The second phase of theSocial Action Program has been initiated to expand and improve basic social services for the poor,with greater emphasis on quality, decentralization and other institutional reforms, and beneficiaryparticipation and monitoring. Institutional reforms have been initiated in the irrigation and drainagesector by preparing the way for establishment of Provincial Irrigation and Drainage Authorities inall four provinces. The much-delayed Population Census has been conducted in March 1998.Finally, the government has begun to try to address the serious governance problems whichadversely affect Pakistan's development prospects and undermine social stability.
3. Despite these encouraging developments on a number of fronts, sustaining themacroeconomic stabilization effort and moving ahead further with structural reforms will bemajor challenges in the face of a difficult external environment and serious economic problems athome. The longer-term development agenda faced by Pakistan also is daunting. A very largeproportion of the population is poor, with rising unemployment, particularly in the urban areas, anddespite recent progress Pakistan's social indicators remain unacceptably low compared to those ofother low-income and South Asian countries. High population growth at 2.8% per year putsadditional demands on the already overstretched infrastructure, social services, environment, andsocial fabric. Past sources of growth for agriculture are becoming exhausted, and the manufacturingsector suffers from a number of handicaps which hinder its growth and competitiveness. Exportsare insufficiently diversified, concentrated in low-growth niches, and vulnerable to non-tariff

barriers in importing countries. As is recognized by the government, addressing these longer-termissues is critical for achieving sustained rapid economic growth with concomitant poverty reduction,employment generation, and social development.
4. In the short run, staying the course with macroeconomic stabilization is essential but willnot be easy. Currently favorable factors -- lower international wheat and oil prices, higher revenuesfrom the petroleum surcharge associated with the latter, good rice and sugarcane crops, and theincrease in workers' remittances, in particular -- may not continue over time. Expenditure cutbacks,the main source of fiscal deficit reduction hitherto, cannot be relied on to bring the fiscal deficitdown much further, although there is great scope for improving the allocation and effectiveness ofpublic spending. While declines in imports have contributed in a major way to reducing Pakistan'strade deficit, these will not continue if economic growth recovers as hoped. In a word, there needsto be more reliance on strong revenue mobilization and robust export growth as opposed toexpenditure cutbacks and import reductions, respectively. Key priorities for stabilization (whichalso have significant reform content) include:
* Maintainin! and if necessary further tightening fiscal discipline, by avoidingunsustainable, low-priority infrastructure projects and other schemes, further economizingon defense expenditure consistent with security considerations, and containing recurrentspending while protecting essential non-wage O&M and the SAP.
* Increasing resource mobilization by broadening the base of the General Sales Tax and theincome tax, making the agricultural income tax more effective, reducing tax evasion,identifying and exploiting higher-yield tax sources at the provincial level, and drasticallyimproving tax administration.
. Strengthenin! the financial position of the electricity utilities by effectivelyimplementing the power sector reform program, including improvements in operationalefficiency, reductions in line losses and theft, reducing excess staff, collecting outstandingbills, appropriate tariff increases, and settlement of arrears.
* Continuing to contain the current account deficit and reducing reliance on short-termforeign debt, which will require effective steps to promote exports, appropriate exchangerate management to maintain/enhance their competitiveness, rebuilding market confidence toimprove the quality of capital inflows, and improving institutional capacity for managingpublic debt.
5. Turning to the structural agenda, the government needs to push ahead boldly withfurther implementation of its structural reform program in order to improve thecompetitiveness and growth potential of the economy. Redoubled efforts are needed in areas whereprogress has been limited, such as privatization, governance, and strengthening of taxadministration. Backtracking and inconsistent policy signals should be avoided. Priority areas forstructural reforms include:
ii

* Maintaining strong commitment to the Social Action Program and in particular to itsefforts to improve the quality of basic social services.
* Systematically addressing governance problems through greater transparency in publicsector decisionmaking (including legalized and enhanced public access to information),curtailment of discretionary powers of officials, decentralization, institutional strengthening,greater stakeholder participation in the decisionmaking process, improvements in the lawand order situation, strengthening of the judicial system, and improving the accountabilityprocess to attack corruption.
* Improving technical capacity, removing labor-related impediments to privatization.and strengthening regulatory frameworks to improve the marketability of large publicsector enterprises, particularly public utilities, and facilitate their privatization.
6. Even if the recent success in reducing the current account deficit is sustained, Pakistan willcontinue to require large amounts of external financing during the next several years. Asmooth flow of medium- and long-term official assistance, foreign direct investment, and portfolioinvestment is necessary to reduce external vulnerability, support adequate levels of investment andgrowth during the transition, and help cover the large up-front fiscal costs of critical reforms(financial restructuring of public sector banks, severance payments to retrenched public sectoremployees, foregone revenues due to tariff reductions, reform of the power utilities). While muchexternal financing will have to come from private sources, donor support for Pakistan's reformprogram and development efforts will continue to be of great importance over the next three years.The level of donor support will depend on Pakistan's progress (in line with the agreed PolicyFramework Paper and the IMF-supported ESAF/EFF agreements) in sustaining and movingahead further with macroeconomic stabilization, structural reforms, and human development.Public sector reforms, including increasing revenue mobilization to create fiscal space for high-priority development activities, careful prioritization of expenditures (including adequately fundingand effectively implementing the SAP and avoiding unsustainable, low-priority infrastructureprojects), and effective aid utilization, will be critical in this regard.
iii

1. RECENT ECONOMIC PERFORMANCE ANDNEAR-TERM OUTLOOK
1.01 When the present government came into office in February 1997 the economy was in direstraits. Serious lapses in implementation of stabilization policies and structural reforms in thepreceding several years had resulted in large, unsustainable fiscal and external deficits; economicgrowth had declined to two-thirds of its historical level; double-digit inflation had persisted for thepreceding four years; exports were stagnating; foreign exchange reserves were equivalent to only 2.4weeks of imports; and creditworthiness ratios had sharply deteriorated. Building on reforminitiatives started by the interim government (November 1996-February 1997), the new governmentmoved quickly to introduce comprehensive structural reforms and stabilization measures toreinvigorate growth, reduce inflation, lower the fiscal deficit, strengthen the balance of payments,and improve Pakistan's export competitiveness. Major stabilization measures included tighter fiscaland monetary policies to contract aggregate demand. The exchange rate was adjusted downward inOctober 1997 to restore the price competitiveness of exports. This program served as the basis for aPolicy Framework Paper and ESAF/EFF arrangements approved by the IMF's Board last October.The first review of the program was successfully concluded in March 1998.
1.02 Stabilization measures have succeeded in sharply reducing the current account balance ofpayments deficit and to a lesser extent the fiscal deficit, and in bringing down inflation to the single-digit level. Despite the difficult external environment created by the East Asian financial crisis,Pakistan's exports have recovered and workers' remittances have increased sharply over the firstnine months of 1997/98, which coupled with lower imports and larger inflows of resident foreigncurrency deposits have resulted in a substantial improvement in the current account of balance ofpayments. Prudent fiscal and monetary policies and the 8% devaluation of last October havecontributed to this outcome. Tight monetary policy, lower aggregate demand, increased agriculturalsupplies, and lower international prices of key goods like wheat and POL products have pulledinflation down to the single-digit range. Through containment of non-interest current expenditureand well-prioritized cutbacks in the development program, some progress has been made inreducing the fiscal deficit despite shortfalls in tax collection (attributable to transitional effects oflowering tax rates, tariff reforms, and lower imports). Economic growth also is recovering, but to asomewhat more modest extent than expected.
1.03 Despite the narrowing of the current account deficit, Pakistan remains highly vulnerable onthe external front and the capital account has deteriorated as a result of the effects of the crisis inEast Asia and continuing weak market confidence related to policy uncertainties and law and orderproblems. The weakness of the capital account has resulted in increasingly heavy reliance onforeign currency deposits and commercial borrowing for external financing. Market and investorconfidence has not yet been fully restored. Moreover, staying the course with macroeconomicstabilization, which is essential, will not be easy. The favorable factors noted earlier may not last.Expenditure cutbacks, the main source of fiscal deficit reduction hitherto, cannot be relied on tobring the fiscal deficit down much further. While declines in imports have contributed in a majorway to reducing Pakistan's trade deficit, these will not continue if economic growth recovers ashoped. In a word, there needs to be more reliance on strong revenue mobilization and robust exportgrowth rather than expenditure cutbacks and import reductions. This chapter reviews recentprogress on the macroeconomic front and assesses near-term prospects for stabilization and growth.
1

1.04 Economic growth. Pakistan's economy is beginning to recover after a sharp decline ineconomic growth in 1996/97. Annual GDP growth, which had declined from 6% in the 1980s to4.2% in the preceding four years, dropped further to 3.1% in 1996/97 (see Table 1.1) -- hardly fasterthan population growth. Value added in large-scale manufacturing contracted by 1.4%, as cottonginning and the sugar industry were hurt by declines in output of cotton and sugarcane, and cementoutput fell due to contraction in demand caused by lower private investment and sharp cutbacks inpublic investment. The growth of agriculture plummeted to less than 1% in 1996/97 due to badweather and pest attacks.
Table 1.1: Summary of Macroeconomic Indicators(% change unless otherwise indicated)
Long-term PreliminaryTrends Outcome Projections 1/
Item 1983-95 1995/96 1996/97 1997/98
at constant 1980/81 pricesGDP (at factor cost) 5.5 4.6 3.1 5.0GDP per capita 2.4 1.7 0.3 2.2Private Consumption per capita 1.8 4.2 -0.9 1.7
at current pricesM2 2/ 15.4 13.8 12.2 15.6Inflation (CPI) 8.4 10.8 11.8 8.0Inflation (WPI) 9.2 11.1 13.0 N.A.Exports (valued in US$) 9.8 2.9 -1.4 5.7Imnports (valued in US$) 5.2 16.7 -5.0 -7.2Current Account Balance/GDP 3/ 4.2 6.8 6.0 4.0External Debt Stock/GDP 3/ 43.9 42.6 43.9 45.8Debt Service (DOD)/Exports 3/ 4/ 25.7 24.7 27.9 25.7Gross Reserves (in weeks of imports 5/) 6.6 8.2 4.9 7.5Governmnent Fiscal Deficit/GDP 3/ 7.4 6.9 6.1 5.2
Gross InvestmentlGDP 3/ 19.1 18.6 18.2 17.5Public Investrnent 8.7 7.0 5.6 5.1Private Investment 6/ 10.4 11.6 12.6 12.4
Gross Domestic Savings/GDP 3/ 12.8 12.6 13.3 14.9
Gross National Savings/GDP 3/ 14.8 11.8 12.2 13.5Public Savings 1.7 - 1.1 -2.0 -0.7Private Savings 13.1 12.9 14.2 14.2
1/ IMF& GovernmentofPakisian's profections (as of!February 1998). Projections are pretiminary andsubject to revision.
2/ !Jlqures from 1990/91 onwar inctute Resident Fore!qn Currency rDeposits (MCDs).
3/ Long-term trent is the average oj`12 years, wlii(e other years show the year(y ratios.
4/ 9?jotio of medium- and long-term debtservice to eVorts ofgoods andservices ant receipts of private transfers.
5/ Imports ofgoods and non-factor services.
6/ inctudes changes in stocks.
N(ote: Ratios are catcutatet uth respect to GDP at marketprices.Source: Government of•Pakistan ant lMF ant dWortd Bankstaffestimates.
1.05 Real GDP growth in 1997/98 is projected at around 5%, better than last year but still fallingshort of the target of 5.5%. Despite lower output of cotton, value added in agriculture is expected to
2

grow by 5.4%, with growth of sugarcane, wheat, and rice output estimated at 25%, 8%, and 4%,respectively. Large-scale manufacturing grew at an estimated 3% annual rate in the first half of1997/98, mainly because of the strong performance of the sugar industry. Although economicgrowth is recovering, it is still being constrained by weak aggregate demand resulting fromstabilization measures and by weak market confidence which is holding back investment.
1.06 Fiscal developments. Reducing Pakistan's unsustainable budget deficit, which has been ator above 6% of GDP in recent years (see Table 1.2), is the top priority for macroeconomicstabilization. Past efforts to do so were not successful, due to structural weaknesses in taxadministration, over-reliance on tax rate increases as opposed to base broadening, and the rapidlyrising interest burden and growing public sector wage bill on the expenditure side. The 1996/97budget attempted to reduce the fiscal deficit to 4% of GDP, mainly by imposing large additionaltaxes, some of which had to be rolled back due to strong opposition by the business community. InOctober 1996, as part of a stabilization program agreed with the IMF, sharp expenditure reductionswere imposed, mainly a 19% cutback in the PSDP. In March 1997 the government introducedseveral fiscal reform measures to expand the tax base and reduce tax rates (import duties, GeneralSales Tax, and personal and corporate income tax). Lower tax rates entailed immediate revenuelosses, while broadening of the tax base will take time to yield positive results. Also reflectingdisappointing revenue collection performance, the ratio of federally collected tax revenues to GDPdeclined from 13.5% in 1995/96 to 12.3% in 1996/97. As a result of large expenditure cutbacks,Pakistan's fiscal deficit declined from 6.9% of GDP in 1995/96 to 6.1% in 1996/97, but it remainedat an unsustainable level.
1.07 The 1997/98 budget aimed to reduce the consolidated fiscal deficit to 5.0% of GDP througha combination of modest revenue growth and substantial expenditure containment. (The fiscaldeficit is currently projected at 5.2% of GDP, not due to any change but rather to a lower nominalGDP estimate, reflecting somewhat lower GDP growth and considerably lower inflation than wasforecast at the time of the budget.) The revenue targets are ambitious in view of the substantial taxrate reductions introduced in March 1997, relying on a strong revival of economic activity inresponse to the structural reforms, which so far has been modest. On the expenditure side, thebudget provides for containment of non-interest current expenditure of the federal government byholding down expenditures on defense, general administration and services, and subsidies. Manylow-priority development projects have been eliminated and the quality of the PSDP therebyimproved. Tax collection by the Central Board of Revenue (CBR) in the first half of 1997/98, at Rs134 billion, fell short of the target by around Rs 11 billion and was 2.4% lower than in the first halfof 1996/97. Lower tax rates, particularly on imports, coupled with declining imports, sloweconomic growth, and political uncertainties were the main factors responsible for this shortfall. Itwas only partly offset by higher-than-budgeted receipts from the development surcharge on POLproducts, due in part to the decline in international oil prices. The fiscal position of the provinces ofSindh, Balochistan and to a lesser extent NWFP is quite weak, as demonstrated by their excessiveborrowing from the State Bank of Pakistan. Keeping in view all of these factors, achieving therevenue target for 1997/98 as a whole will be very difficult, although further expenditure cutbacksmay offset part of the shortfall in tax revenue.
3

Table 1.2: Fiscal Adjustment(Consolidated Federal and Provincial Budgets)
Share of GDP (%)
1990/91 1995/96 1996/97 1997/98 1997/98
Outcome Outcome Outcome Budget Projections I/
Total Budgetary Revenues 16.8 17.0 15.3 15.8 15.8
Federally Collected Revenues 16.1 16.0 14.4 14.8 14.8
Tax Revenues 12.2 13.5 12.3 12.1 12.2Direct Taxes 1.9 3.6 3.4 3.5 3.5Indirect Taxes 10.2 9.9 8.9 8.6 8.7
Non-Tax Revenues 4.0 2.5 2.1 2.7 2.6
Provincially Collected Revenues 0.7 1.0 0.9 1.0 1.0
Total Budgetary Expenditure 25.6 23.8 21.5 20.9 20.9
Federal Current Expenditure 14.7 14.3 13.8 13.4 12.5Defense 6.3 5.5 5.1 4.7 4.7Interest Payments 4.9 5.9 6.0 6.5 6.4Other 3.5 2.9 2.7 2.2 1.4
Provincial Current Expenditure 4.4 5.2 4.3 4.5 5.3
Development Expenditure 6.4 4.3 3.4 3.2 3.1
Fiscal Deficit -8.7 -6.9 -6.1 -5.0 -5.2 2/Federal Government -6.9 -6.6 -6.4 -4.4 -5.1Provincial Governments -1.9 -0.2 0.3 -0.7 -0.1
I/IMF & Government of Pakistan projections (as of Febnrary 1998). Projections are preliminary
and subject to revision.2/The marginal increase in the projectedfiscal deficit is solely due to a lower nominal GDP estimate, reflecting
somewhat lower growth and considerably lower inflation than was forecast at the time of the budget.
Source: Government of Palistan and IMF and World Bank staff estimates.
1.08 The financial position of Pakistan's public sector corporations, particularly the powerutilities (WAPDA and KESC), has greatly deteriorated in the last year and a half, with the overalldeficit (total borrowing requirement) of seven large public sector corporations increasing from Rs31 billion in 1995/96 to an estimated Rs 42 billion in 1996/97, equivalent to 1.7% of GDP.1 Had itnot been for sharp cuts in their development expenditures and O&M spending, their deficit wouldhave been larger. Public sector corporations are increasingly unable to discharge tax liabilities,service their debt, and transfer dividends to the federal budget. At the end of 1996/97, theaccumulated stock of debt service arrears of public sector corporations to the federal governmentamounted to Rs 24 billion, a number which has increased sharply in 1997/98. The worsening
A part of the deficit of public corporations is financed through the budget, hence all of it does not constitute publicsector borrowing requirement.
4
financial problems of public sector corporations have serious adverse implications formacroeconomic stability. In the case of the power sector, the government has initiated acomprehensive program to restore its financial viability, improve efficiency, and prepare the way forprivatization (see Chapter 2).
1.09 Despite the difficult fiscal situation, several large infrastructure projects, most of themoutside the budget and PSDP, have been under consideration by the government. Examples includea new international terminal at Lahore Airport, the Lahore Ring Road (bypass), a new airport forIslamabad, the Karachi Mass Transit Project, several highway projects, and Gwadar Seaport, amongothers. In one case, the Islamabad-Peshawar Motorway (with an estimated total cost of Rs 22-24
2billion), implementation has already begun. Although the characteristics of individual projectsdiffer, for the most part they have not been subject to the discipline of the planning/project approvaland federal budget processes. Most of these projects have private sector characteristics at least tosome degree, but many of them also may carry substantial government liabilities, whether in theform of future debt servicing, foreign payment liabilities, government guarantees, or in some casespossible operating subsidies. Sometimes projects that have been turned down for PSDP fundingresurface as quasi-private sector projects, while on the other hand some projects initially consideredon BOT basis subsequently were included in the government's development program withbudgetary funding. In some cases the priority of the projects (based on sectoral investment needsand economic rates of return) is doubtful.
1.10 Implementation of a substantial number of these projects would lead to a sharp increase infuture and contingent fiscal liabilities, which would not be consistent with the presentmacroeconomic and fiscal framework. Hence the government needs to exercise great caution withrespect to moving ahead with any of these or other similar projects. In particular:
3 All fiscal and BOP/debt implications of these projects need to be carefully assessed andincorporated into the macro/budgetary framework.
* In addition to direct fiscal expenditure liabilities resulting from the need to service suppliercredit or other project-related borrowing, the contingent liabilities arising fromgovernment guarantees and recurrent cost liabilities for the public sector need to beadequately taken into account.
* It is also important to ensure that projects fit into the government's sectoral priorities aswell as having acceptable economic and financial rates of return.
* There are also critical prerequisites related to effective regulation, autonomy with respectto price setting, etc. for private infrastructure development to work well.
1.11 Money and credit. Failure to reduce the fiscal deficit in recent years has led to persistentexcessive bank borrowing by the government, which accounted for around half of domestic creditexpansion in 1995/96 and 1996/97. Such large injections of high-powered money to finance thebudget deficit have led to rapid credit expansion and a large liquidity overhang in the banking
2 The govermment considers that implementation of this project is obligatory due to existing legal agreements withthe private contracting party, which would result in very sizable penalties if the project were dropped.
5

system, posing problems for monetary policy and hindering progress toward indirect methods ofmonetary management. Due to tighter monetary policy pursued by SBP and greater fiscal disciplinein the first half of 1997/98, the government's budget-related borrowing remained well within thetarget of Rs 48 billion (1.9% of GDP) and was less than half of the corresponding figure in the sameperiod of the previous year. As a result, domestic credit expansion declined sharply, despite anupsurge in the private sector's demand for export credit, cotton marketing credit, agriculturalproduction loans for the winter crop, and working capital for the manufacturing sector. In view ofthe tight monetary stance pursued so far, the increase in domestic liquidity for 1997/98 as a whole isexpected to stay within the target agreed with IMF.
1.12 Despite liberalization of interest rates on bank loans, rates of return on bank deposits untilrecently have remained low or negative in real terms because of the heavy administrative costs ofbanks, the large stock of non-performing loans, and government sponsored concessionary creditschemes. Low real rates of return on rupee-denominated deposits have led to asset substitution infavor of FCDs which are protected against devaluation. Since 1991/92, the share of resident FCDsin monetary assets has more than doubled -- from 8.5% at end-June 1992 to 21.2% at end-June1997, which has placed Pakistan at the higher end among the moderately dollarized economies.Volatility of resident FCDs would be transmitted to monetary aggregates, complicating SBP'sefforts to maintain monetary control. Due to low rates of return on rupee-denominated bankdeposits, their growth in the last four years (12.5% p.a) has also been much lower than that ofdeposits in National Saving Schemes (20.1%), for which the government has been offering muchhigher returns. Overall, the ratio of M2 (excluding FCDs) to GDP declined from 36.1% at end-June1992 to 33.2% at end-June 1997.
1.13 Inflation. As a result of tight monetary and fiscal policies, improved agricultural supplies,lower international prices of key goods like wheat and POL products, and limited upwardadjustments in administered prices, considerable progress has been made in recent months inreducing the annual rate of inflation. Slow economic growth, along with cotton crop failures andother supply shocks, large fiscal deficits and their monetization, excessive reliance on indirect taxesfor resource mobilization, and large increases in administered prices necessitated by the inefficiencyof public enterprises, had resulted in double-digit inflation in the range of 10-13% per year in thepast several years. However, in the past ten months the annual rate of inflation based on point-to-point comparison of the Consumer Price Index (CPI) declined from 13.6% in April 1997 to 8.1% inDecember 1997 and further to 5.0% in February 1998 (see Figure 1.1). Tight fiscal and monetarypolicies, the lowering of the General Sales Tax rate (from 18% to 12.5%), and the slowdown ofeconomic activity have contributed to lower inflation. Weakening international prices of key goodslike wheat and POL allowed their rupee prices to be maintained in face of the 8% devaluation ofOctober 1997. The CPI-based annual rate of inflation has increased to 7.3% in March 1998, mainlydue to the recent upward adjustment in electricity tariffs. Nevertheless, inflation is expected toremain in the single-digit range for 1997/98 as a whole, for the first time since 1989/90.
6

Figure 1.1: Annual Price Inflation (1995-98)
i12.
a Z c 1 0 oR e z E > r F e O o x
I ' CI >1 PI IAnnual rates of inflation a based on point-to-point conVarison of price indces
1.14 External sector. A significant improvement in the balance of trade, a recovery of workers'remittances, and a large inflow of resident FCDs resulted in a sharp decline in the current accountdeficit to $754 million in the first half of 1997/98, compared with $2.8 billion in the same period of1996/97. Foreign exchange reserves have recovered from extremely low levels and are now in the$1.0-1.3 billion range. Prudent fiscal and monetary policies pursued during the past year and the8% devaluation of last October have contributed to this outcome. Despite depressed demand in EastAsian countries, possibly stronger competition from these countries in other markets (see Box 1.1),and weakening of international prices of a number of export items, Pakistan's exports increased by4.7% in the first nine months of 1997/98. However, the effects of the East Asian crisis may bebeginning to affect exports adversely, as indicated by declines in exports in January and March1998. The recovery of exports is mainly attributable to sharp increases in exports of primarycommodities (23%). Total imports declined by 11.1% in the first nine months of 1997/98, mainlybecause of contraction in domestic aggregate demand and lower international prices of someimportant import items like wheat, crude oil, and POL products.
1.15 Before the recent improvement, Pakistan's external position had become extremelyprecarious in 1996/97. The country's external vulnerability assumed threatening proportions in thefirst quarter, when an outflow of FCDs coupled with deterioration in the services account led torapid depletion of foreign exchange reserves and a significant rise in the differential between theopen market and official exchange rates. The previous elected government responded in October1996 with a stabilization package, including a 7.9% devaluation, significant tightening of fiscal andmonetary policies, and new incentives for exports. Although the stabilization package helped inreversing the outflow of FCDs, exports fell sharply in the second half of 1996/97, resulting in adecline of 1.4% for the whole year. Lower exports were attributable mainly to the poor cotton cropand lower rice exports. Other exports also stagnated because of supply constraints, politicaluncertainties, and appreciation of the real effective exchange rate (REER) in the second half of1996/97. Total imports fell by 5%, mainly reflecting the slowdown of economic activity. Due to alarger-than-anticipated inflow of resident FCDs and the decline in imports, the current accountdeficit decreased somewhat from $4.6 billion in 1995/96 to $4.1 billion in 1996/97, but it was stillat an unsustainable level.
7

Box 1.1: Implications of the Financial Crisis in East Asia for Pakistan
The financial crisis which started in Thailand in July 1997 quickly spread to four other East Asian countries,resulting in large devaluations of their national currencies, sharp declines in stock prices, and substantial increases ininterest rates as the countries attempted to stem the outflow of capital. Indonesia's exchange rate against US dollardepreciated by 74.5% between October 1997 and January 1998, stock prices declined by 34% in Hong Kong, andinterest rates rose by 954 basis points in Korea. The erosion of confidence following the cfrisis has led to a sharp declinein gross foreign capital inflows and a reversal of net capital flows to the five countries (Thailand, Indonesia, Malaysia,Korea, and Philippines) worst-hit by the crisis. Economic growth in these countries, as a group, is expected todecelerate by seven percentage points in 1998.
The origin of the financial crisis in all of these countries can be traced to fundamental weaknesses in theirfinancial systems and corporate governance, an inadequate regulatory framework with implicit government guarantees offinancial institutions, and failure of macroeconomic management to effectively deal with burgeoning capital inflows.Large capital inflows contributed to real exchange rate appreciation, demand pressures, large current account deficits,and large uncovered short-term borrowing in foreign currency -- all of which increased external vulnerability. Whenthese economies were thriving, banks could raise money from domestic markets and foreign lenders who perceived theirdeposits to be implicitly guaranteed by the countries' governments. Weak regulation permitted banks to finance highlyspeculative real estate ventures and overambitious corporate expansions. These irresponsible loans contributed to anartificial boom in real estate and stock markets, making the balance sheets of banks and their clients look healthier thanthey actually were.
With the end of the artificial boom in real estate and stock markets in the East Asian countries, nervousinvestors started pulling out, leading to outflow of foreign capital. This forced devaluations, which exacerbated thecrisis as banks and the corporate sector had assets in devalued local currencies and much of their liabilities in USdollars. The financial crisis is seriously damaging the real economies as well. The sharp decline in asset prices ismaking people feel poorer, depressing consumer demand. Lower stock prices and higher interest rates are discouraginginvestmnent. The banking system, which serves as a lubricant for the economy, has been substantially weakened andeven paralyzed in some of the East Asian countries.
Pakistan has not and is not likely to face a crisis of the same nature as that in East Asia, because of threefactors. One. Pakistan's foreign currency exposure, particularly that of the private sector, is much lower than in the EastAsian countries. Two, last year the government initiated a comprehensive reform program supported by the IMF'sESAF/EFF arrangements. Three, substantial progress has been made in implementation of banking reforms, stemmingfurther increase in bad loans. However, there are certain sirnilarities. Pakistan's financial sector is still weak, with alarge stock of bad debts. Besides. Pakistan's short-term foreign debt including non-resident foreign currency deposits(FCDs) is now more than five times its foreign exchange reserves, which renders the external position precarious.Including resident FCDs would double this figure. The central bank's forward cover scheme for FCDs provides anexplicit guarantee against foreign exchange losses which encourages the accumulation of these liabilities to financepersistent trade deficits, in much the same way as the implicit guarantees associated with financial institutions in EastAsia encouraged excessive foreign funding. Moving ahead with unsustainable, low-priority infrastructure projects,financed partly with foreign funding, could exacerbate external imbalances and expose Pakistan to similar risks as thosefaced by the East Asian countries, Finally, the East Asian crisis has increased the country's vulnerability to foreignexchange liquidity problems, for several reasons:* Weakening of world-wide market and investor confidence, which results in reduced willingness to provide foreign
capital to developing countries and harder terms. Inflows of medium- and long-term private capital to Pakistan,which were relatively small in the first place, have further declined with the erosion of confidence in the aftermathof the East Asia's financial meltdown.
* Weakening of demand for some of Pakistan's exports like cotton yarn from the affected East Asian countries.* Much stronger price and non-price competition from East Asia in third markets as a result of the large devaluations
their currencies have undergone: this could affect key exports like textiles and rice.Although Pakistan has benefited to some extent from lower import prices, this would be relatively small
compared with the potentially large adverse effect on exports and capital flows.
8

1.16 Despite the recent narrowing of the current account deficit, Pakistan remains highlyvulnerable on the external front and the capital account has deteriorated, reflecting increasinglyheavy reliance on FCDs and commercial borrowing for external financing, the effects of the crisis inEast Asia, domestic policy uncertainties, and the problematic law and order situation. The EastAsian crisis has increased Pakistan's vulnerability to foreign exchange liquidity problems byreducing inflows of medium- and long-term private capital (see Box 1.1). As a result, Pakistan hadto borrow $900 million on a gross basis3 short-term in the first half of 1997/98 and increase furtherits already excessive reliance on FCDs, which rose to $10.5 billion. Despite substantial inflows ofbalance of payments support from the IMF, World Bank, and Asian Development Bank, foreignexchange reserves have not risen above the $1-1.3 billion level.
1.17 Persistent large current account deficits in the past several years have resulted in rapidaccumulation of external debt (see Table 1.3). The total stock of public and publicly guaranteedexternal debt increased from US$23.5 billion in 1992/93 to $28.2 billion in 1996/97, equivalent to220% of exports of goods and services and net private transfers. Inclusive of private non-guaranteed debt and non-resident institutional FCDs, Pakistan's total external debt amounts to $32.4billion. The debt service ratio rose from 20.5% in 1991/92 to 27.9% in 1996/97, compared to athreshold range of 20-25% beyond which debt servicing difficulties are often encountered.
1.18 With diminishing availability of concessional long-term financing, Pakistan has increasinglyrelied on costly commercial and short-term external borrowing. Although still a small proportion oftotal outstanding external debt, short-term public and publicly guaranteed debt from commercialbanks and the Islamic Development Bank (IDB) has almost doubled in the last four years. Totaloutstanding commercial debt (including medium-term) more than tripled and rose as a share of totalpublic and publicly guaranteed debt from 2.3% in 1992/93 to 7.1% in 1996/97. The government hasalso relied heavily on FCDs to meet external financing requirements. In the past two years, inflowsinto resident FCDs have covered one-fifth to two-fifths of the trade deficit. As of December 31,1997, the total outstanding balance in FCDs stood at $10.5 billion, equivalent to one-third of totalexternal debt. About 86% of FCDs are either demand deposits or have a maturity of one year or less.Non-debt creating inflows have not picked up in recent years, with total foreign portfolio and directinvestment remaining below $1 billion in 1996/97.
1.19 In view of Pakistan's precarious external position, there is an urgent need to reduce costlyshort-term external borrowing and FCDs, through sustainable improvements in the current accountbrought about by robust growth of exports. Prudent fiscal and monetary policies, appropriateexchange rate policy to maintain and enhance the price competitiveness of exports, and consistentimplementation of structural reforms can boost exports and restore the confidence of foreigninvestors. That will increase the inflow of non-debt creating capital to the economy, reducing theneed for short-term borrowing.
3 The bulk of this new borrowing was for rolling over of existing loans or new borrowing to pay back old loans.
9

Table 1.3: Total External Debt, 1992/93 - 1996/97(US $ million)
Preliniinary
1992/93 1993/94 1994/95 1995/96 1996/97
External debt
Total external debt 25,734 27,998 30,399 31,523 32,357
Public and publicly guaranteed external debt 23,508 25,211 27,214 27,557 28,205
Medium-and long-term 22,581 23,976 25,958 26,091 26,945of which:
Project and non-project aid 19,044 20,333 22,117 22,275 23,096
Commercial banks and IDB 1/ 115 260 543 799 867
FCBCs 2/ 87 119 132 148 151
Eurobonds 0 0 148 148 303
Short-terrn 927 1,235 1,256 1,466 1,260of which:
Commercial banks and IDB 1/ 434 724 716 990 832
FEBCs and DBCs 3/ 493 511 540 476 428
Non-resident institutional foreign currency 864 1,059 1,199 1,592 1,533
Private non-guaranteed debt 1,362 1,728 1,986 2,374 2,6191/ Islamic Development Bank.
2/ Foreign Currency Bearer Certificates.
3/Foreign Exchange Bearer Certificates and Dollar Bearer Certificates.
1.20 Conclusion. Pakistan has made a good start in reducing the unsustainable fiscal andexternal imbalances which are a consequence of the country living beyond its means for a long time.However, the fiscal adjustment needed to reverse the trend of rising public debt and the increasingpre-emption of revenues by debt servicing will not be painless. The government has imposed strictdiscipline on the expenditure side, but revenues are falling short of targets because of sloweconomic growth, tax rate reductions, meager collection of agricultural income tax, and difficultiesin extending GST to retail trade. The provincial governments, under tightening fiscal constraints,face difficulties in prioritizing their expenditures and mobilizing their own resources. The financialsituation of public enterprises has been getting worse. The capital account of the balance ofpayments remains fragile. And finally, market confidence and investment have not yet been fullyrestored, and the recovery of economic growth has been somewhat more modest than envisaged. Toovercome these serious macroeconomic imbalances, the government needs to raise tax revenues,improve tax administration, further restructure expenditures, focus on export growth, reform theforeign exchange system, and improve the efficiency and financial position of public enterprises.
1.21 In the past few years, repeated attempts to stabilize the economy without following throughwith structural reforms have failed. Hence addressing the country's deep and persistent structuralproblems (the topic of the next chapter) is essential for sustained improvement in the balance ofpayments and fiscal positions and resumption of rapid economic growth.
10

2. KEY STRUCTURAL ISSUES, REFORMS,AND PRIORITIES FOR ACTION
2.01 Besides the macroeconomic imbalances discussed in the last chapter, Pakistan's economyhas been suffering from deep-rooted, long-standing structural problems, which are hinderingeconomic growth and slowing down progress in poverty reduction. The narrowly-based tax systemand weak tax administration constrain resource mobilization; the absorption of the bulk of totalfiscal resources by interest payments, defense, establishment, and subsidies has squeezed publicinvestment and non-wage O&M; the worsening financial position of public enterprises isexacerbating fiscal problems; the concentration of exports in cotton and textiles and the anti-exportbias of the trade and tariff regime have weakened export performance and the balance of payments;the deterioration of the irrigation and drainage system is threatening the sustainability of agriculturalgrowth; and the weak financial system retards the overall growth of the private sector. Poor socialindicators and past neglect of human resource development are adversely affecting the country'slonger-term economic and social development prospects. Cutting across all of these structuralissues are pervasive governance problems, which weaken business confidence and distort theorientation and incentives of the private sector; contribute to law and order problems; encourage taxevasion, loan defaults, and arrears in payments of utility bills; and reduce the effectiveness of publicexpenditure.
2.02 Over the past thirteen months, the government which came into office in February 1997 hasinitiated a comprehensive, home-grown structural reform program to address these problems. Itsmain elements include major tariff reductions and tariff rationalization measures; significantreductions in other tax rates and tax base broadening; ambitious banking sector reforms; downwardadjustment of the exchange rate; accelerated privatization; strengthening of the accountabilityprocess to deter/punish corruption; and other policy measures. Lowering of the maximum importtariff from 65% to 45% has significantly reduced protection in the economy. The government hasmade substantial progress in implementing banking sector reforms by improving the management ofnationalized commercial banks (NCBs), eliminating their overstaffing, strengthening the loanrecovery mechanism, and enhancing SBP's authority in banking regulation and supervision.Concrete steps have been taken to strengthen the capital market by removing tax anomalies andoffering incentives to attract investment. The government is also making renewed efforts toaccelerate and broaden the privatization program by strengthening the Privatization Commission,and to drastically improve the tax administration. Institutional reforms have been initiated in theirrigation and drainage sector with the enactment of legislation to establish the Provincial Irrigationand Drainage Authorities, and underpricing of wheat has been corrected to a large extent. Recently,the government has initiated a major reform program to restore the financial viability of the electricpower utilities and improve the efficiency of the power sector. The second phase of the SocialAction Program has been initiated to expand and improve basic social services for the poor, withgreater emphasis on quality, decentralization and other institutional reforms, and beneficiaryparticipation and monitoring. In the area of governance, the accountability process is underway anddiscretionary powers of politicians and bureaucrats have been curtailed.
2.03 Overall, the above initiatives are very promising, and a good start has been made withstructural reforms in a number of areas. However, the government needs to push ahead boldly withfurther implementation of its reform program in order to improve the competitiveness and growthpotential of the economy. Redoubled efforts are needed in areas where progress has been limited,
11

such as privatization, governance, and strengthening of tax admninistration. Backtracking andinconsistent policy signals should be avoided. This chapter discusses key issues and sets forth theagenda for structural reform in the- following areas: fiscal adjustment and reform (including taxpolicy and administration, public expenditure, and provincial finances); external sector reforms;banking and capital market reforms; public enterprises and privatization (including the powersector); agriculture and manufacturing; governance and civil service reform; and poverty and humanresource development.
Fiscal Adjustment and Reform
2.04 Pakistan has been facing a serious fiscal crisis - the culmination of adverse trends since the1980s and worsening structural imbalances and rigidities. The consolidated federal and provincialfiscal deficit of 6% of GDP or more in recent years is unsustainable. The overall public sectorborrowing requirement has been even larger due to large deficits incurred by public enterprises.This large, persistent gap in the public sector's finances is the main factor behind Pakistan's currenteconomic difficulties.
2.05 Tax Reform. Despite some improvements in recent years, Pakistan's tax system is stillcharacterized by a narrow base, over-reliance on distortionary import-related taxes (see Figure 2.1),tax concessions and widespread tax evasion which reduce revenues and distort incentives, and weaktax administration suffering from technical, institutional, and governance problems. Customs dutiesaccounted for 28% of federally collected tax revenues in 1996/97. Well-off segments of society arenot willing to pay their share of taxes, and only a small proportion of the population pays incometax. Agriculture, the single largest sector of the economy, has not been effectively taxed, and it hasproven very difficult to expand the base of the General Sales Tax (GST) to include commerce.
2.06 Tax reforms, which had progressed unevenly during the preceding three years, wereaccelerated by the present government after it came into office in February 1997.
- The standard rate of the GST was reduced from 18% to 12.5% and the maximum rate of23% and special rate of 10% elirninated.
* Personal income tax rates were virtually halved along with basic tax credits; the tax rate forperks was increased to progressively higher levels for persons with higher annual incomes(to 3-15% from 3%); and tax returns were made mandatory for all persons owningimmovable property above a certain size, having a telephone connection, or traveling abroad.
* Corporate income tax rates were reduced for companies spending at least 2% of their profitson workers' welfare (from 33% to 30% for public companies, from 43% to 35% for privatecompanies, and from 58% to 55% for banking companies).
* Filing of wealth tax returns was made compulsory for owners of sizable houses orapartments and motor cars, and they are subject to minimum wealth tax at stipulated rates.
* All four provinces have levied a land-based tax on agriculture.
12

Figure 2.1: Revenue and Expenditure Composition
A: COMPOSITION OF TOTAL REVENUES
1990/91 1996/97
Provincial Provincial
Revenue Direct Taxes Revenues
Non-tax OjX | 12% rNon-Tax 6% Direct Taxes
R 20% Excise Duties 1315%
Cs gesacustomss 111 J Excise DutiesSales Tax ~~~22% 15%
10%Custm Surcharges
31% 8% Surcharges Sales Tax
6% 14%
B: FEDERAL GOVERNMENT EXPENDITURES
1990/91 1996/97Social Others Social Others
Services 7% Services 9
3% cDefese 2% Defense29% 32%
Interest23%
Interest __ General
General 36% Adnin.
Adnmin. 3% 01 5%Grantto Subsidies Subsidies
Provinces Development Grants 2%6% to 24%Development
24| 6%DeveloprnentProvinces 13%
1%
C: CONSOLIDATED EXPENDITURES
1990/91 1996/97Others Others
| Others ~~~ ~ ~~~~~~~~~~~11% DefenseSocial 11% Defense Social _ 24%
Services 5% Services11% ~~~~~~~~~~~~12%
General General
Adniin. 5% Admn. 8%
Interest Subsidies Subsidies19% 4%Intrs 2%
28% DevelopmentDevelopment 15%
25%
|Source: Government ofPakistan and IMF and World Bank StaffEstimates.
13

2.07 Pakistan needs to push forward with tax reforms to develop and effectively implement abroad-based, buoyant, and equitable tax system, which will improve incentives and competitivenessin the private sector as well as reduce the fiscal deficit to a sustainable level. Priorities include:
* Intensify efforts to develop the GST into a modern, broad-based value-added tax byremoving remaining exemptions and effectively extending standard GST to the retail stage.
* Improve implementation of the agricultural income tax by harmonizing tax rates andcoverage across provinces in line with those prevailing in Punjab, and subsequently convertthe land-based tax into a genuine presumptive agricultural income tax to raise its yield.
* Provinces should better exploit their existing taxes (which at present cover only 8% oftotal provincial expenditures) and identify and exploit new tax sources.
* Rationalize the corporate income tax by further reducing tax rates for banking companies.
2.08 Tax administration. Pakistan's resource mobilization efforts have repeatedly beenthwarted by weak tax administration and an unfavorable tax culture. The tax collection machineryis outmoded, and staff are neither properly trained nor appropriately compensated in line with theauthority accorded to them. There is widespread tax evasion based on collusion between taxcollectors and taxpayers, resulting in large leakages of revenues. Moreover, the weakness of taxadministration has forced the government to rely heavily on presumptive and fixed taxes, resultingin low elasticity of the tax system. The government urgently needs to strengthen tax administrationthrough technical, legal, managerial (streamlining staffing, limiting the discretion of tax officials bymeans of greater simplicity and transparency in tax laws and procedures), and accountabilitymeasures. Among other things, the government should effectively implement a registrationenforcement program for GST to reduce the number of non-filers, as well as strengthen the auditcapacity of the GST department to extend the coverage of tax audits. To promote compliance, aninformation exchange program encompassing income tax, GST, and customs is being developed.To effectively implement tax reforms and improve tax administration, the government is currentlyrestructuring the Central Board of Revenue (CBR), under new leadership from the private sector,into an operationally and financially autonomous Pakistan Revenue Service (PRS). A program isbeing initiated to strengthen the capacity of PRS, enhance its skills base, and improve managementand incentives for better tax collection and administration.
2.09 Public expenditure reform. Pakistan's budgetary expenditures are increasingly dominatedby the rising interest burden, defense, and "establishment costs" (civil servants' salaries, benefits,and pensions). Defense and interest together take up more than two-thirds of total federalexpenditures, while the wage bill, interest payments, and subsidies (mainly on wheat) account forthe bulk of provincial expenditures (see Figures 2.1 and 2.2). Development spending and especiallynon-wage O&M have been squeezed in recent years. Expenditures on basic social services, crucialfor developing Pakistan's human capital, are still very low by international standards despitesubstantial increases in recent years under the Social Action Program (SAP). The waste andineffectiveness of much public expenditure sharply reduces its development impact. Publicexpenditure reform is urgently needed because: (1) total non-interest expenditures will need to be
14
strictly contained during the next several years in the interest of macroeconomic stabilization, and(2) the allocation and effectiveness of public expenditures need to be greatly improved.
2.10 The government has akeady made substantial cutbacks in some major categories of publicexpenditure and is initiating actions in others. Between 1990/91 and 1996/97 developmentspending was reduced from 6.4% to 3.4% of GDP and defense expenditure from 6.3% to 5.1%.Further economization of defense expenditure is occurring in 1997/98, with this category targeted toincrease by only 5% in nominal terms and to further decline as a share of GDP to 4.7%. Combinedwith other expenditure controls (hiring freeze, restrictions on purchases of durable goods, tightercontrol over use of telephones, vehicles, etc.), these economy measures have resulted in a onepercent of GDP reduction in the federal government's own budgetary expenditures between 1995/96and 1997/98. Interest payments can be reduced only gradually, by selling government assets andusing the proceeds to retire debt. The technical, administrative, financial, and demand-sideobstacles, and the substantial up-front fiscal costs of privatization in many cases, mean thatexpectations of immediate relief should not be high. The government has been considering majorrestructuring to reduce establishment costs which, if effectively implemented, may over time resultin some savings in the public sector wage bill. However, higher expenditures will be incurredinitially on separation payments to affected employees, and civil service reforms will probably resultin higher remuneration levels for remaining public sector employees.
2.11 Although the government in recent months has made considerable progress, within seriousconstraints, in containing, reorienting, and beginning to restructure public expenditures, the limits ofsuch short-term measures are being approached. Hence a well-thought out yet bold and multi-faceted public expenditure reform strategy is needed, whose main themes would include:
* A thorough rethinking of the role of the government at macro, sectoral, and micro levelsto serve as the basis for restructuring public expenditures.
* An integrated medium-term approach to planning and budgeting of public spending,taking into account fiscal resource constraints over a multi-year horizon. Sustainable levelsof recurrent expenditures for sectors and programs should determine sectoral investmentprograms rather than vice versa.
* Restructuring public sector institutions and service delivery to ensure effectiveutilization of available resources. This will involve, inter alia, greater responsibility forsectoral line agencies; decentralization of control over local/regional infrastructure andpublic services to the provincial or local level where appropriate; privatization of activitiesoutside the proper domain of the public sector; and beneficiary participation and monitoring.
* Civil service reform to develop a leaner, well-managed, more professional civil service,facing an appropriate incentive structure. Not just downsizing but rather a comprehensiveapproach is required (see paras 2.45 - 2.50).
* Greater accountability for public expenditures, which will require, among other actions,strengthening and separating the auditing and accounting functions of govemment,depoliticization of public expenditure decisionmaking, deterring/punishing corruption at all
15

levels, and promoting more effective reviews of public expenditures by the National andProvincial Assemblies.
* Strengthening monitoring and evaluation, based on better, timely information flows, withmeaningful feedback into subsequent public expenditure decisions.
2.12 Provincial finances. Much of the burden of fiscal adjustment inevitably falls on Pakistan'sfour provinces. Together the provinces account for 28.5% of total national budgetary expenditureand a much higher (54%) share of non-defense, non-interest spending, but only 6% of totalrevenues. The bulk of public expenditures on education, health, agriculture, and rural water supplyoccur at the provincial level, while the provinces also account for a large share of total spending onroads, irrigation, urban infrastructure and services, and the wheat subsidy. Most of the governmentadministrative apparatus is located at the provincial level as well. Key structural features ofprovincial finances (see Figure 2.2) include: (i) very high reliance on federal transfers (around 79%of total provincial receipts); (ii) narrow, weak, and inelastic revenue bases which have not been fullyexploited; (iii) expenditures dominated by establishment costs (civil servants' pay, benefits, andpensions), debt servicing, and subsidies on wheat (79% of provincial current expenditure in1997/98); and (iv) substantial provincial indebtedness (mainly to the federal government) and, forthree provinces, persistent large overdrafts with the central bank and chronic cash flow problems.
Figure 2.2: Composition of Provincial Revenue and Current Expenditure
Pirovincial ItrsRevenues Others Interest
21% _\21g._9
Revenuesj _ X | Subsidies4%
4%
DirectTransfersl //
Divisible WagesPool 56%
Transfers67%
2.13 Revenue sharing between the federal and provincial governments is in accordance with theNational Finance Commission (NFC) Award. The 1997 NFC Award introduced sharing of all majortaxes at a uniform rate of 37.5% (see Box 2.1), which has removed the previous bias againstreductions in customs duties and broadening the base of domestic indirect taxes (resulting from
16

differential sharing rates under the previous Award). T he new Award is intenided to encouraoe theprovinces to mobilize more revenues from their owun sources. To this end, the targeted growth rateof the provinces' own revenues has been raised (fromii 8% per year under the previous Award to14.2%), with an incentive in the form of an additional federal matching grant for provinces thatexceed this target. A small fiscal gap also was incorporated into the revenue sharing fonnula as afurther inducement for the provinces to raise more revenue and economize on their expenditures.This gap became greatly enlarged, however. as a result of several developments which occurredafter the NFC Award was promulgated. First, the 1 996/97 outcome in termns of federal revenuecollection turned otlt to be considerably worse than the estimate used in the NFC Award (which wasbased on the 1996/97 Budget target). lowering the base lor federal transfers to the provinces inrelation to the expenditure projections of the Awar.l Second. the major tax reductions of March1997 significantly lowered federal tax revenues and corresponding transfers to the provinces. Andthird, federal tax revenues in 1997/98 are falling sonmcwhat 'hort of the 1997/98 budget estmates.f
Box 2.1: The 1997 NFC Award
The new NFC Award, announced in February 1997 and implemented starting with the 1997/98 budget, broughtsome major structural changes in the formnula and modalities for revenue sharing between the federal and provincialgovernments. Under the new revenue sharing arrangement, the divisible pool of tax revenues has been expanded toincorporate all federally collected taxes, including customs duties which had previously been retained by the federalgovernment in their entirety. As against the previous Award, which allocated 80% of net receipts of taxes in thedivisible pool to the four provinces, the new formula allocates 37.5% of the enlarged divisible pool to the provinces.The inclusion of customs duties in the divisible pool in the new NFC Award has removed the bias against tradeliberalization and broadening of the base of domestic indirect taxes.
The new shares of the federal and provincial governments in the divisible pool were derived by defining: (i) the"National Resource Picture" for the period of the Award (1997198-2002/03), which includes projections for all federaland provincial government revenues and resources likely to become available to the federal government in form of loans(and grants) mobilized intemally and from foreign donors: and (ii) "priority expenditures" (defined to include defense,interest payments, Core Development Program, Social Action Program. and non-SAP development expenditures of theprovincial governments), which need to be protected by the new revenue sharing formnula. As in the past, the revenueassigned to provinces is distributed among them on the basis of their respective populations according to the 1981Census. The smaller provinces of NWFP and Balochistan are also receiving NFC-mandated revenue deficit grantsamounting to Rs 3.3 billion and Rs 4.1 billion, respectively, from the federal government in 1997/98 (to be increasedannually by 11% in nominal terms, subject to subsequent adjustment for inflation in each of the following four years).
The provinces will continue to receive "straight transfers" from the federal govermment on account of royalty,excise duty, and surcharge on natural gas and royalty on crude oil, on the basis of each province's share in totalproduction. Similarly, profits of hydel generation would also continue to be transferred to the provinces by WAPDA.
Under the new Award, greater emphasis is placed on resource mobilization by the provinces, as provincialrevenues are projected to increase by at least 14.2% per year, compared with 8% per year under the 1991 NFC Award.Moreover, as an incentive for additional revenue mobilization by the provinces, the federal government will providethem with matching grants whenever the growth in their revenues exceeds the minimum stipulated growth target. Theprovinces are also expected to finance the rupee components of their development programs from their own revenuesurpluses, and no Cash Development Loan (CDL) would normally be provided to them by the federal government.
4 Specifically. under the old Award (which had been promullated l i 991) the prov inlCcs received 80({ of net nfedeialcollections of sales and income taxes, whereas the fedchral og,nelrirrent had retained receipts from customs duties intheir entirety.
5 Although a large part of this shortfall is being made up hx higheri th.tn hudgeted reenelueS from the O iI surchat-g-.
these are not shared with the provinces.
17

2.14 As a result of these factors the provinces are facing an unprecedented fiscal squeeze. Thefederal government has provided them with special low-interest development loans totaling Rs12billion to cover part of the shortfall. Still, the provinces face a formidable challenge of fiscaladjustment and reform, including rationalizing their administrative structure and staffing;mobilizing much more revenue of their own (from agricultural income tax, urban property tax, etc.)and improving provincial tax administration; privatizing activities where the rationale for publicsector involvement is weak; increasing cost recovery for provincial public services with mainlyprivate benefits; decentralizing service delivery and management for localized public sectoractivities, with beneficiary participation; and strengthening accountability and addressing problemsof corruption and wasteful expenditures.
External Sector Reforms
2.15 Pakistan's exports (see Figure 2.3) are dominated by cotton and textile products (whichaccount for about two thirds of total export value) and a few other agricultural commodities (likerice) and traditional manufactures (carpets, leather goods, sports goods, surgical instruments, etc.).More than half of total exports go to Europe and the USA, while East Asia is the market for anotherfifth of exports, increasing their vulnerability to external shocks. In recent years, Pakistan's exportshave also suffered due to anti-dumping duties and charges of employing child labor and floutingenvironment and health standards. These structural problems and persistent anti-export biases inPakistan's trade and tariff policies have constrained the growth of exports and weakened thecountry's balance of payments position.
Figure 2.3: Composition and Destination of Exports, 1996/97
Composition Destination
Other Iraditional Primarymanufactures' products"
15% Oths9%
Including carlets, leather & leather manufactur, sports goods, surgical and medical prod.Europe
Excluding cottn and le Others 5%
91/1 ~ 1
/_lli | I * I | | _ I_ % _ ffiE I~~~~~~~~Ea'S
Exludn coto an leather
\ I \ l 1E111_~~~1
2.16 After an interruption of almost two years, the present government resumed tariff reforms inMarch 1997, when the maximum tariff rate was reduced from 65% to 45%, the number of differentslabs was reduced from 14 to six, and the regulatory duty of 10% imposed in 1995 was abolishedexcept for a few items. A minimum tariff rate of 10% was imposed on all imports except for wheat,fertilizers, and life-saving drugs. Despite this progress, the tariff structure is still characterized bysubstantial differentiation among rates and distinctions between goods competing with domesticproducts and others, providing excessive protection to some domestic industries. For instance, theimport of plant and machinery is subject to a concessional rate of 10%, except for machinerycompeting with the domestic engineering industry which is taxed at 35%. Turning to non-tariffbarriers, most quantitative restrictions were removed relatively early in the trade liberalizationprocess. However, the remaining 68 items on the negative list still include several textile productswhich can compete with domestic production. At least 17 items are subject to proceduralrequirements which de facto restrict imports.
2.17 The anti-export bias in the trade/tariff regime is only partly diluted by the incentive systemfor exports, which has five main components: (1) concessional tariff rates on imports of machineryused for export production; (2) duty drawbacks which provide reimbursement for import duty anddomestic taxes paid on imported inputs for exports; (3) exemption from import duty and domestictaxes in Export Promotion Zones and bonded warehouses; (4) export financing at concessionalrates; and (5) concessional income tax rates of 0.5-1.0% on export proceeds. Exporters oftencomplain about delays in payment of duty drawbacks and inadequacy of duty drawback rates tocompensate for duties and taxes actually paid.
2.18 Since 1982 Pakistan has been following a managed floating rate system, under which SBPfixes the official exchange rate on a daily basis. There are no restrictions on access to foreignexchange through the banking system for current account transactions. Along with this officialforeign exchange market, there is a legal free market with fluctuating exchange rates, where thepremium over the official exchange rate has typically been in the range of 3-6%. Guided by theobjective of preserving export competitiveness, the official exchange rate has been managed in amanner that has kept the REER broadly stable over the last several years. However, duringprolonged intervals between step devaluations, large positive differentials between inflation inPakistan and in its trading partners led to substantial increases in the REER, temporarily eroding theprice competitiveness of the country's exports.
2.19 Further tariff rationalization and trade liberalization, as well as more effective exportpromotion policies, are essential to provide stronger incentives for reallocation of resources inaccordance with Pakistan's comparative advantage, remove anti-export bias, enhance consumerwelfare, and reduce the current account deficit to a sustainable level. Priorities for reforms includethe following:
* Further lower and rationalize tariff rates, merge the remaining concessional rateswith the statutory regime (except for those relating to international commitments,exports, or time-bound agreements), and eliminate the remaining exemptions.
19

* Phase out remaining quantitative restrictions on imports and exports other than thosebased on health, national security, social, religious, or environmental considerations, andstop using temporary export restrictions as a tool for domestic price management.
* Ensure timely payment of duty drawbacks to exporters. Eventually allow exportersto claim drawbacks on the basis of duties and taxes actually paid.
* Provide automatic access to export credit for exporters on the basis of confirmedexport orders.
* Develop effective institutional mechanisms to address non-tariff barriers inimporting countries, including dumping, child labor, environment and poor healthstandards, etc.
* An active exchange rate policy to promote and maintain the price-competitiveness ofPakistan's exports and institute a unified, market-determined exchange rate regime overthe medium term.
Banking and Capital Market Reforms
2.20 Banking sector. In recent years, the banking sector as a whole, and particularly thenationalized commercial banks (NCBs), have suffered from declining profitability, inefficienciesand rising costs, a weakening capital base, and a large build up of non-performing loans. Thisposes a serious threat to macroeconomic stability and constrains the healthy development of theprivate non-financial sector. Non-performing assets of banks and development finance institutions(DFIs) were estimated at Rs 128 billion, or 18.5% of their total loan portfolio and 5.1% of GDP, asof end-June 1997. Non-performing loans of NCBs accounted for as much as 29% of their loanportfolio.
2.21 The government initiated far-reaching reforms in 1997 to address the structural weaknessesof the banking sector, supported by World Bank technical and financial assistance. These reformsincluded replacing the NCBs' management with professional bank managers from the private sector,amendments in banking laws giving SBP greater autonomy in the formulation of monetary policy,enhancing SBP's authority in banking supervision and regulation, strengthening the loan recoverymachinery, and substantially reducing the flow of bad loans by NCBs and DFIs. Overstaffing inNCBs has been reduced by about 20,000 through voluntary separation schemes, and closure ofabout 1,000 unprofitable branches is in progress. Recoveries of non-performing loans in 1997amounted to Rs 20 billion. Habib Credit and Exchange Bank, a subsidiary of Habib Bank Limited,was successfully privatized.
2.22 Although these measures have arrested the deterioration in the financial position of thebanking system, there is still a long way to go to develop a strong banking sector to cater to thefinancing requirements of a dynamic economy. To achieve this objective, the following actionsneed to be taken in the short to medium term, in line with the banking sector reform program:
20
* Complete the divesture of partially privatized commercial banks and DFIs (i.e. theMuslim Commercial Bank, Allied Bank Limited, Pakistan Industrial Credit andInvestment Corporation, and Bankers' Equity Limited) by selling the remaininggovernment shares.
* Prepare the three remaining public sector commercial banks and two developmentfinance institutions (NDFC and IDBP) for privatization (through accelerated loanrecovery and replacement of remaining bad assets by government securities) andeventually privatize them.
* Phase out the remaining concessional credit schemes except for export credit, andavoid starting any new concessional credit schemes.
* Further reduce the statutory liquidity requirement ratio to 15 % to allow banks moreflexibility in their lending operations and enhance their profitability.
* Yields on National Saving Schemes and other non-marketable instruments shouldbe linked to marketable instruments (Federal Investment Bonds, for example) ofcomparable maturity in order to remove distortions in the structure of interest rates.
2.23 Capital market. Since the start of privatization and opening up of the capital account in1991, and later with the encouragement of private investment in telecommunications, energy, andinfrastructure, Pakistan's equities market has grown rapidly. The paid-up capital of companieslisted at the Karachi Stock Exchange, the oldest and largest bourse in the country, increased from Rs31 billion in June 1991 to Rs 207 billion in June 1997, and their market capitalization from Rs 70billion to Rs 469 billion. Despite this growth, the equities market remains underdeveloped andshallow, vulnerable to manipulation. Markets for commercial paper and corporate bonds arepractically non-existent. This has hindered private sector development and constrained overalleconomic growth.
2.24 The government implemented a number of reforms in March 1997 to strengthen the capitalmarket by removing tax anomalies and offering incentives to attract new investment. Theseincluded relaxation of limits on investment in shares by provident and pension funds and insurancecompanies, withdrawal of withholding tax on foreign investment in fixed-income securities, andmaking NBFIs' investment in listed debt securities eligible for meeting the statutory liquidityrequirement. The 0.5% tax on turnover of shares was discontinued; bonus shares were exemptedfrom tax; and the tax exemption on capital gains was extended by three years beyond June 1998.The government has also rationalized the tax treatment of public and private mutual funds.
2.25 Currently, the government is engaged in further capital market reforms with support fromthe Asian Development Bank. Under this program, legislation has already been enacted to convertthe Corporate Law Authority into an autonomous Securities and Exchange Commission of Pakistan,and Governing Boards of the three stock exchanges have been restructured to improve theirgovernance. Further actions to strengthen the capital market will be needed in the following areas:
21

* Integration of markets through harmonized and automated trading, development ofelectronic linkages between the three stock markets, and development of a centralizedclearing, settlement, and depository system.
* Protection of minority shareholders' interests by effectively implementing morestringent disclosure requirements and penalizing companies for not paying dividendsover long periods of time.
* Further relax restrictions on investment in equities and fixed income securities byinstitutional investors.
* Promote contractual savings through reforms of the insurance and pension andprovident funds.
Public Enterprises and Privatization
2.26 Public enterprises. Although the role of public enterprises (PEs) in production of goodsand services has declined markedly with the privatization of many industrial units, PEs continue toplay a dominant role in infrastructure, energy, telecommunications, and financial services. Atpresent there are about 110 PEs at the federal level (down from over 200 in early 1990s), with atotal of some 620,000 employees. PEs at the provincial level, although large in number, are notvery significant in terms of levels of employment and resource use. PEs suffer from operationalinefficiencies, managerial weaknesses, governance problems, and overstaffing, which have sappedtheir financial viability. The overall deficit (total borrowing requirement) of seven major publicenterprises increased from Rs 31 billion in 1995/96 to Rs 42 billion in 1996/97, equivalent to 1.7%of GDP. The government has to provide injections of budgetary resources to keep loss-making PEsafloat, and they also tend to borrow extensively from the financial system, underminingmacroeconomic stability. Moreover, the inefficiencies of public sector corporations have beenpassed on to the economy in the form of higher prices and lower-quality services, adverselyaffecting consumer welfare and private sector competitiveness.
2.27 Restructuring and privatization of PEs is a key element of the government's reform agenda.Last year committees were constituted to review the performance of and recommend measures forimproving the financial position of the seven large public enterprises. Recommendations includedappointment of professional management, restructuring to improve operational efficiency,expenditure controls, stepped-up efforts to collect overdue receivables and settle arrears betweenpublic enterprises and the government, and rationalization of staffing. These recommendations needto be effectively implemented and also extended to other public enterprises, which would also helpset the stage for privatization.
2.28 Power. Pakistan's public sector power utilities (WAPDA and KESC) face a complex set ofinterrelated problems, which over the past year became so serious that they threatened nationalfiscal stability in addition to bringing both institutions to the brink of financial insolvency -adversely affecting their operations, decimating their investments, and creating serious liquidity
6 These enterprises are: Pakistan Railways, WAPDA, KESC, Sui Northern Gas Pipelines, Sui Southern GasCompany, the Pakistan Telecommunications Company Ltd., and Oil and Gas Development Corporation.
22

problems for other public enterprises through cross-arrears. Large, unmanageable fiscal liabilitieswere being built up, aggravating macroeconomic imbalances. Key problems included:
* Inefficient operations, high line losses and theft, serious overstaffing, governance problems.and deteriorating infrastructure due to inadequate maintenance.
* Inability to collect electricity bills of key consumers (especially provincial governments in1997/98), which has reduced cash flow and complicated liquidity management.
* A highly distorted tariff structure with heavy subsidization of agricultural and low-slabdomestic consumption and free supply to the Federally Administered Tribal Areas (FATA)and Azad Jammu and Kashmir, resulting in over Rs 30 billion of losses in 1997/98.
* Associated overpricing of power for industrial and commercial consumption, which hasreached the point where the alternative of captive generation may become attractive (inaddition to the motivation related to avoiding supply interruptions).
* The induction of substantial amounts of high-cost (relative to WAPDA's existing hydel andother generation facilities) private power capacity, which combined with slower-than-expected growth of power demand has meant that WAPDA is obliged to purchase a growingproportion of high-cost power.
* The government's policy not to increase power tariffs, which was in effect from February1997 to March 1998, combined with the rapid increase in private power generation.
2.29 In response to this crisis situation, the government is putting in place a comprehensiveprogram to bring WAPDA back to financial solvency and improve the efficiency of the powersector. Some of the specific measures being introduced early on in the program are as follow:
* A 21% weighted average increase in electricity tariffs (already implemented), to be followedby the agreed increase in the gas price.
* Reduction of cross subsidies in the tariff structure by limiting the increase for industrial andcommercial consumers to 14% while instituting above-average increases for low-endresidential consumers.
* Settlement of provincial governments' arrears to WAPDA and correspondingly, substantialreductions in WAPDA's payables to its suppliers.
* Establishment of a high-level Steering Committee to provide guidance and coordination andto accelerate WAPDA's restructuring program.
* Creation of a Holding Company to take over the functions of WAPDA's Power Wing,leaving WAPDA with jurisdiction over irrigation and hydel.
23

* Transformation of the National Electric Power Regulatory Authority into a fully autonomousand effectively functioning regulatory agency for the power sector.
* Acceleration of privatization of electricity generation and distribution.
2.30 Given the dire circumstances faced by the power sector, this reform program must beimplemented fully and in a timely manner. Even after implementation of these measures, WAPDAwould face a significant financing gap in 1997/98. Therefore the government has asked foradditional financial assistance from donors to support these reforms.
2.31 Privatization. In view of the serious, worsening problems of public enterprises discussedabove, privatization and opening up activities previously monopolized by the public sector to theprivate sector have been key components of the reform strategy pursued by successive governmentsin recent years. These reforms will help enhance the competitiveness of the economy and freeresources required by the government to provide essential public services and develop physical andsocial infrastructure.
2.32 Pakistan's privatization program has been successful in privatizing small and medium-sizedindustrial units and relatively smaller commercial banks. Ninety industrial units, three commercialbanks and two development banks, five newspapers, and one thermal power plant have beenprivatized and handed over to private management. In addition, minority shareholdings in PakistanTelecommunication Company Limited (PTCL) and Pakistan International Airlines (PIA) have beensold to the private sector through the stock market. However, the pace of privatization has sloweddown significantly in the last two years, particularly in the face of the complexities of disinvestinglarger industrial units and financial institutions and public utilities. This requires putting in placeappropriate regulatory frameworks and developing a strategy to deal with serious labor surplusproblems in large enterprises, but progress in both areas has been slow.
2.33 The government remains firmly committed to privatization and is embarking on a veryambitious program which aims to privatize all remaining banks and non-bank financial institutions,major public utilities, six power generating facilities and six area electricity boards, and anadditional 18 industrial units. The government has already approved the sequence of privatizationtransactions in the power sector, and external financial advisors for the privatization of two areaelectricity boards and KESC have been selected. The process of privatization of PTCL has been re-started. Two national shipping companies are expected to be privatized by June 1998, and PakistanInternational Airlines plans to transfer six of its non-core activities to the private sector. Sale of thenon-core assets of the Pakistan Railways is expected by end-December 1998.
2.34 To better equip the Privatization Commission for the new phase of privatization, theCommission's powers have been substantially increased, giving it full authority over managementof enterprises to be privatized and implementation of any regulatory arrangements necessary forprivatization. The Cabinet Committee on Privatization, which had to refer any decisions onprivatization to the full Cabinet, has been replaced by a high-powered Privatization Board headed bythe Prime Minister. Although these new initiatives are quite promising, achievement of ambitiousprivatization targets will require the implementation of the following additional measures:
24

* Strengthening the regulatory framework. The government must establish the coreinfrastructure regulatory authorities and ensure that these are credible, effective, andautonomous. Authorities already established like the Pakistan TelecommunicationsAuthority, Gas Regulatory Authority, and National Electric Power Regulatory Authorityshould be made fully operational. Such actions will greatly improve the marketability ofpublic sector utilities.
* Removal of labor-related impediments to privatization. The problem of laborsurplus, which is one of the major hurdles in privatization of large public enterprises,should be tackled through attractive voluntary separation schemes within overallbudgetary constraints. Consultation with labor unions to bring them on board in theprocess of privatization also can ease their resistance.
* Further strengthening of the Privatization Commission. The PrivatizationCommission needs to be institutionally strengthened, provided with adequate financialresources, and allowed greater flexibility in recruitment to engage professionallycompetent staff.
* Credibility of the privatization process should be ensured by making it moretransparent and avoiding the governance problems that sometimes detracted from earlierprivatization efforts. Besides, judicial procedures need to be streamlined to settle legalissues in a timely manner.
Agriculture and Manufacturing
2.35 Agriculture. Growth of agriculture, which had averaged at 4% p.a. in the 1980s, declined to2.4% in the last five years. The performance of agriculture has become more volatile, dependent onweather conditions, and susceptible to pest/virus attacks in the 1990s, as traditional sources ofproductivity growth (high-yielding varieties of seeds, expansion of irrigation, use of chemicalfertilizers, farm mechanization, etc.) are being exhausted. Sharp deterioration in the physicalintegrity of the irrigation and drainage system has become a serious threat to the sustainability ofagricultural growth. Besides, agriculture suffers from increasing degradation of land, poor qualityof research and extension services, inefficient public sector marketing of certain agricultural inputsand outputs, imperfections in land markets, and remaining distortions in prices of some inputs andoutputs. Despite attractive price incentives for cotton growers, its output in the past several yearshas remained far below its potential, mainly because of the failure of agricultural researchinstitutions to contain the problem of leaf curl virus attacks.
2.36 Last year the government to a large extent corrected the underpricing of wheat by increasingits procurement price by 38.7%. Prices of rice, cotton, and oilseeds also were increasedsignificantly to provide better incentives for farmers. With the complete removal of quantitativerestrictions on cotton trade as well as elimination of export tax for the last 4-5 years, cotton priceshave risen to international levels, providing much needed incentives for growers. Last year lawswere also enacted to check the adulteration of fertilizers, pesticides, and seeds. Institutional reformshave been initiated in the irrigation and drainage sector with the enactment of legislation andissuance of notification for establishment of the Provincial hrrigation and Drainage Authorities
25

(PIDAs) in all four provinces. Preparations for establishing Area Water Boards (AWBs) andFarmer Organizations (FOs) are underway.
2.37 Putting agriculture on the path of sustained high growth will require:
* Developing PIDAs, AWBs, and FOs as truly autonomous bodies immune frompolitical interference in their day-to-day working. They need to be given full autonomyin fixation and collection of water rates and irrigation cess.
* Over the medium term, improving land titling and registration processes throughcomputerization of land records.
* Further liberalizing the import and marketing of fertilizers and seeds. Fertilizerdistribution should be left completely to the private sector. The government shouldconcentrate on enforcing quality control to curb adulteration of fertilizers and pesticides.
* Phasing out remaining price distortions. Phasing out the subsidy on wheat (andreplacing it with less costly and better targeted programs to ease the burden on the poor) 7and permitting free imports of sugar will result in a higher wheat price and lowersugarcane price, shift resources away from sugarcane to wheat and cotton, and raiseoverall productivity in agriculture.
2.38 Manufacturing. Large-scale manufacturing, which accounts for 70% of value-added in themanufacturing sector, has stagnated in recent years, with average annual growth declining to lessthan 1% in the last three years compared with 7% during the preceding thirteen years. Production isheavily concentrated in the textile and food industries. The textile industry, whose past growth wasdependent on artificially cheap domestic cotton resulting from export restrictions, has been goingthrough a difficult restructuring during the past several years after removal of quantitativerestrictions as well as elimination of export tax. With progressive liberalization of trade, phasingout of subsidized credit (i.e. government sponsored concessional credit schemes and ceilings onbanks' lending rates), and higher prices of key inputs (which had previously been suppressed), otherindustries also are passing through a painful, but essential adjustment phase. By end-June 1997,more than 3,000 financially troubled industrial units had shut down. Transitional problems ofadjustment are being aggravated by ethnic and sectarian strife in major urban centers andgovernance problems.
2.39 Despite progress with opening up the economy to foreign competition, parts of themanufacturing sector remain heavily protected as a result of high and differential tariffs. Tariffprotection for basic metal producers (steel mills, foundries, rerollers) results in high input costs forother industries, particularly the domestic engineering industry. Similarly, inefficiencies of publicsector corporations producing key inputs (like electricity) are adversely affecting thecompetitiveness of the manufacturing sector. The inadequacy of physical infrastructure (roads,ports, railways) is another serious constraint. Although much deregulation of industry has alreadyoccurred, there is still considerable red tape in routine matters where businesses have to deal with
7 Total federal and provincial government expenditure on the generalized, non-targeted wheat subsidy in 1996/97was Rs 11.4 billion. A targeted program of food stamps would require a much smaller budgetary allocation.
26

lower levels of the government bureaucracy. The weakness of the financial sector and the diversionof private savings to finance the fiscal deficit through high-return financial instruments (resulting incrowding out of the private sector) has impeded the growth of the manufacturing sector. Weakinvestor confidence also has hurt manufacturing; gross fixed capital formation in the large-scalemanufacturing in the last three years has declined in real terms to less than two-thirds of its level ofthe early 1990s.
2.40 Revitalization of the manufacturing sector requires actions in the following areas (many ofwhich form part of the structural reform agenda in other spheres of the economy as well):
* Stable macroeconomic policies to provide a strong enabling environment.
* Implementing an outward looking trade policy and maintaining a competitiveexchange rate.
* Strengthening the financial sector to enable it to provide non-inflationary financing forindustrial activity.
- Augmentation of infrastructure and service provision on an efficient basis to removebottlenecks.
Governance and Civil Service Reform
2.41 Governance. The weakness of governance has been an important constraint on Pakistan'seconomic growth and has contributed to the country's other macroeconomic and structuralproblems. Major manifestations of poor governance include the uncertain policy environment,ineffective policy implementation, politicization of economic decisionmaking, widespreadcorruption, weak institutional capacity, limited accountability, difficulties faced by the legal andjudicial system in providing timely recourse, and serious breaches of law and order. Governanceproblems have constrained and distorted the development of the private sector; contributed to taxevasion, loan defaults, and arrears in payment of utility bills; and reduced the effectiveness of publicexpenditure. Political uncertainties generated by frequent changes of government (four since 1988)and confrontations between the various organs of the state have distracted the government'sattention from economic management, undermined its ability to implement needed economicreforms, and discouraged foreign as well as domestic investment.
2.42 Lack of transparency in the government's decisionmaking, discretionary powers enjoyed bypolitical office holders and bureaucrats, and the weakness of auditing have resulted in widespreadcorruption. Tax collection and government procurement and contracting have been particularlyvulnerable to irregularities. Most business firms operating in Pakistan have to regularly bribegovernment functionaries, marginalizing honest and efficient entrepreneurs. Political interference inthe lending decisions of public sector banks and inadequate loan recovery mechanisms have resultedin a huge stock of non-performing bank loans. Until recently, discretionary powers of politiciansand bureaucrats to allocate export quotas, Pakistan Steel Mill products, urban residential plots, POLproducts, etc. were depriving the national exchequer of huge amounts of money. Discretionaryquotas for politicians to allocate public sector jobs and admissions to educational institutions have
27

undermined merit-based selection, demoralized the civil service, and contributed to deterioration inthe quality of education.
2.43 The government took a number of measures last year to improve governance, includingenactment of the Ehtesab (Accountability) Act 1997, appointment of the Chief AccountabilityCommissioner, and establishment of the Accountability Bureau for investigating cases ofcorruption; abolition of block budgetary allocations used by legislators for sponsored localdevelopment projects; termination of legislators' quotas for public sector employment, residentialplots, and admissions to educational institutions; stopping discretionary allocations of Pakistan SteelMill products and POL products; and introduction of an auction system for allocation of exportquotas. These measures are meant to curb corruption among bureaucrats and politicians, curtailwasteful public expenditure, and mobilize public revenues.
2.44 Strong and sustained commitment by the government will be needed to implement amedium-term program to achieve good governance. This would include:
* Improving the accountability process by, among other measures, using moreeffectively the existing instruments in rules governing the conduct of governmentemployees.
* Ensuring transparent and competitive public procurement and contractingpractices to reduce possibilities of kickbacks and enhance the effectiveness of publicexpenditure.
* Designing and implementing civil service reforms to lay the foundations of aprofessional bureaucracy with strong incentives for integrity (see below).
* Further strengthening the legal and judicial system to protect property rights, ensureefficient and speedy resolution of business disputes, and enforce contractual obligations.
* Further deregulating the economy, enlarging the scope and improving the functioningof the market to strengthen competitive forces.
2.45 Civil service reform. Pakistan's civil service has grown with the expansion of governmentroles and activities. Although public sector employment (estimated at about 2.8 million) is not highby international standards, its cost has been rising and (including pensions) now accounts for morethan half of Pakistan's total non-defense, non-interest budgetary expenditures - squeezing fundingfor non-wage O&M and thereby adversely affecting the effectiveness of public expenditures. Whilethe need to economize on costs and reduce unnecessary expenditures constitutes a strong motivationfor reform, even more important is the need to improve the skills mix, incentives, and managementof the civil service so that it can more effectively serve national objectives.
2.46 Pakistan's public sector employees are organized and managed along lines inherited fromcolonial times. The system is overly rigid, hierarchical, and excessively centralized - unsuitable forimplementing the new vision of the role of government as a facilitator, regulator, and effectivepublic service provider. Incentives are lacking for effective performance; accountability is limited,
28

especially to beneficiaries and the general public; and there is widespread corruption, politicization,and demoralization.
2.47 There is widespread consensus on the need for change (including public concern) but muchless agreement on the exact directions and policies to be adopted. Civil service reform is a complexand difficult task, where mistakes are often made as a result of hurried and inadequately consideredreform initiatives. Pakistan's own experience, like that of many other countries, bears this out.While the government moved rapidly to initiate a downsizing exercise involving a "zero-based"review of government agencies, the recommendations of the resulting report could not beimmediately implemented due to concerns about the large numbers of public sector employees thatwould be declared surplus. Instead an untargeted, voluntary "Golden Handshake Scheme" (GHS)was promulgated in 1997, under which employees could retire early with enhanced benefits basedon longer periods of service. More than 80,000 persons responded to this offer, but due toinadequate public sector resources and numerous well-qualified and in-demand employees optingfor retirement, the GHS was shelved at least temporarily. A Commission on AdministrativeRestructuring has been formed to look at public sector reform issues in a more comprehensivemanner.
2.48 Civil service reform should be based on a broad consensus about the role of the state and onthe need to transform civil service skills, management, and incentives so as to effectively fulfill thisrole. In the absence of such a consensus and strong political leadership, a comprehensive reformprogram will be difficult to sustain. Civil service reform would need to encompass pay andbenefits, pensions, personnel management, recruitment practices, career and promotion patterns,rules of business, decentralization, relationships among different civil service cadres and betweencivil servants and politicians, and accountability to beneficiaries, among others. Although thecomprehensive approach to civil service reforn is superior to piecemeal strategies, it requires timeand resources for preparation/design work and prolonged implementation.
2.49 While preparing a comprehensive reform strategy, consistent progress can be made in theshort run by removing abuses and redressing existing irregularities. Options in this regard include:
* Putting in place an integrated management information system on public sectoremployment and personnel expenditures; carrying out provincial civil servants' censusesand publishing the results of the 1997 federal civil servants' census.
* Maintaining and tightening existing recruitment freezes (except in relation to front-linestaff in SAP sectors).
* Stopping new work-charged employment (which has been used to circumvent existingemployment bans and/or to make politically-motivated appointments).
* Terminating all ad hoc appointments and contractual appointments at the end of thecontract period, with all future contractual hiring to be on the basis of specific, well-definedterms of reference.
* Denotifying all unfilled sanctioned posts which have remained vacant over a year.
29

* Undertaking payroll audits to remove ghost workers and pensioners.
* Restructuring the commutation provision in the civil service pension system to avoid anunmanageable surge in public expenditures from this source in the future.
2.50 The federal government is already beginning to implement some of these changes and isconsidering others. The provinces also need to join this effort, since the bulk of civil servants are atthe provincial and lower levels.
Poverty and Human Resource Development
2.51 Poverty. Despite substantial progress in poverty reduction in the 1970s and 1980s, a verysignificant portion of Pakistan's population still suffers from acute poverty. Both economic growthand the flow of remittances from overseas Pakistani workers, which had played an important role inpoverty reduction in the preceding two decades, declined significantly in the 1990s. Annualinflation rose sharply to the double-digit range. Some economic reform initiatives, like privatizationof state-owned enterprises and subsequent shedding of surplus labor as well as withdrawal/reductionof subsidies, particularly on wheat, also may be temporarily hurting the economic position of low-income groups in the transition phase. As a result of these developments, the incidence ofconsumption poverty may have increased since 1991, but the data are ambiguous on this. The 1998Census and an improved household expenditure survey should help clarify the situation.
2.52 The government has been implementing two targeted income transfer programs, namely theZakat Fund and the Bait-ul-Maal, since 1980 and 1992, respectively. Although these programsmake significant income transfers to the poor, they suffer from leakages, partial coverage, andinadequacy of benefits. Through better administration of these programs and by diverting resourcesfrom non-targeted programs like the wheat subsidy, the impact of these programs can besignificantly enhanced. To further augment its poverty alleviation efforts, the government in 1997set up the Pakistan Poverty Alleviation Fund, which will finance income generation projects, microenterprises, and infrastructure projects at the community level mainly through NGOs and the privatesector. The government also recognizes that human resource development, based on expanded andmore effective provision of social services to the population, is critical to poverty alleviation.
2.53 Human resource development. The slow pace of human resource development hasadversely affected Pakistan's medium to long-term growth prospects, as low levels of education andpoor health constrain the growth of productivity in both agriculture and manufacturing. Despitesome improvements over the last decade, Pakistan's social indicators, particularly for women, fallwell short of those of other countries at a comparable stage of development and are among the worstin the South Asia region. Only 35% of the population is literate (20% of women), compared to theaverage literacy ratio of 49% in South Asia and 65% in low-income countries. Pakistan's grossprimary school enrollment rate of about 60% compares unfavorably with the South Asia regionalaverage of 98% and the average of 105% for low-income countries. Gender disparities in educationremain large, with Pakistan's girls' gross enrollment rate of only 49% (as against 69% for boys)comparing unfavorably with India's 91%, Bangladesh's 105%, and Sri Lanka's 105%. As a resultof immunization campaigns infant mortality has fallen, but it still remains high at about 90 per1,000 live births, compared to the average of 64 for low-income countries. While contraceptiveawareness is beginning to grow, use remains low (about 23%). Consequently, the fertility rate (5.3
30

per married woman) and population growth (estimated at 2.8% per year) remain among the highestin the world. Only 45% of the rural population has access to safe drinking water and 20% to any sortof sanitation.
2.54 These low levels of social indicators are manifestations of inability to address social sectorissues in the past, due to (1) inadequate provision of budgetary resources to basic social sectors; (2)poor quality and inadequate coverage of basic social services; (3) weak institutional, management,and implementation capacity of line departments and agencies responsible for providing theseservices; and (4) absence of beneficiary participation in planning and delivery of services, leading toestablishment of inappropriate delivery systems with little or no accountability to stakeholders.
2.55 To address these problems, the government launched the Social Action Program (SAP) in1992, which has been supported by the World Bank and other donors since 1993/94. The SAP aimsto expand and improve the delivery of social services in elementary education, primary health,population welfare, and rural water supply and sanitation (RWSS). The SAP is also striving tostrengthen non-government organizations (NGOs), foster government-NGO-private sectorpartnerships, and encourage greater community participation. To consolidate gains made in the firstphase of SAP, the government is now launching the second phase. Besides continuing to expandaccess to basic social services through further increases in budgetary allocations, the second phaseof SAP will focus on improving the quality of services, particularly education, and enhancing theimpact of expenditures at the facility level. Total budgetary expenditure on social services isprojected to increase from 2% of GDP in the recent past to 2.5% by 2001/2002, with the federal andprovincial governments' contribution to reach at least 1.95% of GDP. The non-salary component ofbudgetary expenditure on basic education and health is targeted to increase by 10% per annum inreal terms. To monitor the effectiveness of SAP, the government will conduct an IntegratedHousehold Survey once every two years and cornmission annual studies to assess the impact of theprogram.
2.56 The major sectoral priorities of the government in the second phase of SAP will be:
* Enhancing the quality of education services by increasing the availability andimproving the quality of textbooks and teaching materials, redeployment of teachers toreduce inequality of student-teacher ratios, and strengthening management andsupervision of schools through appropriate incentives for greater community, NGO, andprivate sector participation. There will be increased emphasis on access to educationalopportunities for girls and working children.
* Strengthening basic health care services from the community level to the first levelof referral, with focus on reproductive health, communicable disease control, and youngchildren. The reforms will aim at improving the quality, client responsiveness andefficiency of government services, with a consequent increase in utilization ofgovernment facilities and an improvement in the health status of the population.
* Continuation of the "Uniform Policy" for the rural water supply and sanitationsector adopted under the first phase of SAP to ensure beneficiary communityinvolvement at each stage of planning, construction, and operation of schemes.
31

* In the area of population welfare, the main thrust will be on expanding coverage offamily planning services and improving their quality, in order to meet unmet demand forthese services -- which is large in rural areas. To this end, the government will continueits efforts to offer family planning services at all health service delivery points. Inaddition, coordination between the government health services and the Ministry ofPopulation Welfare will be improved.
2.57 In education, the strategies articulated by the federal and provincial governments accord toppriority to elementary education, for this is the level of education that can open the broadest range ofeconomic and social opportunities for the greatest number of Pakistan's people at the lowest unitcost. To accomplish this, elementary education needs to be available to all -- boys and girls, richand poor, in urban and rural areas -- and its quality must be raised so that real learning takes place.The efficiency of the system must be increased (e.g. through more effective deployment of teachers)to maximize the impact of available funds. Management and supervision of the education systemneed to be strengthened to ensure that standards are appropriately defined and monitored and thatefforts are focused on improving results in the classroom. Fostering greater participation bvcommunities, NGOs, and the private sector can both complement and reinforce the government'sprograms to raise quality and improve access.
2.58 The overriding priority accorded to elementary education in public funding stems from (i)the large economic and social benefits that basic education brings to students and to the nation; (ii)the fact that a large part of those benefits accrue to the nation as well as to individual students; (iii)the current low levels of coverage and quality of elementary education; and (iv) Pakistan's tightresource constraints, which make it necessary for the government to concentrate scarce public fundswhere the economic and social returns are highest. It is thus essential that publicly funded programscontinue to focus on improving elementary education. Yet other levels of the education system alsohave critical roles to play in developing Pakistan's human resources. For example, secondaryschools produce the teachers that are essential for raising quality at the elementary level. Pakistanneeds to build a broad consensus around a nationwide strategy for education that identifies thepriority needs throughout the system and mobilizes the required public and private resources.
2.59 In health, the government's strategy reflects Pakistan's pattern of disease and mortality andplaces top priority on health education; prevention and control of communicable infectious diseases;and maternal and child health services. Most of these high-priority services can be deliveredthrough first-level health care facilities linked to community-based health workers and backed byreferral services in secondary hospitals at the Tehsil and District levels. Generally, governmentservices should seek to avoid "crowding out" private services when these services are supplied byproviders with the requisite training. (Such private providers are not available in many rural areas.)At the same time, the public sector needs to work with private health care providers and theirprofessional associations to encourage a parallel improvement in private health services. Attentionto private health services is crucial because surveys show that in Pakistan the great majority of thepopulation seeks the care of private providers when they fall ill. The public policy goal should be toachieve an appropriate division of labor between the public and private health sectors.
2.60 In general, public funding should be, and is, focused on the top-priority primary healthservices. However, except for health education and certain interventions to control communicablediseases, this does not mean public funds should bear the full cost of these services or that the public
32

sector should be the only provider. Enhanced cost recovery would increase the resources availablefor public health services. But cost recovery policy in the health sector raises complex issues.Increasing charges for services risks displacing poor patients toward untrained practitioners or self-care. Thus any new system of increased user charges would need to incorporate safeguards toprotect the poor and should be tried out on a pilot basis before being widely adopted. There is alsomuch scope for improving the efficiency of resource use and achieving a greater impact withexisting resources, through reforms such as setting better priorities among different types of inputs;decentralization of management; establishing Health Boards at the district level with broadrepresentation; involving communities in supporting government health care providers and helpingto increase their accountability; contracting out some services to NGOs and the private sector; andplacing greater emphasis on staff development and supervision.
2.61 In rural water sunply and sanitation (RWSS), the objective is to increase the quality,sustainability, and coverage of water supply and sanitation for rural populations and to give higherpriority to sanitation and reverse past underinvestment in this area. Access to safe water andsanitation not only significantly reduces the risk factors associated with water-borne diseases, whichare a major cause of sickness and child death in Pakistan, but also can have other significanteconomic benefits by freeing labor -- particularly of women -- for income-earning opportunities.The national strategy is to involve beneficiary communities in each phase of planning, construction,and operation for all new schemes and rehabilitation of existing schemes, with communities payingfor the operating costs and making increasing contributions to project capital costs. This "uniform"policy, by emphasizing community mobilization in the delivery and financing of RWSS services,will promote sustainable development of the sector.
33
3. MEDIUM-TERM PROSPECTS ANDFINANCING REQUIREMENTS
3.01 Reforms and economic growth. As discussed above, the macroeconomic and structuralchallenges facing Pakistan are formidable. Stabilizing Pakistan's macro-economy by substantiallyreducing its fiscal and balance of payments deficits is a key priority. As is demonstrated by theexperience of other countries, sound macroeconomic policies, combined with broad-based structuralreforms, are critical for improving productivity and competitiveness and achieving higher economicgrowth over the medium term. International experience demonstrates that low-income countries cangrow very rapidly on a sustained basis. Through reforming trade policy and high investment inpeople and in physical capital and technology, low-income countries can greatly increase theproductivity of labor and land, their two main resources in most cases, and substantially enhancetheir growth potential. If the government's stabilization and reform program is implementedeffectively and in a sustained manner, Pakistan's economy should be able to grow at 6-7% per yearover the medium term. Depending on growth rates in other countries, this would allow Pakistan tojoin the ranks of the middle-income countries in the second decade of the 21st century. This fasterpace of economic growth would bring higher living standards, more rapid employment generation,and much greater progress in reducing poverty than in the recent past. Higher growth would need tobe based on higher investment, substantial improvements in the skill base of the labor force, and asignificant acceleration in productivity growth. On the other hand, if the government fails tostabilize the economy in a sustained manner and is unable to effectively implement key structuralreforms, then growth would continue to be slow, with a further build-up of balance of paymentspressures and rising public sector debt, unemployment, and poverty as well as worsening socialtensions.
3.02 Pakistan must also address formidable longer-term development challenges as it moves intothe 21st century. The country must make up for past shortcomings in the key areas of humanresource development and basic infrastructure. Strong efforts are needed to strengthen the financialsector and raise saving and investment. Pakistan must slow down its rapid population growth(estimated at 2.8% per year) and generate robust employment growth in the private sector. Greaterflexibility and resilience in the economic structure -- by diversifying exports and the productive baseand by opening up the economy to international competition -- is urgently needed. Moreover,Pakistan needs to strengthen its legal institutions and reform public administration, better manage itsnatural resource base, and tackle serious governance problems. Sustained progress in all of theseareas is essential to improve the country's economic standing among developing countries and bringits social indicators up to the average for low-income countries.
3.03 The government's medium-term macroeconomic program covering the period 1997/98 to1999/2000, supported by the ESAF/EFF arrangements, seeks to accelerate economic growth from3% per year to 5.5-6% per year, progressively lower the annual inflation rate from 12% to 7%, andreduce the current account deficit of the balance of payments from 6% of GDP to 4%, with asignificant build-up of official reserves by end-June 2000. The key macroeconomic policy actionsto achieve the above targets are: (i) lowering the fiscal deficit to 5% of GDP in 1997/98 and to 4%of GDP by the third year of the program, supplemented by significant improvements in the
34

operating position of major public corporations; (ii) maintaining prudent limits on monetary growth;and (iii) a substantial increase in domestic investment and national savings to 19.4% and 15.2% ofGDP, respectively, by 1999/2000, compared to programmed levels of 17.8% and 12.6% of GDP,respectively, in 1997/98. Regarding the exchange rate of the rupee, the government is committed totake further exchange rate action if warranted by developments in the external accounts. Moreover,under the ESAF/EFF program, the authorities have begun to introduce a set of reform measures todevelop the foreign exchange market and progressively reduce the direct role of the central bank indetermination of the exchange rate, as well as phasing out the current subsidy in the provision offorward cover for FCDs over the medium-term.
3.04 Fiscal costs of reforms. The reforms needed to bring about sustained rapid economicgrowth in many cases carry substantial up-front fiscal costs. Severance payments to retrenchedemployees of public sector banks have already cost more than Rs 30 billion (1.2% of GDP), and thecosts of staff reductions in other public enterprises and government departments (especially at theprovincial level) would be even larger. Further tariff reductions, an essential component of tradereform, would result in substantial short-term fiscal losses in the form of foregone revenue.Recapitalizing public sector banks to prepare them for privatization could require a capital injectionof Rs 60 billion or more (2.4% of GDP), with an annual interest cost to the government on the orderof 0.4% of GDP. These and other fiscal costs greatly complicate the task of reform and may deterimplementation entirely in some cases.
3.05 Fiscal space urgently needs to be created to help cover the costs of reforms, as well as topermit increases in high-priority social and other spending. This underscores the importance of taxreforms and improvements in tax administration. In this context, broad-basing of the General SalesTax, in particular its extension to commence, is of critical importance. Similarly, the agriculturaltax needs to be effectively implemented and subsequently improved to enhance its revenue yield.Other provincial taxes also should be exploited much more fully (for example the urban propertytax). And most important, drastic improvements in tax administration will greatly increase the yieldfrom existing taxes. Since all of these reforms will take time to reap substantial benefits in the formof higher revenue, fiscal costs will constrain the pace of reform implementation in the near future.
3.06 External funding needs. Even if the recent success in reducing the current account deficitis sustained, Pakistan will continue to require large amounts of external financing during the nextseveral years. Increased amortization required for the short-term foreign loans contracted in recentyears and the need to replenish foreign exchange reserves add to external financing needs. Thefinancial problems of public enterprises also are spilling over into the external sector. Pakistan'sexternal funding requirements are projected at around $8 billion per year in the next two years on agross basis, inclusive of short-term debt amortization.
3.07 The recent pattern of increasing reliance on short-term and potentially volatile sources ofexternal financing (mainly short-term commercial borrowing and FCDs) carries serious risks andneeds to be changed. Pakistan should replace much of its short-term borrowing and over-relianceon FCDs with more stable, longer-term funds, especially non-debt creating capital inflows likeforeign direct investment and portfolio investment. The East Asian crisis, which has resulted in aworldwide decline in investor confidence with respect to developing countries, has made efforts to
35

improve the quality of Pakistan's external financing all the more difficult. Nevertheless, a smoothflow of good-quality external financing is very important for the success of Pakistan's stabilizationefforts and reform program, for several reasons: (1) to prevent heightened external vulnerability anddamaging liquidity shortfalls during the adjustment process; (2) to support adequate levels ofinvestment and growth during the transition, without which painful stabilization measures wouldcarry excessively high political and social costs, threatening their sustainability; and (3) to helpsmooth out the large up-front fiscal costs of critical reforms and soften the trade-off between thesereforms and fiscal stabilization. Most foreign financing of the balance of payments will have tocome from private/commercial sources. In this context, it is unfortunate that a variety of factors --ranging from the conflict between the government, judiciary, and President in the latter part of 1997to the East Asian crisis -- have so far defeated the government's efforts to bolster foreignconfidence. The perceived high country risk associated with Pakistan, political uncertainties and theproblematic law and order situation, the downgrading of Pakistan's credit rating, and the East Asiancrisis have adversely affected the country's access to world capital markets and the terms on whichfunds are available. It is therefore essential to further build up policy credibility by steadfastlymaintaining a prudent macroeconomic stance and by moving ahead boldly and in a sustainedmanner with the government's reforn program. This is necessary not only to attract the foreignresources needed to permit a smoother path of adjustment but more important to create a stablepolicy environment in which Pakistan can thrive based on strong private sector development.
3.08 Development assistance. Despite constraints, official development assistance will continueto be a major source of capital flows to Pakistan over the next three years. In particular, providedthat the stabilization and reform program as a whole remains on track and there is clear evidence ofthe strong political will and follow-through in implementation that are essential for the success ofreforms, donor financing may help finance the up-front fiscal costs of key reforms. (This hasalready occurred in the case of the World Bank supported Banking Sector Adjustment Loan.)
3.09 As in the case of private capital, new commitments from donors will depend on whetherPakistan successfully implements the policies agreed under the ESAF/EFF arrangements --including maintaining a firm commitment to macroeconomic stability, avoiding external liquidityproblems, and making strong headway in addressing key structural issues (including in the powersector) -- and promoting human development. In particular, donors will look closely at thefollowing issues:
* Revenue mobilization. hi order to create fiscal space for high-priority social and otherexpenditures as well as to cover the large fiscal costs of reforms, Pakistan must significantlyraise its tax-GDP ratio from the present very low level of 13%. This needs to be done in anon-distortionary manner and requires both base-broadening and drastic improvements intax administration.
• Expenditure prioritization. In view of Pakistan's poor social indicators, sustainedcomrnitment to adequately fund and effectively implement the Social Action Program willbe of critical importance for mobilizing donor funding. It is also important that high-prioritydevelopment projects be protected from fiscal cutbacks, and that scarce public sectorresources (including guarantees) not be diverted to unsustainable, low-priority infrastructureprojects.
36

* Aid utilization. The pace and effectiveness with which aid is utilized also will influence thelevel of donors' new commitments. Pakistan has accumulated a large overhang ofcommitted but undisbursed foreign assistance totaling more than $7 billion, which is costlyfor the country and a matter of concern to donors. Effective utilization of aid depends on,among other factors, the ability of the government to provide adequate counterpart fundingand ensure that sufficient resources are available for O&M. Prioritization of foreignassistance and avoiding large new commitments with heavy counterpart fundingrequirements may be necessary in the current severely constrained fiscal environment.
3.10 These considerations point to the need for well-thought out, thoroughgoing public sectorreforms along the lines discussed in Chapter 2 and for careful monitoring of progress in this area.
37

Table 3.1: Pakistan: Key Economic Indicators, 1995/96 - 1997/98
Preliminary Projections 1/1995/96 1996/97 1997/98
Output and prices (annual percent change)Real GDP at factor cost 4.6 3.1 5.0GDP deflator at factor cost 10.9 11.3 8.5Consumer price index (period average) 10.8 11.8 8.0Nominal GDP at market prices 15.4 15.3 13.9
Investment and savings (in percent of GDP)Total investment 18.6 18.2 17.5Gross domestic savings 12.6 13.3 14.9Gross national savings 11.8 12.2 13.5
Budgetary revenue 17.0 15.3 15.8Budgetary expenditure 23.8 21.5 20.9Budgetary deficit 6.9 6.1 5.2
Domestic debt 42.3 41.9 40.9
Monetary sector (annual percent change)Net foreign assets 2/ -4.7 -3.5 1.4Net domestic assets 2/ 18.5 15.8 14.2Domestic liquidity 13.8 12.2 15.6
External sector ( in percent of GDP)Merchandise exports 13.3 12.6 13.4Merchandise imports -18.5 -17.5 -16.3Current account excl. official transfers -6.8 -6.0 -4.0Current account incl. official transfers -6.5 -5.5 -3.8.External debt 3/ 42.6 43.9 45.8Gross reserves 4/ (in weeks of imports 5/) 8.2 4.9 7.5External debt service ratio 3/ 6/ 24 7 27,9 25.7
1/IMF & Government of Pakistan's projections (as of February 1998). Projections are preliminaryand subject to revision
2/ In relation to beginning-of-period domestic liquidity.3/ Excludes foreign currency deposit liabilities.4/ Excluding gold.5/ Imports of goods and non-factor services.6/ Ratio of medium- and long-term debt service to exports of goods and services and receipts of
private transfers.Source: Government of Pakistan and IMF and World Bank staff estimates.
38

Table 3.2: Pakistan: External Financing, 1995/96 - 1997/98
(US $ million)
Prelininary Projections 1/1995/96 1996/97 1997/98
Current account balance 2/ -4,575 -4,092 -2,571Trade balance -3,704 -3,223 -1,930
Exports fob 8,311 8,195 8,662Imports fob -12,015 -11,418 -10,592
Service balance -3,249 -3,820 -3,468Private transfers 2,378 2,951 2,827
Amortization -4,010 -4,723 -5,309
Repurchases -273 -317 -248
Change in intemational reserves (increase= -) 624 850 -537
Total financing requirements 8,234 8,283 8,665
Identified financing 8,234 8,283 8,665
Official transfers 227 255 137
Medium- and long-term assistance 5,284 5,185 6,115Public and publicly guaranteed 3,193 3,456 4,265
Project and nonproject aid 2,493 2,304 3,166Project and food aid 2,465 1,780 1,450Other commodity aid 28 524 1,716
Other 700 1,152 1,099Private sector 2,091 1,729 1,850
Short-term credit 3/ 2,446 2,691 2,052
IMF purchases and disbursements 277 152 361
1/IMF & Government of Pakistan's projections (as of February 1998). Projections are preliminary ansubject to revision.
2/ Excluding official transfers.3/Includes errors and omissions.
Source: Government of Pakistan and IMF and World Bank staff estimates.
39

PAKISTAN ECONOMIC UPDATE
ADJUSTMENT AND REFORMSFOR A BETTER FUTURE
STATISTICAL APPENDIX

PAKISTAN ECONOMIC UPDATE
ADJUSTMENT AND REFORMSFOR A BETTER FUTURE
STATISTICAL APPENDIX
Table of Contents Page
Table 1 Sectoral Growth Rates at Constant 1980/81 Factor Cost, 1991/92 - 1996/97 1........... Table 2 Gross Domestic Expenditure as Percentage of GDP (MP), 1988/89 - 1996/97 ........ 1Table 3 Growth Rates -- Gross Domestic Expenditure ........................................................ 2Table 4 Fixed Capital Formation by Economic Sector at Current Market Prices ................. 2Table 5 Summary Balance of Payments, 1989/90 - 1996/97 ............................................... 3Table 6 Composition of Merchandise Exports, 1989/90 - 1996/97 ...................................... 4Table 7 Composition of Merchandise Imports, 1989/90 - 1996/97 ...................................... 5Table 8 Foreign Exchange Rates ............................................................. 6Table 9 Medium and Long-Term Public and Publicly Guaranteed Debt: Annual
Commitments, Disbursements, Service Payments and External Debt Outstanding 7Table 10 Medium and Long-Term Public and Publicly Guaranteed Outstanding Debt by
Creditor Countries/Agencies ............................................................ 8Table 11 Selected External Civilian Debt Indicators, 1991/92 - 1996/97 .............................. 9Table 12 Summary of Public Finances, 1989/90 - 1997/98 .................................................. 10Table 13 Public Sector Development Program, 1996/97 - 1997/98 ...................................... 11Table 14 The Core Development Program, 1996/97 and 1997/98 ......................................... 12Table 15 Monetary Survey, 1989/90 - 1996/97 ............................................................ 13Table 16 Factors Affecting Domestic Liquidity, 1989/90 - 1996/97 ...................................... 14Table 17 Interest Rates on Bank Deposits and Advances, 1992 - 1997 ................................. 15Table 18 Agricultural Production and Inputs, 1989/90 - 1996/97 .......................................... 16Table 19 Foodgrain Utilization, 1989/90 - 1996/97 ............................................................ 17Table 20 Support Prices of Agricultural Commodities, 1989/90 - 1996/97, and Retail
Sale Prices of Fertilizers, 1988/89 - 1995/96 ........................................................... 18Table 21 Production of Selected Industrial Items, 1990/91 - 1996/97 .................................. . 19Table 22 Energy Balance Sheet, 1988/89 - 1996/97 ............................................................ 20Table 23 Price Indices, 1989/90 - 1996/97 ............................................................ 21Table 24 Changes in Price Indices and GDP Deflator, 1989/90 - 1996/97 ............................ 21
Note: This Statistical Appendix consists of historical series (through 1996/97) of the main economic data for Pakistan.The categories of data include: National Accounts, Balance of Payments, External Debt, Public Finances, MonetaryStatistics, Agriculture, Industry, Energy, and Prices. The sources of all the information provided are Government ofPakistan agencies and publications; the latter include the Economic Survey, the State Bank of Pakistan's Annual Report,Economic Survey Statistical Supplement, and the Federal and Provincial Governments' Budget documents. Thoseinterested in more details or raw data are encouraged to consult these sources. Most data for 1996/97 are provisionaland subject to revision. Some of the data presented here may differ from adjusted data used in International MonetaryFund and World Bank publications, including the text of this report, due to differences in definition, adjustments in thedata for other reasons, or staff estimates.

TABLE 1: SECTORAL GROWTH RATES AT CONSTANT 1980/81 FACTOR COST, 1991/92-1996/97(annual percent rate)
Annual Growth Rates1986/87 1991/92 1986/87
Item 1991/92 1992/93 1993/94 1994/95 1995/96 1996/97 1991/92 1996/97 1996/97Revised Prov.
Agriculture 9.5 -5.3 5.2 6.6 5.3 0.7 5.4 2.4 3.9Industry 7.7 5.5 4.6 4.8 3.6 3.3 7.1 4.4 5.7
Mining and quarrying 2.4 3.0 4.7 -4.3 7.1 2.0 7.6 2.4 5.0Manufacturing 8.0 5.4 5.5 3.5 4.4 1.8 6.8 4.1 5.4Construction 6.0 5.8 1.6 1.0 3.3 2.4 4.4 2.8 3.6Electricity,gasandwater 9.1 6.4 3.2 16.8 0.1 11.6 12.8 7.5 10.1
Services 6.8 4.6 4.2 4.8 4.7 4.1 5.4 4.5 5.0Transport, storage & commun. 10.5 6.7 3.7 4.2 0.6 5.0 5.1 4.0 4.6Commerce 7.3 2.9 2.8 4.7 6.2 2.7 6.1 3.8 4.9Financial Inst. 4.3 7.0 14.1 6.3 9.4 1.6 2.6 7.6 5.1Ownership of dwellings 5.3 5.3 5.3 5.3 5.3 5.3 5.3 5.3 5.3Public administration & defense 2.6 2.5 1.4 3.1 3.2 3.6 4.1 2.7 3.4Other services 6.5 6.5 6.5 6.5 6.5 6.5 6.5 6.5 6.5
GDP at factor cost 7.7 2.3 4.5 5.2 4.6 3.1 5.8 3.9 4.9
Memo items Average Mer CapitaPopulation in millions 117.3 120.8 124.5 128.0 131.6 135.3GDP per Capita( Rs) 4095 4066 4127 4223 4295 4307 3821 4185 3969Source: Planning and Development Division.
TABLE 2: GROSS DOMESTIC EXPENDITURE AS PERCENTAGE OF GDP (MP), 1988/89 - 1996/97(at current market prices)
Item 1988/89 1989/90 1990/91 1991/92 1992/93 1993/94 1994/95 1995/96 1996/97Revised Prov.
Available resources 107.4 107.2 106.3 103.5 107.3 103.5 104.2 1-06.3 1' 05.2
Consumption 88.5 88.3 87.3 83.3 86.6 84.1 85.8 87.7 87.0Private 71.7 73.1 73.1 70.5 73.5 72.0 74.2 75.3 74.7Public 16.8 15.1 14.3 12.8 13.0 12.0 11.6 12.3 12.4
Gross domestic investment 18.8 18.9 18.9 19.8 20.4 19.0 18.1 18.6 18.2Gross fixed investment 17.3 17.3 17.4 18.6 19.1 17.9 16.9 17.0 16.6Private 8.3 8.9 8.9 9.8 10.0 9.6 8.7 10.0 11.1Public 9.0 8.4 8.5 8.8 9.1 8.3 8.2 7.0 5.6
Changes in stocks 1.5 1.6 1.5 1.2 1.2 1.2 1.2 1.6 1.6
External resource deficit a/ 7.4 7.2 6.3 3.5 7.3 3.5 4.2 6.3 5.2Exports (G. &N.F.S.) 14.5 16.3 17.0 20.1 17.7 17.8 16.9 17.2 17.7Imports (G. & N.F.S.) 21.9 23.5 23.3 23.6 24.9 21.3 21.2 23.5 22.9
Gross domestic savings b/ 11.5 11.7 12.7 16.7 13.4 15.9 14.2 12.6 13.3Gross national savings 14.1 14.2 14.2 17.1 13.6 15.7 14.3 11.8 12.2Public savings 0.2 2.8 0.7 4.3 1.6 2.5 1.9 -1.1 -2.0Private savings 13.9 11.4 13.5 12.8 12.0 13.2 12.5 12.9 14.2
GDP at market prices 100.0 100.0 100.0 100.0 100.0 100.0 100.0 100.0 100.0
Netfactorincome from abroada/ 2.6 2.4 1.5 0.4 0.1 -0.3 0.2 -0.8 -1.1GNP at market prices 102.6 102.4 101.5 100.4 100.1 99.7 100.2 99.2 98.9
a/ Drivedfrom balance of payments.bl Gross domestic savings=gross national savings minus netfactor incomefrom abroadSource: Planning and Development Division.

2
TABLE 3: GROWTH RATES -- GROSS DOMESTIC EXPENDITURE(at constant 1980181 market prices)
Annual Growth RatesItem 1992/93 1993/94 1994/95 1995/96 1996/97 1986/87 1991/92 1986/87
Revised Prov. 1991/92 1996/97 1996/97
Available resources 5.1 0.8 7.2 6.9 1.1 4.7 4.2 4.4
Consumption 5.4 1.1 7.9 7.1 2.0 4.6 4.7 4.7
Private 3.5 3.2 8.3 7.2 1.9 5.0 4.8 4.9Public 17.8 -10.2 5.5 6.8 3.1 2.2 4.2 3.2
Gross domestic investment 3.9 -0.7 4.1 5.6 -3.4 4.9 1.8 3.4
Gross fixed investment 4.2 -0.9 4.6 5.0 -3.6 4.9 1.8 3.3Private 3.7 2.1 3.1 8.2 -0.5 7.4 3.3 5.3Public 4.7 -3.7 6.2 1.8 -6.7 2.8 0.3 1.5
Changes in stocks -0.1 1.3 -1.4 13.2 -2.0 5.6 2.1 3.8
External resource dericit a] -- -- -- 127.6 -.33.1 -151.7 -277.5 -4.2
Exports (G. & N.F.S.) -4.3 3.8 -9.1 3.9 -2.8 13.1 -1.8 5.4Imports (G. &N.F.S.) 11.1 -10.2 1.5 16.3 -8.7 5.0 1.5 3.2
Gross domestic savings -18.8 25.3 -0.1 -7.8 5.1 10.8 -0.3 5.1Gross national savings -20.0 22.0 2.7 -13.7 3.0 4.2 -2.3 0.9
GDP at market prices 1.9 3.9 5.1 4.6 2.5 6.1 3.6 4.8Net factor income from abroad a/ -68.7 -- -- -- -- -36.9 -224.9 --
GNP at market prices 1.7 3.5 5.6 3.7 2.2 5.1 3.3 4.2
a/Dotted lines show illogical calculationsSource: Planning and Development Division.
TABLE 4: FIXED CAPITAL FORMATION BY ECONOMIC SECTOR AT CURRENT MARKET PRICES(Rs million)
Sectors 1989/90 1990/91 1991/92 1992/93 1993/94 1994/95 1995/96 1996/97Revised Prov.
Total Fixed Capital Formation 148,076 177,646 225,360 256,644 280,877 318,308 369,113 416,724
Private 76,563 91,226 118,878 134,768 150,369 163,219 193,781 224,127
Agriculture 13,931 14,889 14,831 16,631 18,435 22,485 21,776 21,717Miningandquarrying 198 258 321 371 468 1,513 2,112 2,656Manufacturing 29,680 36,169 55,347 60,059 66,901 48,721 58,675 63,029Construction 1,936 1,959 4,306 6,800 8,225 9,455 10,697 11,901Electricity and gas - - - 571 2,911 18,489 23,261 32,127Transport and communication 6,120 8,737 10,001 11,246 8,577 8,007 13,259 16,185Other services 24,698 29,214 34,072 39,090 44,852 54,549 64,001 76,512
Public 71,513 86,420 106,482 121,876 130,508 155,089 175,332 192,597
Post Office & T&T 3,828 6,449 6,290 13,223 9,238 10,521 14,999 16,011Mining & quarrying 1,691 2,303 3,478 3,008 4,519 7,052 6,797 8,069Manufacturing 2,195 2,729 3,193 3,374 2,948 2,457 3,840 5,587Electricity and gas 23,455 24,103 30,881 33,076 37,412 49,510 51,490 54,680Agriculture 1,606 2,795 3,226 3,892 5,964 6,998 9,516 9,784Other services 9,802 11,135 16,436 16,832 19,569 20,018 25,870 36,151
General Government 28,936 36,906 42,978 48,471 50,858 58,533 62,820 62,315Federal 9,165 11,661 13,378 14,459 15,790 19,586 20,118 21,471Provincial 13,999 18,783 23,029 26,961 27,675 31,195 34,522 32,819Local 5,772 6,462 6,571 7,051 7,393 7,752 8,180 8,025
Source: Planning and Development Division.

3
TABLE 5: SUMMARY BALANCE OF PAYMENTS, 1989/90-1996197(US $ million)
Item 1989/90 1990/91 1991/92 1992/93 1993/94 1994/95 1995/96 1996/97Revised Prov.
Trade balance -2,485 -2,483 -2,236 -3,267 -1,940 -2,222 -3,704 -3,223Exports (fo.b) 4,926 5,902 6,762 6,782 6,745 8,074 8,311 8,195Imports (f.o.b) 7,411 8,385 8,998 10,049 8,685 10,296 12,015 11,418
Services (net) -1,616 -1,790 -2,224 -2,748 -2,355 -2,587 -3,249 -3,820Invisible receipts 1,398 1,630 1,581 1,628 1,720 2,150 2,100 1,761Invisible payments -3,014 -3,420 -3,805 -4,376 -4,075 -4,534 -5,349 -5,581(freight & insurance) (643) (709) (734) (880) (784) (918) (1,045) (1,022)(interest) (872) (942) (1,046) (1,159) (1,271) (1,466) (1,631) (1,743)
Private transfers (net) 2,210 2,292 2,961 2,327 2,390 2,397 2,378 2,951(workers' remittances) (1,942) (1,848) (1,467) (1,562) (1,446) (1,866) (1,461) (1,409)
CURRENT ACCOUNT BALANCE -1,891 -1,981 -1,499 -3,688 -1,905 -2,412 -4,575 -4,092
CAPITAL ACCOUNT BALANCE 1,843 2,354 1,925 2,583 2,852 2,679 3,005 2,786
Official transfers (net) 529 604 441 361 314 312 214 255(refugee assistance) (140) (112) (105) (57) (19) (29) (11) (2)
Long-term capital (net) 1,141 1,047 2,091 2,029 2,189 2,381 2,372 1,940Public & publicly guaranteed 937 807 1,478 1,298 1,117 836 1,057 838Project, food, commodity aid 891 748 1,080 850 793 624 681 561Disbursements 1,590 1,542 2,012 2,145 2,250 2,296 2,364 2,304Amortization a/ -699 -794 -932 -1,295 -1,457 -1,672 -1,683 -1,743
Other public (net) b/ 46 59 398 448 324 212 376 277Private (net) 204 240 613 731 1,072 1,545 1,315 1,102
Short-term capital (net) 173 703 -607 193 349 -14 419 591(FEBC's) (85) (93) (53) (133) (50) (190) (46) (110)
Errors and omissions -11 -66 -34 -9 19 -75 -51 233
OVERALL BALANCE -59 307 392 -1,114 966 192 -1,621 -1,073
Net foreign assets (- = inc.) 59 -307 -392 1,083 -966 -129 1,608 1,169State Bank of Pakistan -94 -55 -209 690 -1,491 -297 660 684Gross reserves (- = inc.) -153 71 -431 613 -1,788 -392 624 850IMF (net) 83 -120 222 77 297 95 36 -167Purchases 246 0 325 263 381 210 277 152Repurchases -163 -120 -103 -186 -84 -115 -241 -319
Others -25 -6 0 0 0 0 0 1Foreign currency deposits 266 286 -61 239 693 270 967 195Other barik deposits (net) c/ -113 -538 -122 154 -168 -102 -19 290
MEMO ITEMS:
Gross official reserves 620 572 1,038 469 2,305 2,745 2,053 1,219Reserves in weeks of importsof goods & non-factor services 3.4 2.9 4.8 1.9 10.8 11.1 8.2 4.9
Current account deficitas % of GNP 4.6 4.3 3.1 7.1 3.7 3.6 7.1 6.4
Gold holdings at SBP(thousand ounces) 1,949 1,949 2,021 2,044 2,044 2,055 2,056 2,066a/ Adjustedfor debt relief of US$ 4 million for 1992/93 & 1993/94.b/ Mainly commercial bank borrowing of over one year maturity, including IMF
Trust fund, and rescheduled amortization.cl Includes outstanding exports bills, authorised dealers'and bilateral balances.Source: State Bank of Pakistan

4
TABLE 6: COMPOSITION OF MERCHANDISE EXPORTS, 1989/90-1996/97 a/(US $ million)
Items 1989/90 1990/91 1991/92 1992/93 1993/94 1994/95 1995/96 1996/97
AGRICULTURE 682 758 934 588 322 516 1,011 499CottonValue 443 412 518 271 80 62 507 31Volume (000 MT) 295 282 455 263 75 32 311 21Unit value ($/Kg) 1.50 1.46 1.14 1.03 1.06 1.94 1.63 1.46
RiceValue 239 346 416 317 242 454 504 469Volume (000 MT) 744 1,204 1,512 1,032 984 1,745 1,600 1,767Unit value ($/MT) 321 287 275 307 246 260 315 265
COTTON BASED MANUFACTURES 2,489 3,253 3,618 3,723 3,775 4,627 4,989 4,995Cotton yarnValue 834 1,183 1,174 1,122 1,259 1,528 1,540 1,412Volume (M.Kg) 375 503 506 555 579 522 536 508Unit value ($/Kg) 2.22 2.35 2.32 2.02 2.18 2.93 2.87 2.78
Cotton clothValue 559 676 820 863 821 1,081 1,276 1,262Volume (M.Sq.Mtr) 1,018 1,063 1,196 1,128 1,047 1,161 1,323 1,257Unit value ($/Sq.Mtr) 0.55 0.64 0.69 0.77 0.78 0.93 0.96 1.00
Ready made garments 394 497 614 618 612 642 654 736Made-up articles 399 484 534 616 544 649 775 859
(including towels)Hosiery 274 334 425 464 509 689 703 689Tents & canvas 29 79 51 40 29 38 40 36
OTHER TRADITIONAL EXPORTS 813 960 1,004 1,082 1,179 1,200 1,066 1,102Synthetic textiles 211 347 418 503 648 575 457 514Leather 279 276 241 223 224 272 259 240Fish andpreparations 94 115 115 182 155 154 141 149Carpets & rugsValue 229 222 230 174 152 198 209 199Volume (M. Sq.Mtr) 3,300 3,500 3,900 3,300 3,000 3,411 4,000 4,000Unit value ($/Sq.Mtr) 69 63 59 53 51 58 52 50
NON-TRADITIONAL EXPORTS 970 1,172 1,629 1,479 1,527 1,794 1,712 1,724Leather manufactures 195 262 323 384 376 340 326 357Sport goods 107 136 141 131 199 265 248 311Surgical goods 70 83 91 102 93 114 128 127Fruits & vegetables 54 51 55 56 58 51 54 81Guar gum finished product 42 29 25 25 30 29 43 32Pet. & pet. products 44 99 83 82 54 81 67 82Footwear 23 32 40 38 38 49 51 52Others 435 481 871 660 679 867 794 682
EXPORTS (c.i.f) 4,954 6,133 6,904 6,872 6,803 8,137 8,778 8,320Adjustments b/ -28 -231 -142 -90 -58 -63 -467 -125EXPORTS (f.o.b) 4,926 5,902 6,762 6,782 6,745 8,074 8,311 8,195
EXPORTS BY ECONOMIC CATEGORIESPrimary commodities 20.3 18.7 19.0 14.8 10.4 11.2 16.1 11.2Semi-manufactures 23.6 24.4 21.4 20.6 23.7 24.9 22.3 20.6Manufactured goods 56.0 56.9 59.6 64.6 65.9 63.9 61.6 68.2
Total percentage 100.0 100.0 100.0 100.0 100.0 100.0 100.0 100.0
a/ The breakdown of total cif exports is based on customs data. After adjustments forleads, lags and freight the value of total exports on payment basis (fob) is determined.
b/Adjustments account forfreight, insurance, and lead/lags between custom declarations and payments.Source: Planning and Development Division.

5
TABLE 7: COMPOSITION OF MERCHANDISE IMPORTS, 1989/90-1996/97 a/(US $ million)
Items 1989/90 1990/91 1991/92 1992/93 1993/94 1994/95 1995/96 1996/97
WheatValue 402 141 341 467 238 413 449 485Volume (OOOMT) 2,047 972 2,018 2,868 1,902 2,616 1,968 2,500Unit value ($/MT) 197 145 169 163 125 158 228 194
TeaValue 180 166 173 207 187 188 170 134Volume (mil.kg) 108 104 110 126 116 117 115 85Unit value ($/kg) 1.67 1.60 1.57 1.65 1.61 1.61 1.48 1.58
Edible oilValue 373 402 403 584 488 997 856 612Volume (OOOMT) 940 959 1,046 1,331 1,131 1,395 1,143 1,057Unit value ($1MT) 397 419 386 438 431 715 749 579
SugarValue 90 160 37 22 15 2 2 253Volume (OOOMT) 209 433 117 75 48 5 3 681Unitvalue ($/MT) 429 370 315 292 312 440 504 371
Crude oilValue 422 609 544 532 446 495 509 583Volume (OOOMT) 3,516 4,038 4,076 4,178 4,102 3,928 3,992 3,844Unitvalue($1MT) 120 151 133 127 109 126 127 152
POL productsValue 741 1,082 841 1,011 954 1,092 1,480 1,672Volume (OOOMT) 5,084 4,337 5,206 6,530 7,474 8,177 10,369 10,418Unit value ($/MT) 146 250 161 155 128 134 143 160
FertilizersValue 207 264 256 249 267 128 345 387Volume (OOOMT) 1,128 1,177 1,269 1,427 1,524 602 1,493 1,703Unit value ($/MT) 183 224 202 175 175 212 231 227
Iron, steel & scrapValue 316 327 429 374 365 393 517 505Volume (OOOMT) 848 1,044 1,394 1,088 846 939 1,094 1,279Unitvalue ($/MT) 373 313 308 344 431 419 473 395
Artificial silk yarnValue 107 88 105 76 58 44 58 50Volume (OOOMT) 32 27 29 22 19 13 15 15Unit value ($/MT) 3,383 3,271 3,566 3,415 3,045 3,377 3,897 3,336
Insecticides 58 65 78 67 57 97 154 139Medicinal products 174 197 209 230 232 264 327 273Other chemicals 716 666 893 909 906 1,084 1,364 1,184Electrical machinery 198 217 301 268 295 277 441 425Machinery non-electrical 1,185 1,291 2,195 2,149 1,590 2,094 2,113 2,317Motor vehicles 405 445 489 992 542 437 478 450Other imports 2,570 3,134 2,476 2,815 2,845 3,212 3,799 3,225
TOTAL IMPORTSValue (c.i.f) 8,054 9,094 9,732 10,929 9,469 11,214 13,060 12,440Adjustments -643 -709 -734 -880 -784 -918 -1,045 -1,022Value (f.o.b) 7,411 8,385 8,998 10,049 8,685 10,296 12,015 11,418
IMPORTS BY ECONOMIC CATEGORIES
Raw materials 48.4 51.4 45.2 43.9 48.8 51.5 51.1 48.3Consumer goods 41.4 44.6 38.6 38.4 42.7 46.3 45.4 43.5Capital goods 7.0 6.8 6.6 5.5 6.1 5.2 5.7 4.8
Consumer goods 19.1 15.7 12.8 13.9 13.5 13.5 13.6 15.2Capital goods 32.5 32.9 42.0 42.1 37.7 35.0 35.3 36.5
Total Percentage 100 100 100 100 100 100 100 100
al The breakdown of total imports is based on customs data, exceptfor "other imports " which in addition to small itemsof customs data include defence related imports and other adjustments to make the data on payment basis.
Source: Planning and Development Division.
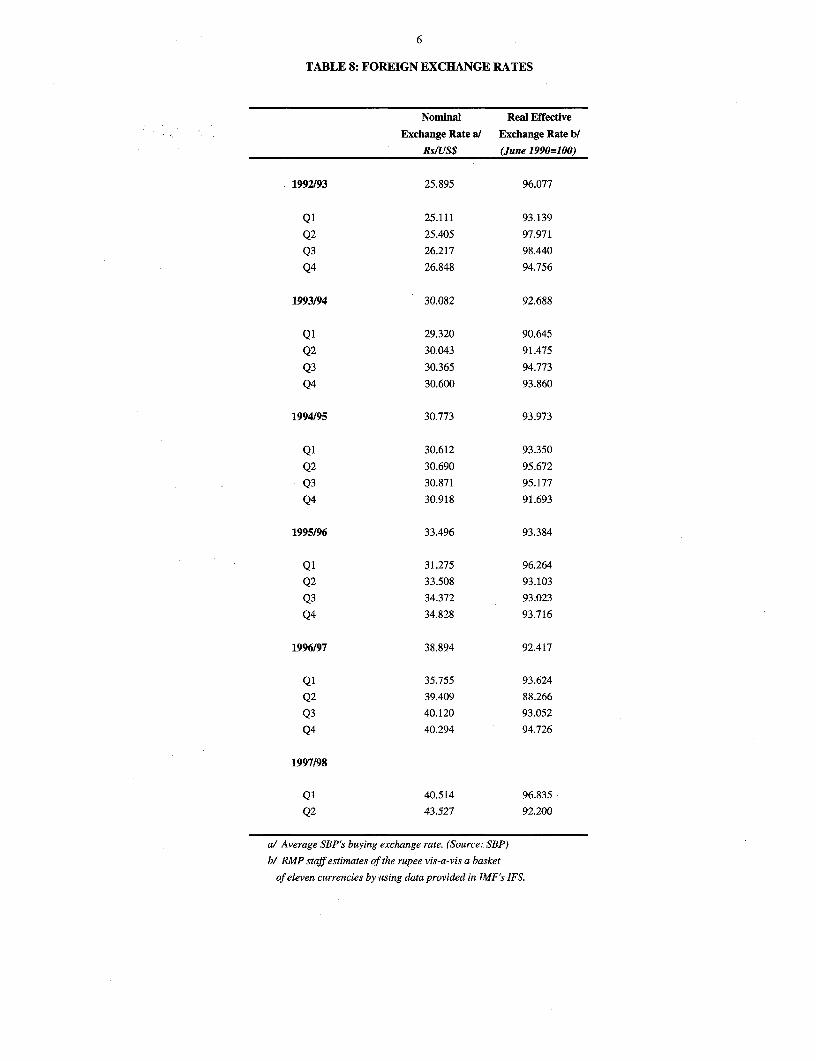
6
TABLE 8: FOREIGN EXCHANGE RATES
Nominal Real Effective
Exchange Rate a/ Exchange Rate b/
RsIUS$ (June 1990=100)
1992/93 25.895 96.077
Q1 25.111 93.139
Q2 25.405 97.971
Q3 26.217 98.440
Q4 26.848 94.756
1993194 30.082 92.688
Q1 29.320 90.645
Q2 30.043 91.475
Q3 30.365 94.773
Q4 30.600 93.860
1994/95 30.773 93.973
Q1 30.612 93.350
Q2 30.690 95.672Q3 30.871 95.177
Q4 30.918 91.693
1995/96 33.496 93.384
Q1 31.275 96.264
Q2 33.508 93.103Q3 34.372 93.023
Q4 34.828 93.716
1996/97 38.894 92.417
Q1 35.755 93.624
Q2 39.409 88.266Q3 40.120 93.052
Q4 40.294 94.726
1997/98
Q1 40.514 96.835Q2 43.527 92.200
a/ Average SBP's buying exchange rate. (Source: SBP)
bl RMP staff estimates of the rupee vis-a-vis a basket
of eleven currencies by using data provided in IMF's IFS.

7
TABLE 9: MEDIUM AND LONG-TERM PUBLIC AND PUBLICLY GUARANTEED DEBTANNUAL COMMITMENTS, DISBURSEMENTS, SERVICE PAYMENTS
AND EXTERNAL DEBT OUTSTANDING(US $ million)
Debt outstanding Transactions during period Service Payments a/ Debt Servicing as % of b/Year end of neriod Exports Foreign GNP(mp)
Disbs Undisbursed Commitments Disbursements Principal Interest Total Receipts Exchange CurrentEarnings Prices
1980/81 8,765 2,579 973 972 360 243 603 20.4 10.4 2.()
1981/82 8,799 2,921 1,620 1,102 288 203 491 19.9 8.8 1.5
1982/83 9,312 3,087 1,587 1,301 390 244 634 23.5 9.6 2.0
1983/84 9.469 3,436 1,989 1,176 453 274 727 26.3 10.9 2.1
1984/85 9,732 4,321 2,311 1,257 513 275 788 31.6 12.9 2.3
1985/86 11,108 5,242 2,294 1,528 603 303 906 29.5 13.5 2.6
1986/87 12,023 6,113 2,626 1,399 723 378 1,101 29.9 15.6 3.1
1987/88 12,913 7,070 2,687 1,824 691 426 1,117 25.1 14.7 2.8
1988/89 14,190 7.372 3,313 3/ 2,619 3/ 685 440 1,125 24.1 14.4 2.7
1989/90 15,094 8,582 3,424 3/ 2,342 3/ 750 506 1,256 25.4 14.7 3.1
1990/91 15,471 9,232 2,576 2,156 783 534 1,317 21.5 13.4 2.8
1991/92 17,361 9,436 2,689 2,471 921 592 1,513 21.9 13.4 3.1
1992/93 19,044 9,082 1,897 2,493 999 646 1,645 23.9 15.3 3.2
1993/94 20,322 8,823 2,581 2,549 1,078 668 1,746 25.7 16.1 3.4
1994/95 21,324 10,127 3,025 2,600 1,294 748 2,042 25.1 16.2 3.3
1995/96 23,133 7,762 2,681 2,565 1,347 791 2,137 24.7 16.7 3.3
1996/97 23,655 8,121 1,759 2,233 1,520 745 2,265 27.6 17.5 3.6
a/ Excludes interest on short-term borrowing and IMF charges.bl Debt service ratios presented here refer to only MLT public and publicly guranteed debt, which accounts,for 80%
or more of external civilian debt.cl Inclusive of IMF (SAF) Loan.Source: Economic Survey of Pakistan/Economic Affairs Division.

8
TABLE 10: MEDIUM AND LONG-TERM PUBLIC AND PUBLICLY GUARANTEEDOUTSTANDING DEBT BY CREDITOR COUNTRIES/AGENCIES
(US $ million)
DEBT DISBURSEMENTS REPAYMENTS REVISEDDISBURSED AND OF LOANS FROM PRINCIPAL DEBT
PA R T IC U LA R S OUTSTANDING JULY 01,1996 JULY 01,1996 OUTSTANDINGASON TO TO AS ON
JULY 01, 1996 JUNE 30,1997 JUNE 30,1997 JUNE 30,1997(1) (2) (3) (4) (2+3-4=5)
I-Consortium 21,648.5 1,814.0 1,223.3 22,239.2(a) Bilateral 11,089.1 690.2 749.8 11,029.5
1. Belgium 68.7 0.0 7.2 61.52. Canada 396.2 0.0 26.8 369.43. France 1,095.0 19.0 66.7 1,047.34. Germany 1,734.2 32.0 108.0 1,658.25. Italy 275.2 0.9 9.3 266.86. Japan 4,514.0 265.6 167.1 4,612.57. Netherlands 178.8 0.0 14.0 164.88. Norway 26.1 0.2 2.5 23.89. Sweden 65.9 20.4 13.8 72.510.U.K 11.6 0.0 0.4 11.2ll.U.S.A. 2,703.1 350.9 333.7 2,720.312. NORDIC 20.3 1.2 0.3 21.2
(b) Multilateral 10,559.4 1,123.8 473.5 11,209.71. ADB 4,294.7 454.8 194.6 4,554.92. IBRD 2,868.8 356.8 230.2 2,995.43. IDA 3,238.5 293.9 41.4 3,491.04. IFAD 124.0 18.3 4.8 137.55. IFC 33.4 0.0 2.5 30.9
11-Non-Consortium 1,484.9 227.1 295.8 1,416.2(c) Bilateral 1,339.5 152.6 263.1 1,229.0
1. Austria 29.3 0.0 5.6 23.72. Australia 66.4 85.0 64.4 87.03. China 481.2 15.3 72.5 424.04. Czechoslovakia 12.6 5.8 2.8 15.65. Denmark 28.1 0.0 1.6 26.56. Finland 9.4 0.0 1.8 7.67. Switzerland 80.5 9.4 8.4 81.58. USSR 149.5 0.0 41.3 108.29. Korea 25.1 0.0 3.7 21.410. Kuwait 76.6 1.3 7.7 70.211. Libya 27.8 0.0 6.2 21.612. Saudi Arabia 236.4 4.7 14.7 226.413. UAE 75.0 0.0 4.6 70.414. Malaysia 30.3 0.0 21.7 8.615. Oman 3.2 0.0 3.2 0.016. Spain 8.1 31.1 2.9 36.3
(d) Multilateral 145.4 74.5 32.7 187.21. IDB 47.1 7.9 7.2 47.82. N.B.P. Bahrain 0.0 45.0 10.0 35.03. OPEC Fund 98.3 21.6 15.5 104.4
TOTAL (1+11): 23,133.4 2,041.1 1,519.1 23,655.4
Source: Economic Affairs Division ( R & DM) Wing.

9
TABLE 11: SELECTED EXTERNAL CIVILIAN DEBT INDICATORS, 1991/92-1996/97(US $ million unless otherwise indicated)
1991/92 1992/93 1993/94 1994/95 1995/96 1996/97
Total debt outstanding 19,231 21,461 23,579 24,450 27,277 27,726
Medium and long-term debt 18.634 20,534 22,344 23,194 25,811 26,466Official 17,361 19,044 20,322 21,324 23,133 23,655Commercial banks 157 309 390 420 961 1,165IMF 944 941 1,350 1,226 1,525 1,363Other 171 240 282 224 192 283
Short-term debt 598 927 1,235 1,256 1,466 1,260
Total debt outstanding /GDP (%) 39.5 41.5 45.2 40.1 49.0 47.6Medium and long-term debt 38.2 39.7 42.8 38.0 46.3 45.4Short-term debt/GDP (%) 1.2 1.8 2.4 2.1 2.6 2.2
Total debt outstanding/exports GNFS (%) 272 247 280 205 238 243
Total debt service payments 1,985 2,332 2,493 3,414 3,331 4,204Medium and long-term debt (prin. & interest) 1,928 2,274 2,408 3,284 3,198 4,089Short-term PPG debt (interest) 58 58 85 130 133 115
Debt service/exports (%) a/ 20.5 23.6 25.4 28.7 29.1 36.9
Averageinterestrate (%)b/ 3.2 3.5 3.3 3.6 3.6 3.3
Interest payments/GDP (%) 1.3 1.5 1.5 1.5 1.8 1.5
a/ Total debt service as a ratio of exports of goods, service and remittances.b/ Interest payments as a ratio of the debt stock.Source: Ministry of Finance, Economic Affairs and Statistics Division, World Debt Tables
and staff estimates.

10
TABLE 12: SUMMARY OF PUBLIC FINANCES, 1989/90-1997/98 a/(Rs billion)
Prov. Revised BudgetActuals Actuals Estimates Estimates
1989/90 1990/91 1991/92 1992/93 1993/94 1994/95 1995/96 1996/97 1997/98
Total revenue b/ 165.6 171.8 231.0 239.5 271.0 320.1 368.6 383.7 449.3
Tax and non-tax 158.8 163.8 216.7 239.5 271.0 320.1 368.6 383.7 449.3Tax revenue 119.4 129.6 164.4 178.4 208.7 259.6 305.6 322.0 362.2Direct taxes 15.7 20.8 29.5 37.8 44.7 62.9 80.0 80.0 102.9Income and profits 14.3 19.1 27.7 35.0 41.8 59.2 75.7 74.0 93.0Property 1.4 1.7 1.9 2.8 2.9 3.7 4.4 6.1 9.9
Taxes on goods and services 38.9 41.9 51.5 59.1 65.4 88.2 101.8 111.8 119.1Excises 23.3 25.0 30.7 35.6 35.0 44.6 51.9 56.2 66.2Sales tax 15.6 16.9 20.8 23.5 30.4 4326 49.9 55.7 52.9
On imports 7.6 7.8 10.0 11.1 14.3 23.3 28.1 35.9 30.6On domestic transactions 8.0 9.1 10.8 12.5 16.1 20.3 21.8 19.8 22.3
Net development surcharges 9.7 12.3 14.8 12.2 26.5 20.2 24.9 24.8 44.6Petroleum 4.9 9.1 7.5 5.7 17.2 12.6 15.1 21.6 40.6Natural gas 4.8 3.2 7.3 6.5 9.3 7.5 9.8 3.2 4.1
Custom 50.7 50.5 61.8 63.2 65.1 77.7 88.9 86.1 80.1Other taxes 4.4 4.1 6.7 6.0 7.1 10.7 10.0 19.2 15.5
Non-tax 39.4 34.2 52.3 61.1 62.3 60.5 63.0 61.7 87.1
Surplus of autonomous bodies 6.8 7.9 14.3 0.0 0.0 0.0 0.0 0.0 0.0
Total expenditure andnet lending 221.7 261.0 321.0 349.1 364.7 426.2 517.4 537.1 597.3
Total expenditure 221.7 259.2 321.0 349.1 364.7 426.2 517.4 537.1 597.3
Current 165.6 195.7 234.4 273.6 293.1 343.9 423.1 451.9 507.2of which:Defense 58.7 64.6 75.8 87.5 91.8 104.5 119.7 127.4 133.0Interest payments 46.7 50.1 52.5 75.5 86.2 94.2 128.0 145.6 183.9Subsidies 9.0 10.7 10.1 7.3 5.1 6.5 10.7 12.9 13.3
Development c/ 56.1 65.3 86.6 75.5 71.5 82.3 94.2 85.2 90.1
Net lending and equityparticipation d/ 0.0 1.8 0.0 0.0 0.0 0.0 0.0 0.0 0.0
Fiscal deficit -56.1 -89.2 -90.0 -109.5 -93.7 -106.1 -148.8 -153.4 -148.0
Financing 56.1 89.2 90.0 109.5 93.7 106.1 148.8 153.4 148.0External (net) 23.0 22.1 18.0 25.4 25.2 28.9 27.0 21.4 29.5Domestic (net) 33.1 67.1 72.0 84.1 68.4 77.2 121.7 132.0 118.5Banking system 3.5 43.4 72.5 63.6 27.8 36.2 52.3 68.7 58.0Non-bank (net) 29.6 23.7 -0.5 18.9 38.6 30.0 57.5 61.8 60.5From privatization proceeds 1.6 2.0 11.1 12.0 1.5 --
a! Includesfinances of the federal and provincial govemments, railways, post of fice, telephone &telegraph and four autonomous bodies (WAPDA, OGDC, NHA & PTCL).
bl Excludes the use of privatization proceeds for SAPfinancing as revenue.cl The data include an estimate of a charge to WAPDA consumers for hook-up expenses.dl In the presentation of the budget, net lending and equity participation activity is treated as non-bank
financing. Thefigurefor 1988/89 also includes an estimate of net onlending of external resources to domesticimporters and the purchase of PRs 1.2billion of U.S. treasury bills for the purpose of guaranteeing refinancedmilitary debt.
Source: Ministry of Finance and Economic Affairs.

11
TABLE 13: PUBLIC SECTOR DEVELOPMENT PROGRAM, 1996/97-1997/98(Rs million)
1996/97 1997/98BUDGET ESTIMATES REVISED ESTIMATES BUDGET ESTIMATES
BUDGETARY TOTAL BUDGETARY TOTAL BUDGETARY TOTALPSDP OUTLAYS PSDP OUTLAYS PSDP OUTLAYS
FEDERAL MINISTRIESAgriculture 573 573 417 417 460 460Industry 373 373 833 833 530 530Minerals 607 607 651 651 385 385Water 11,020 11,020 6,915 6,915 9,892 9,892Power 4,023 4,023 3,798 3,798 4,377 4,377Fuels 1,179 1,179 1,007 1,007 1,129 1,129Transport & communications 2,662 2,662 3,384 3.384 5,584 5,584Physical planning & housing 2,063 2,063 919 919 2,077 2,077Rural development 1,062 1,062 1,067 1,067 2,148 2,148Education & training 1,133 1,133 760 760 838 838Science & technology 208 208 175 175 211 211Health & nutrition 3,250 3,250 2,857 2,857 2,506 2,506Mass media 48 48 212 212 50 50Culture, sports & tourism 72 72 47 47 89 89Manpower & employment 446 446 506 506 179 179Women's development 100 100 82 82 43 43Population welfare 2,000 2,000 1,257 1,257 1,921 1,921Social welfare 87 87 74 74 71 71Statistics & planning 157 157 131 131 337 337Environment 335 335 335 335 270 270
A. TOTAL FEDERAL MINISTRIES 31,398 31,398 25,427 25,427 33,097 33,097
SPECIAL PROGRAMSTaineer-i-sindh 2,200 2,200 1,000 1,000 869 869Refugees rehab. NWFP 70 70 70 70 70 70Special packages 40 40 40 40 0 0Block provision 593 593 0 0 0 0Add. Funding for special areas a/ 3,275 3,275 3,023 3,023 3.337 3,337
B. TOTAL SPECIAL PROGRAMS 6,178 6,178 4,133 4,133 4,276 4,276
TOTAL DIRECT FEDERAL (A+B) 37,576 37,576 29,560 29,560 37,373 37,373
CORPORATIONS/AGENCIESWAPDA 11,268 28,900 12,721 24,504 13,830 26,966OGDC 300 5,738 300 5,738 700 6,083NHA 10,518 10,518 9,147 9,147 12,200 12,200PTCL 0 12,000 0 15,101 0 20,000NMTA 0 0 0 0 0 0
C. SUB-TOTAL CORPORATIONS 22,086 57,157 22,168 54,490 26,730 65,249
TOTAL FEDERAL & CORPORATIONS (A+B+C) 59,662 94,732 51,728 84,050 64,103 102,622
PROVINCIAL DEVELOPMENT PROGRAMFederal contribution 1,455 1,455 1.455 1,455 12,140 12,140Provincial contribution 14,045 14,045 14,045 14,045 3,860 3,860Foreign loans & grants 10,000 10,000 12,873 12,873 10,000 10,000
D. TOTAL PROVINCIAL PROGRAM (D) 25,500 25,500 28,373 28,373 26,000 26,000
TOTAL PSDP (A+B+C+D) 85,162 120,232 80,101 112,423 90,103 128,622
a/The 1995/96 revised estimates of expenditures in the Special Areas are included in the sectoral expenditures in the Ministry's program.Source: Planning and Development Division.

12
TABLE 14: THE CORE DEVELOPMENT PROGRAM, 1996/97 AND 1997/98
(Rs Million)
1996/97 1997/98
World Bank World BankReview Team's PSDP Review' Team's PSDP
Suggestions Allocations Utilization Suggestions Allocations
TRANSPORTATION 13,608 11,635 10,284 13,708 10,190
National highways 10,143 8,773 7,410 9,316 6,350
Rural roads 1,472 869 869 2,219 1,978
Railways 1,993 1,993 2,005 2,173 1,862
Ports NA NA NA NA NA
AGRICULTURE 491 321 205 312 297
IRRIGATION & DRAINAGE 9,832 9,142 5,655 8,408 8,137
POWER 29,429 27,628 17,046 25,009 25,546
Thermal 2,436 2,470 994 1,386 1,388
Hydel 13,624 12,594 5,352 15,883 15,835
Transmission 9,169 8,864 7,461 5,730 5,783
Rural electrification 3,000 2,500 2,199 1,300 1,830
Distribution 1,200 1,200 1,040 710 710
EDUCATION 100 100 45 39 40
HEALTH AND NUTRITION 3,093 3,249 2,832 2,443 2,416
POPULATION WELFARE 2,064 2,000 1,257 2,073 1,921
MANPOWER 700 430 536 200 174
ENVIRONMENT 181 151 151 200 172
GRAND TOTAL 59,498 54,657 38,011 52,392 48,893
Source: Planning and Development Division.
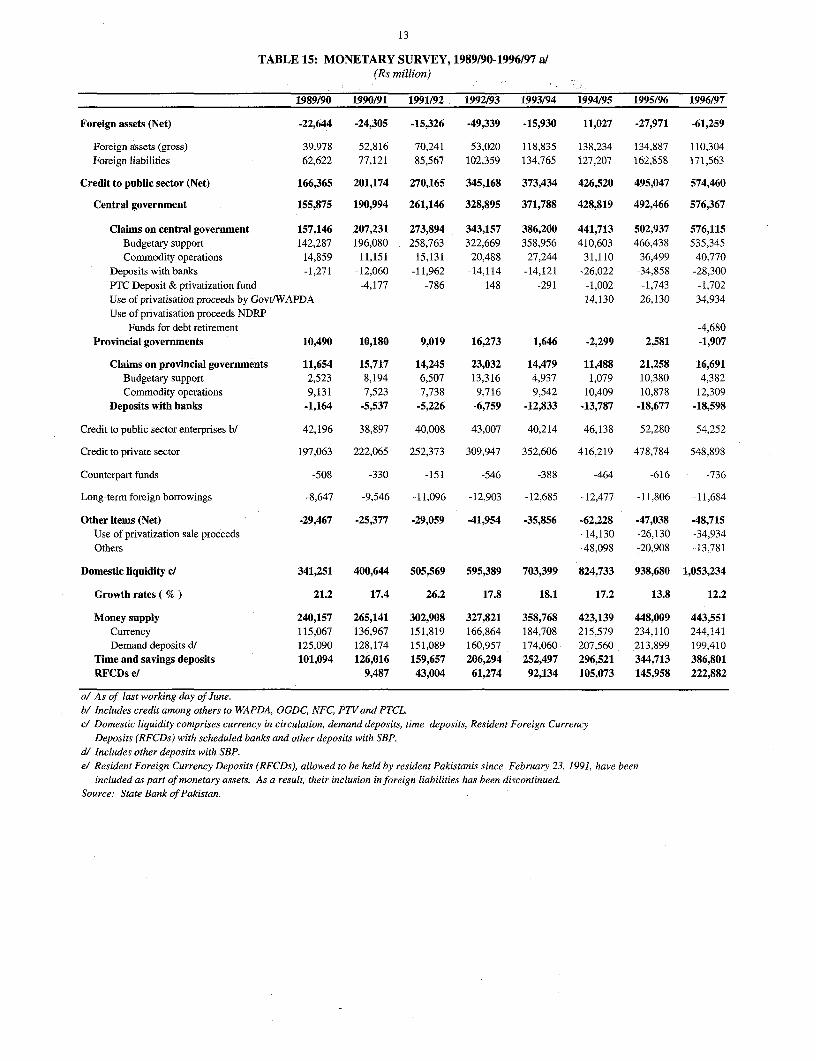
13
TABLE 15: MONETARY SURVEY, 1989/90-1996/97 a/(Rs million)
1989/90 1990/91 1991/92 1992/93 1993/94 1994/95 1995/96 1996/97
Foreign assets (Net) -22,644 -24,305 -15,326 -49,339 -15,930 11,027 -27,971 -61,259
Foreign assets (gross) 39,978 52,816 70,241 53,020 118,835 138.234 134,887 110,304Foreign liabilities 62,622 77,121 85,567 102,359 134,765 127,207 162,858 171,563
Credit to public sector (Net) 166,365 201,174 270,165 345,168 373,434 426,520 495,047 574,460
Central government 155,875 190,994 261,146 328,895 371,788 428,819 492,466 576,367
Claims on central government 157,146 207,231 273,894 343,157 386,200 441,713 502,937 576,115Budgetary support 142,287 196,080 258,763 322,669 358,956 410,603 466,438 535,345Commodity operations 14,859 11,151 15,131 20,488 27,244 31,110 36,499 40,770
Deposits with banks -1,271 -12,060 -11,962 -14,114 -14,121 -26,022 -34,858 -28,300PTC Deposit & privatization fund -4,177 -786 -148 -291 -1,002 -1,743 -1,702Use of privatisation proceeds by Govt/WAPDA 14,130 26,130 34,934Use of privatisation proceeds NDRP
Funds for debt retirement -4,680Provincial governments 10,490 10,180 9,019 16,273 1,646 -2,299 2,581 -1,907
Claims on provincial governments 11,654 15,717 14,245 23,032 14,479 11,488 21,258 16,691Budgetary support 2,523 8,194 6,507 13,316 4,937 1,079 10,380 4,382Commodity operations 9,131 7,523 7,738 9,716 9,542 10,409 10,878 12,309
Deposits with banks -1,164 -5,537 -5,226 -6,759 -12,833 -13,787 -18,677 -18,598
Credit to public sector enterprises b/ 42,196 38,897 40.008 43,007 40,214 46,138 52,280 54,252
Credit to private sector 197,063 222,065 252,373 309,947 352,606 416,219 478,784 548,898
Counterpart funds -508 -330 -151 -546 -388 -464 -616 -736
Long-term foreign borrowings -8,647 -9,546 -11.096 -12,903 -12,685 -12,477 -11,806 -11,684
Other items (Net) -29,467 -25,377 -29,059 -41,954 -35,856 -62,228 -47,038 -48,715Use of privatization sale proceeds -14,130 -26,130 -34,934Others -48,098 -20,908 -13,781
Domestic liquidity cl 341,251 400,644 505,569 595,389 703,399 824,733 938,680 1,053,234
Growth rates ( %) 21.2 17.4 26.2 17.8 18.1 17.2 13.8 12.2
Money supply 240,157 265,141 302,908 327,821 358,768 423,139 448,009 443,551Currency 115,067 136,967 151,819 166,864 184,708 215,579 234,110 244,141Demand deposits d/ 125,090 128,174 151,089 160,957 174,060 207,560 213,899 199,410
Time and savings deposits 101,094 126,016 159,657 206,294 252,497 296,521 344,713 386,801RFCDs e/ 9,487 43,004 61,274 92,134 105,073 145,958 222,882
a/ As of last working day of June.bi Includes credit among others to WAPDA, OGDC, NFC, PTV and PTCL.cl Domestic liquidity comprises currency in circulation, demand deposits, time deposits, Resident Foreign Currency
Deposits (RFCDs) with scheduled banks and other deposits with SBP.dl Includes other deposits with SBP.el Resident Foreign Currency Deposits (RFCDs), allowed to be held by resident Pakistanis since February 23, 1991, have been
included as part of monetary assets. As a result, their inclusion inforeign liabilities has been discontinued.Source: State Bank of Pakistan.

14
TABLE 16: FACTORS AFFECTING DOMESTIC LIQUIDITY, 1989/90-1996/97(Rs million)
1989/90 1990/91 1991/92 1992/93 1993/94 1994/95 1995/96 1996/97
Foreign assets -2,366 a/ 5,712 a/ 8,979 -34,013 33,409 26,957 -38,998 -33,288
Domestic credit (net) 53,160 a/ 53,681 a/ 95,946 123,835 74,599 94,379 152,942 147,844
Credit to public sector (net) 23,203 a/ 27,438 a/ 68,989 75,005 28,266 53,086 68,527 79,433
Budgetary support 12,566 a/ 52,093 a/ 60,996 70,715 27,908 47,789 65,136 62,909Commodity operations 11,355 -5,316 4,195 7,335 6,582 4,733 5,858 5,702Deposits -718 -15,162 407 -3,683 -6,081 -12,855 -13,726 6,637PTC Deposits & privatization -4,177 3,391 638 -143 -711 -741 41Use of privatisation proceeds by Govt/WAPDA 14,130 12,000 8,804Use of privatisation proceeds NDRP
Funds for debt retirement -4,660
Credit to public enterprises b/ 4,447 -3,299 1,111 2,999 -2,793 5,924 6,142 1,972
Credit to private sector 22,994 25,002 30,308 57,574 42,659 63,613 57,287 Et 59,907
Counterpart funds -197 178 179 -395 158 -76 -152 -120
Other credit items (Net) 2,713 4,362 -4,643 -11,346 6,309 -28,168 21,139 V 6,652
Long-term foreign borrowings -845 -899 -1,550 -1,807 218 208 671 122Use of Privatisation Sale Proceeds -14,130 -12,000 -8.804Other 3,558 5,261 -3,093 -9,539 6,091 -14,246 32,468 15,334
Domestic Liquidity c/ 50,794 59,393 104,925 89,821 108,009 121,336 113,944 114,554
Money 33,798 24,984 37,767 24,914 30,946 64,371 24,870 -4,458Currency 17,559 21,900 14,852 15,045 17,844 30,871 18,531 10,031Demand deposits el 16,239 3,084 22,915 9,869 13,102 33,500 6,339 -14,489
Time and savings deposits 16,996 24,922 33,641 46,637 46,203 44,024 48,192 42,088RFCDs d/ 9,487 33,517 18,270 30,860 12,939 40,885 76,924
a! Adjustedfor SAF loans amounting to Rs 7371 million.b/ Includes credit among others to WAPDA, OGDC, NFC, PTC & PTV. $59,305.0 $77,524.0 ####### ####cl Domestic liquidity comprises currency in circulation, demand deposits, time deposits, Resident Foreign Currency
Deposits (RFCDs) with scheduled banks and other deposits with SBP.dl Includes other deposits with SBP.e/ Resident Foreign Currency Deposits (RFCDs) Accounts allowed to be opened by resident Pakistanis
since February 23, 1991, have been included as part of monetary assets instead offoreign liability.f/Adjusted for Rs 5278 million being mark-up/interest debited to the borrowers account.Source: State Bank of Pakistan.

15
TABLE 17: INTEREST RATES ON BANK DEPOSITS AND ADVANCES, 1992 -1997 a/(percent per annum)
1992 1993 1994 1995 1996 1997
PLS Deposits (weighted average):
Savings Deposits 7.90 7.49 8.04 7.59 7.79 7.97
Time or Fixed Deposits 10.70 10.56 11.62 11.51 11.96 12.63
Less than 6 months 7.50 7.38 8.58 8.35 8.86 9.60For 6 months and over
but less than 1 year 9.70 9.92 10.72 10.36 10.69 10.86For 1 year and over
butlessthan2years 10.30 10.72 11.24 11.19 11.22 11.55For 2 years and over
butless than 3 years 11.10 11.25 11.78 11.65 11.84 12.10For 3 years and over
butlessthan4years 11.90 12.18 12.79 12.61 12.88 13.09For 4 years and over
but less than 5 years 12.40 13.13 13.84 13.28 13.66 13.61
For 5 years and over 13.50 14.40 15.00 15.01 15.11 15.42
Interest Rates on Bank Advances: Mn Max Min Max Min Max Min Max Min Max Min Max
Trade Related Advances 10 20 10 20 10 19 13 No 14 No 14 No(General) Max Max Max
Investment Type Advances 10 No 10 No 10 No 13 No 14 No 14 NoMax Max Max Max Max Max
Export Finance b/ No 8 No 8 No 12 No 13 No 13 No 13Min Min Min Min Min Min
LMM Finance
Part-I (Local Sales) No 8 No 8 No 12 No 14 No 14 No 14Min Min Mn Min Min Min
Part-I (Export Sales) for LMM
a) Preshipment stage No 8 No 8 No 12 No 13 No 13 No 13MinM Min Min Min Min Min
b) Postshipment stage No 8 No 8 No 12 No 13 No 13 No 13Min MinM Min Min Min Min
Inter-bank Call Money Rate: 7.36 9.81 9.18 10.33 11.16 12.97(Period Average)
3-Day REPO Rate on Treasury Bills 15.0 15.0 15.0 15.5 17.0 19.0al As of June 30 unless otherwise stated.bl The Export Finance Scheme is intended mainly for non-traditional and newly emerging exports. At present the scheme covers all exports except:
1) Raw cotton; 2) Cotton yarn; 3) Fish other than frozen and preserved; 4) Mutton & Beef 5) Jewelery exported under the entrustment scheme;6) Live animals; 7) Hides and Skins 8) Leather WetBlue; 9) Wool and Animal Hair; 10)AII Grains including Grain Flour; 11) Petroleum Products;12) Crude vegetable materials; 13) Crude Animal Material; 14) Feed-stufffor Animals; 15) Stone, Sand and Gravel; 16) Waste and Scrap of all kinds;17) Fertilizer Crude; 18) Oilseeds, Nuts and Kernels; 19) Inorganic Elements, Oxides, etc.; 20) Crude Minerals; 21)Works of arts and antiques;22) All Metals; 23) Fur Skins; and 24) wood in rough or squared.
Source: State Bank of Pakistan.

16
TABLE 18: AGRICULTURAL PRODUCTION AND INPUTS, 1989/90-1996/97(thousand metric tons)
Item 1989/90 1990/91 1991/92 1992/93 1993/94 1994/95 1995/96 1996/97
Foodgrains
Rice 3,220 3,261 3,243 3,116 3,995 3,447 3,966 4,305Wheat 14,316 14,565 15,684 16,157 15,213 17,002 16,907 16,651Maize 1,179 1,185 1,203 1,184 1,213 1,318 1,283 1,259
Pulses
Gram 562 531 513 347 411 559 680 594Lentil&beans 131 126 114 121 123 138 154 153Other pulses 80 80 79 79 80 81 86 85
Oilseeds
Rape and mustard 233 228 220 207 197 229 255 270Cottonseed 2,912 3,275 4,362 3,080 2,735 2,958 3,604 3,189Sunflower 25 35 83 62 50 86 110 127Groundnuts 82 89 96 101 96 106 113 117
Cash crops
Cotton (lint) 1,456 1,637 2,181 1,540 1,368 1,479 1,802 1,994Sugarcane 35,494 35,989 38,865 38,059 44,427 47,168 45,230 41,998Tubacco 68 75 97 102 100 81 80 n.a.
Condiments and spices
Onions 713 702 809 854 912 1,013 1,098 1,131Garlic 48 53 63 66 66 77 83 66Chillies 126 101 142 75 142 95 136 140
Vegetables
Potatoes 831 751 860 933 1,056 1,105 1,064 964Other vegetables 2,751 2,759 2,876 3,018 3,150 3,360 3,369 n.a.
Input Consumption
Fertilizers (000 nut tons) 1,890 1,893 1,884 2,148 2,146 2,183 2,513 2,409
Nitrogen 1,468 1,472 1,463 1,636 1,659 1,738 1,989 1,985Phosphate 382 388 398 488 464 428 494 419Potash 40 33 23 24 23 17 30 5
Water availibility (farmgate, million acre-feet)
Kharif 68.7 70.2 71.8 73.3 74.7 75.3 75.8 n.a.Rabi 48.5 49.4 50.3 51.4 53.3 54.4 55.0 n.a.
Source: Ministry of Food andAgriculture.

17
TABLE 19: FOODGRAIN UTILIZATION, 1989/90-996197 a/(thousand metric tons)
1996/97Item 1989/90 1990/91 1991/92 1992/93 1993/94 1994/95 1995/96 (Achieve-
ment)
Stocks at the beginning ofthe year b/ 1,919 2,344 1,508 1,802 2,004 1,576 1,435 1,251
Production c/ 19,415 19,352 19,515 20,565 21,865 20,634 22,849 23,034Seed, feed and wastage d/ 2,096 2,089 2,104 2,214 2,312 2,238 2,432 2,430Imports e/ 1,603 627 2,018 2,340 1,902 2,617 1,968 2,500Exports f/ 744 1,204 1,512 1,032 984 1,852 1,601 1,717
Stocks at the end of the year 2,344 1,508 1,802 2,004 1,576 1,435 1,251 1,012
Availability 17,753 17,522 17,623 19,457 20,899 19,302 20,968 21,371
Population (million) 110.3 113.7 117.2 120.9 124.4 128.0 131.6 135.3
Annual per capita consumption (kgs) 160.9 154.1 150.3 160.9 168.0 153.2 159.3 158.0
Daily per capita consumption (gms) 441 422 412 441 460 420 436 433
a/ Includes rice, wheat, maize, barley, bajra and jowar.b/ These stocks comprise government's stocks of wheat (as of beginning of the wheat crop year, May 1) and
rice (as of beginning of the agriculture year July 1). Stocks from 1988/89 to date are being compiledby the concerned agency
cl Production in any agriculture year (July I - June 30) is assumed to be available for consumption inthat year in case of rice, maize, jowar and bajra. Production of wheat, however, is assumed to beavailable only in the following wheat crop year (May I - April 30).
d/ Seed, feed and wastage are assumed to be 10% in the case of wheat; 6% in the case of rice; and 16%in the case of other foodgrain.
el Imports comprise wheat imports during the specified wheat crop year (May I - April 30).fl Exports comprise rice, maize and barley during the specified agricultural crop year (July I - June 30).Note: Stock information updated and revisedfrom Economic Survry 1996-97.Source: Planning and Development Division (Nutrition Section).
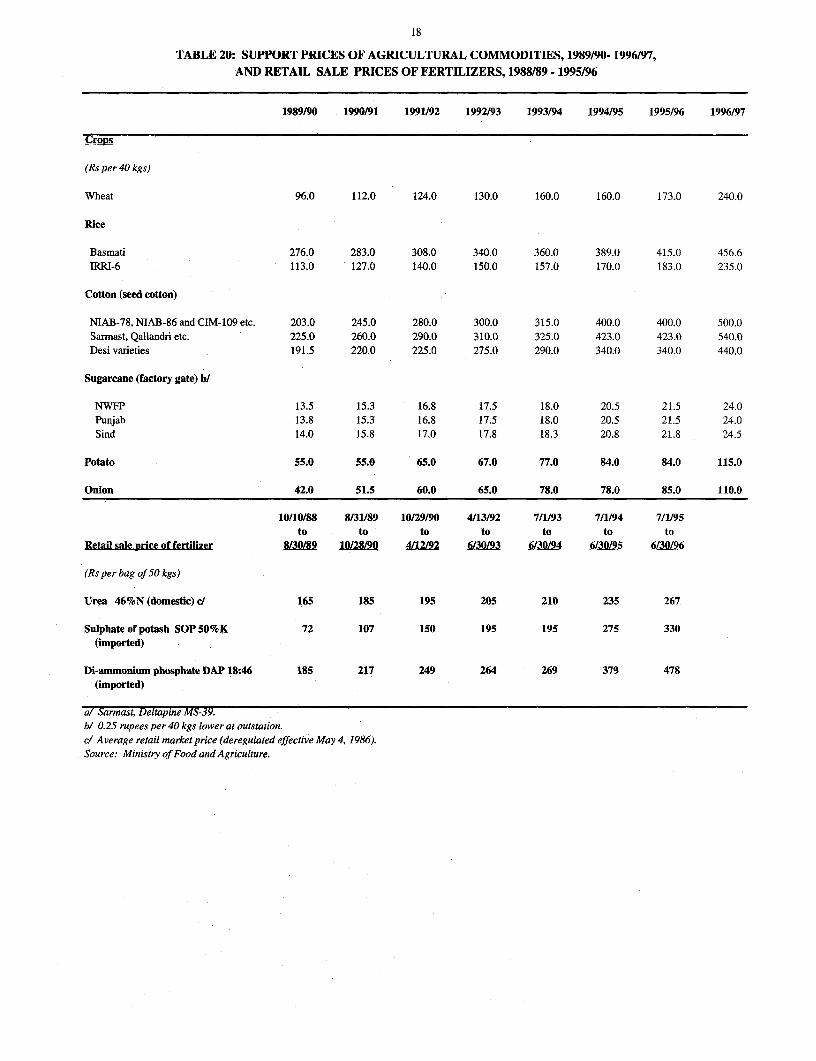
18
TABLE 20: SUPPORT PRICES OF AGRICULTURAL COMMODITIES, 1989/90- 1996/97,AND RETAIL SALE PRICES OF FERTILIZERS, 1988/89 - 1995/96
1989/90 1990/91 1991/92 1992/93 1993/94 1994/95 1995/96 1996/97
Crops
(Rs per 40 kgs)
Wheat 96.0 112.0 124.0 130.0 160.0 160.0 173.0 240.0
Rice
Basmati 276.0 283.0 308.0 340.0 360.0 389.0 415.0 456.6IRRI-6 113.0 127.0 140.0 150.0 157.0 170.0 183.0 235.0
Cotton (seed cotton)
NIAB-78, NIAB-86 and CIM-109 etc. 203.0 245.0 280.0 300.0 315.0 400.0 400.0 500.0Sarmast, Qallandri etc. 225.0 260.0 290.0 310.0 325.0 423.0 423.0 540.0Desi varieties 191.5 220.0 225.0 275.0 290.0 340.0 340.0 440.0
Sugarcane (factory gate) b/
NWFP 13.5 15.3 16.8 17.5 18.0 20.5 21.5 24.0Punjab 13.8 15.3 16.8 17.5 18.0 20.5 21.5 24.0Sind 14.0 15.8 17.0 17.8 18.3 20.8 21.8 24.5
Potato 55.0 55.0 65.0 67.0 77.0 84.0 84.0 115.0
Onion 42.0 51.5 60.0 65.0 78.0 78.0 85.0 110.0
10/10/88 8/31/89 10/29/90 4/13/92 7/1/93 7/1/94 7/1/95to to to to to to to
Retail sale price of fertilizer 830/89 10/28/90 4/12/92 6/30/93 6/30/94 6/30/95 6/30/96
(Rs per bag of 50 kgs)
Urea 46%N (domestic) c/ 165 185 195 205 210 235 267
Sulphate of potash SOP 50%K 72 107 150 195 195 275 330(imported)
Di-anumonium phosphate DAP 18:46 185 217 249 264 269 379 478(imported)
al Sarmast, Deltapine MS-39.bl 0.25 rupees per 40 kgs lower at outstation.cl Average retail market price (deregulated effective May 4, 1986).Source: Ministry of Food and Agriculture.

19
TABLE 21: PRODUCTION OF SELECTED INDUSTRIAL ITEMS, 1990/91 - 1996/97
Item Unit of quantity 1990/91 1991/92 1992/93 1993/94 1994/95 1995/96 1996/97Revised Prov.
Cottonyarn millionkgs 1,049 1,171 1,219 1,310 1,370 1,465 1,520Cotton cloth million sq. mtrs 291 308 325 315 322 327 333Cigarettes billions 32 30 30 36 32 45 44Refined sugar 000 metric tons 1,933 2,323 2,397 2,923 3,001 2,470 2,394Vegetable ghee 000 metric tons 682 639 725 671 678 717 700Cement 000 metric tons 7,835 8,321 8,558 8,156 8,472 9,571 9,402Fertilizers 000 metric tons 3,000 2,795 3,204 3,875 3,826 4,165 4,020Paper board &
chip board 000 metric tons 96 178 213 209 226 226 227Chemicals 000 metric tons 323 372 373 385 366 397 407Jute goods 000 metric tons 100 101 98 78 67 71 69Cycle rubbertyres, tubes 000 numbers 9,084 9,508 9,438 10,063 8,669 9,563 9,380Coke 000 metric tons 724 737 716 782 702 686 663Pig iron 000 metric tons 1,013 1,048 1,098 1,253 1,126 1,002 1,069Billets 000 metric tons 333 307 334 404 344 332 377H & C.R. Sheets 000 metric tons 495 699 547 517 701 747 626Cars numbers 25,166 28,911 32,690 26,000 27,000 27,000 n.aTrucks/Buses numbers 2.833 2,743 3,424 1,821 1,040 1,712 2,000Jeeps (4x4) numbers 2,805 1,774 1,277 816 1,500 n.a n.aLight commercial
vehicles numbers 11,882 11,641 10,440 5,128 10,500 n.a n.aMotor cycles/
scooters/rickshaws numbers 84 84 88 64 53 85 120
Index of manufacturingProduction a/ b/ 203 219 228 237 238 246 n.a
a/ Manufacturing Index 1980/81=100 is based on 106 itemsbh Index from 1990/91 - 1995/96 is based on 96 items due to non-availability of data on ten items.Source: Planning and Development Division (Industrial & Commerce Section).

20
TABLE 22: ENERGY BALANCE SHEET, 1988/89-1996/97(thousand tons of oil equivalent)
Source 1988/89 1989/90 1990/91 1991/92 1992/93 1993/94 1994/95 1995/96 1996/97
OilProduction from ARL a/ 1090 1224 1434 1335 1205 1077 973 994 959Production from imported b/
crude oil (PRL & NRL) a/ 3988 4069 4700 4728 4603 4874 4566 4993 4634Petroleum product imports 4450 5428 4436 5404 6759 8060 8881 10282 10531Opening stock 215 211 503 638 479 433 495 385 773GROSS SUPPLY 9742 10932 11073 12105 13046 14444 14915 16654 16897Exports/bunkers 222 181 356 335 245 242 321 243 243Power plants 1831 2165 2397 2722 3099 3826 4132 4686 4990Closing stock 211 503 638 479 433 495 385 773 826NET SUPPLY d 7479 8083 7682 8568 9268 9881 10078 10953 10838
GASGas processed d/ 7447 7845 7647 6578 7084 6880 6890 6602 6747Direct gas e/ 870 1333 1803 2921 3118 3875 5609 6560 6960Associated gas f/ 733 667 603 513 435 264 165 349 203GROSS SUPPLY 9051 9845 10053 10013 10637 11019 12664 13511 13910Feedstock for fertilizer 1207 1267 1255 1176 1382 1635 1937 2159 2366Power plants 3035 3677 3780 4191 4025 4230 4231 4232 4233NET SUPPLY 4809 4901 5018 4645 5230 5154 6876 7290 7337
L.P.G.NET SUPPLY g/ 141 137 159 145 145 133 185 223 203
UOAL hi/NET SUPPLY g/ 1174 1388 1355 1369 1441 1562 1343 1449 1432
ELECTRPCITY cl UHydel generation 1382 1378 1491 1519 1724 1584 1863 1891 1698Thermal generation 1430 1665 1821 2148 2203 2501 2458 2708 3088Nuclear generation 2 24 31 34 47 40 42 39 28GROSS GENERATION 2815 3067 3343 3701 3974 4125 4362 4638 4814Auxillary consumption 73 88 110 123 121 140 142 166 192NET GENERATION 2742 2979 3233 3581 3853 3985 4220 4472 4622
TOTAL ENERGY SUPPLY (net) 16345 17488 17447 18308 19938 20715 22701 24386 24432
a/ Excluding LPG productionbi PRL & NRL are also processing domestic crude since 1984.c/ Conversion factorsfor HSD and LDO are assumed to be 1.051 & 1.042 TOE/m.ton respectively. For electricity
a conversionfactor of ] GWH = 238 TOE has been used.dl Figures for FY87 to FY91 include direct supplies from Mari gasfield to power andfertilizer plants, while for 1991/92
these supplies have been added into Raw Gas.e/ Figuresfor FY87 to FY91 include direct supply onlyfrom Sui and Kandhkot gasfields to power plants, whereasfrom 1991/92
it also includes direct gas suppliesfrom Mari gasfield to powerplants andfertilizer plants.fl Excludes LPG produced at the oilfieldsfrom associated gases.g/ All supplies are assumed as net consumption.hi It does not include imported coal which is mostly used in Pakistan Steel Mills as non-energy.i/ @3412 BtuikWhSource: Directorate General of New and Renewable Energy Resources (DGNRER).

21
TABLE 23: PRICE INDICES, 1989/90 - 1996/97 a/
Item 1989/90 1990/91 1991/92 1992/93 1993/94 1994/95 1995/96 1996/97
CONSUMER PRICE INDEX b/
General 177.3 199.8 110.6 121.5 135.1 152.7 169.2 189.2Food, beverages & tobacco 187.1 211.2 110.6 123.8 137.6 160.6 176.9 197.9Apparel, textiles & footwear 198.0 222.0 112.8 122.6 131.7 146.9 164.1 179.8House rent 147.8 163.0 110.5 122.0 134.0 147.9 161.7 178.1Fuel & lighting 165.0 189.6 110.3 115.7 133.6 142.5 163.5 183.6Household furniture, equipments etc. 176.3 188.4 109.3 117.7 124.3 137.2 155.4 177.6Transport & communication 185.9 229.6 110.4 114.0 127.6 135.2 148.4 171.4Recreation, entertainment & education 169.8 181.3 109.5 113.1 120.7 130.2 150.6 170.7Cleaning, laundry & personal appearance 179.1 199.4 108.8 118.7 136.5 150.8 172.7 196.4
Medicine 163.1 171.8 109.9 116.9 150.9 163.5 179.2 202.3
WHOLESALE PRICE INDEX
General 186.2 208.0 109.8 117.9 137.3 159.2 176.9 199.9Food 187.6 204.5 110.9 122.6 139.7 164.8 184.1 206.0Raw materials 182.4 195.5 108.6 120.8 155.2 179.1 188.5 215.9Fuel, lighting & lubricants 187.1 218.5 111.9 114.3 134.0 147.4 173.8 204.1Manufactures 184.0 216.6 108.2 112.8 131.5 151.6 164.9 184.6Building materials 187.8 198.1 104.6 106.9 122.6 149.5 161.1 188.0
SENSITIVE PRICE INDEX 189.5 213.4 110.5 122.4 136.8 157.3 174.2 195.9
GDP DEFLATOR (Market Prices 1980/81=100) 180.5 204.1 224.7 244.2 275.6 314.6 347.0 386.9
a/ From 1991/92 onward the base year for three price indices, namely, CPI, WPI and SPI, is 1990/91.For earlier years the base year was 1980/81.
bh Combined indices of industrial, commercial, and government employees.Source: Federal Bureau of Statistics
TABLE 24: CHANGES IN PRICE INDICES AND GDP DEFLATOR, 1989/90 -1996/97 a/(percent per annum)
Item 1989/90 1990/91 1991/92 1992/93 1993/94 1994/95 1995/96 1996/97
ConsumerPriceIndex 6.0 12.7 10.6 9.8 11.3 13.0 10.8 11.8
Wholesale Price Index 7.3 11.7 9.8 7.4 16.4 16.0 11.1 13.0
Sensitive Price Index 6.1 12.6 10.5 10.7 11.8 15.0 10.7 12.5
GDP Deflator (Market Prices) 6.5 13.1 10.1 8.7 12.9 14.2 10.3 11.5
a/ Increases from 1991/92 onward relate to the CPI, WPI and SPI with 1990/91 as base year. For earlieryears increases in these indices have been calculated with 1980/81 as base year.
bh Provisional.Source: Federal Bureau of Statistics
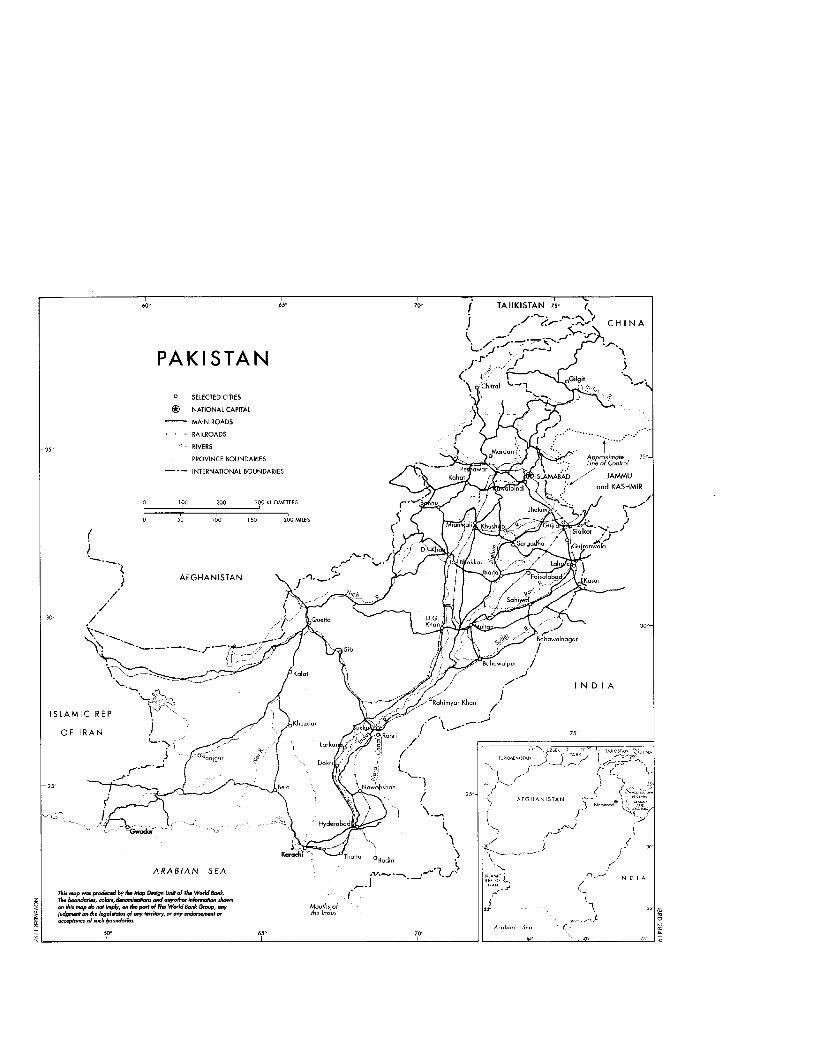
Oo ti65- 70J TAJIKISTAN 75'
I ) C H I N A
PAKISTAN B-i
0 SELECTED CITIES
® NATIONAL CAPITAL
MAIN ROADS
RAILROADS
35** -RIVERS
PROVINCE BOUNDARIES LA%pp-ori-De Cnr
- - INTERNATIONAL BOUNDARIES JAMMU
.nd KASHMIR
100~~~~~~~~~~~~~~~~~~~~~~~~~~~~~~~~~~~~~~~~~0
O 100 200 30 KILOMETERS . w ~ Xy J m 4 / r-<
0 50 100 150 200 blILES 7k>_
j AFGHANISTAN \ ],z7,_ > ; t to/ W aKGNSr
\;\ ~~~~~~~~~~^~~~~~ - -g<sbi ~~~~~~~~~~~~~~~~~~~~~< ~~~30O-
\ <Se, _<= ~~~~~~ gXKulor < _<urKhon ~~~~~~~I N D I A
ISLAMIlC REP. -. 9 if
OF IRAN ,i ' _k ' jARA AN SEA, 75s
25 seln. p4sodno. by5B0M- D.s U\i ~R. WodoE j 3 5 ~ , NI
on - B. po- _SE, W '-n O.p,. - -olS of , -- ~ t ; y e
ARABIAN SEA ' rX- -- $ 7 y wER Lt gBn ~~~~~~~~~~ AOAN D I A Thi. EMo pmdrc b T Mop D*ign Ibil d X Werld k.
z 1% 60l/ndam", cohn,i -oS infism I~~~~~~~~~~~~~~~~~~~~~~~7~< on bk P sb iff ldy , o n d F pod sf Tha Workf sonk Gr, eny Mouths of z : >; _~~~~~~~~~~~~~~~~~~~~~~~~~~~~~~~~AI
3 bOo b5t 709 os ,9 ,; 2~~~~~~~~~~~~yd .. b.