(19) United States (12) Patent Application Publication … · time series fcn. correlation 212...
21
US 20150241482A1 (19) United States (12) Patent Application Publication (10) Pub. No.: US 2015/0241482 A1 Sonderegger (43) Pub. Date: Aug. 27, 2015 (54) SMART GRID TOPOLOGY ESTIMATOR (52) U.S. Cl. CPC .......... G0IR 19/003 (2013.01); G0IR 19/0084 (71) Applicant: Itron, Inc., Liberty Lake, WA (US) (2013.01) (72) Inventor: Robert Sonderegger, Oakland, CA (US) (57) ABSTRACT Techniques for determining aspects of a topology of a Smart (73) Assignee: Itron, Inc., Liberty Lake, WA (US) grid are described herein, and particularly for determining if one or more electrical meters are connected to the same (21) Appl. No.: 14/280,286 transformer. In one example, time-stamped Voltage data is collected from at least two meters. The Voltage data may (22) Filed: May 16, 2014 indicate a slight transient change in Voltage resulting from a consumer turning on or off an electrical load. In particular, the Related U.S. Application Data slight Voltage changes may be sensed by all meters attached to a same transformer based on electrical load changes by any (60) Provisional application No. 61/944,551, filed on Feb. one of the customers on the same transformer. Using the 25, 2014. time-stamped Voltage data, a time-series of Voltage-changes may be generated for each electrical meter. A correlation Publication Classification between the time-series of voltage-changes of pairs of meters may be calculated, to thereby determine an affinity between (51) Int. Cl. the meters, and particularly if they are connected to a same GOIR 9/00 (2006.01) transformer. - OFFICE, SERVER ANDiOR NETWORK(s) COMPUTING DEVICE 128 126 TRANS FORMER TRANS FRAR TRANSFORMER 1 SERVICE AREA 102 TRANSFORMER 1 EXTENDED SERVICE AREA 150 TRANSFORMER 2 SERVICE AREA 104
Transcript of (19) United States (12) Patent Application Publication … · time series fcn. correlation 212...

US 20150241482A1
(19) United States (12) Patent Application Publication (10) Pub. No.: US 2015/0241482 A1
Sonderegger (43) Pub. Date: Aug. 27, 2015
(54) SMART GRID TOPOLOGY ESTIMATOR (52) U.S. Cl. CPC .......... G0IR 19/003 (2013.01); G0IR 19/0084
(71) Applicant: Itron, Inc., Liberty Lake, WA (US) (2013.01)
(72) Inventor: Robert Sonderegger, Oakland, CA (US) (57) ABSTRACT Techniques for determining aspects of a topology of a Smart
(73) Assignee: Itron, Inc., Liberty Lake, WA (US) grid are described herein, and particularly for determining if one or more electrical meters are connected to the same
(21) Appl. No.: 14/280,286 transformer. In one example, time-stamped Voltage data is collected from at least two meters. The Voltage data may
(22) Filed: May 16, 2014 indicate a slight transient change in Voltage resulting from a consumer turning on or off an electrical load. In particular, the
Related U.S. Application Data slight Voltage changes may be sensed by all meters attached to a same transformer based on electrical load changes by any
(60) Provisional application No. 61/944,551, filed on Feb. one of the customers on the same transformer. Using the 25, 2014. time-stamped Voltage data, a time-series of Voltage-changes
may be generated for each electrical meter. A correlation Publication Classification between the time-series of voltage-changes of pairs of meters
may be calculated, to thereby determine an affinity between (51) Int. Cl. the meters, and particularly if they are connected to a same
GOIR 9/00 (2006.01) transformer.
- OFFICE, SERVER ANDiOR NETWORK(s) COMPUTING DEVICE 128 126
TRANS FORMER
TRANS FRAR
TRANSFORMER 1 SERVICE AREA
102
TRANSFORMER 1 EXTENDED SERVICE AREA 150
TRANSFORMER 2 SERVICE AREA
104

Patent Application Publication Aug. 27, 2015 Sheet 1 of 12 US 2015/0241482 A1
OFFICE, SERVER AND/OR NETWORK(s) COMPUTING DEVICE 128
FORMER
FORMER
iy () TRANSFORMER 1 SERVICE AREA
102
TRANSFORMER 1 EXTENDED SERVICE AREA 150
TRANSFORMER 2 SERVICE AREA
104
FIG. 1

Patent Application Publication Aug. 27, 2015 Sheet 2 of 12 US 2015/0241482 A1
OFFICE, SERVER AND/ OR COMPUTING
DEVICE 128 TRANSFORMER TRANSFORMER
130 106
NETWORK(s) 124 126
204
METER METER 108 134
PROCESSING UNIT 200
INPUT/OUTPUT 202
METROLOGY UNIT 2O6
METER |
MEMORY DEVICE | 110
208
TIME-STAMPED, VOLTAGE
MEASUREMENT DATA210
122
METER 112
TIME SERIES FCN. 212
TIME-SERIES OF VOLTAGE CHANGE DATA
214
METER 114
148
FIG. 2

Patent Application Publication Aug. 27, 2015 Sheet 3 of 12 US 2015/0241482 A1
METER 300
PROCESSING UNIT 200 METROLOGY UNIT
2O6 INPUTIOUTPUT 202
MEMORY DEVICE 208 TIME-STAMPED, TIME SERIES
VOLTAGE DATABASE (FROM MEASUREMENT DATA MULTIPLE METERS)
210 3O2
TIME SERIES FCN. CORRELATION 212 MODULE 304
TIME-SERIES OF VOLTAGE-CHANGE TOPOLOGY DATA 306
DATA 214
OFFICE, SERVER AND/OR COMPUTING DEVICE
128
TIME SERIES DATABASE (FROM MULTIPLE METERS)
402
CORRELATION MODULE 404
TOPOLOGY DATA 406

Patent Application Publication Aug. 27, 2015 Sheet 4 of 12 US 2015/0241482 A1
/ 500
VOLTAGE CHANGE VOLTAGE N MEASUREMENT
-0.3 O.1 -0.4 -0.1 -0.4 -0.1 T1 T3 T5 T7 T9 T11
T2 T4 T6 T8 T10 INTERVAL
O.2 O.O O.5 -0.2 O.6 504
—— . FIG. 5 502
/ 600
242.1 242.6 242.8 242.8 242.5 242.9
242.7 242.3 242.1 242.6/ - 242.7 242.7
N---------N-N-N-----V-- TIME
T1 T2 T3 T4 T5 T6 T7 T8 T9 T10 T11 O.6 -0.1 -O3 O.5 O.3 -0.3 -0.2 -0.1 O.2 O2 -0.2
INTERVAL
FIG. 6 604 PERIOD 602
US 2015/0241482 A1
/ 700
0.950 Q78 ft
Aug. 27, 2015 Sheet 5 of 12
METER 1 VS. METER 2 Affinity
Patent Application Publication
Voltage Change (V) of first meter
FIG. 7
Patent Application Publication Aug. 27, 2015 Sheet 6 of 12 US 2015/0241482 A1
METER 3 VS. METER 4 800 Affinity=0.950 G)78 ft ?
5.4 4.8
4.2 O 3.6
2. . . ." 18 1.2
O.6 . O
-0.6 -12
-36 - I -4.2 -4.8 -5.4 || | | | |
: Voltage Change (V) of first meter
FIG. 8

Patent Application Publication Aug. 27, 2015 Sheet 7 of 12 US 2015/0241482 A1
METER 5 VS. METER 6 90O Affinity=0.750 (G) Oft ?
c. S. co o c\, La Co C C C r w x
y N
FIG. 9
Y oo La C o co ri co ( Y. Y c. N cN Y, Y, G G P G C Co C
Voltage Change (V) of first meter

Patent Application Publication Aug. 27, 2015 Sheet 8 of 12 US 2015/0241482 A1
METER 7 vs. METER 8 1000 Affinity=0.150 G1254 ft ?
voltage change (V) of first meter F G 1 O

Patent Application Publication Aug. 27, 2015 Sheet 9 of 12 US 2015/0241482 A1
-0.1 O O.1 O.2 O.3 O4 O5 O6 0.7 O.8 O.9 1
Away Affinity
FIG 11

Patent Application Publication
1202 COLLECT TIME-STAMPED
WOLTAGE DATA FROM FIRST AND SECOND METERS
1204 GENERATE A TIME SERIES OF WOLTAGE-CHANGES FOREACH METER USING THE COLLECTED TIME-STAMPED WOLTAGE DATA
12O6 CALCULATE A CORRELATION BETWEEN THE TIME SERIES OF
AND SECOND METERS
1212 DETERMINE IF THE METERS ARE
CONNECTED TO A SAME
TRANSFORMER, BASED ON THE CALCULATED CORRELATION
1214 DETERMINE IF A SAME
CONNECTION IS USED, BASED AT LEAST IN PART ON THE
CALCULATED CORRELATION
1216 GENERATE TOPOLOGICAL DATA TOSHOW A RELATIONSHIP BETWEEN THE FIRST AND
SECOND METERS
Aug. 27, 2015 Sheet 10 of 12
1208 PERFORM THE CALCULATION ONLY IF THE FIRST METER AND
THE SECOND METERARE PHYSICALLY CLOSE ENOUGH TO
EACH OTHER TO BE WITHINA EXTENDED SERVICE AREA OF THE
SAME TRANSFORMER
1210 SYNCHRONIZE OR ALIGN TIMES OF WOLTAGE-CHANGES IN THE TIME SERIES OF WOLTAGE
CHANGES OF THE FIRST METER
AND TIMES OF WOLTAGE CHANGES IN THE TIME SERIES OF
WOLTAGE-CHANGES OF THE SECOND METER
US 2015/0241482 A1

Patent Application Publication Aug. 27, 2015 Sheet 11 of 12 US 2015/0241482 A1
1300 A^ DETERMINE A HOME AFFINITY AS A GREATEST CORRELATION
BETWEENA FIRST METER AND EACH METER RECORDED AS
CONNECTED TO THE SAME
TRANSFORMER
1304 DETERMINE AN AWAY AFFINITY AS
A GREATEST CORRELATION
BETWEEN THE FIRST METER AND
EACH METER RECORDED AS NOT CONNECTED TO THE SAME
TRANSFORMER BUT WITHIN AN
EXTENDED SERVICE AREA OF THE SAME TRANSFORMER
1306 COMPARE THE HOME AFFINITY
AND THE AWAY AFFINITY
O8 ACT ON THE COMPARISON IF THE AWAY AFFINITY S GREATER THAN
THE HOMEAFFINITY
FIG. 13

Patent Application Publication
1400 Ya
1402 RECEIVE AN INDICATION OF A
PRESCRIBED TIME PERIOD OVER WHICH COLLECTING AND TIME STAMPING OF VOLTAGES ARE TO
BE PERFORMED
1404 COLLECT AND TIME-STAMP
VOLTAGE DATA FROMA FIRST METROLOGY UNIT
1406 GENERATE A TIME SERIES OF VOLTAGE-CHANGES BASEDAT
LEAST IN PART ON THE COLLECTED AND TIME-STAMPED
VOLTAGE DATA
1418 CALCULATE A CORRELATION BETWEEN THE TIME SERIES OF VOLTAGE-CHANGES AND A TIME SERIES OF VOLTAGE-CHANGES ASSOCATED WITH A SECOND
METROLOGY UNIT
FIG. 14
Aug. 27, 2015 Sheet 12 of 12
M DEFINED TIME PERIOD AND HAS A
V THE TIME SERIES OF VOLTAGE
1408 THE TIME SERIES OF VOLTAGE CHANGES INDICATES THAT ELECTRICAL LOADS WERE TURNED ON OR OFF ATA
CONSUMER ASSOCIATED WITH THE FIRST METROLOGY UNIT
1410 THE TIME SERIES OF VOLTAGE CHANGES INDICATES THAT ELECTRICAL LOADS WERE
TURNED ON OR OFF AT OTHER METERS ATTACHED TO A
TRANSFORMER TO WHICH THE FIRST METROLOGY UNIT IS
ATTACHED
1412 THE TIME SERIES OF VOLTAGE CHANGES COMPRISES ANULL TIME SERIES OF WOLTAGE
CHANGES IF ANASSIGNED TIME PERIOD FOR THE COLLECTING AND THE TIME-STAMPING WAS DURING A POWER OUTAGE
1414 THE TIME SERIES OF VOLTAGE CHANGES IS ASSOCATED WITH A
NUMBER OF INTERVALS BASED AT LEAST IN PART ON ANUMBER OF LOADS TURNED ON OR TURNED
OFF DURING THE DEFINED TIME PERIOD
1416
CHANGES IS PERFORMED OVER A DEFINED TIME PERIOD
COMPRISING DEFINED TIME INTERVALS
US 2015/0241482 A1

US 2015/0241482 A1
SMART GRID TOPOLOGY ESTMLATOR
RELATED APPLICATIONS
0001. This patent application claims priority to U.S. patent application Ser. No. 61/944,551, titled “SmartGrid Topology Estimator, filed on Feb. 25, 2014, commonly assigned here with, and hereby incorporated by reference.
BACKGROUND
0002 Smart meters and other devices in the smart grid provide increasingly sophisticated analysis of data to better manage electrical distribution. Aggregating data from Smart meters allows utility companies to anticipate bottlenecks, avoid power failures, and generally optimize grid operation. Transformers step down medium transmission Voltage to household Voltage levels for Supply to connected meters. Performing the Sophisticated analysis and leveraging the information from the smart meters and other network nodes requires an accurate knowledge of which meters are con nected to each transformer. 0003 Current utility and distribution companies may or may not maintain connectivity information for individual meters. Where such information is collected, it is frequently poorly maintained and error-prone. Line workers may change connections under time pressure to alleviate local power problems without updating appropriate records. Because transformers usually stay in service for decades, errors within the connectivity information can accumulate and degrade Smart grid functionality.
BRIEF DESCRIPTION OF THE DRAWINGS
0004. The detailed description is described with reference to the accompanying figures. In the figures, the left-most digit(s) of a reference number identifies the figure in which the reference number first appears. The same numbers are used throughout the drawings to reference like features and components. Moreover, the figures are intended to illustrate general concepts, and not to indicate required and/or neces sary elements. 0005 FIG. 1 is a block diagram showing an example smart grid environment whereintwo transformer service areas each include a plurality of meters, and wherein one or more meters may mistakenly be believed by the owning utility to be located in a particular transformer service area. 0006 FIG. 2 is a block diagram showing example struc ture and functionality of a meter that is connected to a first transformer, but which erroneous record-keeping indicates is connected to a second transformer. 0007 FIG. 3 is a block diagram showing example struc ture and functionality of a meter configured to perform cor relation functionality, and to thereby determine an affinity between the meter and other meters that may indicate con nectivity to a same or a different transformer. 0008 FIG. 4 is a block diagram showing example struc ture and functionality of a computing device remote from a meter that is configured to perform correlation functionality. 0009 FIG. 5 is a timing diagram showing a first example of the Voltage measurements and time-stamping usable to generate a time-series of Voltage-change data wherein the underlying intervals within a period of measurement are uni form. 0010 FIG. 6 is a timing diagram showing a second example of the Voltage measurements and time-stamping
Aug. 27, 2015
usable to generate a time-series of Voltage-change data wherein the underlying intervals within a period of measure ment are non-uniform. 0011 FIG. 7 is graph showing an example of strong cor relation between two meters, as indicated by data collected over uniform 5-minute intervals over a period of 15 days. 0012 FIG. 8 is graph showing an example relationship of Voltage change of a first meter plotted against standard devia tion of a second meter, wherein the meters have a strong correlation indicating attachment to a same transformer. 0013 FIG. 9 is graph showing an example relationship of Voltage change of a first meter plotted against standard devia tion of a second meter, wherein the meters have a weaker correlation than is seen in FIG. 8, but wherein the meters are attached to the same transformer. 0014 FIG. 10 is graph showing an example relationship of Voltage change of a first meter plotted against standard devia tion of a second meter, wherein the meters have a weak correlation indicating attachment to different transformers. 0015 FIG. 11 is graph showing an example use of affinity as a metric to confirm or question an initial assumed topology of a Smart grid and/or electrical network. 0016 FIG. 12 is a flowchart showing an example method by which the connectivity or “topology of a Smart grid may be estimated, and particularly how a connection between transformer(s) and meter(s) may be estimated, determined and/or confirmed. 0017 FIG. 13 is a flowchart showing a second example method by which the connectivity or “topology' of a smart grid may be estimated, and particularly how a connection between transformer(s) and meter(s) may be estimated, deter mined and/or confirmed. 0018 FIG. 14 is a flowchart showing a third example method by which the topology of a Smart grid may be esti mated.
DETAILED DESCRIPTION
Overview
0019. The disclosure describes techniques for determin ing aspects of the topology of an electrical network, and more specifically for determining if two electrical meters are con nected to a same transformer. Determining which meters are connected to each transformer is particularly important in a Smart electrical grid environment, and improves data utiliza tion and electrical grid operation. 0020. In a first example of the techniques, voltage changes measured or “seen” at one meter may result from activity by the consumer associated with that meter, or from the activity of other consumers associated with other meters that are attached to the same transformer. That is, changes in loads (e.g., an appliance turning on or off) at any customer on a same transformer may result in Voltage fluctuations seen to varying degrees at all meters attached to the transformer. The strongest Voltage change or fluctuation will be seen at the meter directly linked to the change in load; however, other meters connected to the same transformer will likely see Voltage fluctuations of the same sign but lesser magnitude. By correlating a time-series of Voltage-changes associated with two meters, it can be determined if it is likely that the two meters are connected to the same transformer. 0021. In a second example of the techniques, time stamped Voltage data may be collected from multiple meters, including at least a first meter and a second meter, overa same

US 2015/0241482 A1
period of time. A time-series of Voltage-changes may be generated for each of the first meter and the second meter using each meter's collected time-stamped Voltage data. As indicated above, the Voltage levels seen at every meter con nected to the same transformer will fluctuate based in part on load changes at any customer on the same transformer. As a result, the time-series of Voltage-changes of any two meters attached to the same transformer will correlate according to the common fluctuations. Accordingly, a correlation may be calculated between the time-series of Voltage-changes of the first meter and the time-series of Voltage-changes of the sec ond meter, and may be used to determine an “affinity” between any two meters. In one example, the affinity between two meters represents the degree to which a time-series of Voltage-changes seen by two meters is statistically correlated. Such calculations may be used when two meters are physi cally close enough to potentially be connected to the same transformer. Using the calculated correlation, it may be deter mined if the first and second meters are (or likely are) con nected to the same transformer. Based at least in part on the determined connection, topological data may be configured to show a relationship between the first meter and the second meter.
Example System and Techniques 0022 FIG. 1 is a block diagram showing an example smart grid environment 100 in which two transformer service areas 102, 104 each include a plurality of meters. In the example shown, a transformer 106 within the transformer service area 102 provides electrical power to meters 108-114. The meters 108, 110 are connected to transformer 106 by wired connec tions 116, 118. The meters 112, 114 are connected to the transformer 106 by a shared connection 120. 0023 The meters 108-114 communicate data, updates and other information by RF or wired links (e.g., RF link 122), which may form a mesh or star network, etc. The meters 108-114 may transmit data up- and downstream by one or more RF links 124 and/or a backhaul network 126, such as the Internet or a private network. Accordingly, an office, server or computing device 128 may communicate with the meters 108-114 and the meters may communicate among them selves. 0024. Similarly, transformer 130 within transformer ser vice area 104 provides power to meters 132-138 over wiring 140-146. RF links allow the meters 132-138 to communicate between each other and the office, server or computing device 128. 0025. As indicated above, transformer 106 is wired to a plurality of meters within a transformer service area 102. However, a larger region, shown as extended service area 150, defines an area that is sufficiently close to the transformer 106 that any meter within that area could be operationally con nected to the transformer 106. Thus, while the distance between a transformer and an attached meter is limited, any meter within the extended service area 150 could potentially be serviced by transformer 106. 0026. Utility companies typically document how utility meters, transformers and other utility distribution network components are attached to one another. However, it is pos sible for a meter to be erroneously listed in utility company records as being attached to transformer 130. As a particular example of such an error, meter 134 is within transformer service area 104, and is associated with transformer 130 in utility company records. In particular, meter 134 is connected
Aug. 27, 2015
(at least in theory) by wiring 146 to transformer 130. How ever, meter 134 may actually be connected to transformer 106 by wiring 148. Such a connection is possible because meter 134 is within the extended service area 150 of transformer 106. This error may be a result of data entry errors, failure of technicians to update records, relocation of a meter by a consumer (e.g., to steal electricity), etc. The erroneous records of the utility company may prevent the Smart grid environment 100 from functioning as efficiently as it might otherwise. 0027. However, by applying the techniques described herein in part because the meters 108-114 and 132-138, and office and/or computing facility 128, have a structure and functionality described herein below—the true connection between meter 134 and its transformer is discoverable, and the topology of the Smart grid may be more fully understood. 0028 FIG. 2 is a block diagram showing example struc ture and functionality of the meter 134 within the example smart grid environment 100. The meter 134 is representative, though not determinative, of the structure of other meters 108-114, 132, 136, and 138, etc. As discussed with respect to FIG. 1, meter 134 is actually connected to a transformer 106 by wiring 148. However, erroneous record-keeping indicates that meter 134 is connected to transformer 130 by (non existent) wiring 146. Using techniques described herein, the correct network topology may be derived. 0029. A processing unit 200 may include a processor (e.g., general purpose microprocessor, CPU, GPU, etc.), applica tion specific integrated circuit (ASIC) or other computing device configured to execute programs and/or perform logical or algorithmic actions. The processing unit 200 may commu nicate with an I/O unit 202, which may in turn communicate with other network devices over an RF link 204, power line communications (PLC) or other means. 0030. A metrology unit 206 is configured to measure volt age, current and/or power consumption by a consumer/cus tomer associated with the meter 134. Measurement data (e.g., Voltage, current and/or power measurements) from the metrology unit 206, which may be associated (time stamped) with times at which each measurement was made, may be stored in an appropriate data structure within a memory device 208. 0031. The processing unit 200 may also communicate with the memory device 208 and/or other memory devices, which may contain programs, applications, data structures or other information. In the example shown, Voltage measure ments made by the metrology unit 206 may be time stamped and stored as time-stamped Voltage measurement data 210. 0032. A time-series function 212 may be defined by pro gram statements and stored in the memory device 208 or other locations. The time-series function 212 may be configured to input the time-stamped Voltage measurements 210 and to output a time-series of Voltage-changes for storage in memory device 208. As will be discussed in greater detail in FIGS. 5 and 6, the changes in voltage seen at the meter 134 and/or metrology unit 206, and the times of those changes, may be utilized to create the time-series of Voltage-changes. In one example, the time-series of Voltage-changes may be stored in a time-series of Voltage-changes data structure 214 or file system within memory device 208. 0033 FIG. 3 is a block diagram showing example struc ture and functionality of a meter 300 configured to perform correlation functionality, and to thereby calculate an affinity between the meter and other meters close enough (e.g., within

US 2015/0241482 A1
an extended transformer service area 150) to be serviced by a single transformer. The calculated affinity or correlation may indicate aspects of network topology, including connectivity of the meter 300 to a same or a different transformer as another meter. The meter 300 may include a processing unit 200, I/O functionality 202 and a metrology unit 206, which may be as described with respect to meter 134 and FIG. 2. 0034. The memory device 208 may include one or more applications, programs, data or other information. As one example of data stored in the memory device 208, time stamped Voltage measurement data 210 may contain col lected measurements obtained from the metrology unit 206. The time-stamped voltage data 210 may be collected from the metrology unit 206, and may be processed by the time-series function or application 212 to generate the time-series of Voltage-change data 214. 0035 Time-series of voltage-change data from nearby meters (e.g., meters within a distance that is slightly greater than or equal to the extended service area of a transformer) may be received by the meter 300. The time-series of voltage change data for each meter may be stored in a time-series database 302, which may be defined on the memory device 208. The time-series of voltage change data received by the meter 300 may be accompanied by coordinates of the trans mitting meter. The coordinates may be in X-Y form, e.g., latitude and longitude or similar. The meter 300 may use the coordinates (e.g., by application of Pythagoras' Theorem) to determine the distance between any two meters. 0036) A correlation module 304 may calculate a correla tion between pairs of time-series of Voltage-changes associ ated with respective pairs of meters. The time-series of volt age-changes may be obtained from the time-series database 302. The correlation module 304 may include statistical tools and/or algorithms configured to calculate the correlation of each pair of time-series of Voltage-changes. Correlation may be measured at least in part by comparing instances of corre sponding Voltage change at similar times. Correlation algo rithms may also consider instances of dissimilar or non-cor responding times of Voltage change when considering two time-series of Voltage-changes. In a first example of tech niques usable by the correlation module 304, if the correlation between two time-series of Voltage-changes is low (e.g., below 30%), it is unlikely that the respective two meters are connected to a same transformer. Conversely, if the correla tion between two time-series of voltage-changes is high (e.g., between 70% and 99%), it is likely that the respective two meters are connected to the same transformer. And further, if the correlation between two time-series of Voltage-changes is particularly high (e.g., above 95%), it the respective two meters may be connected to the same transformer by at least Some shared wiring. For example, the wiring from the trans former may “Y” to connect to each of the two meters. 0037. In another example of operation of a correlation module 304, a calculated correlation between two meters may be compared to ranges of correlation different from those discussed above, and conclusions drawn from the compari son. And in a further example, techniques illustrated by FIG. 11 and associated discussion introduce the concept of home VS. away affinity to assist in determining network or grid topology. 0038. The correlation module 304 may determine which meters are connected to the same transformer(s) within a portion of an electrical grid. The determined information may be used to generate and/or update topological information
Aug. 27, 2015
describing the electrical grid. The topology data 306 may be configured as a map, table, database or other data structure, and may contain information describing components and connectivity on the electrical distribution grid. In particular, the topology data 306 may describe which meters are con nected to which transformers. 0039 FIG. 4 is a block diagram showing example struc ture and functionality of a computing device other than a meter that is configured to perform correlation and topology maintenance and update functionality. In the example shown, a main or central office, server, server farm or other comput ing device(s) 128. The computing device 128 is configured to receive and store time-series of Voltage-change data from multiple meters in a time-series database 402. A correlation module 404 calculates a correlation between pairs of time series of Voltage-changes. The topology data 406 may be created, updated or maintained using input from the correla tion module 404. 0040 FIG. 5 is a timing diagram showing a first example of Voltage measurements and time-stamping 500 usable to generate a time-series of Voltage-change data, wherein the underlying intervals within a period of measurement are uni form. In the example of FIG. 5, a defined period of time 502 is used by a plurality of meters to perform the Smart grid topology estimation. That is, each meter makes Voltage mea surements over the same period of time 502 so that voltage changes resulting from load changes of a particular consumer attached to a particular transformer may potentially be seen by some of the plurality of meters. The period of time may range from minutes to days, as desired. The period of time 502 may be divided into a plurality of intervals 504. In the example shown, twelve (12) intervals are shown. A Voltage measure (e.g., 242.8 Volts) is associated with each interval. The intervals 504 may be considerably shorter than the period 502; e.g., the intervals may be seconds or minutes, as desired. 0041. The change in voltage from one interval to the next interval may be used to formatime-series of voltage-changes. Values in an example time-series are labeled T1 through T11. Each element in a time-series includes a Voltage-change and an associated time of that change. As one element in a time series, the voltage-change at the time T1 is -0.3 volts. The voltage change at the time T2 is 0.2 volts, and time T3 is 0.1 Volt, etc. A time-series of Voltage-changes may be con structed from Such a sequence. 0042. Accordingly, the time-series of Voltage-changes associated with the Voltage measurements and time-stamping 500 for a particular meter is the series (T1, -0.3); (T2, 0.2): (T3, 0.1); (T4, 0.0): (T5, -0.4); (T6, 0.5); (T7, -0.1): (T8, -0.2): (T9, -0.4); (T10. 0.6); (T11, -0.1). Other meters con nected to the same transformer may have time-series of Volt age-changes having a high correlation to the above time series of Voltage-changes if the Voltage measurements were made over the same period of time 502. Other meters not connected to the same transformer would likely have time series of Voltage-changes with less correlation. 0043 FIG. 6 is a timing diagram showing a second example of the Voltage measurements and time-stamping 600 usable to generate a time-series of Voltage-change data. The period 602 is similar to the period 502 of FIG.1. However, in this example, the intervals 604 within a period 602 are non uniform. For example, the Voltage seen by a metrology unit may be substantially constant until there is a change in a load (e.g., an appliance turning on or off) at one of the customers attached to a transformer. At the time of the load change, a

US 2015/0241482 A1
corresponding change in a Voltage measurement may result. This Voltage change may be used to conclude one interval and begin another interval. 0044. In the example of FIG. 6, the time-series of voltage changes is the series (T1, 0.6); (T2. -0.1); (T3, -0.3); (T4, 0.5); (T5, 0.3); (T6, -0.3); (T7, -0.2): (T8, -0.1); (T9, 0.2): (T10, 0.2): (T11, -0.2).
Example Applications of Time-Series of Voltage-Change Correlation
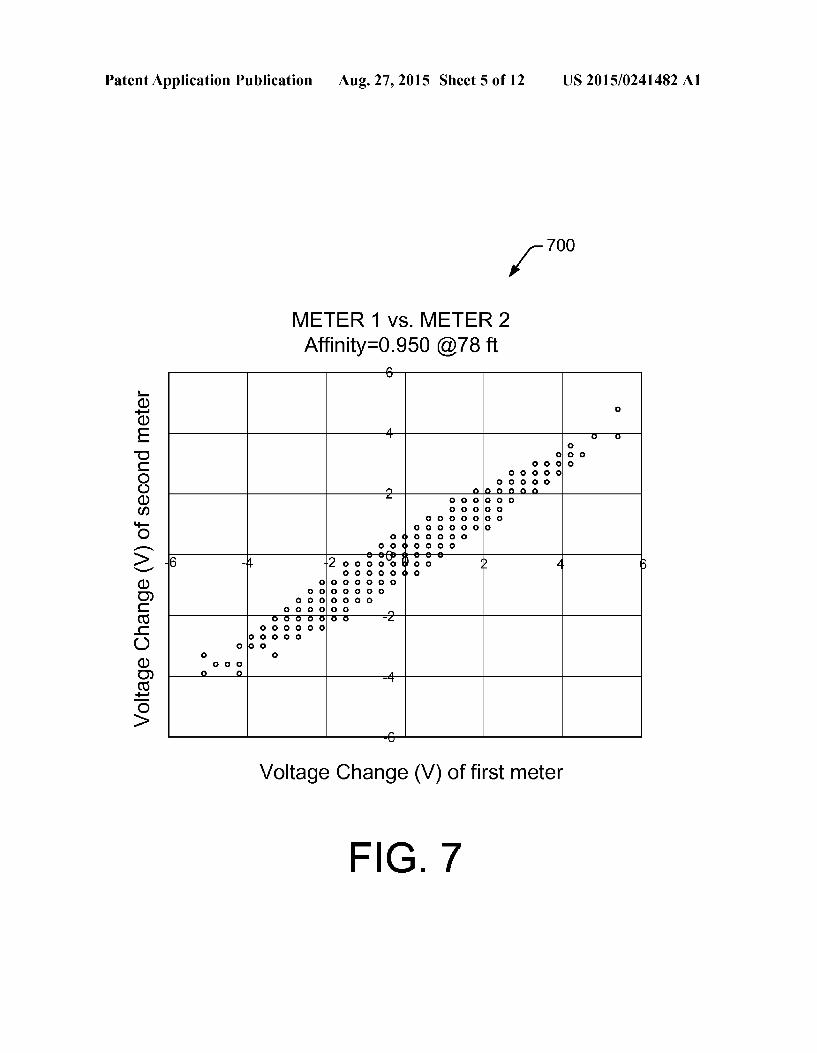
0045 FIG. 7 is graph 700 showing strong correlation between two example meters, as indicated by data collected over uniform 5-minute intervals over a period of 15 days. Accordingly, the graph 700 shows an example of topology data 306 produced by the correlation module 304 in the example of FIG. 3. In the example shown, the two meters are indicated by their network numbers, have an affinity of 0.950 and are indicated to have a separating distance of 78 feet. This distance is consistent with connection of both meters to a same transformer. The horizontal axis shows Voltage change of a first meter, while the Vertical axis shows Voltage change of a second meter. 0046. The graph 700 shows a correlation of typical voltage changes (between +6 volts and -6 volts) consistent with two meters on the same transformer. As an example of the infor mation contained in the graph 700, the top-most, right-most point in the chart represents a Voltage change of +5.4V of the first meter (i.e., meter 1) at the same time as the second meter in the chart title (i.e., meter 2) experiences a voltage change of +4.8 V. The pixilated (i.e., scatter plot) appearance of the graph 100 is caused by the measurement resolution of the meter of 0.3 volts. 0047 A Pearson correlation coefficient for the voltage changes of the pair of meters of graph 700 is calculated to be 0.950. Each point in the graph 700 may represent one or more instances of the same pair of Voltage changes over the course of the analysis. Therefore, an alternative way to describe the same data is to Summarize the vertical range of the points, which correspond to a range of voltage changes in the second meter, as a box-plot with highest and lowest extremes, as shown in FIG. 8. 0048 FIG. 8 is graph 800 showing an example relation ship of voltage change of a first meterplotted against standard deviation of a second meter, wherein the meters have a strong correlation indicating attachment to a same transformer. On the vertical axis, the boxes indicate one standard deviation above and below the average Voltage change of the second meter. The tips of the vertical lines represent the maximum and minimum Voltage change of the second meter. The hori Zontal axis indicates the Voltage change in the first meter. The absence of a box indicates that there is only one pair of voltage changes making it impossible to calculate a standard devia tion. Consequently, minimum, maximum, and average values coalesce into a single value. In the example of graph 800, the single value is indicated by a short horizontal line symbol, (e.g., in the lowest and left-most point on the chart). 0049. Each of the two meters shown in FIGS. 7 and 8 has the same transformer parent. In FIG. 8, the Voltage signature affinity is 0.95 (indicating strongly that the two meters are connected to the same transformer). In contrast, FIG.9 shows a different pair of meters, also on the same transformer, that exhibit slightly lower affinity. Such slightly lower affinity may be caused by longer wiring runs connecting the meters, lower meter Voltage measurement resolution, or other factors.
Aug. 27, 2015
0050 FIG. 9 is graph showing an example relationship of Voltage change of a first meter plotted against standard devia tion of a second meter, wherein the meters have a weaker correlation than is seen in FIG. 8, but wherein the meters are attached to the same transformer. The relationship appears visually to be less linear and the vertical scatter is greater. This is consistent with a calculated affinity that is lower, at 0.75, than the affinity of the meters described by FIG. 7. The dis tance between the two meters is zero, which indicates either two apartments in a multi-unit building or an inaccurate data entry by the installer who may have entered the same location for all meters on the same transformer. However, an affinity of 0.75 is still well within the expected range of a pair of meters on the same transformer. 0051 FIG. 10 is graph showing an example relationship of Voltage change of a first meter plotted against standard devia tion of a second meter, wherein the meters have a weak correlation indicating likely attachment to different trans formers.
0052. In this example, a pair of meters is connected to different transformers. Different transformers are clearly indicated by the distance between the meters, i.e., 1,254 feet. Correlation is manifestly poor, and the calculated affinity is only 0.15. This is consistent with the observation that the affinity between any two meters connected to the same trans former tends to be significantly higher than for two meters connected to different transformers. Typical affinity values are between 0.5 and 0.99 for meters connected to the same transformer, and typically below 0.6 for meters connected to different transformers. Any ambiguity caused by the overlap can be resolved by comparing home affinity to away affinity as discussed with respect to FIGS. 11 and 13, and associated text. It is also typical for affinity to be higher between meters that share the same connection to their common transformer (e.g., meters 112 and 114 of FIG. 1), as opposed to be con nected by individual wires to the common transformer (e.g., meters 108 and 110 of FIG. 1). 0053 FIG. 11 is graph 1100 showing an example use of affinity as a tool to confirm or question an initial assumed or recorded topology of a Smart grid and/or electrical network. In one example, a threshold value for the affinity or correla tion between two meters may be used. If the calculated affin ity between the two meters is greater than the threshold, then the meters may be determined to be connected to a same transformer. However, if the calculated affinity or correlation between two meters is less than the threshold, then the meters may be determined to be connected to different transformers and/or to require further investigation. While this example is workable, other techniques are available and described below.
0054. In a further example, for each meter the highest affinity or correlation value against all meters with the same transformer parent (e.g., as indicated by recordkeeping) may be calculated. This affinity or correlation may be termed the “home affinity” and the meters thought to be connected to a same transformer may be termed “home meters.” Addition ally, the highest affinity or correlation value for each meter may be calculated with respect to all meters indicated by recordkeeping to have different transformer parents and be within a threshold radius (e.g., a radius around the meter that could contain another meter potentially attached to the same transformer as the meter). This affinity or correlation may be termed the “away affinity” and the meters thought to be con nected to a same transformer may be termed “away meters.”

US 2015/0241482 A1
Because meters attached to a same transformer have greater affinity, it would be expected that all of the affinity values of home meters (the “home affinities”) will be higher than affin ity values of away meters (the “away affinities’). If a meter has a greater affinity or correlation with an away meter than one or all of the home meters, there is likelihood of erroneous recordkeeping of the different meters connected to different transformers. If the affinity/correlation values of an away meter are close to that of a home meter, no definitive state ment can be made. 0055. The graph 1100 shows an example of home and away affinity for 597 meters. For each meter, a highest cor relation with all meters shown by recordkeeping to be con nected to a same transformer is calculated. This is the “home affinity.” Additionally, a highest correlation with all meters shown by recordkeeping to be connected to different trans formers—but which are close enough to possibly be con nected to the same transformer is calculated. This is the “away affinity.” Thus, each meter may be graphed based on a magnitude of the home affinity versus the away affinity. 0056 Referring to graph 1100, the vast majority of the meters show higher home affinity than away affinity, as expected. However, six meters (approximately 1% of the total number of meters) are graphed in the lower right half of the chart 1100. These meters display the opposite result, i.e., the away affinity is greater than the home affinity. These six meters should be investigated (or at least flagged in the data base), and their true transformer connectivity should be deter mined. 0057. Another four meters (approximately 0.7% of the total number of meters) are in a “grey area delimited by 95% confidence limit (95% CL) curves for the number of voltage change values (N=4320) for each meter pair. 0058 For meters with suspect or uncertain topology (i.e., when the recordkeeping is thought to be in error) it is desir able to determine a transformer to which the meter is actually connected. In each of these meters, the affinity with a particu lar away meter is higher than the affinity with each home meter. Accordingly, the transformer associated with the par ticular away meter is probably the transformer of the meter. Depending on available personnel, it may be possible to actu ally confirm the connectivity of meters with Suspector uncer tain topology.
Example Methods 0059. In some examples of the techniques discusses herein, the methods of operation may be performed by soft ware defined on memory and/or may be performed by appli cation specific integrated circuits (ASIC). The memory device 208 may comprise computer-readable media and may take the form of Volatile memory, such as random access memory (RAM) and/or non-volatile memory, Such as read only memory (ROM) or flash RAM. Computer-readable media includes Volatile and non-volatile, removable and non removable media implemented in any method or technology for storage of information Such as computer-readable instruc tions, data structures, program modules, or other data for execution by one or more processors of a computing device. Examples of computer-readable media include, but are not limited to, phase change memory (PRAM), static random access memory (SRAM), dynamic random-access memory (DRAM), other types of random access memory (RAM), read-only memory (ROM), electrically erasable program mable read-only memory (EEPROM), flash memory or other
Aug. 27, 2015
memory technology, compact disk read-only memory (CD ROM), digital versatile disks (DVD) or other optical storage, magnetic cassettes, magnetic tape, magnetic disk storage or other magnetic storage devices, or any other non-transmis sion medium that can be used to store information for access by a computing device. As defined herein, computer-readable media does not include communication media, such as modu lated data signals and carrier waves. 0060 FIGS. 12-14 are flow diagrams showing an example processes which are representative of techniques for use to determine atopology of a Smart grid, and more particularly to determine a transformer to which a meter is attached. The processes may, but need not necessarily, be implemented in whole or in part by the meter 134 of FIGS. 1-3 and/or the computing device 128 of FIGS. 1, 2 and 4. The processes are described with references to the meters and computing devices of FIGS. 1-4 for ease of understanding, but are not limited to use with these devices. Accordingly, the meters and computing devices described are capable of performing numerous other processes and the processes of FIGS. 12-14 may be implemented using numerous other meters. 0061 FIG. 12 is a flowchart showing an example method 1200 by which the topology of a smart grid may be estimated, and particularly how a connection between transformer(s) and meter(s) may be estimated, determined and/or confirmed. In the example techniques described, time-stamped Voltage data is collected from one or more meters, such as a first meter and a second meter, respectively. A time-series of Voltage changes is generated for each meter, such as the first and the second meters, using the time-stamped Voltage data that was collected. A correlation or affinity is calculated between meters, e.g., a correlation is calculated between the time series of voltage-changes of the first meter and the time-series of Voltage-changes of the second meter. Using the correla tion, it may be determined if the first and second meters are connected to a same transformer. 0062. At block 1202, time-stamped voltage data is col lected from one or more meters. The Voltage data may indi cate a voltage “seen by the meter or provided to the meter. The Voltage may fluctuate based in part on Voltage provided by an electrical grid (medium Voltage transmission lines, etc.) and the load or consumption of power in a particular area. E.g., greater consumption of power may pull down Voltages levels in a particular area. In the context of the system of FIG. 1, the time-stamped voltage data may be collected from all of the meters within not only the transformer service area 102. but also the entire extended service area 150. By collecting time-stamped voltage levels in the extended service area 150, it is possible that a meter can be detected that is actually connected to transformer 106, but which recordkeeping indi cates is connected to transformer 130. In the context of the system of FIG. 2, the time-stamped Voltage data may be collected by the metrology unit 206 of the example meter 134. The metrology unit 206 is configured to measure and time stamp voltages provided by the transformer (106 or 130). 0063. At block 1204, a time-series of voltage-changes is calculated or generated for each meter. The time-series of Voltage-changes may be based at least in part on times at which appliances were turned on or off at any customer on a same transformerto which the metrology unit is attached. The calculation of the time-series of Voltage-changes may be per formed using the collected time-stamped Voltage data obtained at block 1202. In the context of the example of the meter 134 of FIG. 2, the time-series function 212 calculates or
US 2015/0241482 A1
derives the time-series of Voltage-changes using the time stamped Voltage measurements from the metrology unit 206. 0064. At block 1206, a correlation between the time-series of Voltage-changes of two or more meters (e.g., the first and second meters of block 1202) is calculated. The calculation of the correlation may be performed on aparticular meter or may be performed on a server or other computing device at a remote location. In an example of the former, shown at FIG. 3, a meter 300 may maintain a time-series database 302 containing time-series data from a number of meters. An example of such meters may include those within an extended service area 150 (an example of which is seen at FIG. 1) of a transformer. In the example of FIG. 3, the calculation of the correlation between the time-series of Voltage-changes from different meters may be performed by the correlation module 304, which performs the calculation of the statistical correla tion between two meters based on the time-series of voltage changes of each. In the contact of the example of FIG. 4, the correlation module 304 may be located on a server or other computing device, which may be located withina office of a utility company or on a device on, or in communication with, the Smart grid. 0065. At block 1208, the calculation of the correlation may be performed only if the first meter and the second meter are physically close enough to each other to be within a extended service area of the same transformer. In this example, significant savings of resources may be obtained by limiting the calculation of correlations to include only those between meters that are sufficiently close to each other that it is possible that they are connected to the same transformer. Meters that are not within the same extended transformer service area of any single transformer would correlate only by accident, and Such correlation might introduce errors into efforts to learn the topology of the Smart grid. 0066. At block 1210, particular optional techniques that may be used in calculating a correlation between two time series of Voltage-changes are described. In the example shown, the times of Voltage-changes in the time-series of Voltage-changes in the first meter and times of Voltage changes the time-series of Voltage-changes of the second meter are synchronized and/or aligned. More particularly, each time-series of voltage-changes may have different times in the time-stamping and Voltage-measuring process when the Voltage changed and different times when the Voltage did not change. Thus, a correlation between the Voltages changes in two time-series of voltage-changes may be performed. The more that the times of change and the times of lack of change match, between any two meters, the more correlation there is between the two meters.
0067. At block 1212, whether the two meters are con nected to a same transformer may be determined, based on the calculated correlation. Generally high correlation or correla tion over a threshold value indicates correlation and/or con nection to the same transformer, while low correlation or correlation below a threshold (the same or different thresh old) indicates lack of correlation and/or connection to differ ent transformers. FIG. 13 provides additional techniques for use in making this determination. 0068. At block 1214, whether a same wiring connection is used to connect two meters to the same transformer may also be based at least in part on the calculated correlation. In some techniques, a higher correlation between the time-series of
Aug. 27, 2015
Voltage-changes between two meters may indicate the use of at least Some common wiring to connect the two meters to the same transformer. 0069. At block 1216, topological data may be generated or configured to show a relationship between the first and second meters. Example relationships include: connected to the same transformer using some common wiring; connected to the same transformer perhaps using distinct wiring; or connected to a different transformer). The topological data may be main tained in graphical form, tabular form, a database, spread sheet or other data structure of information device. 0070 FIG. 13 is a flowchart showing a second example method 1300 by which a true transformer to which a meter is connected may be estimated, determined and/or confirmed. In one example of the techniques, according to an assumed topology (e.g., as understood by recordkeeping of a utility company) each meter is connected to a transformer. A corre lation or affinity may be calculated for a particular meter with respect to time-series of Voltage-changes of other meters also thought to be connected to the same transformer. The highest of correlations of the particular meter with all other meters thought to be connected to the same transformer may be considered a “home affinity.” Additionally, a correlation or affinity may be calculated for the particular meter with respect to time-series of Voltage-changes of other meters not thought to be connected to the same transformer, but within a reasonable distance so that such connection is possible. The highest of correlations of the particular meter with all other meters not thought to be connected to the same transformer, but close enough to possibly be connected to the same trans former may be considered a “away affinity.” If the home affinity of the particular meter is greater than the away affinity for the particular meter, than the assumed topology is con firmed. However, if the home affinity of the particular meteris less than the away affinity for the particular meter, than the assumed topology is Suspect. In two examples, Suspect topol ogy may be investigated physically or flagged in a database. (0071. At block 1302, a home affinity is determined to be a greatest correlation between a first meter and each meter recorded as connected to the same transformer as the first meter. Such recording may be in recordkeeping of a utility company. At block 1304, an away affinity is determined to be a greatest correlation between the first meter and each meter recorded as not connected to the same transformer but within an extended service area of the same transformer. At block 1306, the home affinity and the away affinity are compared. At block 1308, based on the comparison, it may be deter mined whether the first and second meters are connected to the same transformer. If the comparison indicated that the away affinity is greater than the home affinity, action may be taken. For example, a database or topology may be flagged, or a team may be sent into the field to investigate the connection. 0072 FIG. 14 is a flowchart showing a third example method 1400 by which the topology of a smart grid may be estimated. At block 1402, an indication of a prescribed time period is received. During the prescribed time period, a plu rality of meters collect and time-stamp of Voltages levels. Thus, the correlation and/or affinity between meters are based on Voltage measurements taken over a same period of time. That period of time may be dictated by a head office or other controlling entity. Alternatively, a same default time period may be programmed into each meter. At block 1404, Voltage data may be collected and time-stamped from a first metrol ogy unit. In some example systems, this data may be obtained

US 2015/0241482 A1
by a remote server or computing device for processing. At block 1406, a time-series of Voltage-changes is generated for a first meter. The time-series of voltage-changes may be based at least in part on the collected and time-stamped Voltage data collected at block 1404. In some example systems, the time series of Voltage-changes may be generated by a remote server or computing device using the time-stamped Voltage data. 0073 Blocks 1408 through 1416 describe techniques related to the generation of the time-series of voltage-changes described at block 1406. In the example of block 1408, the time-series of Voltage-changes may indicate that electrical loads were turned on or off at a consumer associated with the first metrology unit. In an example, if a load (e.g., an electric heater) at the meter turns on at a particular time, which may create a slight Voltage dip at that time. Accordingly, the time series of Voltage-changes may indicate that electrical loads were turned on or off at a consumer to which the meter is attached. In the example of block 1410, the time-series of Voltage-changes may indicate that electrical loads were turned on or off at other meters attached to a transformer to which the first metrology unit is attached. Thus, if a meter is attached to a same transformer as another meter, consumers turning on and off electrical loads may influence the Voltage “seen” at any meter attached to the transformer. In the example of block 1412, the time-series of Voltage-changes may be configured as a null time-series of Voltage-changes if an assigned time period for the collecting and the time-stamp ing was during a power outage. If one meter experienced a blackout or power outage, and another meter had power at that time, it is unlikely that both meters share a transformer. An exception may be if a tree or other hazard brought down the feed to a meter from the transformer. In the example of block 1414, the time-series of Voltage-changes is associated with a defined time period and has a number of intervals based at least in part on a number of loads turned on or turned off during the defined time period. That is, a Voltage change (such as caused by a change in electrical load) could trigger the end of one interval and the start of anotherinterval. In the example of block 1416, the time-series of voltage-changes may be performed over a defined time period comprising defined time intervals. Thus, the techniques of blocks 1414 or 1416 provide alternative methods by which intervals may be defined. 0074 At block 1418, a correlation may be calculated between the time-series of Voltage-changes of a first meter or metrology unit and a time-series of Voltage-changes associ ated with a second meter or metrology unit.
CONCLUSION
0075 Although the subject matter has been described in language specific to structural features and/or methodologi cal acts, it is to be understood that the subject matter defined in the appended claims is not necessarily limited to the spe cific features or acts described. Rather, the specific features and acts are disclosed as exemplary forms of implementing the claims. What is claimed is: 1. A method, comprising: collecting time-stamped Voltage data from a first meter and
a second meter, respectively; generating a time-series of Voltage-changes for each of the
first meter and the second meter using the collected time-stamped Voltage data;
Aug. 27, 2015
calculating a correlation between the time-series of Volt age-changes of the first meter and the time-series of Voltage-changes of the second meter; and
determining if the first and second meters are connected to a same transformer, based at least in part on the calcu lated correlation.
2. The method of claim 1, wherein calculating the correla tion comprises:
determining that the first meter and the second meter are within a threshold distance of one another; and
responsive to determining that the first and second meters are within the threshold distance, performing the calcu lation.
3. The method of claim 1, wherein calculating the correla tion comprises:
synchronizing times of Voltage-changes in the time-series of voltage-changes of the first meter with times of volt age-changes in the time-series of Voltage-changes of the second meter.
4. The method of claim 1, additionally comprising: determining if the first and second meters are connected to
the same transformer by a same connection, based at least in part on the calculated correlation.
5. The method of claim 4, additionally comprising: generating topological data to show a relationship between
the first meter and the second meter based at least in part on the determined connection.
6. The method of claim 1, additionally comprising: determining a home affinity as a greatest correlation
between the first meter and each meter recorded as con nected to the same transformer,
determining an away affinity as a greatest correlation between the first meter and each meter recorded as not connected to the same transformer but within an extended service area of the same transformer,
comparing the home affinity and the away affinity; and determining, based on the comparison, whether the first
and second meters are connected to the same trans former.
7. The method of claim 1, wherein at least some of the generating of the time-series of voltage-changes is performed on each of the first and second meters.
8. A meter, comprising: a processor; a memory, in communication with the processor, a metrology unit, in communication with the processor, to
provide Voltage measurements over time; a time-series function to generate a time-series of Voltage
changes based at least in part on the Voltage measure ments over time; and
a data structure, defined in the memory, to store the time series of Voltage-changes.
9. The meter of claim8, wherein the time-series function is configured to generate the time-series of Voltage-changes to cover a same period of time as used by time-series functions of other meters to generate time-series of Voltage-changes.
10. A system, comprising the meter of claim 8, and addi tionally comprising:
a correlation module, located on a computing device remote from the meter, configured to calculate a corre lation between the time-series of voltage-changes of the meter and a time-series of Voltage-changes of at least one other meter.

US 2015/0241482 A1
11. A system, comprising the meter of claim 8, and addi tionally comprising:
a plurality of meters within an extended range of service to a transformer to which the meter is connected; and
a correlation module configured to calculate a correlation between the time-series of Voltage-changes of the meter and a time-series of Voltage-changes of each of the plu rality of meters within the extended range of service.
12. A method, comprising: collecting and time-stamping Voltage data from a first
metrology unit; generating a time-series of Voltage-changes based at least
in part on the collected and time-stamped Voltage data, wherein the time-series of voltage-changes results from load changes at the first metrology unit and results from load changes at other metrology units; and
calculating a correlation between the time-series of Volt age-changes and a second time-series of Voltage changes associated with a second metrology unit.
13. The method of claim 12, wherein the voltage data is collected and time-stamped, the time-series of Voltage changes is generated, and the correlation is calculated on a single meter.
14. The method of claim 12, wherein: the Voltage data is collected and time-stamped on a meter,
and the correlation is calculated on a computing device remote
to the meter.
Aug. 27, 2015
15. The method of claim 12, wherein: the time-series of Voltage-changes indicates that electrical
loads were turned on or off at a consumer associated with the first metrology unit; and
the time-series of Voltage-changes indicates that electrical loads were turned on or off at other meters attached to a transformer to which the first metrology unit is attached.
16. The method of claim 12, additionally comprising: receiving an indication of a prescribed time period over
which the collecting and the time-stamping are to be performed.
17. The method of claim 12, wherein the time-series of Voltage-changes comprises a null time-series of Voltage changes if an assigned time period for the collecting and the time-stamping was during a power outage.
18. The method of claim 12, wherein the time-series of Voltage-changes is associated with a defined time period and has a number of intervals based at least in part on a number of loads turned on or turned off during the defined time period.
19. The method of claim 12, wherein the time-series of Voltage-changes is performed over a defined time period comprising defined time intervals.
20. The method of claim 12, wherein the generating of the time-series of Voltage-changes is based at least in part on times at which appliances were turned on or off at any cus tomer on a same transformer to which the metrology unit is attached.