
(19) TZZ ¥ T - patentimages.storage.googleapis.com practice of traditional selection on phenotypic...
34
Note: Within nine months of the publication of the mention of the grant of the European patent in the European Patent Bulletin, any person may give notice to the European Patent Office of opposition to that patent, in accordance with the Implementing Regulations. Notice of opposition shall not be deemed to have been filed until the opposition fee has been paid. (Art. 99(1) European Patent Convention). Printed by Jouve, 75001 PARIS (FR) (19) EP 2 813 141 B1 TEPZZ 8_¥_4_B_T (11) EP 2 813 141 B1 (12) EUROPEAN PATENT SPECIFICATION (45) Date of publication and mention of the grant of the patent: 05.08.2015 Bulletin 2015/32 (21) Application number: 14172374.2 (22) Date of filing: 13.06.2014 (51) Int Cl.: A01H 1/04 (2006.01) A01K 67/02 (2006.01) A01K 67/033 (2006.01) G06F 19/18 (2011.01) (54) Directed strategies for improving phenotypic traits Gerichtete Strategien zur Verbesserung phänotypischer Eigenschaften Stratégies dirigées permettant d’améliorer des traits phénotypiques (84) Designated Contracting States: AL AT BE BG CH CY CZ DE DK EE ES FI FR GB GR HR HU IE IS IT LI LT LU LV MC MK MT NL NO PL PT RO RS SE SI SK SM TR (30) Priority: 14.06.2013 NL 2010982 (43) Date of publication of application: 17.12.2014 Bulletin 2014/51 (73) Proprietor: KEYGENE N.V. 6700 AE Wageningen (NL) (72) Inventors: • Guerra, José Lúcio Lima 6700 AE Wageningen (NL) • Doeswijk, Timotheus Gerardus 6700 AE Wageningen (NL) • van Berloo, Remco 6700 AE Wageningen (NL) • Buntjer, Jacob Bernhard 6700 AE Wageningen (NL) • Bouman, Niek 6700 AE Wageningen (NL) (74) Representative: EP&C P.O. Box 3241 2280 GE Rijswijk (NL) (56) References cited: EP-A1- 1 962 212 WO-A1-2008/085046 WO-A1-2010/020252 WO-A1-2012/075125 WO-A2-2008/074101 US-A1- 2010 037 342 • BUNTJER J B ET AL: "Haplotype diversity: the link between statistical and biological association", TRENDS IN PLANT SCIENCE, ELSEVIER SCIENCE, OXFORD, GB, vol. 10, no. 10, 1 October 2005 (2005-10-01), pages 466-471, XP027846795, ISSN: 1360-1385 [retrieved on 2005-10-01] • MEUWISSEN T: "Genomic selection: the future of marker assisted selection and animal breeding", INTERNET CITATION, 17 October 2003 (2003-10-17), XP002334468, Retrieved from the Internet: URL:http://www.fao.org/biotech/ Torino.htm [retrieved on 2005-07-04] • MEUWISSEN T H E ET AL: "Prediction of Total Genetic Value Using Genome-Wide Dense Marker Maps", GENETICS, GENETICS SOCIETY OF AMERICA, AUSTIN, TX, US, vol. 157, 1 April 2001 (2001-04-01), pages 1819-1829, XP007901970, ISSN: 0016-6731 • TINGTING GUO ET AL: "Performance prediction of Fhybrids between recombinant inbred lines derived from two elite maize inbred lines", THEORETICAL AND APPLIED GENETICS ; INTERNATIONAL JOURNAL OF PLANT BREEDING RESEARCH, SPRINGER, BERLIN, DE, vol. 126, no. 1, 13 September 2012 (2012-09-13), pages 189-201, XP035157575, ISSN: 1432-2242, DOI: 10.1007/S00122-012-1973-9
Transcript of (19) TZZ ¥ T - patentimages.storage.googleapis.com practice of traditional selection on phenotypic...
Note: Within nine months of the publication of the mention of the grant of the European patent in the European PatentBulletin, any person may give notice to the European Patent Office of opposition to that patent, in accordance with theImplementing Regulations. Notice of opposition shall not be deemed to have been filed until the opposition fee has beenpaid. (Art. 99(1) European Patent Convention).
Printed by Jouve, 75001 PARIS (FR)
(19)E
P2
813
141
B1
TEPZZ 8_¥_4_B_T(11) EP 2 813 141 B1
(12) EUROPEAN PATENT SPECIFICATION
(45) Date of publication and mention of the grant of the patent: 05.08.2015 Bulletin 2015/32
(21) Application number: 14172374.2
(22) Date of filing: 13.06.2014
(51) Int Cl.:A01H 1/04 (2006.01) A01K 67/02 (2006.01)
A01K 67/033 (2006.01) G06F 19/18 (2011.01)
(54) Directed strategies for improving phenotypic traits
Gerichtete Strategien zur Verbesserung phänotypischer Eigenschaften
Stratégies dirigées permettant d’améliorer des traits phénotypiques
(84) Designated Contracting States: AL AT BE BG CH CY CZ DE DK EE ES FI FR GB GR HR HU IE IS IT LI LT LU LV MC MK MT NL NO PL PT RO RS SE SI SK SM TR
(30) Priority: 14.06.2013 NL 2010982
(43) Date of publication of application: 17.12.2014 Bulletin 2014/51
(73) Proprietor: KEYGENE N.V.6700 AE Wageningen (NL)
(72) Inventors: • Guerra, José Lúcio Lima
6700 AE Wageningen (NL)• Doeswijk, Timotheus Gerardus
6700 AE Wageningen (NL)• van Berloo, Remco
6700 AE Wageningen (NL)• Buntjer, Jacob Bernhard
6700 AE Wageningen (NL)• Bouman, Niek
6700 AE Wageningen (NL)
(74) Representative: EP&CP.O. Box 32412280 GE Rijswijk (NL)
(56) References cited: EP-A1- 1 962 212 WO-A1-2008/085046WO-A1-2010/020252 WO-A1-2012/075125WO-A2-2008/074101 US-A1- 2010 037 342
• BUNTJER J B ET AL: "Haplotype diversity: the link between statistical and biological association", TRENDS IN PLANT SCIENCE, ELSEVIER SCIENCE, OXFORD, GB, vol. 10, no. 10, 1 October 2005 (2005-10-01), pages 466-471, XP027846795, ISSN: 1360-1385 [retrieved on 2005-10-01]
• MEUWISSEN T: "Genomic selection: the future of marker assisted selection and animal breeding", INTERNET CITATION, 17 October 2003 (2003-10-17), XP002334468, Retrieved from the Internet: URL:http://www.fao.org/biotech/Torino.htm [retrieved on 2005-07-04]
• MEUWISSEN T H E ET AL: "Prediction of Total Genetic Value Using Genome-Wide Dense Marker Maps", GENETICS, GENETICS SOCIETY OF AMERICA, AUSTIN, TX, US, vol. 157, 1 April 2001 (2001-04-01), pages 1819-1829, XP007901970, ISSN: 0016-6731
• TINGTING GUO ET AL: "Performance prediction of Fhybrids between recombinant inbred lines derived from two elite maize inbred lines", THEORETICAL AND APPLIED GENETICS ; INTERNATIONAL JOURNAL OF PLANT BREEDING RESEARCH, SPRINGER, BERLIN, DE, vol. 126, no. 1, 13 September 2012 (2012-09-13), pages 189-201, XP035157575, ISSN: 1432-2242, DOI: 10.1007/S00122-012-1973-9
EP 2 813 141 B1
2
5
10
15
20
25
30
35
40
45
50
55
Description
Technical field
[0001] The present invention relates to the field of methods for improving at least one phenotypic trait of interest insubsequent generation(s) of a population of individuals, preferably crop plants or cattle. Particularly, the present inventionrelates to methods for identifying the combination of at least three individuals that gives, upon subsequent intercrossing,the highest estimated probability of improving the at least one phenotypic trait of interest in the subsequent generation(s).
Background of the invention
[0002] The limitations of marker assisted selection (MAS), occurring when applied to manage quantitative variationunder the influence of a large number of loci, are expected to be greatly improved by the simultaneous usage of genomewide markers. Cost effective genotyping techniques enable breeding companies to generate information about geneticvariation on thousands of loci across the genome on all breeding materials a plant breeder has at his or her disposal tocreate new varieties. As a result, new strategies to perform plant/animal breeding in this new landscape of abundantinformation are emerging. One strategy is Genomic Selection (GS), the use of genome-wide genotypic data to predictestimated breeding values (EBV) for selection purposes, which was originally proposed in animal breeding [Meuwissenet al., 2001], and has since then been successfully applied in animal breeding in for instance cattle and poultry. TheEBV is calculated from performance data and it is an approximation to an individual’s genetic merit. In GS, EBVs arepredicted based on genome wide information. GS is performed with a class of statistical methods called ridge regression.Ridge regression was first introduced in by E.A. Hoerl (1959). Ridge regression is used when ill posed problems areobserved: for instance when more variables than the total number of observations are used to make a prediction. Themost important parameter in ridge regression corresponds to the distribution assumed to the model parameters (GSmodel). This distribution is used to capture the genotype/phenotype relationship. Intense research has led to multipledistribution assumptions, which in turn has led to a large number of multiple ridge regression models, also call GS models(BayesA, BayesB, BayesC, BayesC pi, BayesD, machine learning methods, information theory methods, etc.). Withever improving statistical methods and increasing sizes of breeding data it is fair to expect that the accuracy of modelscapturing genotype/phenotype relationships are likely to gradually improve. And it is expected that a variety of suchmodels will become applicable in breeding, enabling GS to become a more and more important breeding strategy.[0003] In recent years, genomic selection has been under investigation by plant breeders as an alternative to markerassisted selection (MAS) and phenotype selection. GS as a strategy has the potential to improve highly complex traitsor combinations of multiple traits without the requirement to identify significantly linked/associated loci or candidategenes by simply constructing quantitative genotype/phenotype models over a large amount of genome-wide distributedmarkers. Use of genome-wide estimated breeding values (GEBVs) rather than actual phenotypic values provides breed-ers the opportunity to select individual animals or plants for trait performance without doing actual phenotyping, thuspotentially saving costs and time. This can be applied both to single, complex traits but also to multiple traits combinedin an index. The possibility to estimate traits in an earlier stage is in particular advantageous in crops with a long breedingcycle (i.e. tree species), and in this way easily multiple years can be gained.[0004] One major application of GS or methods that capture whole genotype/phenotype relationships in the breedingpractice is the selection of parents for the next breeding cycle. This is done by prediction of the GEBVs for a trait or anindex of traits for all members of a panel of candidate parents after which the parents with the highest values are selectedfor further breeding, a practice not unlike the traditional selection practice based on actual phenotypes [Haley andVisscher, 1998].[0005] As a breeding method, prediction based strategies based on genotype/phenotype relationships works in twophases, a training phase and a selection phase:
Training phase
[0006] In this phase, the investment is made in setting up the phenotypic prediction model. Required is accuratephenotyping of the members of a test population or germplasm panel and the high-density genotyping (104-105 markers)of the same individual. From these two data types, a model is constructed by one of the multiple methods available tothis in the public domain [e.g. Meuwissen et al, 2001]. Optionally, the prediction quality of the constructed model is testedon a second population from which both genotypes and phenotypes have been measured.
Selection phase
[0007] In the second phase, all members of a breeding population are genotyped, using the same marker set of the
EP 2 813 141 B1
3
5
10
15
20
25
30
35
40
45
50
55
training phase. By entering the genotypic data in the model constructed in the previous phase, breeding values arepredicted for each individual without doing any actual phenotypic measurement. Selections are made from populationsfor breeding purposes, based on the predicted values.[0008] However, the optimal strategy of selecting individuals to obtain the best gain in phenotype improvement hasnot been worked out in the prior art. Therefore, it is an object of the present invention to provide for an improved procedurewhich is better optimized, as compared to the prior art, to identify (and select) the individuals that have the highestprobability to produce the best performing offspring in the next generation.
Summary of the invention
[0009] Not included in the scope of protection are methods involving crossing and subquent selection of plants oranimals or other essentially biological processes in the sense of Article 53(b) EPC. The present inventors came to therealization that the prior art selection strategy does not consider the long-term impact on the breeding process of theselection made in the current population. This is because in prior art methods, the best per se performing parents willbe selected, assuming that, under an additive model, crossing these will result in the best performing genotypes in thenext generations.[0010] However, if, for example, two parents are selected from which the favorable alleles are largely overlapping, thefuture improvement of the genotype will be limited to obtaining fixed homozygous allele states for these loci (a state thatmay also be reached by inbreeding from a single parent), and missing the selection opportunity to gather additionalfavorable alleles on alternative loci by introduction via other parents.[0011] The prior art methodology to make selections in breeding based on or predicted by a GS model is shaped afterthe practice of traditional selection on phenotypic observations and is overlooking that a genomic prediction modelcontains detailed information about which genome sections are most contributing to the positive and negative perform-ance of the trait. Although the basic principle of GS is the assumption that all loci of a genome contribute to the trait,most GS models specify only an additive effect for each single locus (see e.g. EP1962212, or US2010/0037342).Therefore, although both a directly measurable phenotype and a given GS prediction model might predict an equallyhigh quantitative trait value for two arbitrary individuals, for the next breeding step, it makes a large difference whetherin both cases the superior performance is predicted by identical loci in both genomes or by different genomic regions.In the latter case, improvement of the trait average may be expected in the next breeding cycles, by combining thefavorable alleles, whereas in the first case it may not. In phenotypic as well as genomic selection, the performance ofthe parents does not adequately predict their mutually combined ability and expected success of the resulting genotypeof the crosses to be made in the next generation or generations.[0012] A first attempt to predict the combined ability and expected success of different parent pairs is described inWO2012075125. Briefly, the document suggests to calculate breeding values of different parent pairs by taking themean breeding value of simulated offspring genotypes of each parent pair. However, the present inventors recognizedthat the full potential of a population, e.g. with respect to a certain trait, lies in the combination of multiple parents, i.e.more than a single parent pair), because complete genomewide complementarity is unlikely to occur within a singleparent pair. Indeed, in several experiments the present inventors discovered a strongly enhanced efficiency of a genomicselection strategy that is based on the selection of a subset of at least 3 parents as compared to strategies that arebased on the selection of single parent pairs (regular genomic selection) and crossing of said pairs.[0013] Technically, the present inventors achieved this by focusing on Genomewide Estimated Breeding Values fromthe genotypes of the combination of at least 3 individuals of the parent generation, rather than by focusing on the genotypeof individual pairs. Each subset of at least 3 marker genotypes can be considered as a library of haplotypes, from whichmultiple combinations have a predictable likelihood to produce genotypes with the predicted highest achievable pheno-typic value. In some embodiments, this will be reached by recombination of the existing haplotypes within a genotypeprior to transmission to the offspring in the next breeding cycle or plurality of breeding cycles. Of course, genotypes canonly be recombined by crossing of two parents or self-fertilization. However, as will be clear to the skilled person, mixingof subsets of at least 3 genomes can be achieved via several parallel and/or subsequent crosses, which can be performedafter the selection method according to the present disclosure.[0014] The present disclosure thus extends the use of the GS model as developed in the training phase (in which nochanges are proposed) by improving the efficiency in the selection phase. This procedure enables the selection of groupsof at least 3 individuals that have the highest probability to produce the best performing offspring in the next generations,rather than to select the best performing pairs. This approach was shown to achieve unexpectedly better breeding resultsin simulation models.[0015] As an example of the principle underlying the present disclosure, Figure 1 shows a graphical representationof the selection process in a breeding population consisting of 3 diploid individuals represented by their genotypes G1-3.The individuals have been genotyped for 5 loci L1-5 and the phenotype for an individual with a particular genotype canbe predicted using a mathematical genome-wide prediction model that assigns positive or negative effects to each allele

EP 2 813 141 B1
4
5
10
15
20
25
30
35
40
45
50
55
occurring on the loci. The concept of the current disclosure involves the construction of the putative future genotype thatpredicts the highest phenotypic performance from haplotypes (H1.1-H3.2) occurring in the current population, or recom-binants of those. In the example of Figure 1, the best obtainable genotype that can be obtained with a single cross iscombining haplotypes H1.1 and H3.1 (indicated bold), which complement each other in locus L5 versus the others.According to the present disclosure, and extrapolating from Figure 1, it will be clear that in larger populations, the putativegenotype can be constructed analogously from haplotypes of more than two individuals.[0016] In case recombination between loci with another haplotype would lead to an increase of positively contributingalleles (as in haplotype H 1.1) the breeding value is calculated from the recombinant haplotype, multiplied with theprobability that this recombination occurs between the loci (example P[θ 1→2] with θ 1→2 defining the estimated frequencyof recombination between locus 1 and 2). On the other hand, if recombination would lead to a decrease of positivelycontributing alleles, the predicted phenotype value of the haplotype is multiplied with the probability of no recombinationoccurring (example P[not θ 3→4] = 1-P[θ 3→4] ).[0017] Another example is shown in Table 1 which shows a selection strategy from a population using CombinedGenomic Estimated Breeding Values. From a very small population of 5 diploid homozygous individuals the genotypeshave been established (represented by 12 loci; top side of the table). If each allele marked "A" is positively contributingto a desired trait value, according to a genomic prediction model and "B" indicates all other alleles, the best achievablegenotype contains the highest fraction of "A" alleles.[0018] The genomic estimated breeding values (GEBVs) of each individual are shown in the boxed cells on the diagonalof the lower part of the table, the off-diagonal cells contain CGEBVs.[0019] Following the prior art selection procedure using GEBVs, the individuals with the highest values would havebeen selected as parents for the next generation, which are in the example of Table 1 individuals 1, 2 and 4. However,when taking the combined ability of parent pairs into account, the result may be different. For example in Table 1, whenranking the Combined GEBVs, it becomes apparent that the combinations of individuals 1 and 2; 1 and 3; as well as 1and 5 are superior over 1 and 4, as these parent pairs have a better prospective for the production of the highest rankinggenotypes in the next generation.[0020] The prospect of finding the best allele gathering in the described population becomes even better when com-binations of more than two parents are compared. When all combinations of three parents are compared, it becomesapparent that the combinations (1, 2 and 3) and (1, 2 and 5) are the superior triplets with a CGEBV of 0.92 (not shownin the table), while the triplet of superior per se GEBV parents (1, 2 and 4) have a CGEBV of only 0.83. The superiortriplets cannot directly be inferred from the superior CGEBVs as calculated for the two-parent combinations, which are(1,2), (1,3) and (1,5). In the example of Table 1, this becomes clear because the combination (1, 3 and 5) has a lowerCGEBV (0.83) than the combinations (1, 2 and 5) and (1, 2 and 3), which can only be found if the three-parent combinationsare compared.[0021] Since all individuals in the example of Table 1 are homozygous, for pairwise (first generation) CGEBV estimation,recombination processes are irrelevant.

EP 2 813 141 B1
5
5
10
15
20
25
30
35
40
45
50
55
[0022] A further example is shown in Table 2 which shows a selection strategy as in Table 1, but now applied to aheterozygous population and taking recombination events into account. In the example of Table 2, according to GEBVvalues, individual 1 and 2 are the top ranking parents (0.33 and 0.21, respectively), but the CGEBV ranking for thedifferent parent pairs shows that actually the combinations (1, 3), (1, 4) and (1, 5) are able to produce the best offspringgenotypes. The genotypes of individual 3, 4 and 5 are identical, however the allele phases of the haplotypes differ. Thealleles of the first haplotype of individual 3 includes all favorable alleles in linkage phase and requires no recombinationevent to pass on all favorable alleles to the offspring. In the genotypes of individuals 4 and 5, two recombinations arerequired to transmit all alleles in a single haplotype. In individual 4, the first of the required recombinations is between

EP 2 813 141 B1
6
5
10
15
20
25
30
35
40
45
50
55
loci 2 and 4, while in individual 5 this is between loci 1 and 2. If the genetic distance between loci 2 and 5 is larger, therequired recombination events are more probable to occur in individual 4. By correcting the initial CGEBV value in thetable with the probability of the recombination events occurring, the CGEBV ranking of individual 1 with the others willbecome 3, 4, 5, 2. As a result, the combination of individual 1 and 3 is the best parent pair for the next generation in thecurrent panel.
Definitions
[0023] In the following description and examples, a number of terms are used. In order to provide a clear and consistentunderstanding of the description and claims, including the scope to be given such terms, the following definitions areprovided for the terms as used in the description and claims. Unless otherwise defined herein, all technical and scientificterms used have the same meaning as commonly understood by one of ordinary skill in the art to which this inventionbelongs.[0024] Selection and selection criteria: process, model, system or algorithm in order to choose individuals in a populationthat will contribute genetic material to the next generation. In particular, such a process, model, system or algorithm canbe based both on natural or artificial phenomena or procedural steps. Selection criteria can be based on phenotypic orgenomic characteristics, for instance, but not limited to, the presence, or degree of presence, of genes, gene expression,genetic markers, combinations of genes, quantitative trait loci, traits or combinations of traits.[0025] Breeding value: the genetic merit of a unit of inheritance such as an individual in a breeding program. This

EP 2 813 141 B1
7
5
10
15
20
25
30
35
40
45
50
55
genetic merit is determined by the contribution to at least one phenotypic trait of interest of an individual’s gene or genesor (genetic) loci in a breeding program aimed at improving the at least one phenotypic trait of interest.[0026] Estimated breeding value: an approximation of an individual’s breeding value, in particular based on the esti-mated difference between the average performance of that individual’s offspring and the average performance of alloffspring in a randomly mating population. The estimated average performance of all offspring in a randomly matingpopulation may take into account that individuals with inter-familial relationships, i.e. pedigree relations, normally do notmate.[0027] Genome-wide estimated breeding value: estimated breeding value based on genome-wide information, i.e.information derived from different or remote (genetic) loci of the genome such as loci of different chromosomes. Inparticular, genome-wide estimated breeding values are an approximation of an individual’s genome-wide genetic merit,determined by the contribution to at least one phenotypic trait of interest of an individual’s genome-wide genes or genome-wide (genetic) loci, or genome-wide haplotypes or genome-wide molecular marker scores in a breeding program aimedat improving the at least one phenotypic trait of interest.[0028] Combined Genome-wide Estimated Breeding Value (CGEBV): Genome-wide Estimated Breeding Value of acombination of three or more individuals within a population. The combination with the highest CGEBV (as comparedto the other combinations) together have the highest estimated probability to produce the best performing offspring insubsequent generations in a breeding program aimed at improving an at least one phenotypic trait of interest. So, theCGEBV actually accounts for the genome-wide estimated breeding values of the genotypes of the putative offspring,and does not solely consider the genotype of each individual potential parent separately. In particular, the potentialparents may not be the best performing individuals per se, or the potential parents with the best genome-wide estimatedgenomic breeding value.[0029] Directed genome-wide selection: selection method based on focusing on a combination of individuals in apopulation that together have the highest probability to produce the best performing offspring in the next generations ina breeding program aimed at one or more selection criteria. With directed genome-wide selection the focus is on genome-wide estimated breeding values of the genotypes of the putative offspring (combined genome-wide estimated breedingvalue), rather than by focusing on the genotype of each individual parent itself. In particular, this selection method is notbased on selecting the best performing individuals per se.[0030] Regular genome-wide selection: selection method based on crossing parents with the best genome-wide es-timated breeding values per se.[0031] Offspring: the term "offspring", refers to the first or further generation obtained by intercrossing.[0032] Phenotype: the composite of an individual’s characteristics or traits, particularly observable characteristics ortraits, such as, but not limited to morphological, physical, biochemical, developmental or behavioral characteristics ortraits. The phenotype of an individual can be formed by the expression of genes as well as environmental factors, andon interactions between gene expression and environmental factors.[0033] Phenotypic trait of interest: a heritable characteristic of a plant or animal species which may be quantified in acertain unit of measure. Examples of quantitative phenotypic traits of interest are (but are not limited to) for plants: fruitsize, fruit count, yield in kg per ha, plant height, relative growth speed, flowering time, germination rate, leave area,disease resistances, yield components, biochemical composition, and for animals: milk yield, milk protein content, carcassweight, fodder conversion, body fat composition, litter size, coat color, resistances to diseases. It can be desired that aquantitative phenotypic trait of interest is increased or decreased, and the respective shift of the average value for thecharacteristic in the population can improve the economic value of that population, variety or offspring relative to theparent generation(s).[0034] Genotype: as used herein, the term "genotype" refers to the genetic makeup of a cell, an organism, or anindividual (i.e. the specific allele makeup of the individual) usually with reference to a specific character or phenotypictrait of interest under consideration. However, not all organisms with the same genotype necessarily look or act thesame way because appearance and behavior are modified by environmental and developmental conditions. Likewise,not all organisms that look alike necessarily have the same genotype.[0035] Genotyping: as used herein, the term "genotyping" or "determining the genotype" refers to the process ofdetermining genetic variations among individuals in a species. Single nucleotide polymorphisms (SNPs) are the mostcommon type of genetic variation that are used for genotyping and by definition are single-base differences at a specificlocus that is found in more than 1% of the population. SNPs are found in both coding and non-coding regions of thegenome and can be associated with a phenotypic trait of interest such as a quantitative phenotypic trait of interest.Hence, SNPs can be used as markers for quantitative phenotypic traits of interest. Another common type of geneticvariation that are used for genotyping are "InDels" or insertions and deletions of nucleotides of varying length. For bothSNP and InDel genotyping, many methods exist to determine genotype among individuals. The chosen method generallydepends on the throughput needed, which is a function of both the number of individuals being genotyped and thenumber of genotypes being tested for each individual. The chosen method also depends on the amount of samplematerial available from each individual or sample. For example, sequencing may be used for determining presence or

EP 2 813 141 B1
8
5
10
15
20
25
30
35
40
45
50
55
absence of markers such as SNPs, e.g. such as Sanger sequencing and High Throughput Sequencing technologies(HTS). Sanger sequencing may involve sequencing via detection through (capillary) electrophoresis, in which up to 384capillaries may be sequence analysed in one run. High throughput sequencing involves the parallel sequencing ofthousands or millions or more sequences at once. HTS can be defined as Next Generation sequencing, i.e. techniquesbased on solid phase pyrosequencing or as Next-Next Generation sequencing based on single nucleotide real timesequencing (SMRT). HTS technologies are available such as offered by Roche, Illumina and Applied Biosystems (LifeTechnologies). Further high throughput sequencing technologies are described by and/or available from Helicos, PacificBiosciences, Complete Genomics, Ion Torrent Systems, Oxford Nanopore Technologies, Nabsys, ZS Genetics, GnuBio.Each of these sequencing technologies have their own way of preparing samples prior to the actual sequencing step.These steps may be included in the high throughput sequencing method. In certain cases, steps that are particular forthe sequencing step may be integrated in the sample preparation protocol prior to the actual sequencing step for reasonsof efficiency or economy. For instance, adapters that are ligated to fragments may contain sections that can be used insubsequent sequencing steps (so-called sequencing adapters). Primers that are used to amplify a subset of fragmentsprior to sequencing may contain parts within their sequence that introduce sections that can later be used in the sequencingstep, for instance by introducing through an amplification step a sequencing adapter or a capturing moiety in an ampliconthat can be used in a subsequent sequencing step. Depending also on the sequencing technology used, amplificationsteps may be omitted.[0036] Genotype/phenotype relationship model: a model that can associate (correlate) genotype with phenotype forindividuals in a population. To create such model it is typically required to phenotype individuals of a population andgenotype the same individuals. In particular, genotyping can be based on high-density marker data, such as data onthe presence or absence of a SNP at a plurality of loci. Likewise, phenotyping can be performed at high accuracy, forexample by measuring the value for the quantitative phenotypic trait of interest per individual. The genotype/phenotyperelationship model can then be created by calculating correlations between the genotypic data and the phenotypic data.For example, with a dense marker map, such as SNP map, some markers can be correlated with positive or negativeeffects on a particular quantitative phenotypic trait of interest. In this way, the model can attribute a contribution to thequantitative phenotypic trait of interest to the presence or absence of a marker. Said contribution may for example beexpressed in kg, m, L, depending on the unit of measure as used for the quantitative phenotypic trait of interest (forexample fruit size, milk production, etc.). Various methods are available in the art in order to construct such a model(Meuwissen et al., 2001).[0037] Locus: as used herein, the term "locus" or "loci" (plural) refers to a specific site (place) or sites on the genome.For example, the "locus" refers to the site in the genome where the two alleles of the locus are found (for diploidorganisms). Quantitative trait loci (QTLs) are sites on the genome containing alleles that are associated to a quantitativetrait (based on the genotype/phenotype relationship model).[0038] Allele: the term "allele" refers to the nucleotide sequence variant that is present on one of the positions of aparticular locus. A diploid individual has two positions for one allele per locus, one position on either one of the twohomologous chromosomes. For each of the positions of a particular locus, one or more alternative nucleotide sequencevariants may exist in a population, i.e. for each position different possible alleles may exist in a population. However,each individual can have only one of the possible alleles on each one of the positions of a locus. The alternative nucleotidesequence variants, i.e. the different possible alleles, differ at least slightly in nucleotide sequence, and typically can bedistinguished based on the presence or absence of at least one SNP or InDel. When referred herein to an "allelic state",reference is made to the presence or absence of an allele at a position within a particular locus, which can be expressedas the presence or absence of the respective marker (e.g. SNP or indel) at the particular locus.[0039] Allele dose of a locus: the number of copies present in a genome of a given allele on a given locus. The rangefor the allele dose is between 0 (no copies present) to the (auto)ploidy level of the genome; i.e. for diploid species, theallele dose for a given allele can be either 0, 1 or 2. For polyploid genomes the max allele dose corresponds to thenumber of homologous chromosome copies.[0040] Attributed Allele substitution effect: this term refers to the estimated quantitative effect on the trait when on agiven locus the one allele (e.g. as measured by presence of a particular SNP) is substituted by the other allele (e.g. asmeasured by absence of the particular SNP) within a given genetic and/or environmental background. For example, iffruit yield is the quantitative phenotypic trait of interest in a population of plants, the quantitative effect on that trait maybe expressed in kg. Based on the genotype/phenotype relationship model, a particular allele on a given locus (e.g. asmeasured by presence of a particular SNP) can thus be attributed an allele substitution effect of e.g. 0.0001 kg, whichmeans that if the particular allele is replaced by the other possible allele (e.g. as measured by absence of the particularSNP), the quantitative effect on the trait, i.e. fruit yield is estimated to be 0.0001 kg.[0041] Attributed Allele substitution effect corrected for recombination probability: Attributed allele substitution effectscan be corrected for recombination probabilities. The further away two loci are from each other, the more likely it is thatrecombination (crossing over) takes place between the two loci. The distance between loci is measured in terms ofrecombination probability and is given in cM (centiMorgans; 1 cM is a meiotic recombination probability between two

EP 2 813 141 B1
9
5
10
15
20
25
30
35
40
45
50
55
markers of 1%). This is relevant because for both positively and negatively contributing alleles, one would like to knowthe chance that they are transmitted to offspring. A positive attributed allele substitution effect can be corrected forrecombination probability by taking into account the probability that (after crossing with another individual) the allele istransmitted to the genome of offspring. A negative attributed allele substitution effect can be corrected for recombinationprobability by taking into account the probability that (after crossing with another individual) the allele is not transmittedto the genome of offspring.[0042] Heterozygous and homozygous: as used herein, the term "heterozygous" refers to a genetic condition existingwhen two different alleles reside at a specific locus, for example a locus having alleles A/B, wherein A and B are positionedindividually on either one of the two homologous chromosomes. Conversely, as used herein, the term "homozygous"refers to a genetic condition existing when two identical alleles reside at a specific locus, for example a locus havingalleles A/A, positioned individually on either one of the two homologous chromosomes.[0043] Molecular marker technique: as used herein, the term "molecular maker technique" refers to a (DNA based)assay that indicates (directly or indirectly) the presence or absence of a marker allele of interest in an individual (e.g.(crop) plant or cattle). Preferably, it allows one to determine, e.g. by sequencing, whether a particular allele is presentor absent at one of the positions at the locus in any individual.
Detailed description of the invention
[0044] The present disclosure relates to a method for identifying combination(s) of at least three individuals within abreeding population, wherein the combinations have, for at least one phenotypic trait of interest, a higher CombinedGenome-Wide Estimated Breeding Value in the offspring for said at least one phenotypic trait of interest, as comparedto at least 70% of the other combinations of at least three individuals within said breeding population. The present methodcomprises the following steps:
a) providing a training population of individuals;
b) collecting phenotypic data for the at least one trait of interest for each individual within said training population;
c) collecting genotypic data for each individual within said training population using molecular marker techniques,sequence-based genotyping or whole genome sequencing, and attributing to each allele of a plurality of loci of eachindividual, an allele substitution effect for the at least one phenotypic trait of interest;
d) providing a genotype/phenotype relationship model for said training population of individuals, wherein the modelestimates for a given genotype of an individual what the quantitative contribution is of the allele substitution effectsof said plurality of loci on the at least one phenotypic trait of interest;
e) genotyping each individual within a breeding population, preferably (by collecting genotypic data for each individualwithin said breeding population) in the same way as in step c);
f) calculating for each individual within the breeding population the allele substitution effect for each allele of saidplurality of loci by using the genotype/phenotype relationship model of step d), and correcting for recombinationprobabilities with flanking loci, wherein for an allele with a positive allele substitution effect said effect is multipliedwith the probability that said allele is transmitted to the offspring, and for an allele with a negative allele substitutioneffect said effect is multiplied with the probability that said allele is not transmitted to the offspring;
g) determining the Combined Genome-Wide Estimated Breeding Value in the offspring for the at least one phenotypictrait of interest for each combination of at least three individuals within the breeding population by calculating foreach combination of at least three individuals for each locus of said plurality of loci in the offspring the highestcombination of allele substitution effects using the calculated and corrected allele substitution effects of the individualscalculated in step f);
h) identifying the combinations of at least three individuals within the breeding population that provide for said atleast one phenotypic trait of interest Combined Genome-Wide Estimated Breeding Values in the offspring that arehigher than at least 70% of the Combined Genome-Wide Estimated Breeding Values in the offspring of othercombinations of individuals within the breeding population.
[0045] While previous methods focus on identifying the (pairs of) individuals within the breeding population that ontheir own have the best genome-wide estimated breeding values, the present method allows to identify which subset(s)

EP 2 813 141 B1
10
5
10
15
20
25
30
35
40
45
50
55
of at least three parents together have the best combined genome-wide estimated breeding value. In this way, one couldsay that the present method actually assesses the genome-wide estimated breeding value of the putative offspring ofdifferent combinations of at least three potential parents.[0046] In other words, the method allows to identify (and/or subsequently select) at least one (e.g. at least 2, at least3, at least 5, or at least 10) combination of at least three (e.g. at least 5, at least 10) individuals in a (breeding) populationthat together have the highest probability to produce the best performing offspring in the next generation(s) in a breedingprogram aimed at improving at least one (or at least 2, 3, 4) (quantitative) phenotypic trait of interest. Where referenceis made to a CGEBV in the offspring of a combination, the CGEBV of the respective combination of individuals is meantwhich reflects the breeding value of their putative offspring.[0047] For example, in a population of four individuals a, b, c, d three possible combinations are: (a, b, and c); (a, c,and d); (b, c and d). If in this example the combination (a, b, and c) has a CGEBV of 10, the combination of (a, c, andd) has a CGEBV of 20, and the combination (b, c and d) has a CGEBV of 30, the method can identify the combination(b, c and d) as the best combination of three individuals (subset). However, the method also allows to identify and/orselect more than one combination for use in a subsequent breeding program, e.g. in this example the method can identifythe combination (b, c and d) as well as the combination (a, c, and d), because their CGEBVs are both higher than thatof the combination (a, b, and c). Exactly the same principle can be applied to extract subgroups of more than threeparents out of larger panels, by calculating CGEBVs for all triplets, quartettes etc. and ranking these.[0048] In step a) of the method, a (training) population of individuals is provided. This population can optionally becalled a training population, because it serves for the establishment of a genotype/phenotype relationship model. Suchmodel allows to attribute an allele substitution effect on the at least one phenotypic trait of interest to each of the allelesof a plurality of loci of individuals of a breeding population. Therefore, preferably, the training population and the breedingpopulation relate to the same plant or non-human animal species, and more preferably the training population is thesame as the breeding population or most preferably a selection of individuals therefrom. It is also possible that thetraining population is a specifically designed population, which means that the population is specifically compiled for thepurpose of generating a phenotype/genotype relationship model.[0049] In the present disclosure, the term "individual" refers to living subjects, and in particular to (crop) plants or non-human animals such as cattle. Preferably the training population comprises at least 3, at least 10, or at least 50 individuals,but (in particular if the individuals are plants) the training population may also comprise at least 100, or at least 500individuals.[0050] In step b) of the method, phenotypic data is collected for the at least one phenotypic trait of interest for eachindividual within said population. For example, if the trait concerns the quantity of milk production (cattle), or the size ofthe flowers (plants), one can measure, for each individual of the training population, the quantity of milk production (inL) or the size of the flowers (diameter in m).[0051] Then step c) of the method collects genotypic data for each individual with the training population using methodswell-known to the skilled person, such as molecular marker techniques, sequence-based genotyping or whole genomesequencing. As explained earlier herein, genotyping, or determining the genotype refers to the process of determininggenetic variations among individuals in the population. For this, the skilled person has various molecular biology tech-niques at his disposal such as hybridisation analysis, PCR and preferably sequencing in order to examine DNA moleculesof the individuals in order to unravel sequence variations between said individuals.[0052] The molecular marker technique(s) used in the present method are preferably selected from the group consistingof the detection of SNPs, the detection of RFLPs, the detection of SSR polymorphisms, RAPDs, the detection of indelsor CNVs, and AFLP.[0053] Molecular biology techniques are well-known to the skilled person and for example described in standardhandbooks such as Sambrook and Russell (2001) Molecular Cloning: A Laboratory Manual, Third Edition, Cold SpringHarbor Laboratory Press, NY; and in Volumes 1 and 2 of Ausubel et al. (1994) Current Protocols in Molecular Biology,Current Protocols, USA. Standard materials and methods for plant molecular work are described in Plant MolecularBiology Labfax (1993) by R.D.D. Croy, published by BIOS Scientific Publications Ltd (UK) and Blackwell ScientificPublications, UK.[0054] Step c) then continues with attributing to each allele of a plurality of loci of each individual, an allele substitutioneffect for the at least one phenotypic trait of interest. Said attributing is typically based on the identification of correlationsbetween the phenotypic data and the genotypic data. In this respect, the term "allele substitution effect", as also explainedelsewhere herein, refers to an estimated quantitative effect on a certain phenotypic trait when on a given locus the oneallele (e.g. as measured by presence/absence of a particular SNP) is substituted by the respective allele (e.g. as measuredby presence/absence of the particular SNP) within a given genetic and/or environmental background.[0055] For example, the allele substitution effect of a certain allele with SNP versus an allele without the SNP on thesame position can be based on comparing phenotypes of individuals having only the allele with SNP with phenotypesof individuals having only the allele without SNP. Such comparing may identify correlations between the genotype andthe phenotype.

EP 2 813 141 B1
11
5
10
15
20
25
30
35
40
45
50
55
[0056] After steps a), b), and c), step d) can provide a genotype/phenotype relationship model for the training populationof individuals, wherein the model allows to estimate (and/or attribute) for a given genotype of an individual within abreeding population, what the quantitative contribution is of the allele substitution effects of the plurality of loci on the atleast one phenotypic trait of interest. In other words, the model can attribute to each allele of the plurality of loci, an allelesubstitution effect based on the correlations found while or after producing the genotype/phenotype relationship model.[0057] If the present method uses a preexisting (or prior prepared) genotype/phenotype relationship model for theindividuals of the breeding population, steps a), b), c), and d) are not required (and thus optional).[0058] In step e), each individual within a breeding population is genotyped, for which molecular marker techniqueswell-known to the skilled person can be used. The molecular marker technique(s) used in the present method arepreferably selected from the group consisting of the detection of SNPs, the detection of RFLPs (differing locations ofrestriction enzyme sites), the detection of SSR (Simple Sequence Repeat) polymorphisms, RAPDs (Random Amplifi-cation of Polymorphic DNA), the detection of indels or CNVs (Copy Number Variations), and AFLP (Amplified FragmentLength Polymorphism).[0059] In step f) of the present method, for each individual within the breeding population, for each allele of a (the)plurality of loci, the allele substitution effect is calculated (attributed) using the genotype/phenotype relationship modelof step d). In this respect, the breeding population refers to the population of individuals which can be further intercrossedwith the aim of improving the at least one phenotypic trait in subsequent generation(s). So, within step e) (or prior tostep e)) the providing of a breeding population is envisaged. It will be clear that the attribution of allele substitution effectsto the individuals within the breeding population can be based on the results of prior genotyping of said individuals.[0060] In the context of the present method, the plurality of loci may refer to as few as two, five, or twenty loci whichmay be located on separate regions of the genome such as different chromosomes, but the term plurality may also referto at least 10, at least 25, at least 100, or at least 500, or at least 1000, or at least 5000 or more different loci preferablylocated on separate regions of the genome such as different chromosomes.[0061] In a preferred embodiment of the present method, the plurality of loci are (genome-wide) loci located on theentire genome, e.g. located on at least 2, at least 5, at least 10, or at least 20 chromosomes. At the same time oralternatively, the plurality of loci comprises at least 100, at least 500, at least 1000, or at least 2000 loci. Furthermore,it is preferred that at least one loci of the plurality of loci is found every 100 cM, preferably every 50 cM, more preferablyevery 25 cM, even more preferably every 10 cM, even more preferably every 5 cM, most preferably every 1 cM of thegenome.[0062] Step f) also aims to correct the attributed allele substitution effects as awarded to each allele of the plurality ofloci, for (estimated) recombination probabilities with flanking loci (e.g. the previous or preferably the next loci (or both)in the 5’ to 3’ direction). This is done by correcting each allele of the plurality of loci that is attributed a positive allelesubstitution effect for the (estimated) recombination probability that (after crossing with another individual) the allele istransmitted to the genome of offspring, and, correcting each allele of the plurality of loci that is attributed a negativeallele substitution effect for the (estimated) recombination probability that (after crossing with another individual) theallele is not transmitted to the genome of the offspring. In this way, step f) of the method allows for correcting of theattributed allele substitution effects attributed to each allele of the plurality of loci of each individual within the populationfor (estimated) recombination probabilities.[0063] Correction of a positive attributed allele substitution effect is preferably (not necessarily) done by multiplyingthe effect with the probability that the corresponding allele is transmitted to the offspring (i.e. a gamete), and correctionof a negative attributed allele substitution effect is preferably (not necessarily) done by multiplying the effect with theprobability that the corresponding allele is not transmitted to the offspring (i.e. a gamete).[0064] In a preferred embodiment of step f) of the method, the recombination probabilities are calculated based ongenetic distances between loci, or based on aligning physical and genetic maps. Further details hereon may be foundin Liu (1998).[0065] The present method then continues with step g) relating to determining the Combined Genome-wide EstimatedBreeding Value (in the offspring) for the at least one phenotypic trait of interest for each combination of at least threeindividuals within the (breeding) population by calculating for each combination of at least three individuals for eachlocus of said plurality of loci (in the offspring) the highest combination of allele substitution effects using the calculatedand corrected allele substitution effects of the individuals calculated in step f).[0066] So, the present method takes into account, for each attributed allele substitution effect, the chance that thecorresponding allele actually ends up in a gamete of an individual. This is relevant because for both positively andnegatively contributing alleles, one would like to know the probability that they are transmitted to a gamete. For example,one could consider the following plurality of loci consisting of three loci of individual 1:Individual 1
Locus 1 1 0

EP 2 813 141 B1
12
5
10
15
20
25
30
35
40
45
50
55
(wherein 1 refers to presence of the marker allele and 0 to the absence of the marker allele)[0067] Based on a genotype/phenotype relationship model, the following allele substitution effects may have beenattributed to the alleles of the loci:
[0068] As can be seen, recombination between locus 1 and locus 2 is desired such that the first allele of Locus 1 andthe second allele of Locus 2 are transmitted to a gamete, because this leads to an increase in attributed allele substitutioneffects in the gamete. On the other hand, recombination between the second allele of Locus 2 and the first allele ofLocus 3 is not desired, because that would lead to a decrease of attributed allele substitution effects in the gamete.[0069] Based on methods well-known to the skilled person, such as methods disclosed in Liu (1998), the probabilitythat recombination occurs between two loci can be calculated based on the genetic distance between the two loci. Thiscalculation is based on the fact that the chance of recombination occurring between loci that are located proximal toeach other is lower as compared to the chance of recombination occurring between loci that are located less proximalto each other. In this example, the following estimated recombination probabilities may have been estimated:Probability of recombination occurring Probability of no recombination occurring
[0070] So, in this example, the positive allele substitution effect attributed the first allele of locus 1 now should becorrected for the probability that this allele is transmitted to a gamete, and the negative attributed allele substitution effectof the first allele of locus 2 should be corrected for the probability that the allele is not transmitted to a gamete. Finally,the positive attributed allele substitution effect of the second allele of locus 3 should be corrected for the probability thatthis allele is transmitted to a gamete:
Corrected attributed allele substitution effect
[0071] The total of corrected allele substitution effects for loci 1-3 of this individual thus is 0.1 + (-0.02) + 0.1275 = 0.2075.[0072] Then, the Combined Genome-wide Estimated Breeding Value (CGEBV) of a combination of two individuals iscalculated by taking for each locus of the plurality of loci, the highest corrected locus effect S (corrected allele substitutioneffects of the locus) of the individuals of the combination.[0073] Then, step h) identifies the at least one combination(s) of at least three individuals within the (breeding) pop-ulation that have a higher CGEBV (preferably the highest) for the at least one phenotypic trait of interest, as comparedto at least 70% of the other combinations, preferably as compared to at least 80%, 90%, 95%, 99% or most preferably100% of the other combinations of at least three individuals within the breeding population.[0074] In a preferred embodiment, the present method allows for a pre selection of individuals within the breedingpopulation. This pre selection preferably takes place after the providing of the breeding population in step e) of themethod. The pre selection allows to reduce the number of individuals to be considered for the calculating part of stepe), and thus allows to reduce the number of combinations of individuals for which the CGEBV has to be calculated. Inpractice this may be worthwhile in certain situations, particularly when the number of individuals or combinations of
(continued)
Locus 2 1 0Locus 3 0 1
Locus 1 0.1 0Locus 2 -0.2 0Locus 3 0 0.15
with the previous locus: with the previous locus:Locus 1 1 0Locus 2 0.1 0.9Locus 3 0.15 0.85
Locus 1 0.1 x 1 = 0.1Locus 2 -0.2 x 0.1 = -0.02Locus 3 0.15 x 0.85 = 0.1275
EP 2 813 141 B1
13
5
10
15
20
25
30
35
40
45
50
55
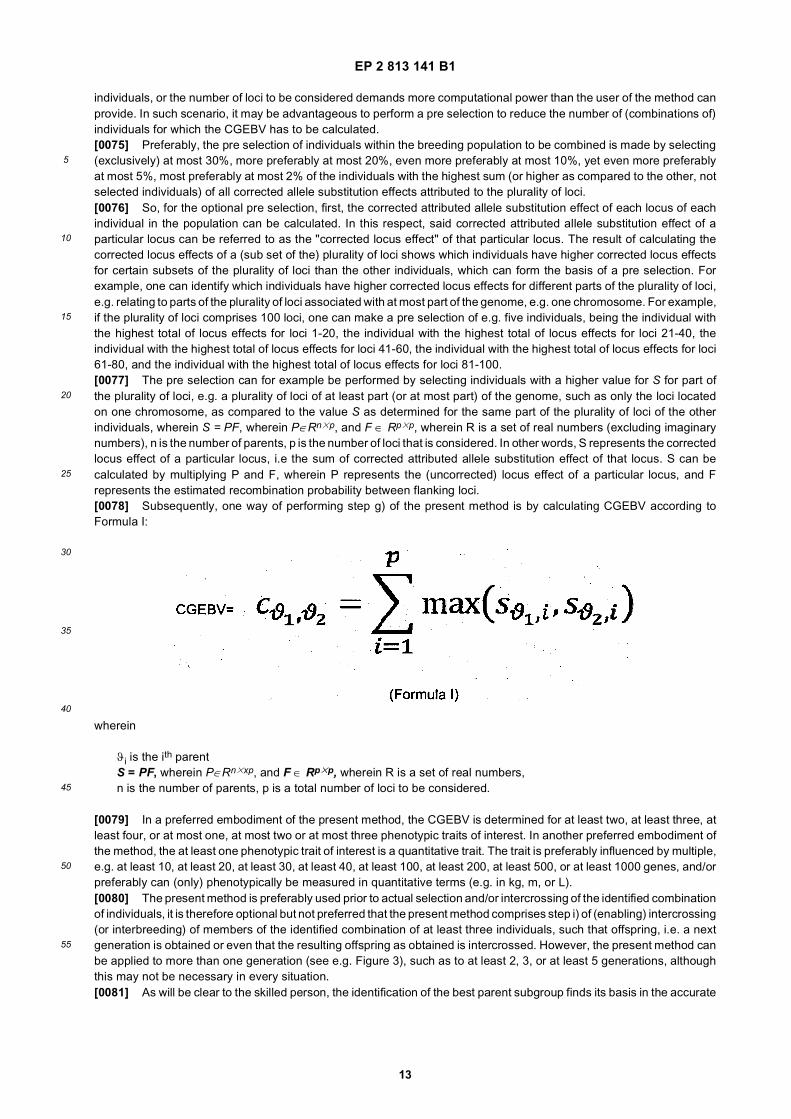
individuals, or the number of loci to be considered demands more computational power than the user of the method canprovide. In such scenario, it may be advantageous to perform a pre selection to reduce the number of (combinations of)individuals for which the CGEBV has to be calculated.[0075] Preferably, the pre selection of individuals within the breeding population to be combined is made by selecting(exclusively) at most 30%, more preferably at most 20%, even more preferably at most 10%, yet even more preferablyat most 5%, most preferably at most 2% of the individuals with the highest sum (or higher as compared to the other, notselected individuals) of all corrected allele substitution effects attributed to the plurality of loci.[0076] So, for the optional pre selection, first, the corrected attributed allele substitution effect of each locus of eachindividual in the population can be calculated. In this respect, said corrected attributed allele substitution effect of aparticular locus can be referred to as the "corrected locus effect" of that particular locus. The result of calculating thecorrected locus effects of a (sub set of the) plurality of loci shows which individuals have higher corrected locus effectsfor certain subsets of the plurality of loci than the other individuals, which can form the basis of a pre selection. Forexample, one can identify which individuals have higher corrected locus effects for different parts of the plurality of loci,e.g. relating to parts of the plurality of loci associated with at most part of the genome, e.g. one chromosome. For example,if the plurality of loci comprises 100 loci, one can make a pre selection of e.g. five individuals, being the individual withthe highest total of locus effects for loci 1-20, the individual with the highest total of locus effects for loci 21-40, theindividual with the highest total of locus effects for loci 41-60, the individual with the highest total of locus effects for loci61-80, and the individual with the highest total of locus effects for loci 81-100.[0077] The pre selection can for example be performed by selecting individuals with a higher value for S for part ofthe plurality of loci, e.g. a plurality of loci of at least part (or at most part) of the genome, such as only the loci locatedon one chromosome, as compared to the value S as determined for the same part of the plurality of loci of the otherindividuals, wherein S = PF, wherein P∈Rn3p, and F ∈ Rp3p, wherein R is a set of real numbers (excluding imaginarynumbers), n is the number of parents, p is the number of loci that is considered. In other words, S represents the correctedlocus effect of a particular locus, i.e the sum of corrected attributed allele substitution effect of that locus. S can becalculated by multiplying P and F, wherein P represents the (uncorrected) locus effect of a particular locus, and Frepresents the estimated recombination probability between flanking loci.[0078] Subsequently, one way of performing step g) of the present method is by calculating CGEBV according toFormula I:
wherein
ϑi is the ith parentS = PF, wherein P∈Rn3xp, and F ∈ Rp3p, wherein R is a set of real numbers,n is the number of parents, p is a total number of loci to be considered.
[0079] In a preferred embodiment of the present method, the CGEBV is determined for at least two, at least three, atleast four, or at most one, at most two or at most three phenotypic traits of interest. In another preferred embodiment ofthe method, the at least one phenotypic trait of interest is a quantitative trait. The trait is preferably influenced by multiple,e.g. at least 10, at least 20, at least 30, at least 40, at least 100, at least 200, at least 500, or at least 1000 genes, and/orpreferably can (only) phenotypically be measured in quantitative terms (e.g. in kg, m, or L).[0080] The present method is preferably used prior to actual selection and/or intercrossing of the identified combinationof individuals, it is therefore optional but not preferred that the present method comprises step i) of (enabling) intercrossing(or interbreeding) of members of the identified combination of at least three individuals, such that offspring, i.e. a nextgeneration is obtained or even that the resulting offspring as obtained is intercrossed. However, the present method canbe applied to more than one generation (see e.g. Figure 3), such as to at least 2, 3, or at least 5 generations, althoughthis may not be necessary in every situation.[0081] As will be clear to the skilled person, the identification of the best parent subgroup finds its basis in the accurate

EP 2 813 141 B1
14
5
10
15
20
25
30
35
40
45
50
55
estimation of allelic effects of chromosomal regions. Therefore, the accuracy of the applied genomic selection modelideally should be as high as possible. A way to enhance the level of accuracy of the model is to use state-of-the-artmodel construction methodology, to improve the quality of the phenotype data collected for the training panel, and tooptimize the ratio marker density/average window of linkage disequilibrium, as well as the ratio loci contributing to thetrait/number of observations in the training panel. Of course, factors like the genetic complexity and heritability of thetrait of interest, genetic diversity of the training panel, the level genetic relationship between the training panel and thecandidate parent panel may also influence the accuracy. A person skilled in the field of the present disclosure will haveno problem in appreciating that variations in these input factors will result in models with higher or lower accuracy andthat model accuracy can be determined through standard cross-validation procedures (Hastie, T., Tibshirani, R.,, Fried-man, J. (2001); and Arlot, Sylvain; Celisse, 2010).[0082] The breeding population of individuals used in the present method can be of different ploidy nature. For example,the population of individuals can be of a diploid, allopolyploid, or autopolyploid species. The same applies to the trainingpopulation.[0083] In the method of the present disclosure, the population of individuals preferably is a field crop, or vegetablecrop, or woody fruit species, or forestry species, or plantation crop, preferably selected from the group consisting ofArabidopsis thaliana, Abyssinian mustard, alfalfa, barley, barrel clover, black mustard, buckwheat, canola, clover, com-mon flax, common vetch, corn spurry, coffee, cotton, Egyptian clover, fodder beet, hemp, hop, Indian mustard, Jerusalemartichoke, maize, millet, mustard, lupin, oat, oilseed rape (Brassica napus), field mustard (Brassica rapa), opium poppy,Persian clover, potato, red clover, rye, safflower, sisal, soy bean, sugar beet, sunflower, tea, tobacco, triticale, wheat,white clover, white mustard, wild rice, winter vetch, artichoke, asparagus, asparagus beans, aubergine, beetroot, blackradish, black bean, black salsify, broad bean, broccoli, Brussels sprouts, cabbage, cantaloupe, carrot, cauliflower, celery,chard, chicory, chili pepper, chinese cabbage, choi sum, common bean, corn salad, courgette, cucumber, daikon, egg-plant, endive, fennel, garlic, goosefoot, green bean, Indian lettuce, kale, kidney bean, kohlrabi, leek, lettuce, lentil, limabean, maize, melon, mizuna, napa cabbage, onion, parsnip, pea, pepper, potato, pumpkin, quinoa, radicchio, radish,rapini, red cabbage, rhubarb, runner bean, rutabaga, salad rocket, Savoy cabbage, shallot, soy bean, spinach, squash,sugar cane, swede, tomatillo, tomato, turnip, watercress, watermelon, yellow turnip, almond, apple, apricot, bird cherry,butternut, cashew, cherry, chokeberry, crabapple, filbert, greengage, hawthorn, hazel, heartnut, loquat, medlar, mirabelleprune, nectarine, peach, peacherine, pear, pecan, pistacio, plum, prune, quince, rowan, walnut, acacia, alder, Alleghenychinkapin, American beech, American chestnut, American hornbeam, ash, aspen, basswood, beech, bigtoothed, aspen,birch, bitternut hickory, black alder, black birch, black cherry, black gum, black locust, black maple, black oak, blackpoplar, black walnut, black willow, butternut, cedar, chestnut, chestnut oak, Chinese chestnut, Corsican pine, cottonwood,crabapple, cucumbertree, cypress, dogwood, Douglas fir, Eastern hemlock, elm, English oak, eucalyptus, Europeanbeech, European larch, European silver fir, European white birch, fir, flowering dogwood, gum, hawthorn, hornbeam,horse chestnut, hybrid poplar, Japanese chestnut, Japanese larch, larch, lodgepole pine, maple, maritime pine, mock-ernut hickory, Norway spruce, oak, Oregon pine, Pacific silver fir, pedunculate oak, pignut hickory, pine, pitch pine,poplar, Scots pine, sweet chestnut, red alder, red cedar, red maple, red oak, red pine, red spruce, redwood, rowan,sassafrass, Scots pine, Serbian spruce, serviceberry, shagbark hickory, silver birch, Sitka spruce, southern beech,spruce, striped maple, sugar maple, sweet birch, sweet chestnut, sycamore, tamarack, tulip tree, Western hemlock,white ash, white oak, white pine, yellow birch, banana, breadfruit, coconut, date palm, jackfruit, mango, oil palm, olive,papaya, pineapple, plantain, rubber tree and sugar palm.[0084] In another preferred embodiment, the population of individuals is of a species selected from the group consistingof Cattle (Bos taurus, Bos indicus), Water buffalo (Bubalus bubalis), Equine (Equus caballus), Sheep (Ovis aries), Goat(Capra hircus), Pig (Sus scrofa), Chicken (Gallus gallus), Turkey (Maleagris gallopavo), Ducks (Anas platyrhynchos,Cairina moschata), Geese (Anser anser domesticus, Anser cygnoides), Pigeons (Columba livia domestica), Rat (Rattusnovergicus), Mouse (Mus musculus), Cat (Felis catus), Dog (Canis familiaris), Rabbit (Oryctolagus cuniculus), Guineapig (Cavia porcellus), Zebra fish (Danio rerio) and Fruit fly (Drosophila melanogaster).[0085] In yet another preferred embodiment, the population of individuals is of a fish species selected from the groupconsisting of Cyprinus carpio, Salmo salar, Oreochromis niloticus, Oncorhynchus mykiss, Ctenopharyngodon idella,Hypophthalmichthys molitrix, Gibelion catla, Cyprinus carpio, Hypophthalmichthys nobilis, Carassius carassius, Oreo-chromis niloticus, Pangasius pangasius and Labeo rohita, or wherein the method is applied to a shrimp species selectedfrom the group consisting of Macrobrachium rosenbergii, Litopenaeus vannamei and Penaeus monodon.[0086] The method of the disclosure comprises a method for identifying combinations of at least three individuals andas such the identification process itself does not require crossing and subsequently selecting of plants or animals Thepresent method for identifying typically is not an essentially biological process for the production of plants or animals,and does not necessarily require crossing and subsequent selection of plants or animals.[0087] In another aspect of the present disclosure, a computer-readable medium comprising instructions for performingthe present method is provided. In a preferred embodiment, the attributing of step b), and steps c), d), e), f), g) and h)as a whole of the present method are computer-implemented steps and/or the present method is (partly) a computer-

EP 2 813 141 B1
15
5
10
15
20
25
30
35
40
45
50
55
implemented method.[0088] The method of the present disclosure can advantageously be used particularly for improving at least one(quantitative) phenotypic trait of interest in a breeding program.[0089] Also disclosed is a product obtainable by the method according to the disclosure, preferably wherein the productis a plant.
Brief description of the figures
[0090]
Figure 1: Graphical representation of the selection process in a breeding population consisting of 3 diploid individualsrepresented by their genotypes G1-3. The individuals have been genotyped for 5 loci L1-5 and the phenotype foran individual with an particular genotype can be predicted using a mathematical genome-wide prediction model thatassigns positive of negative effects on each allele occurring on the loci. The concept underlying the current disclosureinvolves the construction of the putative future genotype that predicts the highest phenotypic performance fromhaplotypes (H1.1-H3.2) occurring in the current population, or recombinants of those. In this example, the bestobtainable genotype that can be obtained with a single cross is combining haplotypes H1.1 and H3.1 (indicatedbold), which complement each other in locus L5 versus the others. According to the present disclosure, and extrap-olating from Figure 1, it will be clear that in larger populations, the putative genotype can be constructed analogouslyfrom haplotypes of more than two individuals.
Figure 2: An example of the filtered effects of the loci of 5 parental lines. A high value means that this part of thegenome has a positive effect on the trait of interest. A combination of genotypes that yields high positive values onthe entire genome is highly beneficial.
Figure 3: Schematic representation of the crossing scheme that is used for both regGWS and dirGWS for 5 selectedparents.
Figure 4: Graphical representation of breeding potentials in a population. Current results were obtained by simulatedGS models and real Arabidopsis thaliana genotype data. Visible are the potentials over five chromosomes, withplotted as a solid thick line (fullPop): the max breeding potential over an entire population of 100 individuals; Thedotted line ("GWS") indicates the total potential of the selected 5 best parents; The dashed line ("dirGWS") plotsthe potential of the selected set of 5 best combining parents. The thin solid line at the bottom ("difference") indicatesthe superiority of the combined best parents over the best parents, mainly found on the chromosomes 3, 4 and 5in this example. Please note that this simulation result is unrelated to the result example shown in Figure 2.
Figure 5: Test results with the described method according to the present disclosure of directed genomic selection,in comparison to "regular" genomic selection (i.e. selection of parents with best per se GEBV). Simulations weredone using Arabidopsis thaliana genotype data and simulated trait effects, randomly distributed over 500-2000 loci.The horizontal axis indicates the accuracy of the genomic prediction model in each situation. The vertical axisindicates the fraction of repetitions in which the performance of final result in the final breeding cycle is better in thedirected GS method than in the normal GS procedure (0.6 means that in 60% of the cases directed genomic selectionhad a better result, and the 0.5 line indicates the regular GS performance level).
Figure 6: as figure 5, but tests performed with Maize (Zea mais) genotype data and simulated traits.
Figure 7: as Figure 5, but tests performed with Cucumber (Cucumis sativus) genotype data.
Experimental
Starting configuration
[0091] In validation simulation experiments, directed genome wide selection (dirGWS) was compared with regulargenome wide selection (regGWS). For both methods the realized progress through simulated breeding and selectionwas determined and compared. Both methods use the same starting material for the simulations. The model plantspecies used in the simulations contained 5 chromosomes with a length of 1 Morgan each. A randomly generated(parental) starting population of size N=50-1000 parents was generated. The genomic scores, i.e. the presence of specificalleles at SNP marker positions, present in the population were sampled from various plant datasets that were retrieved

EP 2 813 141 B1
16
5
10
15
20
25
30
35
40
45
50
55
from the public domain. In this way realistic values for allele frequency (proportion of all copies of a gene that is madeup of the allele) and inter-marker correlation were applied. Two-state allelic coding (-1/1) was applied to indicate theallelic status per allele at each locus (data derived from the dataset), where -1 means the absence of the marker alleleand 1 means the presence of the marker allele. Each allele was attributed an allele substitution effect, i.e. the contributionto the phenotype of interest; the size of this effect was randomly drawn from a truncated normal distribution with mean0 and standard deviation 1, for which all negative values were discarded. In this way each locus may contribute bothpositively and negatively to the trait depending on its allelic state, while the size of the contribution is determined by theeffect size. Next, a multi generation breeding effort was simulated in which selected parents were intercrossed, andselection was applied on the resulting progeny in order to advance in phenotype. In our simulations phenotype was notobserved directly but was implicitly determined through summation of allelic states multiplied with allele substitutioneffects. In order to combine, through crossing and selection, several favorable genomic regions from different sources,our simulated breeding schemes involved up to 4 cycles of crossing and selection and up to 5 different parental genotypesfrom the starting population. All crossings steps were simulated using commonly used methodology, abiding to Mendeliangenetic rules. The approach taken to select the most optimal parents for breeding from the starting population in bothmethods is elaborated in the next paragraphs.
Parental selection
[0092] regGWS: for each of the parental lines a per se performance was determined based on the accumulated effectsof each of the individual loci, by multiplying the allele substitution effect (drawn from a truncated Normal distribution)with the allelic state (-1 or 1) at each locus for all loci present in the genome. The lines with the highest predicted genomicperformance were selected and intercrossed. In simple bi-parental simulation only two parents were involved. In moreadvanced simulations several breeding cycles (generations) were simulated in which in each additional cycle an additionalparent was crossed with selected progeny (see below) obtained from the previous cycle. The order of the selectedparents for use in next cycles followed the predicted performance ranking, i.e. the third best parent entered the breedingcycle as the third parent.dirGWS: Parents were not selected based on their per-se performance but rather on the potential performance of theircombined genomes. For all combined sets (of size 3, 4 or 5) of lines taken from the parental set of lines a predictedcombined performance was estimated. The set with the highest combined performance was selected and the membersof this set were used as parents for crossing.[0093] The selection of the set with the highest combined expected performance, however, is not straightforwardbecause cross-over frequencies and allele substitution effects should be taken into account. The selection of the bestcombination of parents was done as follows: From the genetic map the cross-over frequency between two alleles canbe calculated. Because two neighboring loci are in linkage disequilibrium it is likely that by passing over one locus tothe next generation, the linked loci will also be transmitted to the next generation. Because two chromosomes, or linkageblocks, segregate independent from each other, no linkage drag occurs between two linkage blocks. In order to takelinkage drag into account a filter was designed based on Kosambi’s mapping function. Note that other mapping functionssuch as Haldane, or others (see Liu) can also be applied. The cross-over probability estimation between all locus pairsresults in a block diagonal matrix, F ∈ Rp3p with p being the number of loci. Now with the parental genotype data matrix,P∈Rn3p, with n being the number of parental lines, the corrected data matrix can be calculated by: S = PF[0094] In other words, the genome-wide estimated breeding value of a parent is calculated by the total of the valuesfor S, i.e. the corrected locus effect, of each locus. The corrected data matrix, S, then can be used as a basis for(pre)selection. In Figure 2 an example is given for five parental lines containing 250 loci located on 5 chromosomes.From this figure it can be seen that parent 4 exceeds all other parents at the first two chromosomes (up to locus 100)but is underperforming on the other chromosomes. The relative performance of an individual was calculated in this way.The combination of parent 4, 2 and parent 1 together gives the maximum S on all chromosomes and is most likely tooutperform other combinations of two or more parents.[0095] Once the corrected population matrix S is known the best combination of parental lines can be chosen. The
potential value of a parental line ϑ is taken to be Because there are only a limited number of cross-overs
per chromosome, the regions with the highest corrected allele substitution effects can be combined while the remainingpart of the genome should not have too low values since that would affect the phenotype in a negative way. The estimatedvalue of two parental lines (ϑ1 and ϑ2) to be crossed can therefore be determined by:

EP 2 813 141 B1
17
5
10
15
20
25
30
35
40
45
50
55
[0096] In other words, the combined genome-wide estimated breeding value (CGEBV) of two parents is calculatedby taking the highest corrected locus effect S of each of the loci of the combination over the total number of loci of thecombination. The subset of 2 parental lines that has the largest potential value c (=CGEBV) will be crossed. Thisprocedure is easily extended to multiple parental lines by taking the maximum over each filtered locus for multiple parentallines. Because the procedure is limited to basic, calculation extensive matrix manipulations, many subsets can be tested.
The number of subsets to be tested, however, grows with the binomial coefficient with k being the number of
parental lines to be crossed. For n=100 and k=2 this leads to 4950 combinations which can still be easily[0097] processed. With k=5, however, the number of possible subsets grows to over 75 million. By taking a smartselection of allowed parents to select from, this number can be largely reduced. In the current examples, only thoseparents are selected that exceed other parents somewhere along the chromosome, by which the number of parents isreduced to approximately 20 (depending on the original population and the effect sizes of the alleles). The number of
possible combinations is then reduced to which, again, can all be easily calculated.
Evaluation of the selected parents
[0098] Stochastic simulation was used to evaluate the performance of each of the two methods. Two parents fromthe selected set of parents were intercrossed to generate a new hybrid genotype. This hybrid product of each cross wasconsidered to be the base genotype from which, through stochastic simulation, 1000 gametes were generated. Thegenerated gametes were used as a sample of the potential genetic performance of the pair of parents. These gameteswere ordered by their performance, which was calculated by multiplying their allelic state at each locus (-1 or 1) with thelocus genomic prediction values. The 95% percentile value of the ranked performances of the 1000 gametes was takenas a measure to judge the offspring performance. In the case that more than two parents (as a result of more than onecrossing) were involved in the generation of the gamete representing the 95% performance percentile was also selectedto represent the selected cross result, and was subsequently combined in a next breeding cycle with a gamete from thethird (or 4th, 5th) selected parent. Again 1000 gametes were derived from this new cross and ordered and the 99 or 100% percentile performance value was again used to judge the performance. A schematic representation of the appliedcrossing scheme is represented in Figure 3. Figure 4 is a further graphical representation of genomewide breedingpotentials in a population. The results of Figure 4 were obtained by simulated GS models and real Arabidopsis thalianagenotype data. Visible are the potentials over five chromosomes, with plotted as a solid thick line (fullPop): the maxbreeding potential over an entire population of 100 individuals; The dotted line ("GWS") indicates the total potential ofthe selected 5 best parents; The dashed line ("dirGWS") plots the potential of the selected set of 5 best combiningparents. The thin solid line at the bottom ("difference") indicates the superiority of the combined best parents over thebest parents, mainly found on the chromosomes 3, 4 and 5 in this example. Please note that this simulation result isunrelated to the result example shown in Figure 2.
Comparison of regGWS and dirGWS
[0099] Except for the initial choice of parents, the evaluation of both methods was thus performed in an identicalfashion. In each round, the final values for the selected gametes of both methods were compared and it was recordedwhich of the methods yielded better predicted values after 2-5 cycles of breeding.[0100] The genomic selection models were constructed using Ridge Regression (Meuwissen et al., 2001). The modelsused in both regGWS and dirGWS were always pairwise identical for each test round.[0101] The entire procedure described above was repeated several hundred times to produce reliable estimates onthe method comparison.[0102] We tested this procedure for breeding schemes in which 3, 4 or 5 parents were combined. The modeled genomiceffects were drawn from a truncated normal distribution with mean 0 and standard deviation 1, for which all negativevalues were discarded. As such all loci effects have a positive value and the sign of the contribution to the trait comesfrom the allelic state (-1/1). All scenarios were tested while selecting the 95% percentile best combinations.

EP 2 813 141 B1
18
5
10
15
20
25
30
35
40
45
50
55
Results
[0103] Table 3 shows the results of the dirGWS vs regGWS comparison. When three parents or more were used thedirected GWS method outperformed the regular GWS selection in more than half of the cases and this frequencyincreased dramatically when more than three parents were involved in the breeding scheme. The increase in superioritywith increasing number of parents demonstrates that the focus on an optimal combination of complementary genomicregions, as is the main idea of the directed GWS approach, indeed yields better result that a focus on per-se performanceof the parents, as is typically done in classical GWS approaches.
Example 1: Arabidopsis thaliana
[0104] A public genotype data set of the model organism Arabidopsis thaliana (At) was retrieved, consisting of genotypedata for 250K loci of 1179 ecotypes (Horton et al., 2012). Simulated (i.e. attributed) allele substitution effects weregenomewide randomly distributed over 500-2000 loci. The At lines are divided uniformly at random in a training set of50-1000 parents, which are used to construct GS models, and a validation set (for determining the accuracy) consistingof the remaining parents. The tests were done selecting either the 99% or 100% best ranking combinations and following2-5 breeding cycles. Each parameter (i.e. number of loci, number of parents in the training set, selecting percentage,and the number of breeding cycles) combination was repeated 200 times.[0105] One of the presumptions of the dirGWS strategy is the availability of reasonably accurate GEBVs. This accuracyis dependent on GS model construction methodology and on training data set properties such as number of parents,the genetic diversity within the panel and the distribution of the allele substitution effects. Results for performance ofdirGS vs regGS were therefore ordered to accuracy of the GS model (expressed as correlation between Breeding Valuesand GEBVs).[0106] Fig 5 shows the results of the dirGWS vs regGWS comparison, wherein the training population serves asbreeding population. Directed GWS method outperformed the regular GWS selection, in particular when the GS modelsare more accurate (R>0.6). However, even with less accurate models, the dirGS strategy is providing better selectionresults, in particular when more than 2 parents are involved and the crossing scenario spans more than one generation.The increase in superiority with increasing number of parents demonstrates that the focus on an optimal combinationof complementary genomic regions, according to the present invention, indeed yields better result than a focus on per-se performance of the parents, as is typically done in classical GWS approaches.
Example 2: Maize
[0107] A similar test as was done in Arabidopsis was performed using a Maize (Zea mais) genotype data for 106 lociof 368 lines (Li et al., 2013). Traits were simulated by assigning allele substitution effects to 258-2015 loci. Training setsof 50-200 training parents were randomly selected. Further test procedures were similar as in the Arabidopsis example.[0108] Test results, wherein the training population serves as breeding population, shown in Fig 6, indicate again thatfor most parameter combinations, the selection results are better when following the dirGS strategy, in particular whenmore than 2 parents are involved. The accuracy has a less dramatic effect on the overperformance of the dirGS strategythan in the previous example.

EP 2 813 141 B1
19
5
10
15
20
25
30
35
40
45
50
55
Example 3: Cucumber
[0109] A third test was conducted using Cucumber (Cucumis sativus) genotype data for 3.7*106 loci of 115 lines (Qiet al., 2013). The set was reduced to the homozygous marker subset with no missing data (179K markers) and 86 non-identical parent lines. Trait effects were simulated on 450-1789 loci traits. GS models were constructed on trainingpopulations of 50 training parents. Further test procedures were similar as in the previous two examples.[0110] By the nature of this dataset, which contains a relative low amount of lines, it was not possible to construct veryaccurate models, so results were obtained for the accuracy range (0.55 > R < 0.67) only. Again, using the trainingpopulation as breeding population, we observed an improved performance when following the dirGS strategy for mostcases, and even within this rather narrow range, we observed a modest impact of model accuracy (more overperformanceof dirGS is found when the accuracy is higher), see Fig. 7.
List of symbols
[0111]
P matrix of parental lines, each row contains a parental line, each column represents a single locusF a block diagonal symmetric filter matrix. An entry of the ith row and the jth column represents the amount of linkage
between the ith and the jth locus.S The filtered matrix of parental lines.R Set of real numberss a vector of a single parental line containing the filtered locus values of that parental linec the potential value after crossing of two parental linesp the total number of loci involved in selectionn the total number of parental lines involved in selectionϑi ith parental linek number of parental lines to be crossed
References
[0112]
Haley C.S. and Visscher P.M. (1998) Strategies to utilize marker-quantitative trait loci association. J Dairy Sci81:85-97 85
Hoerl, A. E. (1959), Optimum Solution of Many Variables Equations. Chemical Engineering Progress 55: 69-78.
Horton M.W. et al. (2012) Genome-wide patterns of genetic variation in worldwide Arabidopsis thaliana accessionsfrom the RegMap panel. Nature Genetics 44, 212-216
Johnson GR and Yang XS (2010) Methods and compositions for breeding plants with enhanced yield. US2010/0037342
Meuwissen, T.H.E. et al. (2001) Prediction of Total Genetic Value Using Genome-Wide Dense Marker Maps. Ge-netics 157, 1819-1829.
Haldane, J. B. S. (1919)The combination of linkage values and the calculation of distances between the loci of linkedfactors. J Genet 8.29: 299-309.
Hastie, T., Tibshirani, R.,, Friedman, J. (2001). The Elements of Statistical Learning. New York, NY, USA: SpringerNew York Inc.;
Arlot, Sylvain; Celisse, Alain. A survey of cross-validation procedures for model selection. Statistics Surveys 4(2010), 40-79
Kishore, V.K. and Guo, Z. (2012) Methods for increasing genetic gain in a breeding population. WO 2012/075125
Kosambi, D. D. (1943) The estimation of map distances from recombination values. Annals of Eugenics 12.1:

EP 2 813 141 B1
20
5
10
15
20
25
30
35
40
45
50
55
172-175.
Li, H. et al. (2013) Genome-wide association study dissects the genetic architecture of oil biosynthesis in maizekernels. Nature Genetics 45: 43-50
Liu, B.H., Statistical Genomics, Linkage, Mapping and QTL analysis, CRC Press, 1998, pp.611
Peleman, J.D., and Rouppe van der Voort, J. The challenges in MarkerAssisted Breeding, CGN Eucarpia LeafyVegetables (eds. Van Hintum , Th,J.L., Lebeda, A, Pink, D, Schut, J.W.), 2003
Qi, J et al. (2013) A genomic variation map provides insights into the genetic basis of cucumber domestication anddiversity. Nature Genetics 45: 1510-1515.
Ragot, M. et al. (2008) Process for selecting individuals and designin a breeding program. EP 1962212
Claims
1. Method for identifying combinations of at least three individuals within a breeding population, wherein the combina-tions have for at least one phenotypic trait of interest a higher Combined Genome-Wide Estimated Breeding Valuein the offspring for said at least one phenotypic trait of interest, as compared to at least 70% of the other combinationsof at least three individuals within said breeding population, wherein the method comprises:
a) providing a training population of individuals;b) collecting phenotypic data for the at least one trait of interest for each individual within said training population;c) collecting genotypic data for each individual within said training population using molecular marker techniques,sequence-based genotyping or whole genome sequencing, and attributing to each allele of a plurality of loci ofeach individual, an allele substitution effect for the at least one phenotypic trait of interest;d) providing a genotype/phenotype relationship model for said training population of individuals, wherein themodel estimates for a given genotype of an individual what the quantitative contribution is of the allele substitutioneffects of said plurality of loci on the at least one phenotypic trait of interest;e) genotyping each individual within a breeding population in the same way as in step c);f) calculating for each individual within the breeding population the allele substitution effect for each allele ofsaid plurality of loci by using the genotype/phenotype relationship model of step d), and correcting for recom-bination probabilities with flanking loci, wherein for an allele with a positive allele substitution effect said effectis multiplied with the probability that said allele is transmitted to the offspring, and for an allele with a negativeallele substitution effect said effect is multiplied with the probability that said allele is not transmitted to theoffspring;g) determining the Combined Genome-Wide Estimated Breeding Value in the putative offspring for the at leastone phenotypic trait of interest for each combination of at least three individuals within the breeding populationby calculating for each combination of at least three individuals for each locus of said plurality of loci in theoffspring the highest combination of allele substitution effects using the calculated and corrected allele substi-tution effects of the individuals calculated in step f);h) identifying the combinations of at least three individuals within the breeding population that provide for saidat least one phenotypic trait of interest Combined Genome-Wide Estimated Breeding Values in the offspringthat are higher than at least 70% of the Combined Genome-Wide Estimated Breeding Values in the offspringof other combinations of at least three individuals within the breeding population,
wherein the method does not involve crossing and subsequent selection of plants or animals.
2. The method according to claim 1, wherein the combinations of at least three individuals within the breeding populationprovide for said at least one phenotypic trait of interest Combined Genome-Wide Estimated Breeding Values in theoffspring that are higher than at least 80%, more preferably al least 90%, even more preferable at least 95%, yeteven more preferably 97%, most preferably 99% of the Combined Genome-Wide Estimated Breeding Values in theoffspring of other combinations of at least three individuals within the breeding population.
3. The method according to any one of the previous claims, wherein a pre-selection of individuals of the breedingpopulation to be combined is made by selecting less than 30%, more preferably less than 20%, even more preferably

EP 2 813 141 B1
21
5
10
15
20
25
30
35
40
45
50
55
less than 10%, yet even more preferably less than 5%, most preferably less than 2% of the individuals with thehighest sum of all allele substitution effects for said plurality of loci.
4. The method according to any one of the previous claims, wherein the recombination probabilities are calculatedbased on genetic distances between loci, or based on aligning physical and genetic maps.
5. The method according to any one of the previous claims, wherein said molecular marker technique is selected fromthe group consisting of the detection of SNPs, the detection of RFLPs, the detection of SSR polymorphisms, RAPDs,the detection of indels or CNVs, and AFLP.
6. The method according to any one of the previous claims, wherein the training population is a specifically designedpopulation or wherein the training population is equal to the breeding population.
7. The method according to any one of the previous claims, wherein at least one phenotypic trait of interest is aquantitative trait.
8. The method according to any one of the previous claims, wherein the method is applied to more than one generation.
9. The method according to any one of the previous claims, wherein the method is applied to a species that is diploid.
10. The method according to any one of the previous claims, wherein the method is applied to a species that is allopol-yploid.
11. The method according to any one of the previous claims, wherein the method is applied to a species that is autopol-yploid.
12. Method according to any one of the previous claims, wherein the breeding population of individuals is a field crop,or vegetable crop, or woody fruit species, or forestry species, or plantation crop, preferably selected from the groupconsisting of Arabidopsis thaliana, Abyssinian mustard, alfalfa, barley, barrel clover, black mustard, buckwheat,canola, clover, common flax, common vetch, corn spurry, coffee, cotton, Egyptian clover, fodder beet, hemp, hop,Indian mustard, Jerusalem artichoke, maize, millet, mustard, lupin, oat, oilseed rape (Brassica napus), field mustard(Brassica rapa), opium poppy, Persian clover, potato, red clover, rye, safflower, sisal, soy bean, sugar beet, sunflower,tea, tobacco, triticale, wheat, white clover, white mustard, wild rice, winter vetch, artichoke, asparagus, asparagusbeans, aubergine, beetroot, black radish, black bean, black salsify, broad bean, broccoli, Brussels sprouts, cabbage,cantaloupe, carrot, cauliflower, celery, chard, chicory, chili pepper, chinese cabbage, choi sum, common bean, cornsalad, courgette, cucumber, daikon, eggplant, endive, fennel, garlic, goosefoot, green bean, Indian lettuce, kale,kidney bean, kohlrabi, leek, lettuce, lentil, lima bean, maize, melon, mizuna, napa cabbage, onion, parsnip, pea,pepper, potato, pumpkin, quinoa, radicchio, radish, rapini, red cabbage, rhubarb, runner bean, rutabaga, saladrocket, Savoy cabbage, shallot, soy bean, spinach, squash, sugar cane, swede, tomatillo, tomato, turnip, watercress,watermelon, yellow turnip, almond, apple, apricot, bird cherry, butternut, cashew, cherry, chokeberry, crabapple,filbert, greengage, hawthorn, hazel, heartnut, loquat, medlar, mirabelle prune, nectarine, peach, peacherine, pear,pecan, pistacio, plum, prune, quince, rowan, walnut, acacia, alder, Allegheny chinkapin, American beech, Americanchestnut, American hornbeam, ash, aspen, basswood, beech, bigtoothed, aspen, birch, bitternut hickory, blackalder, black birch, black cherry, black gum, black locust, black maple, black oak, black poplar, black walnut, blackwillow, butternut, cedar, chestnut, chestnut oak, Chinese chestnut, Corsican pine, cottonwood, crabapple, cucum-bertree, cypress, dogwood, Douglas fir, Eastern hemlock, elm, English oak, eucalyptus, European beech, Europeanlarch, European silver fir, European white birch, fir, flowering dogwood, gum, hawthorn, hornbeam, horse chestnut,hybrid poplar, Japanese chestnut, Japanese larch, larch, lodgepole pine, maple, maritime pine, mockernut hickory,Norway spruce, oak, Oregon pine, Pacific silver fir, pedunculate oak, pignut hickory, pine, pitch pine, poplar, Scotspine, sweet chestnut, red alder, red cedar, red maple, red oak, red pine, red spruce, redwood, rowan, sassafrass,Scots pine, Serbian spruce, serviceberry, shagbark hickory, silver birch, Sitka spruce, southern beech, spruce,striped maple, sugar maple, sweet birch, sweet chestnut, sycamore, tamarack, tulip tree, Western hemlock, whiteash, white oak, white pine, yellow birch, banana, breadfruit, coconut, date palm, jackfruit, mango, oil palm, olive,papaya, pineapple, plantain, rubber tree and sugar palm.
13. Method according to any one of the previous claims, wherein the breeding population of individuals is a speciesselected from the group consisting of Cattle (Bos taurus, Bos indicus), Water buffalo (Bubalus bubalis), Equine(Equus caballus), Sheep (Ovis aries), Goat (Capra hircus), Pig (Sus scrofa), Chicken (Gallus gallus), Turkey (Malea-

EP 2 813 141 B1
22
5
10
15
20
25
30
35
40
45
50
55
gris gallopavo), Ducks (Anas platyrhynchos, Cairina moschata), Geese (Anser anser domesticus, Anser cygnoides),Pigeons (Columba livia domestica), Rat (Rattus novergicus), Mouse (Mus musculus), Cat (Felis catus), Dog (Canisfamiliaris), Rabbit (Oryctolagus cuniculus), Guinea pig (Cavia porcellus), Zebra fish (Danio rerio) and Fruit fly (Dro-sophila melanogaster).
14. Method according to any one of the previous claims, wherein the breeding population of individuals is a fish speciesselected from the group consisting of Cyprinus carpio, Salmo salar, Oreochromis niloticus, Oncorhynchus mykiss,Ctenopharyngodon idella, Hypophthalmichthys molitrix, Gibelion catla, Cyprinus carpio, Hypophthalmichthys nobilis,Carassius carassius, Oreochromis niloticus, Pangasius pangasius and Labeo rohita, or wherein the breeding pop-ulation of individuals is a shrimp species selected from the group consisting of Macrobrachium rosenbergii, Litope-naeus vannamei and Penaeus monodon.
15. Computer-readable medium comprising instructions for performing the method according to any of the previousclaims.
Patentansprüche
1. Verfahren zum Identifizieren von Kombinationen von mindestens drei Individuen in einer Zuchtpopulation, wobeidie Kombinationen für mindestens ein phänotypisches Merkmal von Interesse einen höheren kombinierten genom-weit geschätzten Zuchtwert in der Nachkommenschaft für das mindestens eine phänotypische Merkmal von Inter-esse im Vergleich zu mindestens 70% der anderen Kombinationen von mindestens drei Individuen in der Zuchtpo-pulation aufweisen, wobei das Verfahren umfasst:
(a) Bereitstellen einer Lernstichprobe von Individuen;(b) Gewinnen phänotypischer Daten für das mindestens eine Merkmal von Interesse für jedes Individuum inder Lernstichprobe;(c) Gewinnen genotypischer Daten für jedes Individuum in der Lernstichprobe unter Verwendung molekularerMarkertechniken, sequenzbasiertem Genotypisieren oder Sequenzieren des gesamten Genoms, und Zuweiseneiner Allelsubstitutionswirkung für das mindestens eine phänotypische Merkmal von Interesse zu jedem Alleleiner Vielzahl von Loci jedes Individuums;(d) Bereitstellen eines Genotyp/Phänotyp-Beziehungsmodells für die Lernstichprobe von Individuen, wobei dasModell für einen vorgegebenen Genotyp eines Individuums abschätzt, was der quantititative Beitrag der Allel-substitutionswirkungen der Vielzahl von Loci auf das mindestens eine phänotypische Merkmal von Interesse ist;(e) Genotypisieren jedes Individuums in einer Zuchtpopulation auf die gleiche Weise wie in Schritt c);(f) Berechnen der Allelsubstitutionswirkung für jedes Allel der Vielzahl von Loci für jedes Individuum in derZuchtpopulation unter Verwendung des Genotyp/Phänotyp-Beziehungsmodells von Schritt d) und Korrigierenfür Rekombinationswahrscheinlichkeiten mit flankierenden Loci, wobei für ein Allel mit einer positiven Allelsub-stitutionswirkung diese Wirkung mit der Wahrscheinlichkeit multipliziert wird, dass das Allel an die Nachkom-menschaft übertragen wird, und für ein Allel mit einer negativen Allelsubstitutionswirkung diese Wirkung mitder Wahrscheinlichkeit multipliziert wird, dass das Allel nicht an die Nachkommenschaft übertragen wird;(g) Bestimmen des kombinierten genomweit geschätzten Zuchtwerts für das mindestens eine phänotypischeMerkmal von Interesse bei der mutmaßlichen Nachkommenschaft für jede Kombination von mindestens dreiIndividuen in der Zuchtpopulation durch Berechnen der höchsten Kombination von Allelsubstitutionswirkungenfür jede Kombination von mindestens drei Individuen für jeden Locus der Vielzahl von Loci bei der Nachkom-menschaft unter Verwendung der berechneten und korrigierten Allelsubstitutionswirkungen der Individuen, diein Schritt f) berechnet wurden;(h) Identifizieren der Kombinationen von mindestens drei Individuen in der Zuchtpopulation, die für das min-destens eine phänotypische Merkmal von Interesse kombinierte genomweit geschätzte Zuchtwerte bei derNachkommenschaft bereitstellen, die höher als mindestens 70% der kombinierten genomweit geschätztenZuchtwerte bei der Nachkommenschaft anderer Kombinationen von mindestens drei Individuen in der Zucht-population sind,
wobei das Verfahren Kreuzen und anschließende Selektion von Pflanzen oder Tieren nicht beinhaltet.
2. Verfahren gemäß Anspruch 1, wobei die Kombinationen von mindestens drei Individuen in der Zuchtpopulation fürdas mindestens eine phänotypische Merkmal von Interesse kombinierte genomweit geschätzte Zuchtwerte bei derNachkommenschaft bereitstellen, die höher sind als mindestens 80%, stärker bevorzugt mindestens 90%, noch

EP 2 813 141 B1
23
5
10
15
20
25
30
35
40
45
50
55
stärker bevorzugt mindestens 95%, noch stärker bevorzugt 97%, am stärksten bevorzugt 99% der kombiniertengenomweit geschätzten Zuchtwerte bei der Nachkommenschaft anderer Kombinationen von mindestens drei Indi-viduen in der Zuchtpopulation.
3. Verfahren gemäß einem der vorhergehenden Ansprüche, wobei eine Vorselektion von zu kombinierenden Individuender Zuchtpopulation durch Auswählen von weniger als 30%, stärker bevorzugt weniger als 20%, noch stärkerbevorzugt weniger als 10%, noch stärker bevorzugt weniger als 5%, am stärksten bevorzugt weniger als 2% derIndividuen mit der höchsten Summe aller Allelsubstitutionswirkungen für die Vielzahl der Loci durchgeführt wird.
4. Verfahren gemäß einem der vorhergehenden Ansprüche, wobei die Rekombinationswahrscheinlichkeiten beruhendauf genetischen Abständen zwischen Loci oder beruhend auf dem Abgleichen physikalischer und genetischer Kartenberechnet werden.
5. Verfahren gemäß einem der vorhergehenden Ansprüche, wobei die molekulare Markertechnik aus der Gruppeausgewählt ist, bestehend aus dem Nachweis von SNPs, dem Nachweis von RFLPs, dem Nachweis von SSR-Polymorphismen, RAPDs, dem Nachweis von Indels oder CNVs, und AFLP.
6. Verfahren gemäß einem der vorhergehenden Ansprüche, wobei es sich bei der Lernstichprobe um eine spezifischentwickelte Population handelt oder wobei die Lernstichprobe der Zuchtpopulation gleich ist.
7. Verfahren gemäß einem der vorhergehenden Ansprüche, wobei es sich bei mindestens einem phänotypischenMerkmal von Interesse um ein quantitatives Merkmal handelt.
8. Verfahren gemäß einem der vorhergehenden Ansprüche, wobei das Verfahren auf mehr als eine Generation an-gewandt wird.
9. Verfahren gemäß einem der vorhergehenden Ansprüche, wobei das Verfahren auf eine Art angewandt wird, diediploid ist.
10. Verfahren gemäß einem der vorhergehenden Ansprüche, wobei das Verfahren auf eine Art angewandt wird, dieallopolyploid ist.
11. Verfahren gemäß einem der vorhergehenden Ansprüche, wobei das Verfahren auf eine Art angewandt wird, dieautopolyploid ist.
12. Verfahren gemäß einem der vorhergehenden Ansprüche, wobei es sich bei der Zuchtpopulation von Individuen umeine Feldfrucht oder Gemüsepflanze oder holzige Obstart oder in der Forstwirtschaft vorkommende Art oder Plan-tagenpflanze handelt, vorzugsweise ausgewählt aus der Gruppe, bestehend aus Arabidopsis thaliana, ÄthiopischemSenf, Alfalfa, Gerste, gestutzem Schneckenklee, Schwarzem Senf, Buchweizen, Canola, Klee, Echtem Lein, Som-merwicke, Feldspark, Kaffee, Baumwolle, Ägyptischem Klee, Futterrüben, Hanf, Hopfen, Indischem Senf, Topinam-bur, Mais, Hirse, Senf, Lupine, Hafer, Raps (Brassica napus), Ackerkohl (Brassica rapa), Schlafmohn, Perserklee,Kartoffel, Rotklee, Roggen, Färberdistel, Sisal, Sojabohne, Zuckerrübe, Sonnenblume, Tee, Tabak, Triticale, Wei-zen, Weißklee, Weißem Senf, Wildreis, Winterwicke, Artischocke, Spargel, Spargelbohnen, Aubergine, Roter Bete,Schwarzrettich, Schwarzer Bohne, Schwarzwurzel, Dicker Bohne, Brokkoli, Rosenkohl, Kohl, Cantaloup-Melone,Karotte, Blumenkohl, Sellerie, Mangold, Chicoree, Chilipfeffer, Chinakohl, Choisum, Gartenbohne, Feldsalat, Zuc-chini, Gurke, Daikon, Aubergine, Endivie, Fenchel, Knoblauch, Gänsefuß, Brechbohne, Winterportulak, Grünkohl,Kidneybohne, Kohlrabi, Lauch, Salat, Linse, Limabohne, Mais, Melone, Mizuna, Chinakohl, Zwiebel, Pastinake,Erbse, Pfeffer, Kartoffel, Kürbis, Quinoa, Radicchio, Rettich, Rübstiel, Rotkohl, Rhabarber, Stangenbohne, Steck-rübe, Rucola, Wirsing, Schalotte, Sojabohne, Spinat, Speisekürbis, Zuckerrohr, Kohlrübe, Tomatillo, Tomate, Rübe,Brunnenkresse, Wassermelone, Schmalzrübe, Mandel, Apfel, Aprikose, Traubenkirsche, Graunuss, Cashew, Kir-sche, Apfelbeere, Holzapfel, Lambertshasel, Reineclaude, Weißdorn, Haselnuss, Japanischer Walnuss, Japani-scher Mispel, Mispel, Mirabelle, Nektarine, Pfirsich, Peacherine, Birne, Pekannuss, Pistazie, Zwetschge, Pflaume,Quitte, Vogelbeere, Walnuss, Akazie, Erle, Pennsylvanischer Kastanie, Amerikanischer Buche, AmerikanischerKastanie, Amerikanischer Hainbuche, Esche, Espe, Linde, Buche, Großzähniger Pappel, Espe, Birke, Bitternuss,Schwarzerle, Schwarzbirke, Schwarzkirsche, Tupelobaum, Robinie, Schwarzem Zuckerahorn, Schwarzeiche,Schwarzpappel, Schwarznuss, Schwarzer Weide, Graunuss, Zeder, Kastanie, Kastanieneiche, Chinesischer Kas-tanie, Korsischer Kiefer, Amerikanischer Schwarzpappel, Holzapfel, Gurkenbaum, Zypresse, Hartriegel, Douglasie,Östlicher Hemlocktanne, Ulme, Stieleiche, Eukalyptus, Europäischer Buche, Europäischer Lärche, Weißtanne, Hän-
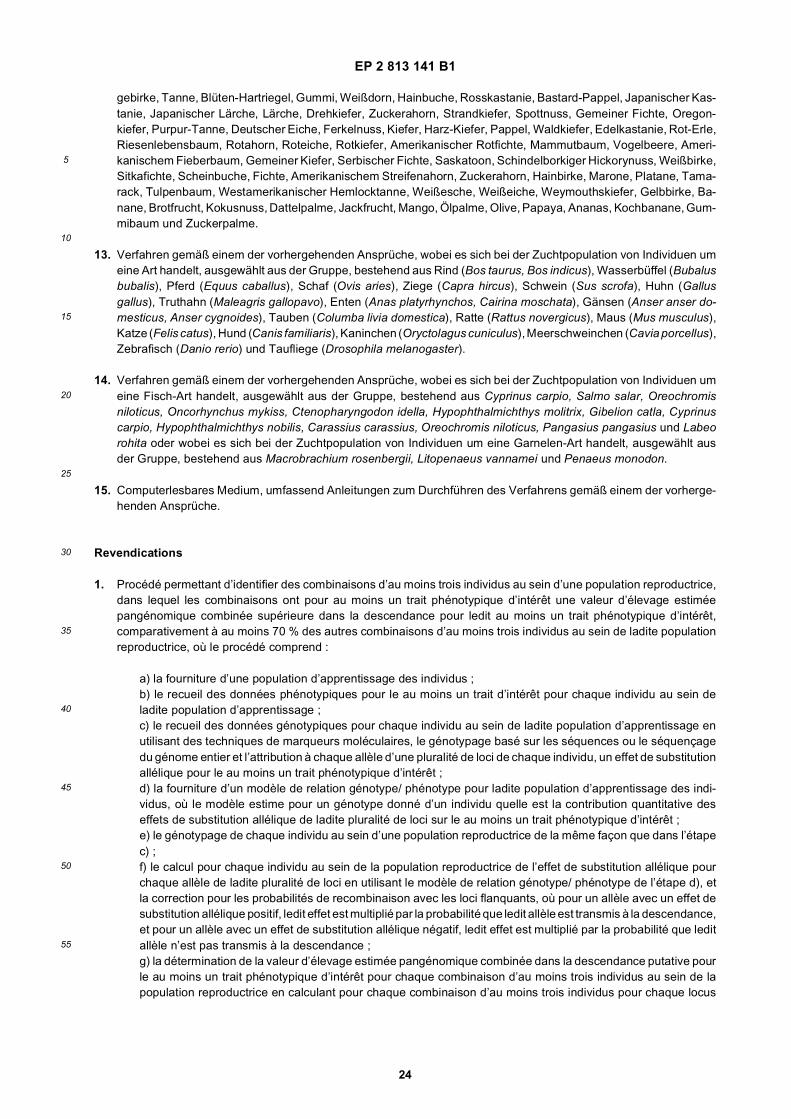
EP 2 813 141 B1
24
5
10
15
20
25
30
35
40
45
50
55
gebirke, Tanne, Blüten-Hartriegel, Gummi, Weißdorn, Hainbuche, Rosskastanie, Bastard-Pappel, Japanischer Kas-tanie, Japanischer Lärche, Lärche, Drehkiefer, Zuckerahorn, Strandkiefer, Spottnuss, Gemeiner Fichte, Oregon-kiefer, Purpur-Tanne, Deutscher Eiche, Ferkelnuss, Kiefer, Harz-Kiefer, Pappel, Waldkiefer, Edelkastanie, Rot-Erle,Riesenlebensbaum, Rotahorn, Roteiche, Rotkiefer, Amerikanischer Rotfichte, Mammutbaum, Vogelbeere, Ameri-kanischem Fieberbaum, Gemeiner Kiefer, Serbischer Fichte, Saskatoon, Schindelborkiger Hickorynuss, Weißbirke,Sitkafichte, Scheinbuche, Fichte, Amerikanischem Streifenahorn, Zuckerahorn, Hainbirke, Marone, Platane, Tama-rack, Tulpenbaum, Westamerikanischer Hemlocktanne, Weißesche, Weißeiche, Weymouthskiefer, Gelbbirke, Ba-nane, Brotfrucht, Kokusnuss, Dattelpalme, Jackfrucht, Mango, Ölpalme, Olive, Papaya, Ananas, Kochbanane, Gum-mibaum und Zuckerpalme.
13. Verfahren gemäß einem der vorhergehenden Ansprüche, wobei es sich bei der Zuchtpopulation von Individuen umeine Art handelt, ausgewählt aus der Gruppe, bestehend aus Rind (Bos taurus, Bos indicus), Wasserbüffel (Bubalusbubalis), Pferd (Equus caballus), Schaf (Ovis aries), Ziege (Capra hircus), Schwein (Sus scrofa), Huhn (Gallusgallus), Truthahn (Maleagris gallopavo), Enten (Anas platyrhynchos, Cairina moschata), Gänsen (Anser anser do-mesticus, Anser cygnoides), Tauben (Columba livia domestica), Ratte (Rattus novergicus), Maus (Mus musculus),Katze (Felis catus), Hund (Canis familiaris), Kaninchen (Oryctolagus cuniculus), Meerschweinchen (Cavia porcellus),Zebrafisch (Danio rerio) und Taufliege (Drosophila melanogaster).
14. Verfahren gemäß einem der vorhergehenden Ansprüche, wobei es sich bei der Zuchtpopulation von Individuen umeine Fisch-Art handelt, ausgewählt aus der Gruppe, bestehend aus Cyprinus carpio, Salmo salar, Oreochromisniloticus, Oncorhynchus mykiss, Ctenopharyngodon idella, Hypophthalmichthys molitrix, Gibelion catla, Cyprinuscarpio, Hypophthalmichthys nobilis, Carassius carassius, Oreochromis niloticus, Pangasius pangasius und Labeorohita oder wobei es sich bei der Zuchtpopulation von Individuen um eine Garnelen-Art handelt, ausgewählt ausder Gruppe, bestehend aus Macrobrachium rosenbergii, Litopenaeus vannamei und Penaeus monodon.
15. Computerlesbares Medium, umfassend Anleitungen zum Durchführen des Verfahrens gemäß einem der vorherge-henden Ansprüche.
Revendications
1. Procédé permettant d’identifier des combinaisons d’au moins trois individus au sein d’une population reproductrice,dans lequel les combinaisons ont pour au moins un trait phénotypique d’intérêt une valeur d’élevage estiméepangénomique combinée supérieure dans la descendance pour ledit au moins un trait phénotypique d’intérêt,comparativement à au moins 70 % des autres combinaisons d’au moins trois individus au sein de ladite populationreproductrice, où le procédé comprend :
a) la fourniture d’une population d’apprentissage des individus ;b) le recueil des données phénotypiques pour le au moins un trait d’intérêt pour chaque individu au sein deladite population d’apprentissage ;c) le recueil des données génotypiques pour chaque individu au sein de ladite population d’apprentissage enutilisant des techniques de marqueurs moléculaires, le génotypage basé sur les séquences ou le séquençagedu génome entier et l’attribution à chaque allèle d’une pluralité de loci de chaque individu, un effet de substitutionallélique pour le au moins un trait phénotypique d’intérêt ;d) la fourniture d’un modèle de relation génotype/ phénotype pour ladite population d’apprentissage des indi-vidus, où le modèle estime pour un génotype donné d’un individu quelle est la contribution quantitative deseffets de substitution allélique de ladite pluralité de loci sur le au moins un trait phénotypique d’intérêt ;e) le génotypage de chaque individu au sein d’une population reproductrice de la même façon que dans l’étapec) ;f) le calcul pour chaque individu au sein de la population reproductrice de l’effet de substitution allélique pourchaque allèle de ladite pluralité de loci en utilisant le modèle de relation génotype/ phénotype de l’étape d), etla correction pour les probabilités de recombinaison avec les loci flanquants, où pour un allèle avec un effet desubstitution allélique positif, ledit effet est multiplié par la probabilité que ledit allèle est transmis à la descendance,et pour un allèle avec un effet de substitution allélique négatif, ledit effet est multiplié par la probabilité que leditallèle n’est pas transmis à la descendance ;g) la détermination de la valeur d’élevage estimée pangénomique combinée dans la descendance putative pourle au moins un trait phénotypique d’intérêt pour chaque combinaison d’au moins trois individus au sein de lapopulation reproductrice en calculant pour chaque combinaison d’au moins trois individus pour chaque locus

EP 2 813 141 B1
25
5
10
15
20
25
30
35
40
45
50
55
de ladite pluralité de loci dans la descendance de la combinaison la plus élevée des effets de substitutionallélique en utilisant les effets de substitution allélique calculés et corrigés des individus calculés dans l’étape f) ;h) l’identification des combinaisons d’au moins trois individus au sein de la population reproductrice qui four-nissent pour ledit au moins un trait phénotypique d’intérêt les valeurs d’élevage estimées pangénomiquescombinées dans la descendance qui sont supérieures à au moins 70 % des valeurs d’élevage estimées pan-génomiques combinées dans la descendance d’autres combinaisons d’au moins trois individus au sein de lapopulation reproductrice,
où le procédé n’implique pas de croisement et de sélection subséquente des plantes ou des animaux.
2. Procédé selon la revendication 1, dans lequel les combinaisons d’au moins trois individus au sein de la populationreproductrice fournissent pour au moins un trait phénotypique d’intérêt des valeurs d’élevage estimées pangéno-miques combinées dans la descendance qui sont supérieures à au moins 80 %, de manière davantage préféréeau moins 90 %, de manière même davantage préférée au moins 95 %, de manière même encore davantage préférée97 %, de manière préférée entre toutes 99 % des valeurs d’élevage estimées pangénomiques combinées dans ladescendance d’autres combinaisons d’au moins trois individus au sein de la population reproductrice.
3. Procédé selon l’une quelconque des revendications précédentes, dans lequel une présélection d’individus de lapopulation reproductrice à combiner est réalisée en sélectionnant moins de 30 %, de manière davantage préféréemoins de 20 %, de manière même davantage préférée moins de 10 %, de manière même encore davantage préféréemoins de 5 %, de manière préférée entre toutes moins de 2 % des individus avec la somme la plus élevée de tousles effets de substitution allélique pour ladite pluralité de loci.
4. Procédé selon l’une quelconque des revendications précédentes, dans lequel les probabilités de recombinaisonsont calculées en se basant sur les distances génétiques entre les loci, ou en se basant sur l’alignement de cartesphysiques et génétiques.
5. Procédé selon l’une quelconque des revendications précédentes, dans lequel ladite technique des marqueursmoléculaires est choisie dans le groupe constitué de la détection de SNP, la détection de RFLP, la détection depolymorphismes de SSR, la RAPD, la détection d’indels ou de CNV, et l’AFLP.
6. Procédé selon l’une quelconque des revendications précédentes, dans lequel la population d’apprentissage estune population conçue spécifiquement ou dans lequel la population d’apprentissage est égale à la populationreproductrice.
7. Procédé selon l’une quelconque des revendications précédentes, dans lequel au moins un trait phénotypique d’intérêtest un trait quantitatif.
8. Procédé selon l’une quelconque des revendications précédentes, où le procédé est appliqué à plus d’une génération.
9. Procédé selon l’une quelconque des revendications précédentes, où le procédé est appliqué à une espèce qui estdiploïde.
10. Procédé selon l’une quelconque des revendications précédentes, où le procédé est appliqué à une espèce qui estallopolyploïde.
11. Procédé selon l’une quelconque des revendications précédentes, où le procédé est appliqué à une espèce qui estautopolyploïde.
12. Procédé selon l’une quelconque des revendications précédentes, dans lequel la population reproductrice des indi-vidus est une récolte de champ, ou une récolte de légumes, ou des espèces de fruits ligneux, ou des espècesforestières, ou une récolte de plantation, de préférence choisie dans le groupe constitué d’Arabidopsis thaliana, lamoutarde d’Abyssinie, la luzerne, l’orge, la luzerne tronquée, la moutarde noire, le sarrasin, le canola, le trèfle, lelin commun, la vesce commune, la spargoute des champs, le café, le coton, le trèfle d’Alexandrie, la betteravefourragère, le chanvre, le houblon, la moutarde indienne, le topinambour, le maïs, le millet, la moutarde, le lupin,l’avoine, le colza (Brassica napus), le navet potager (Brassica rapa), le pavot, le trèfle de Perse, la pomme de terre,le trèfle rouge, le seigle, le carthame, le sisal, le soja, la betterave à sucre, le tournesol, le thé, le tabac, le triticale,le blé, le trèfle blanc, la moutarde blanche, le riz sauvage, la vesce d’hiver, l’artichaut, l’asperge, la dolique asperge,

EP 2 813 141 B1
26
5
10
15
20
25
30
35
40
45
50
55
l’aubergine, la betterave, le radis noir, le haricot noir, le salsifis noir, la fève, le brocoli, le choux de Bruxelles, lechou, le cantaloup, la carotte, le chou-fleur, le céleri, la bette à carde, la chicorée, le piment, le chou chinois, le choysum, le haricot commun, le maïs salade, la courgette, le concombre, le radis blanc, l’aubergine, l’endive, le fenouil,l’ail, le chénopode, le haricot vert, le pourpier d’hiver, le chou frisé, le haricot, le chou-rave, le poireau, la laitue, lalentille, le haricot de Lima, le maïs, le melon, le mizuna, le chou nappa, l’oignon, le panais, le pois, le poivron, lapomme de terre, le potiron, le quinoa, le radicchio, radis, le rapini, le chou rouge, la rhubarbe, le haricot à rames,le rutabaga, la salade roquette, le chou d’ornement, l’échalote, le soja, l’épinard, le squash, la canne à sucre, lerutabaga, la tomatille, la tomate, le navet, le cresson, la pastèque, le navet jaune, l’amande, la pomme, l’abricot, lamerise, la courge butternut, la noix de cajou, la cerise, l’aronie, la pomme sauvage, l’aveline, la reine-claude,l’aubépine, la noisette, le noyer du Japon, le néflier du Japon, le néflier, la prune mirabelle, la nectarine, la pêche,la nectarine, la poire, la noix de pécan, la pistache, la prune, le pruneau, le coing, le sorbier, le noyer, l’acacia,l’aulne, le châtaignier de Virginie, le hêtre à grandes feuilles, le châtaignier d’Amérique, le charme de Caroline, lefrêne, le tremble, le tilleul, le hêtre, le peuplier à grandes dents, le bouleau, le caryer amer, l’aulne noir, le bouleauflexible, le cerisier tardif, le tupélo des bois, le robinier, l’érable noir, le chêne noir, le peuplier noir, le noyer noir, lesaule noir, le noyer cendré, le cèdre, le châtaignier, le chêne-châtaignier, le châtaignier chinois, le pin laricio, lepeuplier, le pommetier, le magnolia à fleurs jaunes, le cyprès, le cornouiller, le sapin de Douglas, la pruche duCanada, l’orme, le chêne pédonculé, l’eucalyptus, le hêtre commun, le mélèze commun, le sapin blanc, le bouleauverruqueux, le sapin, le cornouiller de Floride, le gommier, l’aubépine, le charme, le marronnier d’Inde, le peuplierhybride, le châtaignier du Japon, le mélèze du Japon, le mélèze, le pin tordu, l’érable, le pin maritime, le caryertomenteux, le sapin de Norvège, le chêne, le pin d’Oregon, le sapin gracieux, le chêne pédonculé, le caryer glabre,le pin, le pin rigide, le peuplier, le pin sylvestre, le châtaignier commun, l’aulne rouge, le cèdre rouge, l’érable rouge,le chêne rouge, le pin rouge, l’épinette rouge, le séquoia, le sorbier, le sassafras, le pin sylvestre, l’épinette deSerbie, l’amélanchier, le caryer ovale, le bouleau blanc, l’épinette de Sitka, les hêtres de l’hémisphère Sud, l’épinette,l’érable de Pennsylvanie, l’érable à sucre, le bouleau flexible, le châtaignier commun, le sycomore, le mélèze laricin,le tulipier de Virginie, la pruche de l’Ouest, le frêne blanc, le chêne blanc, le pin blanc, le bouleau jaune, le bananier,l’arbre à pain, le cocotier, le palmier dattier, le jacquier, le manguier, le palmier à huile, l’olivier, le papayer, l’ananas,le bananier plantain, l’hévéa et le palmier à sucre.
13. Procédé selon l’une quelconque des revendications précédentes, dans lequel la population reproductrice des indi-vidus est une espèce choisie dans le groupe constitué de bovins (Bos taurus, Bos indicus), buffles (Bubalus bubalis),chevaux (Equus caballus), moutons (Ovis aries), chèvres (Capra hircus), porcs (Sus scrofa), poulets (Gallus gallus),dindes (Maleagris gallopavo), canards (Anas platyrhynchos, Cairina moschata), oies (Anser anser domesticus,Anser cygnoides), pigeons (Columba livia domestica), rats (Rattus novergicus), souris (Mus musculus), chats (Feliscatus), chiens (Canis familiaris), lapins (Oryctolagus cuniculus), cobayes (Cavia porcellus), poisson zèbre (Daniorerio) et mouche des fruits (Drosophila melanogaster).
14. Procédé selon l’une quelconque des revendications précédentes, dans laquelle la population reproductrice desindividus est une espèce de poisson choisie dans le groupe constitué de Cyprinus carpio, Salmo salar, Oreochromisniloticus, Oncorhynchus mykiss, Ctenopharyngodon idella, Hypophthalmichthys molitrix, Gibelion catla, Cyprinuscarpio, Hypophthalmichthys nobilis, Carassius carassius, Oreochromis niloticus, Pangasius pangasius et Labeorohita, ou dans lequel la population reproductrice des individus est une espèce de crevette choisie dans le groupeconstitué par Macrobrachium rosenbergii, Litopenaeus vannamei et Penaeus monodon.
15. Support lisible par ordinateur comprenant des instructions pour réaliser le procédé selon l’une quelconque desrevendications précédentes.

EP 2 813 141 B1
27

EP 2 813 141 B1
28
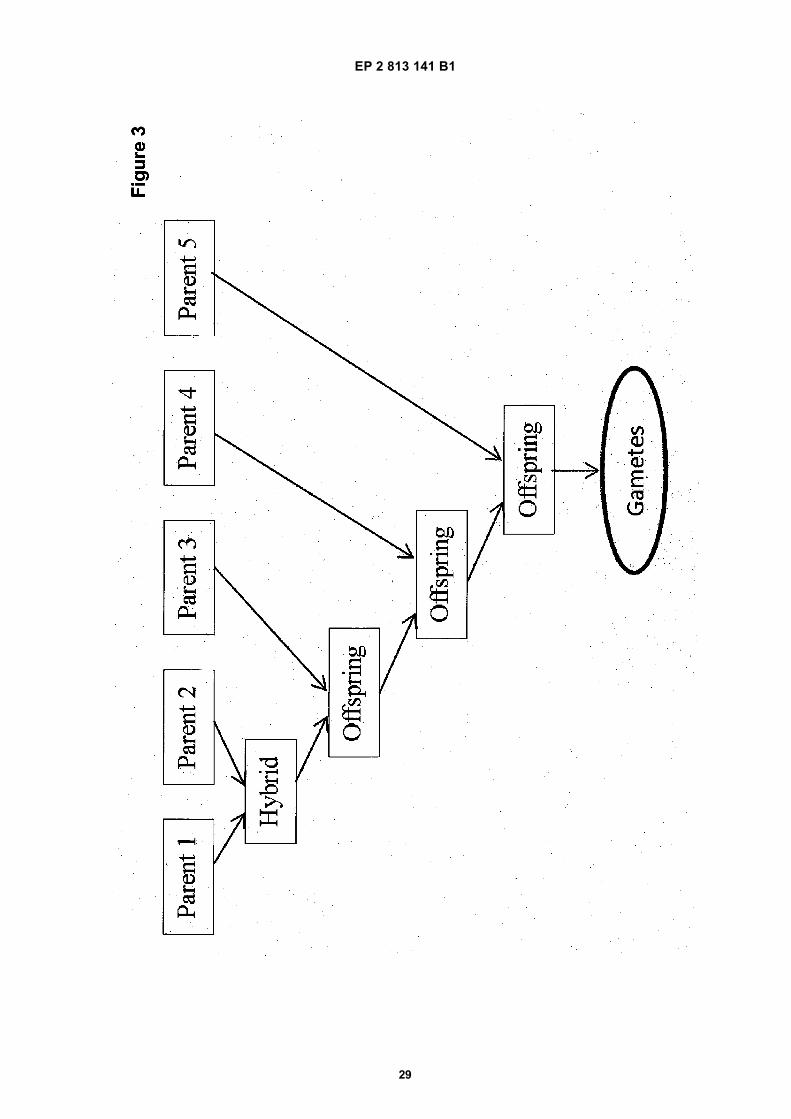
EP 2 813 141 B1
29
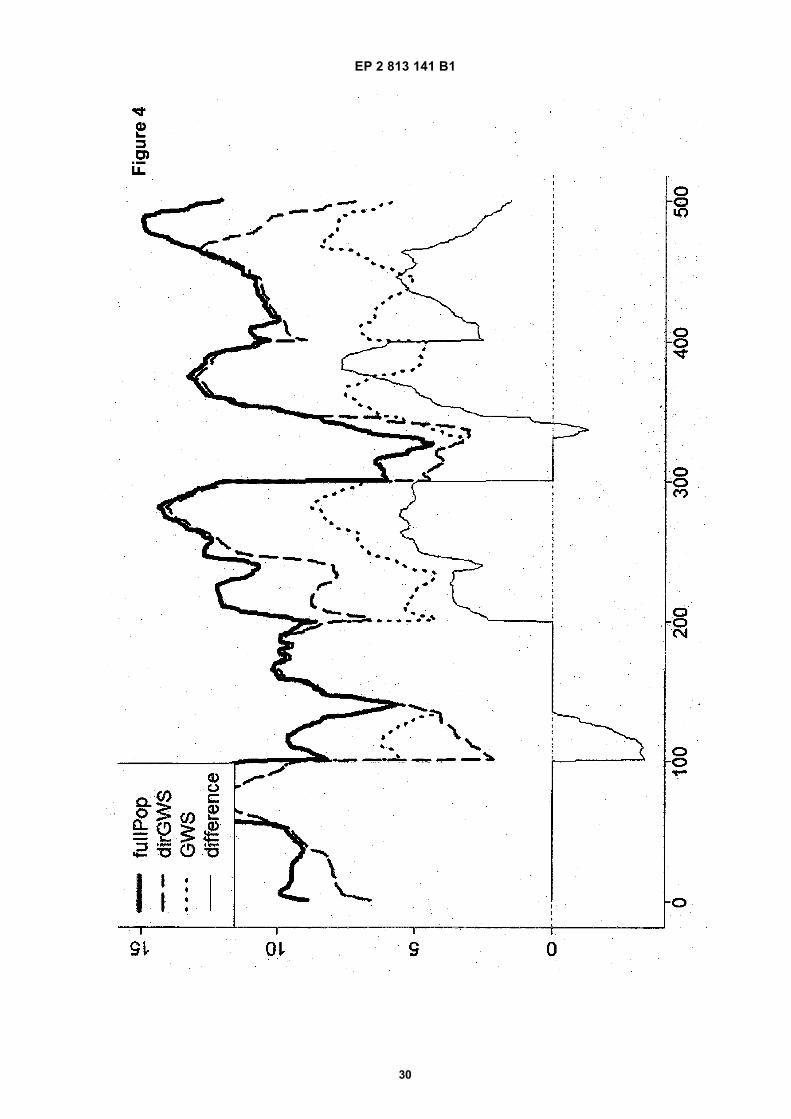
EP 2 813 141 B1
30

EP 2 813 141 B1
31

EP 2 813 141 B1
32
EP 2 813 141 B1
33

EP 2 813 141 B1
34
REFERENCES CITED IN THE DESCRIPTION
This list of references cited by the applicant is for the reader’s convenience only. It does not form part of the Europeanpatent document. Even though great care has been taken in compiling the references, errors or omissions cannot beexcluded and the EPO disclaims all liability in this regard.
Patent documents cited in the description
• EP 1962212 A [0011] [0112]• US 20100037342 A [0011] [0112]
• WO 2012075125 A [0012] [0112]
Non-patent literature cited in the description
• SAMBROOK ; RUSSELL. Molecular Cloning: A Lab-oratory Manual. Cold Spring Harbor LaboratoryPress, 2001 [0053]
• AUSUBEL et al. Current Protocols in Molecular Bi-ology, Current Protocols, USA. vol. 1, 2 [0053]
• R.D.D. CROY. Plant Molecular Biology Labfax. BIOSScientific Publications Ltd, 1993 [0053]
• HALEY C.S. ; VISSCHER P.M. Strategies to utilizemarker-quantitative trait loci association. J Dairy Sci,1998, vol. 81, 85-97 85 [0112]
• HOERL, A. E. Optimum Solution of Many VariablesEquations. Chemical Engineering Progress, 1959,vol. 55, 69-78 [0112]
• HORTON M.W. et al. Genome-wide patterns of ge-netic variation in worldwide Arabidopsis thaliana ac-cessions from the RegMap panel. Nature Genetics,2012, vol. 44, 212-216 [0112]
• MEUWISSEN, T.H.E. et al. Prediction of Total Ge-netic Value Using Genome-Wide Dense MarkerMaps. Genetics, 2001, vol. 157, 1819-1829 [0112]
• HALDANE, J. B. S. The combination of linkage val-ues and the calculation of distances between the lociof linked factors. J Genet, 1919, vol. 8.29, 299-309[0112]
• HASTIE, T. ; TIBSHIRANI, R. ; FRIEDMAN, J. TheElements of Statistical Learning. Springer New YorkInc, 2001 [0112]
• ARLOT, SYLVAIN ; CELISSE, ALAIN. A survey ofcross-validation procedures for model selection. Sta-tistics Surveys, 2010, vol. 4, 40-79 [0112]
• KOSAMBI, D. D. The estimation of map distancesfrom recombination values. Annals of Eugenics,1943, vol. 12.1, 172-175 [0112]
• LI, H. et al. Genome-wide association study dissectsthe genetic architecture of oil biosynthesis in maizekernels. Nature Genetics, 2013, vol. 45, 43-50 [0112]
• LIU, B.H. Statistical Genomics, Linkage, Mappingand QTL analysis. CRC Press, 1998, 611 [0112]
• The challenges in MarkerAssisted Breeding. PELE-MAN, J.D. ; ROUPPE VAN DER VOORT, J. CGNEucarpia Leafy Vegetables. 2003 [0112]
• QI, J et al. A genomic variation map provides insightsinto the genetic basis of cucumber domestication anddiversity. Nature Genetics, 2013, vol. 45, 1510-1515[0112]


![(19) TZZ Z T - patentimages.storage.googleapis.com · between the cap 52 and a shoulder 56a of piston carrier 56. [0022] A piston or plunger 60 is affixed to extension rod 56b, e.g.](https://static.fdocuments.us/doc/165x107/5c27af8a09d3f240638b68a2/19-tzz-z-t-between-the-cap-52-and-a-shoulder-56a-of-piston-carrier-56-0022.jpg)
![(19) TZZ¥Z T - patentimages.storage.googleapis.com · [0017] The dosage regimen of the present invention is a regimen for a S1P receptor modulator or agonist therapy, ... or disease,](https://static.fdocuments.us/doc/165x107/5adca6477f8b9aa5088bc2ff/19-tzzz-t-0017-the-dosage-regimen-of-the-present-invention-is-a-regimen-for.jpg)


![(19) TZZ¥ ¥ T - patentimages.storage.googleapis.com · EP3 238 724A2 2 5 10 15 20 25 30 35 40 45 50 55 Description PRIORITY [0001] This application claims priority to U.S. Provisional](https://static.fdocuments.us/doc/165x107/5b83d1dd7f8b9a31608e23a0/19-tzz-t-ep3-238-724a2-2-5-10-15-20-25-30-35-40-45-50-55-description.jpg)


![(19) TZZ ¥ T - patentimages.storage.googleapis.com · [0016] Inthe preferred embodimentsth e above- descrbed i methodsacc ordnigto th epr esentni venton i furtherc omprse:i reporting](https://static.fdocuments.us/doc/165x107/5c41ea6493f3c338dc2648aa/19-tzz-t-0016-inthe-preferred-embodimentsth-e-above-descrbed-i-methodsacc.jpg)
![(19) TZZ T - patentimages.storage.googleapis.com · [0003] World Patent Publication WO 2001/010825 discloses certain carbamate derivatives of Formula i as fungicides. wherein, inter](https://static.fdocuments.us/doc/165x107/5b1eed1c7f8b9a8a3a8c2d5c/19-tzz-t-0003-world-patent-publication-wo-2001010825-discloses-certain.jpg)
![(19) TZZ ¥ T - patentimages.storage.googleapis.com · 2,176,476, US Patent 4,992,474 and Tetrahedron Letters, vol. 35(50), pages 9375-9378, 1994. [0010] The present invention discloses](https://static.fdocuments.us/doc/165x107/5c25e6c309d3f2ae178c11cf/19-tzz-t-2176476-us-patent-4992474-and-tetrahedron-letters-vol.jpg)
