19 things we learned from the 2016 election€¦ · 19 things we learned from the 2016 election...
17
19 things we learned from the 2016 election * Andrew Gelman † Julia Azari ‡ 17 Apr 2017 We can all agree that the presidential election result was a shocker. According to news reports, even the Trump campaign team was stunned to come up a winner. So now seems like a good time to go over various theories floating around in political science and political reporting and see where they stand, now that this turbulent political year has drawn to a close. In the present article, we go through several things that we as political observers and political scientists have learned from the election, and then discuss implications for the future. The shock Immediately following the election there was much talk about the failure of the polls: Hillary Clinton was seen as the clear favorite for several months straight, and then she lost. After all the votes were counted, though, the view is slightly different: by election eve, the national polls were giving Clinton 52 or 53% of the two-party vote, and she ended up receiving 51%. An error of 2 percentage points is no great embarrassment. The errors in the polls were, however, not uniform. As Figure 1 shows, the Republican candidate outperformed by about 5% in highly Republican states, 2% in swing states, and not at all, on average, in highly Democratic states. This was unexpected in part because, in other recent elections, the errors in poll-based forecasts did not have this sort of structure. In 2016, though, Donald Trump won from his better-than-expected performance in Wisconsin, Michigan, North Carolina, Pennsylvania, and several other swing states. Trump’s win in the general election, and the corresponding success of Republican candidates for the U.S. Senate, then raises two questions: (1) What did the polls get wrong in these key states?, (2) How did Trump and his fellow Republicans do so well? The first is a question about survey respondents, the second a question about voters. Going backward in time from the election-day shocker, there is the question of how Trump, as a widely unpopular candidate without the full backing of his party, managed to stay so close during the general election campaign. Given the weaknesses of the Trump candidacy as traditionally measured, it was a surprise to many that he was polling at 48% of the two-party vote rather than, say, 40%. And, even before that, the surprise was that Trump won the nomination against so many in the Republican party. In sum, nearly every step of the 2016 election campaign was some sort of a surprise to pundits, political scientists, and political professionals. So this seems like a good opportunity to learn. Nominations and campaigning 1. The party doesn’t decide. We can start with the primaries, which destroyed the Party Decides theory of Marty Cohen, David Karol, Hans Noel, and John Zaller (2008), who wrote that “unelected insiders in both major parties * This article is an expansion of Gelman (2016e) and Azari (2016b). We thank Bob Erikson, Yair Ghitza, Deborah Chasman, David Banks, and several blog commenters for helpful discussion. † Department of Statistics and Department of Political Science, Columbia University. ‡ Department of Political Science, Marquette University.
Transcript of 19 things we learned from the 2016 election€¦ · 19 things we learned from the 2016 election...

19 things we learned from the 2016 election∗
Andrew Gelman† Julia Azari‡
17 Apr 2017
We can all agree that the presidential election result was a shocker. According to news reports,
even the Trump campaign team was stunned to come up a winner.
So now seems like a good time to go over various theories floating around in political science
and political reporting and see where they stand, now that this turbulent political year has drawn
to a close. In the present article, we go through several things that we as political observers and
political scientists have learned from the election, and then discuss implications for the future.
The shock
Immediately following the election there was much talk about the failure of the polls: Hillary
Clinton was seen as the clear favorite for several months straight, and then she lost. After all the
votes were counted, though, the view is slightly different: by election eve, the national polls were
giving Clinton 52 or 53% of the two-party vote, and she ended up receiving 51%. An error of 2
percentage points is no great embarrassment.
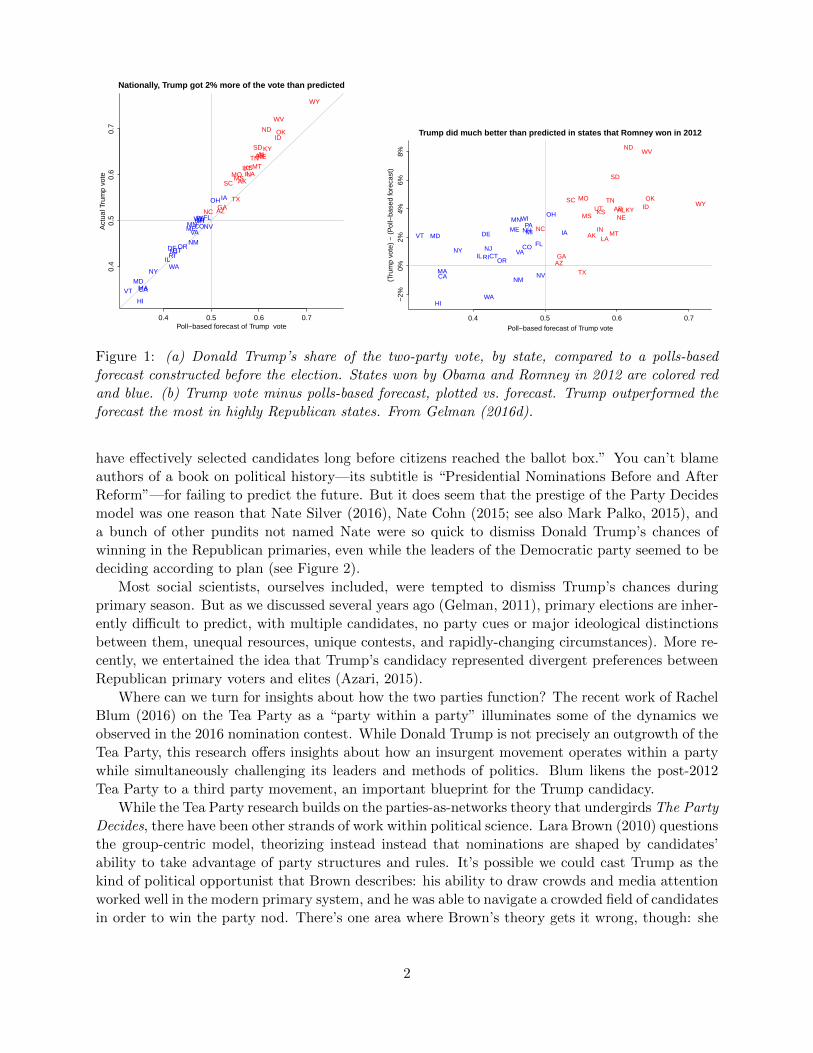
The errors in the polls were, however, not uniform. As Figure 1 shows, the Republican candidate
outperformed by about 5% in highly Republican states, 2% in swing states, and not at all, on
average, in highly Democratic states. This was unexpected in part because, in other recent elections,
the errors in poll-based forecasts did not have this sort of structure. In 2016, though, Donald
Trump won from his better-than-expected performance in Wisconsin, Michigan, North Carolina,
Pennsylvania, and several other swing states.
Trump’s win in the general election, and the corresponding success of Republican candidates for
the U.S. Senate, then raises two questions: (1) What did the polls get wrong in these key states?,
(2) How did Trump and his fellow Republicans do so well? The first is a question about survey
respondents, the second a question about voters.
Going backward in time from the election-day shocker, there is the question of how Trump, as a
widely unpopular candidate without the full backing of his party, managed to stay so close during
the general election campaign. Given the weaknesses of the Trump candidacy as traditionally
measured, it was a surprise to many that he was polling at 48% of the two-party vote rather than,
say, 40%. And, even before that, the surprise was that Trump won the nomination against so many
in the Republican party.
In sum, nearly every step of the 2016 election campaign was some sort of a surprise to pundits,
political scientists, and political professionals. So this seems like a good opportunity to learn.
Nominations and campaigning
1. The party doesn’t decide.
We can start with the primaries, which destroyed the Party Decides theory of Marty Cohen, David
Karol, Hans Noel, and John Zaller (2008), who wrote that “unelected insiders in both major parties
∗This article is an expansion of Gelman (2016e) and Azari (2016b). We thank Bob Erikson, Yair Ghitza, DeborahChasman, David Banks, and several blog commenters for helpful discussion.†Department of Statistics and Department of Political Science, Columbia University.‡Department of Political Science, Marquette University.
0.4 0.5 0.6 0.7
0.4
0.5
0.6
0.7
Nationally, Trump got 2% more of the vote than predicted
Poll−based forecast of Trump vote
Act
ual T
rum
p vo
te
CA
CO
CTDE
FL
HI
IL
IA
ME
MDMA
MIMN NV
NH
NJNM
NY
OH
OR
PA
RI
VT
VA
WA
WI
AL
AK
AZ
AR
GA
ID
INKS
KY
LAMSMO
MT
NE
NC
ND OK
SC
SD
TN
TX
UT
WV
WY
0.4 0.5 0.6 0.7
Trump did much better than predicted in states that Romney won in 2012
Poll−based forecast of Trump vote
(Tru
mp
vote
) −
(P
oll−
base
d fo
reca
st)
−2%
0%2%
4%6%
8%
CA
COCT
DE
FL
HI
IL
IAMEMD
MA
MI
MN
NV
NH
NJ
NM
NY
OH
OR
PA
RI
VT
VA
WA
WIAL
AK
AZ
AR
GA
ID
IN
KS KY
LA
MS
MO
MT
NE
NC
ND
OKSC
SD
TN
TX
UT
WV
WY
Figure 1: (a) Donald Trump’s share of the two-party vote, by state, compared to a polls-based
forecast constructed before the election. States won by Obama and Romney in 2012 are colored red
and blue. (b) Trump vote minus polls-based forecast, plotted vs. forecast. Trump outperformed the
forecast the most in highly Republican states. From Gelman (2016d).
have effectively selected candidates long before citizens reached the ballot box.” You can’t blame
authors of a book on political history—its subtitle is “Presidential Nominations Before and After
Reform”—for failing to predict the future. But it does seem that the prestige of the Party Decides
model was one reason that Nate Silver (2016), Nate Cohn (2015; see also Mark Palko, 2015), and
a bunch of other pundits not named Nate were so quick to dismiss Donald Trump’s chances of
winning in the Republican primaries, even while the leaders of the Democratic party seemed to be
deciding according to plan (see Figure 2).
Most social scientists, ourselves included, were tempted to dismiss Trump’s chances during
primary season. But as we discussed several years ago (Gelman, 2011), primary elections are inher-
ently difficult to predict, with multiple candidates, no party cues or major ideological distinctions
between them, unequal resources, unique contests, and rapidly-changing circumstances). More re-
cently, we entertained the idea that Trump’s candidacy represented divergent preferences between
Republican primary voters and elites (Azari, 2015).
Where can we turn for insights about how the two parties function? The recent work of Rachel
Blum (2016) on the Tea Party as a “party within a party” illuminates some of the dynamics we
observed in the 2016 nomination contest. While Donald Trump is not precisely an outgrowth of the
Tea Party, this research offers insights about how an insurgent movement operates within a party
while simultaneously challenging its leaders and methods of politics. Blum likens the post-2012
Tea Party to a third party movement, an important blueprint for the Trump candidacy.
While the Tea Party research builds on the parties-as-networks theory that undergirds The Party
Decides, there have been other strands of work within political science. Lara Brown (2010) questions
the group-centric model, theorizing instead instead that nominations are shaped by candidates’
ability to take advantage of party structures and rules. It’s possible we could cast Trump as the
kind of political opportunist that Brown describes: his ability to draw crowds and media attention
worked well in the modern primary system, and he was able to navigate a crowded field of candidates
in order to win the party nod. There’s one area where Brown’s theory gets it wrong, though: she
2

Figure 2: These two people ran for president in 2016. “The party decided” for one of them but not
the other.
argues for the importance of broad political experience as a big influence on whether candidates
are successful at winning the nomination. Arguably, Trump succeeded by differentiating himself
from the Republican field on issues, staking out distinctive positions on immigration and trade.
A growing group of scholars, including one of the authors of this piece, have begun to assess the
impact of weak parties combined with strong partisanship (Azari, 2016a). Daniel Schlozman and
Sam Rosenfeld (2017) identify the phenomenon as “hollow parties,” noting that “parties feel weak.
They seem inadequate to the tasks before them, of aggregating and integrating preferences and
actors into ordered conflict in American politics, of mobilizing participation and linking government
to the governed.” The ideas of Sidney Milkis (1993), on executive-centered party politics, give
perspective on the way the Republican Party became Trump’s party over the course of the election,
and explaining some of the governing developments since Trump took office, including high levels
of approval from Republicans in the electorate and support from Congressional Republicans. Azari
maintains that weak parties and strong partisanship tells much of the story of the 2016 race, in
which party coordination efforts proved inadequate to stop Trump, but once he was the nominee,
partisan loyalties kicked in. On the Democratic side, the situation can be summarized as too much
branding and not enough building, in the sense of Daniel Galvin (2009).
2. The ground game was overrated.
The Democrats were supposed to be able to win a close election using their ability to target
individual voters and get them out to the polls. Elizabeth McKenna and Hahrie Han (2014)
discuss the innovative use of volunteers in Obama campaigns, and Seth Masket, John Sides, and
Lynn Vavreck (2015) and Ryan Enos and Anthony Fowler (2016) estimate that ground campaigning
did not determine the election outcome in 2012 but that it did increase turnout in the most targeted
states by several percentage points. After 2016, the new consensus is that some ground game is
necessary, but it’s hard to get people to turn out and vote, if they weren’t already planning to.
During the past few decades, campaigns have moved from the “air war” to the “ground game” to
some new world of social media. Erika Fowler, Travis Ridout, and Michael Franz (2016) argue that
the 2016 presidential election was a significant departure from past patterns in terms of advertising,
and, of course, the presidential candidate who advertised less was the winner. However, they also
suggest that Clinton’s surprise losses “came in states in which she failed to air ads until the last
week” and that Clinton’s ads also differed from previous patterns in their lack of policy content.
3

Polling and the news media
3. Overconfident pundits get attention.
From one direction, neuroscientist Sam Wang (2016) gave Hillary Clinton a 99 percent chance of
winning the election; from the other, cartoonist and political provocateur Scott Adams (2015) gave
98 percent odds in favor of Trump. Looking at it one way, both Wang and Adams were correct:
Clinton indisputably won the popular vote while Trump was the uncontested electoral vote winner.
After the election, Wang blamed the polls, which was wrong. The polls were off by 2 percent,
which from a statistical standpoint wasn’t bad. Indeed this magnitude of error was expected from
a historical perspective (Rothschild and Goel, 2016), even if it did happen to be consequential this
time. The mistake was not in the polls but in Wang’s naive interpretation of the polls which did not
account for the possibility of systematic nonsampling errors shared by the mass of pollsters, even
though evidence for such errors was in the historical record. Meanwhile, Adams explains Trump’s
victory as being the result of powers of persuasion, which might be so but doesn’t explain why
Trump received less than half the vote, rather than the landslide that Adams had predicted.
We continue to think that polling uncertainty could best be expressed not by speculative win
probabilities but rather by using the traditional estimate and margin of error. Much confusion
could’ve been avoided during the campaign had Clinton’s share in the polls simply been reported
as 52 percent of the two-party vote, plus or minus 2 percentage points.
There’s a theory that academics such as ourselves are petrified of making a mistake, hence we are
overcautious in our predictions; in contrast, the media (traditional news media and modern social
media) reward boldness and are forgiving of failure. This theory is supported by the experiences
of Sam Wang (who showed up in the New York Times explaining the polls after the election he’d
so completely biffed) and Scott Adams (who triumphantly reported that his Twitter following had
reached 100,000).
4. That trick of forecasting elections using voter predictions rather than voter intentions?Doesn’t work.
Economists David Rothschild and Justin Wolfers (2013) have argued that the best way to predict
the election is not to ask people whom they’ll vote for, but rather ask whom they’ll think will win.
Their claim was that when you ask people whom they think will win, survey respondents will be
informally tallying their social networks, hence their responses will contain valuable information for
forecasting. When this idea was hyped a few years ago, Gelman (2012) was skeptical, taking the
position that respondents will be doing little more than processing what they’d seen in the news
media, and we remain skeptical, following a 2016 election that was a surprise to most.
5. Survey nonresponse is a thing.
It’s harder and harder to reach a representative sample of voters, and it’s been argued that much
of the swing in the polls is attributable not to people changing their vote intention, but to changes
in who responds or doesn’t respond. In short, when there is good news about a candidate, his or
her supporters are more likely to respond to polls. Gelman, Sharad Goel, Doug Rivers, and David
Rothschild (2016) floated this theory following some analysis of opinion polls from 2012, and it
seems to have held up well during the recent campaign season (Gelman and Rothschild, 2016).
The only hitch here is that the differential nonresponse story explains variation in the polls but
not the level or average shift. The final polls were off by about 2 percentage points, suggesting
4

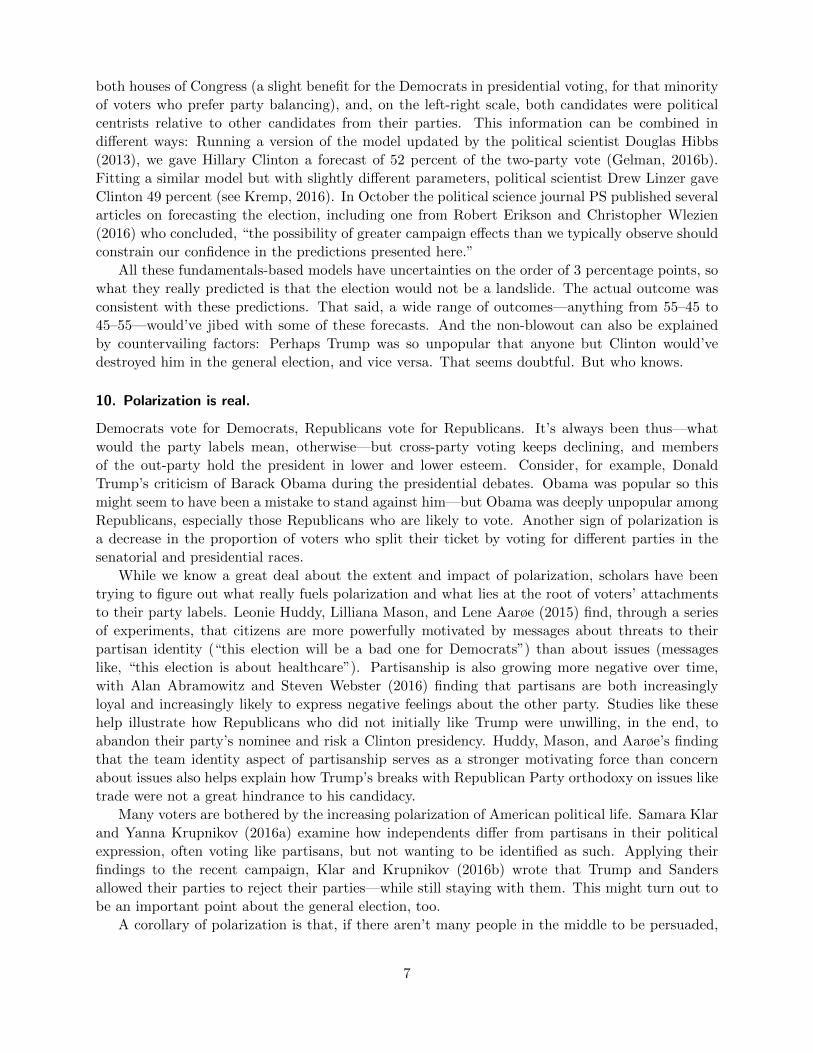
Figure 3: An integrated circuit. For decades, engineers keep figuring out how to make these run
faster. During this same time, Americans keep coming up with new ways of being politically polar-
ized.
that, even at the end, Trump supporters were responding at a lower rate than Clinton supporters,
most notably in certain key swing states.
Shortly after the election, some people attributed these differences to “shy Trump voters” who
were not willing to admit their unpopular views to pollsters. We are skeptical of this explana-
tion, given that, as shown in Figure 1, Trump outperformed the polls the most in states such as
North Dakota and West Virginia where we assume respondents would’ve had little embarrassment
in declaring their support for him, while he did no better than the polls’ predictions in solidly
Democratic states. Also, Republican candidates outperformed expectations in the Senate races,
which casts doubt on the model in which respondents would not admitting they supported Trump;
rather, the Senate results are consistent with differential nonresponse or unexpected turnout or
opposition to Hillary Clinton.
6. News is siloed.
For years we’ve been hearing that liberals hear one set of news, conservatives hear another, and
moderates are being exposed to an incoherent mix, so that it’s difficult for anyone to make sense
of what everyone else is hearing. There have always been dramatic differences of opinion (consider,
for example, attitudes toward civil rights in the 1950s and the Vietnam war in the 1970s) but
research on public opinion has shown an increase in partisan polarization in recent decades. The
2016 election, with its sharp divide between traditional news organizations on one side and fake
news spread by Twitter and Facebook on the other, seems like the next step in this polarization.
It’s the political version of Moore’s Law (Figure 3), which says that every time the semiconductor
manufacturers have run out of ways to squeeze more computing power on a chip, they come up with
something new. Whenever it starts to seem like there’s no more room for Americans to polarize,
something new comes up—in this case saturation of social media by fake news, along with a decline
of the traditional TV networks and continuing distrust of the press.
Studying the effect of news media more generally, is challenging. In a recent study using passive
monitoring data, Andrew Guess (2016) finds that “most people across the political spectrum have
centrist media diets composed largely of mainstream portals.” Pablo Barbera (2015) points out
that “social media platforms facilitate exposure to messages from those with whom individuals
have weak ties, which are more likely to provide novel information to which individuals would not
5

be exposed otherwise through offline interactions.” Barbera continues: “Because weak ties tend to
be with people who are more politically heterogeneous than citizens’ immediate personal networks,
this exposure reduces political extremism.” This last claim may need to be reassessed in the light
of aggressive social media campaigning in 2016. In particular, it may be that the largest effect of
fake news is in how it has affected voters’ reception of mainstream media coverage. This is related
to the work of Diana Mutz (1998) on the indirect connections between voters and the news media.
7. A working-class pundit is something to be.
Filmmaker and political activist Michael Moore gets lots of credit for writing, over a month before
the election, an article entitled “5 Reasons Why Trump Will Win,” specifically pointing to the Rust
Belt, angry white men, voter turnout, and other factors that everybody else was writing about after
the election was over. Moore even mentioned the Electoral College. And unlike the overconfident
pundits mentioned above, Moore clearly stated this as a scenario (“As of today, as things stand
now, I believe this is going to happen . . . ”) without slapping a 98 or 99 percent on to it.
What if Hillary Clinton had won 52 percent of the two-party vote and a solid Electoral College
victory? Would we now be hearing from pundits with a special insight into white suburban moms?
Maybe so. Or maybe we’d still be hearing about the angry white male, since 48 percent of the two-
party vote would still be a lot more Trump support than most were expecting when the campaign
began.
8. Beware of stories that explain too much.
After the election, which shocked the news media, the pollsters, and even the Clinton and Trump
campaigns, our colleague Thomas Basboll wrote that “social science and democracy are incompati-
ble. The social sciences conduct an undemocratic inquiry into society. Democracy is an unscientific
way of governing it.”
Maybe so. But Basboll could’ve written this a few days before the election. Had the election
gone as predicted, with Clinton getting the expected 52 percent of the two-party vote rather than
the awkwardly distributed 51% that was not enough for her to win in the Electoral College, it still
would’ve been true that half of American voters had refused to vote for her. So there’s something
off about these sweeping election reviews: even when you agree with the sentiments, it’s not clear
why it makes sense to tie it to any particular election outcome.
The Republicans have done well in political strategy, tactics, timing, and have had a bit of
luck too. One party right now controls the presidency, both houses of Congress, most of the
governorships, and soon the Supreme Court. But when it comes to opinions and votes, we’re a
50/50 nation. So we have to be wary of explanations of Trump’s tactical victory that explain too
much.
How voters make decisions
9. The election outcome was consistent with “the fundamentals.”
Various models predict the election outcome not using the polls, instead using the national economy
(as measured, for example, in inflation-adjusted personal income growth during the year or two
preceding the election) and various political factors. In 2016 the economy was growing slowly but
not booming (a mixed signal for the voters), the incumbent party was going for a third term in
office (traditionally a minus, as voters tend to support alternation), and the Republicans controlled
6
both houses of Congress (a slight benefit for the Democrats in presidential voting, for that minority
of voters who prefer party balancing), and, on the left-right scale, both candidates were political
centrists relative to other candidates from their parties. This information can be combined in
different ways: Running a version of the model updated by the political scientist Douglas Hibbs
(2013), we gave Hillary Clinton a forecast of 52 percent of the two-party vote (Gelman, 2016b).
Fitting a similar model but with slightly different parameters, political scientist Drew Linzer gave
Clinton 49 percent (see Kremp, 2016). In October the political science journal PS published several
articles on forecasting the election, including one from Robert Erikson and Christopher Wlezien
(2016) who concluded, “the possibility of greater campaign effects than we typically observe should
constrain our confidence in the predictions presented here.”
All these fundamentals-based models have uncertainties on the order of 3 percentage points, so
what they really predicted is that the election would not be a landslide. The actual outcome was
consistent with these predictions. That said, a wide range of outcomes—anything from 55–45 to
45–55—would’ve jibed with some of these forecasts. And the non-blowout can also be explained
by countervailing factors: Perhaps Trump was so unpopular that anyone but Clinton would’ve
destroyed him in the general election, and vice versa. That seems doubtful. But who knows.
10. Polarization is real.
Democrats vote for Democrats, Republicans vote for Republicans. It’s always been thus—what
would the party labels mean, otherwise—but cross-party voting keeps declining, and members
of the out-party hold the president in lower and lower esteem. Consider, for example, Donald
Trump’s criticism of Barack Obama during the presidential debates. Obama was popular so this
might seem to have been a mistake to stand against him—but Obama was deeply unpopular among
Republicans, especially those Republicans who are likely to vote. Another sign of polarization is
a decrease in the proportion of voters who split their ticket by voting for different parties in the
senatorial and presidential races.
While we know a great deal about the extent and impact of polarization, scholars have been
trying to figure out what really fuels polarization and what lies at the root of voters’ attachments
to their party labels. Leonie Huddy, Lilliana Mason, and Lene Aarøe (2015) find, through a series
of experiments, that citizens are more powerfully motivated by messages about threats to their
partisan identity (“this election will be a bad one for Democrats”) than about issues (messages
like, “this election is about healthcare”). Partisanship is also growing more negative over time,
with Alan Abramowitz and Steven Webster (2016) finding that partisans are both increasingly
loyal and increasingly likely to express negative feelings about the other party. Studies like these
help illustrate how Republicans who did not initially like Trump were unwilling, in the end, to
abandon their party’s nominee and risk a Clinton presidency. Huddy, Mason, and Aarøe’s finding
that the team identity aspect of partisanship serves as a stronger motivating force than concern
about issues also helps explain how Trump’s breaks with Republican Party orthodoxy on issues like
trade were not a great hindrance to his candidacy.
Many voters are bothered by the increasing polarization of American political life. Samara Klar
and Yanna Krupnikov (2016a) examine how independents differ from partisans in their political
expression, often voting like partisans, but not wanting to be identified as such. Applying their
findings to the recent campaign, Klar and Krupnikov (2016b) wrote that Trump and Sanders
allowed their parties to reject their parties—while still staying with them. This might turn out to
be an important point about the general election, too.
A corollary of polarization is that, if there aren’t many people in the middle to be persuaded,
7

it can make sense for candidates in the primary and general election campaigns to focus on firing
up their base and forget about moderation, and this is a key part of the story of the success of
the Trump campaign. You can bet that activists of both parties will have learned this lesson when
2020 comes along.
11. Demography is not destiny.
We’d been hearing a lot about how the Republican party, tied to a declining base of elderly white
supporters, needs to reassess, as in this headline from Slate: “It Lost Black Voters. Now It’s Losing
Latinos. What’s Left Is a Broken, White GOP” (Bouie, 2016). Hillary Clinton won most of the
minority vote but the electorate is whiter than observers had thought based on exit polls (Cohn,
2016). Longer term, it may well be that the Republican party needs to change with the times—
after all, their presidential candidate did lose by 3 million votes—but destiny hasn’t kept them
from maintaining their control of both houses of Congress and most state legislatures.
At the same time, a growing body of social science suggests that race, gender, ethnicity, and
religion shape the electorate. Based on available data and extrapolations, a debate rages about
how many Latino voters chose Trump. Exit polls assigned Trump nearly thirty percent of the
Latino vote, defying expectations and logic in light of Trump’s comments on the campaign trail,
but Gary Segura and Matt Barreto (2016) argue that exit polls are not designed to accurately
reflect the votes of minority populations, and suggest that Clinton did extremely well in areas that
are predominantly Latino.
One of the more confounding demographic stories of 2016 was that of gender. Gender solidarity
did not drive votes for the first female major-party nominee, and it didn’t for Trump, either. Men
and women alike voted along party lines, and a majority of white women voted for Trump, but the
gender gap in 2016 was about twice as high as in recent years.
Finally, there’s an argument to be made that the election was decided by a demographic bloc
not usually identified as such: white voters. Nate Cohn summed this up with an election-night
tweet: “How to think about this election: white working class voters just decided to vote like a
minority group. They’re >40% of the electorate.” Marisa Abrajano and Zoltan Hajnal (2017)
similarly document a “transformation” in the white electorate, in which white voters have shifted
from the Democratic to the Republican Party, and attitudes about Latinos and immigration partly
drive partisanship. Michael Tesler (2016a,b) has studied how racial attitudes have taken on new
importance in the Obama era, and after the election he wrote that “views about race mattered
more in electing Trump than electing Obama.” Racial appeal also interacted with the rules of the
Electoral College: in 2016 whites were overrepresented in swing states, and calculations based on
forecast probabilities showed average voting power to be higher among whites than other ethnic
groups (Gelman and Kremp, 2016).
12. Public opinion does not follow elite opinion.
Perhaps the most disturbing theoretical failure of political science is the general idea that voters
simply follow elite opinion. This worked in 1964 to destroy Goldwater, for instance. Or so the story
goes. The implication is that voters had to be told Goldwater was scary. They could not figure it
out for themselves.
In 2016, Trump was opposed vigorously as dangerous, incompetent, xenophobic, tyrannical,
and unhinged, by almost everybody in elite circles: most of his Republican primary opponents at
one time or another, a large number of conservative intellectuals, former Republican candidates
8

0.3 0.4 0.5 0.6 0.7
0.3
0.4
0.5
0.6
0.7
Nationally, Trump got 2% more of the vote than Romney
Romney share of the two−party vote in 2012
Trum
p sh
are
of th
e tw
o−pa
rty
vote
in 2
016
CA
CO
CTDE
FL
HI
IL
IA
ME
MDMA
MIMNNV
NH
NJNM
NY
OH
OR
PA
RI
VT
VA
WA
WI
AL
AK
AZ
AR
GA
ID
INKS
KY
LAMSMOMT
NE
NC
ND OK
SC
SD
TN
TX
UT
WV
WY
0.4 0.5 0.6 0.7
Swing from 2012 to 2016: Lots of variation among states
Romney vote in 2012
(Tru
mp
vote
) −
(R
omne
y vo
te)
−4%
−2%
0%2%
4%6%
8%10
%
CA
COCT
DE
FL
HI
IL
IA
ME
MD
MA
MI
MN
NV
NH
NJ
NM
NY
OH
OR
PA
RI
VT
VA
WA
WI
AL
AK
AZ
AR
GA
ID
IN
KS
KY
LA
MS
MO MT
NE
NC
ND
OKSC
SD
TN
TX
WV
WY
Graph omits Utah, where Trumpdid 13% worse than Romney
Figure 4: (a) Donald Trump’s share of the two-party vote, by state, compared to Mitt Romney’s
share in the previous election States won by Obama and Romney in 2012 are colored red and blue.
(b) Trump vote minus Romney share, plotted vs. Romney share. Compare to Figure 1.
Romney and McCain, the various Bushes, the media, almost all newspaper editorialists including
those that were reliable Republican supporters, all Democrats, about 10 Republican senators, and
even some pundits on Fox News. Further, Trump’s breaking of all the standard niceties of politics
was there for all to see for themselves. But half the voters said, we go with this guy anyway. “The
falcon no longer hears the falconer,” as W. B. Yeats put it.
13. There is an authoritarian dimension of politics.
Political scientists used to worry about authoritarianism within the electorate. Mainstream politi-
cians, ranging from Republicans on the far right to lefties such as Sanders, tend not to go there.
Trump did. In doing so he broke the rules of politics with extreme comments about his opponents,
etc., that are hard to forget. But a significant segment of the electorate, maybe 20 percent, have
always been waiting for its authoritarian champion on what we now call the alt-right dimension.
There had not been one in the modern era. Trump’s absolute dominance of the political news
for over a year signifies this uniqueness. There had been others with this sort of appeal, notably
Joe McCarthy (see, for example, Gelman, 2016a) or George Wallace, but they never came close to
becoming our national leader.
The U.S. political environment
14. Swings are national.
When you look at changes from one election to the next, the country moves together. If you plot
vote swings by county, or by state, you see much more uniformity in the swing in recent years than
in previous decades (see, for example, Gelman, 2009). There’s been lots of talk of Pennsylvania,
Michigan, and Wisconsin, and these three states did make the difference in the electoral college,
but these swings did not greatly alter the general national picture of Republican support in the
center of the country and Democratic strength on the coasts; see Figure 4. To put it another way,
9

Figure 5: The idea that elections are decided by irrelevant factors has itself “jumped the shark.”
nonuniform swings were essential to Trump’s win, but looking at public opinion more broadly, the
departures from a national swing were small, and consistent with the increasing nationalization
of elections in recent decades. That said, within states there were clear differentials, with Trump
consistently outperforming Romney in poorer counties and doing worse in richer counties, in all
regions of the country.
15. The election wasn’t decided by shark attacks.
Political scientists Chris Achen and Larry Bartels (2002, 2016) have argued that voters are emo-
tional and that elections can be swayed by events such as shark attacks that should logically be
irrelevant to voting decisions (Figure 5). Others have analyzed data and claimed to find that close
elections can be decided by the outcomes of college football games (with happy voters being more
likely to pull the lever for the incumbent party’s candidate), but reanalysis of both these studies
revealed no clear effect in either case (Fowler and Hall, 2016, Fowler and Montagnes, 2015). What
does 2016 say about all this? Not much.
You can’t prove a negative so it’s possible that irrelevant stimuli could have made all the
difference. But the big stories about this election were that (a) lots of bad information about
Donald Trump did not sway much of the electorate, and (b) Clinton’s narrow Electoral College loss
may well be attributed to FBI leaks, which were relevant to the voting decision in reminding voters
(perhaps inappropriately) of concerns about her governing style. The 2016 election was not about
shark attacks or football games but rather about big stories that didn’t matter much, or canceled
each other out.
That said, we shouldn’t let the silliness of the shark attack reasoning to distract us from Achen
and Bartels’s larger point that that many voters are massively uninformed about politics, policy,
and governing, which is relevant even if it’s not true, as they claimed, that voters are easily swung
by irrelevant stimuli.
Some emotional stimuli are more obviously connected to politics than others, and the outcome
of 2016 suggests that emotions matter for political decision-making. Shana Kushner Gadarian and
Bethany Albertson (2015) found, in a series of experiments, that inducing anxiety in voters can lead
to changes in preferences—namely, “support for protective policies” that will shield them from the
effects of terrorism, pandemic outbreaks, and climate change. However, their research showed that
voters anxious about terrorism would tend toward trusted figures—something that they argued
seemed to give the advantage to Clinton (Albertson, Busby, and Gadarian, 2016), which just goes
10

to show the difficulty in applying general theories to particular elections.
16. Red state blue state is over.
Republicans have done better among rich voters than among poor voters in every election since
the dawn of polling, with the only exceptions being 1952, 1956, and 1960, which featured moderate
Republican Dwight Eisenhower and then moderate Democrat John Kennedy. Typically the upper
third of income votes 10 to 20 percentage points more Republican than the lower third (Gelman,
Park, et al., 2009). But 2016 was different. For example, the exit polls reported that Clinton won
53 percent of the under-$30,000 vote and 47 percent of those making over $100,000, a difference
of only 6 percentage points, much less than the usual income gap. And we found similar minimal
income-voting gradients when looking at other surveys. And political scientist Katherine Cramer
(2016) has been documenting the growing urban-rural divide within states (specifically, Wisconsin,
ground zero of the demise of Hillary Clinton’s “blue wall”)—a division that’s not just about income,
but about education and culture as well. Will the partisan income divide return in future years?
Will it disappear? It depends on where the two parties go. Next move is yours, Paul Ryan.
17. Third parties are still treading water.
The conventional wisdom is that minor parties are doomed in the U.S. electoral system. The
paradox is that the only way for a minor party to have real success is to start local, but all the
press comes from presidential runs. Anyway, 2016 seems to have confirmed conventional wisdom.
Both major-party candidates were highly unpopular, but all the minor parties combined got only
5.6 percent of the vote. On the other hand, 5.6 percent is a lot better than 1.7 percent (2012), 1.4
percent (2008), 1.0 percent (2004), or 3.7 percent (2000).
In light of the research on the topic, the real surprise is that third parties didn’t make a stronger
showing in 2016. In a study of support for George Wallace, John Anderson, and Ross Perot, Paul
Abramson, John Aldrich, Philip Paolino and David Rohde (1995, 2000) argue that the third party
voting is rooted mostly in dissatisfaction with major party candidates, not the parties themselves.
In other words, voters turn to third parties when they’re not so happy with the party nominee, but
don’t want to cross all the way over and support the other side. It’s possible the real story in 2016
is that more of this didn’t happen.
The glass half full for minor parties is that they are starting to get serious; the glass half empty
is that not much bloomed even in such fertile soil.
18. Goldman Sachs rules the world.
This theory appears to still hold up. Goldman Sachs candidate Hillary Clinton managed to lose the
electoral vote, but Goldman Sachs Senator Chuck Schumer may now be the most powerful Democrat
in Washington, while former Goldman Sachs executives Stephen Bannon, Steven Mnuchin, and
Gary Cohn are slated to decide political strategy inside the White House and economic strategy
at the Treasury Department and the National Economic Council. So it looks like the banksters
are doing just fine. They had things wired, no matter which way the election went. The work of
Thomas Ferguson, Paul Jorgensen, and Jie Chen (2016) gives some insight into the links between
party positions and their sources of funds that are necessary to compete in modern elections.
11

19. The Electoral College was a ticking time bomb.
Yup.
Lessons for the future
How does the shock of 2016 affect how policymakers, political professionals, activists, and citizens
should think about future elections?
Going into the off-year election 2018, a big question is the importance of balancing from the
subset of voters who prefer divided government. George W. Bush’s two terms laid the groundwork
for Democrats to win both houses of congress in 2006 and 2016, then Obama’s presidency motivated
enough voters to balance so that Republicans gained a bit more than 50% in congressional and
local elections, allowing them as the opposition party to control the House of Representatives, the
Senate, and most governors and state legislatures. 2016 also can be viewed as a balancing election:
polls show that most voters expected Hillary Clinton to win the presidency, which partly explains
the Republicans’ retention of the Senate.
In the 2009–2010 cycle the balancing trend was so strong that generic congressional ballot
polling gave us the confidence to predict that “the Democrats are gonna get hammered,” over
eight months in advance of the 2010 election. We’ll see how the polls look this September, but
research by Joseph Bafumi, Robert Erikson, and Chris Wlezien (2006, 2010) shows that the generic
congressional ballot, when suitably adjusted, has historically been an accurate prediction of the
forthcoming House vote.
Balancing provides the conditions for an opposition electoral comeback but the party (in this
case, the Democrats) still has to field the candidates and run the campaigns. Is a coherent message
required? The experience of 1994, 2006, and 2010 suggests that opposition to the president can be
enough, if tied to specific issues with broad appeal, most naturally health care and social security
in the current political climate.
What about racial politics and the Republicans’ strength among middle-aged and older whites,
who remain the dominant voting group (especially in off-year elections)? The challenge for both
parties is to craft a message with universal appeal while satisfying their core constituencies. The
current political map puts the Democrats at a disadvantage because their votes are geographically
concentrated; hence they might need 52% or more of the national congressional vote in order to
win half the seats. This is possible—the Democrats received 55% of the vote in the wave elections
of 2006 and 2008—but this higher threshold puts them under more of a burden to craft a broadly
appealing message.
Moving from elections to policy, the elections of 2008–2016 and their immediate consequences
have struck a strong blow to the millions of Americans who oppose corporate influence in poli-
tics. Barack Obama had a background as a community organizer and excited the liberal wing of
the Democratic party, and he implemented significant liberal policies including a Keynesian fiscal
stimulus and a national heath care plan—but he also, notoriously, joined in the bipartisan bailout
of Wall Street. In 2012, Obama was opposed by Wall Street candidate Mitt Romney, and in 2016,
Hillary Clinton was attacked for her Wall Street connections and her newfound opposition to the
Trans-Pacific Partnership, but then, as noted above, several of incoming president Trump’s most
important political and economic advisors have Goldman Sachs backgrounds. To the extent that
corporate control of national politics is a real concern—rather than just another way for voters to
express their partisan identities—it is not clear what will come next. Between Donald Trump on
one side, and Paul Ryan and the Koch brothers on the other, there does not seem to be any space
12

remaining for an anti-Wall Street bloc within the Republican Party. But Bernie Sanders’s near-
miss in 2016 suggests that core economic issues still have the potential to divide the Democratic
leadership.
The continued strength of partisan polarization augurs close national elections and tough cam-
paigning by both parties, as well as motivating activists on both sides to push for their favored
candidates. If nearly everyone is voting on party lines, then “electability” is not such a concern.
In the wake of the victory of Donald Trump and the loss of Hillary Clinton, it will be difficult for
moderate leaders of either party to persuade primary election voters to set aside their hearts and
choose the purportedly safe option.
Looking forward to 2020, the success of fundamentals-based models suggests that the Trump
administration will, like its predecessors, try to time the business cycle for economic growth in
years 3 and 4 of the presidential term. It’s not clear how attainable this goal will be, but we expect
it will be a key driver of policy debates. Polarization suggests the election will be close, which will
put a premium on innovative campaign techniques as well as attempts to game the system via vote
suppression. From the Democrats’ end, the challenge will be to broaden their geographic base of
support so they can win in an electoral college which currently favors whites. Polling technology
will continue to advance so that both parties will be aware of where their strengths and weaknesses
are—even if they may find it difficult to do anything about them.
Finally as noted above, we are not so concerned that the election will be determined by irrele-
vant factors such as football games or shark attacks, but close elections and partisan polarization
can well lead to a crisis of legitimacy of the government. In this article we have focused on cam-
paigns and elections, but the other half of the story is what the parties do when in office and in
opposition. Congressional Republicans’ near-complete opposition to the Obama agenda seems in
retrospect to have been a natural strategy but in 2008 few commentators were anticipating it. At
this point the relation between Trump and congressional Republicans is unclear: so far the Senate
has approved many of the most controversial presidential appointments but it remains open how
strong is the Republican consensus for taking apart the U.S. government and replacing it with
right-wing loyalists. Anything can happen, and indeed this uncertainty is, ironically, one of the
more expected consequences of Trump’s electoral victory.
The political science of public opinion and elections, which has informed this piece, does not
in itself give much insight into the politics within the majority party. What the study of elections
and attitudes can tell us about are constraints: politicians do not want to lose office, and for that
reason among others they are motivated to be responsive to the opinions of voters and, as Lawrence
Jacobs and Robert Shapiro (2000) explain, to do their best to manipulate these opinions. The 2016
elections have given the paradox of voters who do not follow their party leaders on key issues but
remain strongly partisan and predictable in their general-election voting. On one hand this seems
inherently unstable—for how long can partisan loyalty be sustained by little more than opposition
to the other side—but the combination of winner-take-all elections and (until recently) political
gridlock also can make it a hard pattern to break.
References
Abrajano, M., and Hajnal, Z. L. (2017). White Backlash: Immigration, Race, and American
Politics. Princeton University Press.
Abramowitz, A. I., and Webster, S. (2016). The rise of negative partisanship and the nationalization
of U.S. elections in the 21st century. Electoral Studies 41, 12–22.
13

Abramson, P. R., Aldrich, J. H., Paolino, P., and Rohde, D. W. (1995). Third-party and in-
dependent candidates in American politics: Wallace, Anderson, and Perot. Political Science
Quarterly 110, 349–367.
Abramson, P. R., Aldrich, J. H., Paolino, P., and Rohde, D. W. (2000). Challenges to the American
two-party system: Evidence from the 1968, 1980, 1992, and 1996 presidential elections. Political
Research Quarterly 53, 495–522.
Achen, C., and Bartels, C. (2002). Blind retrospection—electoral responses to drought, flu and
shark attacks. Paper presented at the annual meeting of the American Political Science Asso-
ciation.
Achen, C., and Bartels, C. (2016). Democracy for Realists: Why Elections Do Not Produce Re-
sponsive Government. Princeton University Press.
Adams, S. (2015). Nate Silver gives Trump 2% chance of getting nominated. Scott Adams’
blog, 28 Aug. http://blog.dilbert.com/post/127791494211/nate-silver-gives-trump-
2-chance-of-getting
Albertson, B., Busby, J., and Gadarian, S. (2016). Will anxiety about terrorism affect
the 2016 election? Clinton has the advantage for now. Monkey Cage blog, 28 Mar.
https://www.washingtonpost.com/news/monkey-cage/wp/2016/03/28/will-anxiety-
about-terrorism-affect-the-2016-election-clinton-has-the-advantage-for-now/
Azari, J. (2015). Taking Donald Trump seriously. Vox, 30 Nov. http://www.vox.com/mischiefs-
of-faction/2015/11/30/9818528/taking-trump-seriously
Azari, J. (2016a). Weak parties and strong partisanship are a bad combination. Vox, 3
Nov. http://www.vox.com/mischiefs-of-faction/2016/11/3/13512362/weak-parties-
strong-partisanship-bad-combination
Azari, J. (2016b). Women also know stuff about the 2016 election. Vox, 9
Dec. http://www.vox.com/mischiefs-of-faction/2016/12/9/13898054/2016-election-
research-pundits-women
Bafumi, J., Erikson, R. S., and Wlezien, C. (2006). Forecasting House seats from generic congres-
sional polls. Technical report, Department of Political Science, Columbia University.
Bafumi, J., Erikson, R. S., and Wlezien, C. (2010). Balancing, generic polls and midterm congres-
sional elections. Journal of Politics 72, 705–719.
Barbera, P. (2015). How social media reduces mass political polarization. Evidence from Germany,
Spain, and the U.S. Paper prepared for the American Poiltical Science Association conference.
http://pablobarbera.com/static/barbera_polarization_APSA.pdf
Basboll, T. (2016). The liberal arts of being ruled. Research as a Second Language blog,
12 Nov. http://secondlanguage.blogspot.com/2016/11/the-liberal-arts-of-being-
ruled.html
Blum, R. (2016). The Tea Party: A Party within a Party. Ph.D. thesis, Department of Government,
Georgetown University.
Bouie, J. (2016). It lost black voters. Now it’s losing Latinos. What’s left is a broken, white GOP.
Slate, 16 Oct. http://www.slate.com/articles/news_and_politics/cover_story/2016/
10/trump_and_the_gop_are_alienating_latinos_the_way_they_once_alienated_black.
html
Brown, L. M. (2010). Jockeying for the American Presidency: The Political Opportunism of Aspi-
rants. Amherst, N.Y.: Cambria Press.
14

Cohen, M., Karol, D., Noel, H., and Zaller, J. (2008). The Party Decides: Presidential Nominations
Before and After Reform. University of Chicago Press.
Cohn, N. (2015). The most important story in the G.O.P. race isn’t about Donald Trump.
New York Times online, 18 Aug. https://www.nytimes.com/2015/08/19/upshot/the-most-
important-story-in-the-gop-race-isnt-about-donald-trump.html
Cohn, N. (2016). There are more white voters than people think. That’s good news for Trump. New
York Times, 10 June. https://www.nytimes.com/2016/06/10/upshot/there-are-more-
white-voters-than-people-think-thats-good-news-for-trump.html
Cramer, K. J. (2016). The Politics of Resentment: Rural Consciousness in Wisconsin and the Rise
of Scott Walker. University of Chicago Press.
Enos, R. D., and Fowler, A. (2017). Aggregate effects of large-scale campaigns on voter turnout.
Political Science Research and Methods 5.
Erikson, R. S., and Wlezien, C. (2016). Forecasting the presidential vote with leading economic
indicators and the polls. PS: Political Science and Politics 49 (4), 669–672.
Ferguson, T., Jorgensen, P. D., and Chen, J. (2016). How money drives U.S. congressional elections.
Institute for New Economic Thinking Working Paper Series No. 48.
Fowler, A., and Hall, A. B. (2016). Do shark attacks influence presidential elections? Reassessing a
prominent finding on voter competence. Working paper. https://dl.dropboxusercontent.
com/u/21176039/FowlerHall_Sharks.pdf
Fowler, A., and Montagnes, B. P. (2015). College football, elections, and false-positive results in
observational research. Proceedings of the National Academy of Sciences 112, 13800–13804.
Fowler, E. F., Ridout, T., and Franz, M. M. (2016). Political advertising in 2016: The presidential
election as outlier? The Forum 14 (4).
Gadarian, S., K., and Albertson, B. (2015). Anxious Politics: Democratic Citizenship in a Threat-
ening World. Cambridge University Press.
Galvin, D. J. (2009). Presidential Party Building: Dwight D. Eisenhower to George W. Bush.
Princeton University Press.
Gelman, A. (2008). The Democrats are gonna get hammered. Statistical Modeling, Causal
Inference, and Social Science blog, 22 Feb. http://andrewgelman.com/2010/02/22/the_
democrats_a/
Gelman, A. (2009). State-by-state vote swings are more uniform than they used to be. Statistical
Modeling, Causal Inference, and Social Science blog, 14 Jan. http://andrewgelman.com/
2009/01/14/state-by-state/
Gelman, A. (2011). Why are primaries hard to predict? New York Times online, 29 Nov. https://
campaignstops.blogs.nytimes.com/2011/11/29/why-are-primaries-hard-to-predict/
Gelman, A., (2012). Comment. Monkey Cage blog, 1 Nov. http://themonkeycage.org/2012/
11/people-can-predict-elections-even-when-polls-cant/#comment-37868
Gelman, A. (2016a). Donald Trump and Joe McCarthy. Statistical Modeling, Causal Inference,
and Social Science blog, 8 June. http://andrewgelman.com/2016/06/08/donald-trump-and-
joe-mccarthy/
Gelman, A. (2016b). Trump-Clinton probably won’t be a landslide. The economy says so.
Slate, 31 Aug. http://www.slate.com/articles/news_and_politics/politics/2016/08/
why_trump_clinton_won_t_be_a_landslide.html
15

Gelman, A. (2016c). No evidence shark attacks swing elections. Statistical Modeling, Causal Infer-
ence, and Social Science blog, 29 Oct. http://andrewgelman.com/2016/10/29/no-evidence-
shark-attacks-swing-elections/
Gelman, A. (2016d). A 2% swing: The poll-based forecast did fine (on average) in blue states;
they blew it in the red states. Statistical Modeling, Causal Inference, and Social Science blog,
9 Nov. http://andrewgelman.com/2016/11/09/polls-just-fine-blue-states-blew-red-
states/
Gelman, A. (2016e). 19 lessons for political scientists from the 2016 election. Slate,
8 Dec. http://www.slate.com/articles/news_and_politics/politics/2016/12/_19_
lessons_for_political_scientists_from_the_2016_election.html
Gelman, A., Goel, S., Rivers, D., and Rothschild, D. (2016). The mythical swing voter. Quarterly
Journal of Political Science 11, 103–130.
Gelman, A., and Kremp, P. A. (2016). The Electoral College magnifies the power of white vot-
ers. Vox, 17 Dec. http://www.vox.com/the-big-idea/2016/11/22/13713148/electoral-
college-democracy-race-white-voters
Gelman, A., Park, D. K., Shor, B., and Cortina, J. (2009). Red State, Blue State, Rich State: Why
Americans Vote the Way They Do, second edition. Princeton University Press.
Gelman, A., and Rothschild, D. (2016). Why you shouldn’t be fooled by polling bounces. Slate, 5
Aug. http://www.slate.com/articles/news_and_politics/politics/2016/08/don_t_be_
fooled_by_clinton_trump_polling_bounces.html
Guess, A. M. (2016). Media choice and moderation: Evidence from online tracking data. Working
paper. https://dl.dropboxusercontent.com/u/663930/GuessJMP.pdf
Hibbs, Douglas A. (2013). The bread and peace model: 2012 presidential election postmortem.
PS: Political Science and Politics 46 (1), 41.
Huddy, L., Mason, L., and Aarøe, L. (2015). Expressive partisanship: Campaign involvement,
political emotion, and partisan identity. American Political Science Review 109, 1–17.
Jacobs, L. R., and Shapiro, R. Y. (2000). Politicians Don’t Pander: Political Manipulation and the
Loss of Democratic Responsiveness. University of Chicago Press.
Klar, S., and Krupnikov, Y. (2016a). Independent Politics: How American Disdain for Parties
Leads to Political Inaction. Cambridge University Press.
Klar, S., and Krupnikov, Y. (2016b). Trump and Sanders allow partisans to stick
with their parties while also rejecting them. Washington Post online, 26 Jan.
https://www.washingtonpost.com/news/powerpost/wp/2016/01/26/trump-and-sanders-
allow-partisans-to-stick-with-their-parties-while-also-rejecting-them/
Kremp, P. A. (2016). State and national poll aggregation. https://pkremp.github.io/report.
html
Masket, S., Sides, J., and Vavreck, L. (2015). The ground game in the 2012 presidential election.
Political Communication 33, 169–187.
McKenna, E., and Han, H. (2014). Groundbreakers: How Obama’s 2.2 Million Volunteers Trans-
formed Campaigning in America. Oxford University Press.
Milkis, S. M. (1993). The President and the Parties: The Transformation of the American Party
System since the New Deal. Oxford University Press.
Moore, M. (2016). 5 reasons why Trump will win. http://michaelmoore.com/trumpwillwin/
16

Mutz, D. (1998). Impersonal Influence: How Perceptions of Mass Collectives Affect Political Atti-
tudes. Cambridge University Press.
Palko, M. (2015). Revisiting Nate Cohn — Scott Walker edition. West Coast Stat Views blog,
29 Sept. http://observationalepidemiology.blogspot.com/2015/09/revisiting-nate-
cohn-scott-walker.html
Rothschild, D., and Goel, S. (2016). When you hear the margin of error Is plus or minus 3
percent, think 7 instead. New York Times, 6 Oct. https://www.nytimes.com/2016/10/06/
upshot/when-you-hear-the-margin-of-error-is-plus-or-minus-3-percent-think-7-
instead.html
Rothschild, D., and Wolfers, J. (2013). Forecasting elections: Voter intentions versus expec-
tations. Working paper, Microsoft Research. http://users.nber.org/~jwolfers/Papers/
VoterExpectations.pdf
Schlozman, D., and Rosenfeld, S. (2017). The hollow parties. Working paper, Department of
Political Science, Johns Hopkins University.
Segura, G., and Barreto, M. (2016). Lies, damn lies, and exit polls. Huffington Post, 10
Nov. http://www.huffingtonpost.com/latino-decisions/lies-damn-lies-and-exit-p_
b_12903492.html
Silver, N. (2016). How I acted like a pundit and screwed up on Tonald Trump. Fivethirtyeight
blog, 18 May. https://fivethirtyeight.com/features/how-i-acted-like-a-pundit-
and-screwed-up-on-donald-trump/
Tesler, M. (2016a). Post-Racial or Most-Racial?: Race and Politics in the Obama Era. University
of Chicago Press.
Tesler, M. (2016b). Views about race mattered more in electing Trump than in electing
Obama. Monkey Cage blog, 22 Nov. https://www.washingtonpost.com/news/monkey-
cage/wp/2016/11/22/peoples-views-about-race-mattered-more-in-electing-trump-
than-in-electing-obama/
Wang, S. (2016). Why I had to eat a bug on CNN. New York Times, 18 Nov. https://www.
nytimes.com/2016/11/19/opinion/why-i-had-to-eat-a-bug-on-cnn.html
17