19 - Scenario Development and Tool Box Introduction PPT€¦ · Microsoft PowerPoint - 19 -...
19
Model Application and Scenario Development Presented by: Dave Roberts Lahontan RWQCB
Transcript of 19 - Scenario Development and Tool Box Introduction PPT€¦ · Microsoft PowerPoint - 19 -...

Model Applicationand
Scenario Development
Presented by:Dave Roberts
Lahontan RWQCB
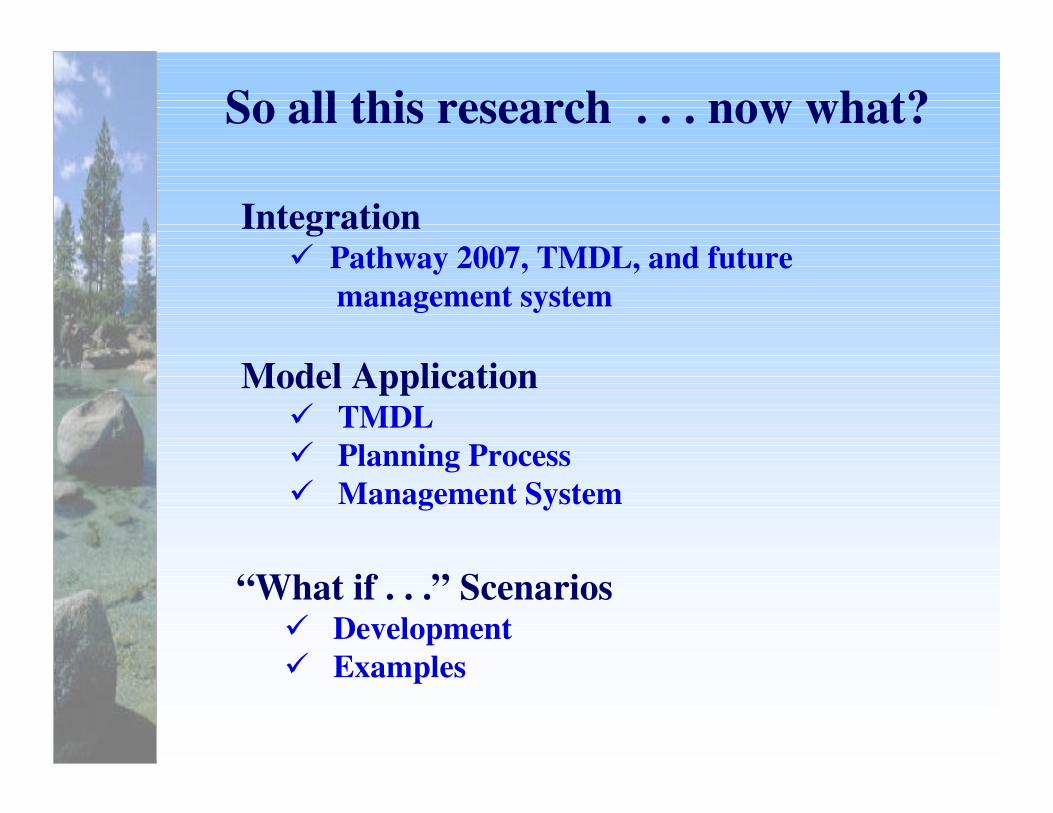
Integration� Pathway 2007, TMDL, and future
management system
Model Application� TMDL� Planning Process� Management System
“What if . . .” Scenarios� Development� Examples
So all this research . . . now what?

Models
ManagementSystem
Pathway 2007(Water Quality)
TMDL
New InformationResearch
Model Refinements
MonitoringPollutant Tracking
Model Output
Implementation
LatherRinse
Repeat
Time

Water Quality Objectives� Standards, Thresholds� Pollutant Load Reduction Allocation
Resource Management� Application to Pathway 2007� “What if . . .“ scenarios� Loading estimates, hot spots, prioritization
Applied Science� Platform for application of new information� Integration of science and policy � Use of existing information
Implementation� Strategic Planning� Planning and Implementation Tools
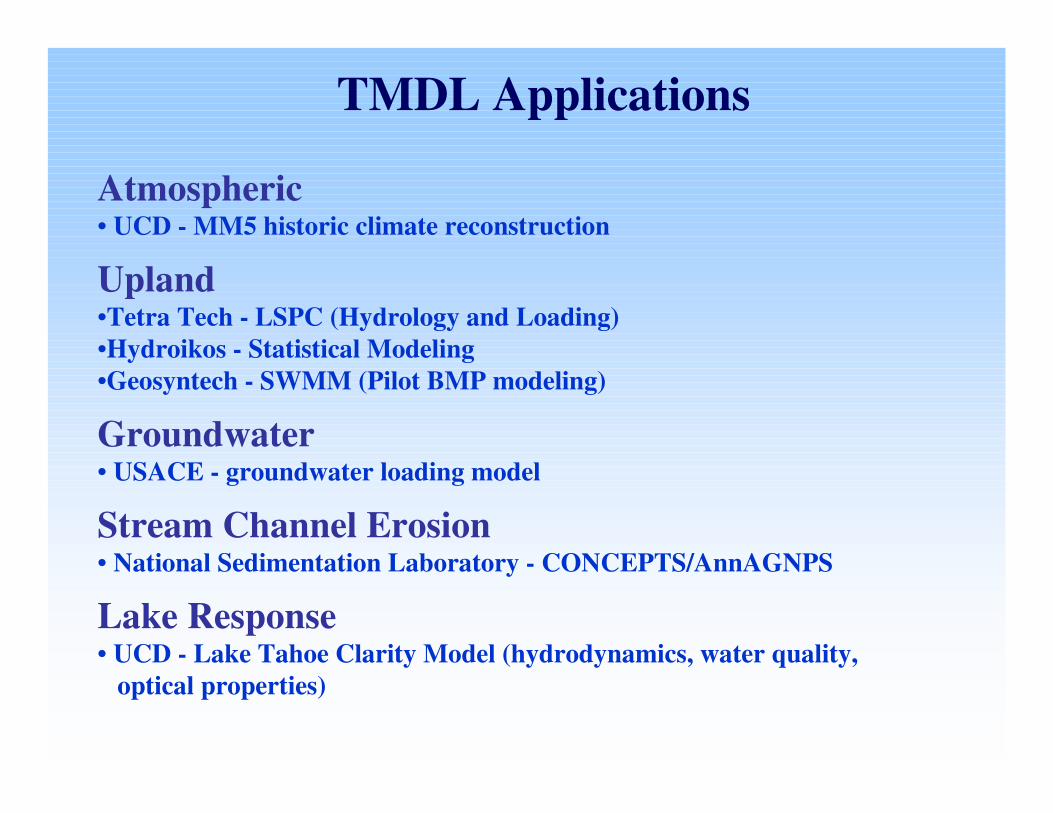
Atmospheric• UCD - MM5 historic climate reconstruction
Upland•Tetra Tech - LSPC (Hydrology and Loading)•Hydroikos - Statistical Modeling•Geosyntech - SWMM (Pilot BMP modeling)
Groundwater• USACE - groundwater loading model
Stream Channel Erosion• National Sedimentation Laboratory - CONCEPTS/AnnAGNPS
Lake Response• UCD - Lake Tahoe Clarity Model (hydrodynamics, water quality,
optical properties)
TMDL Applications
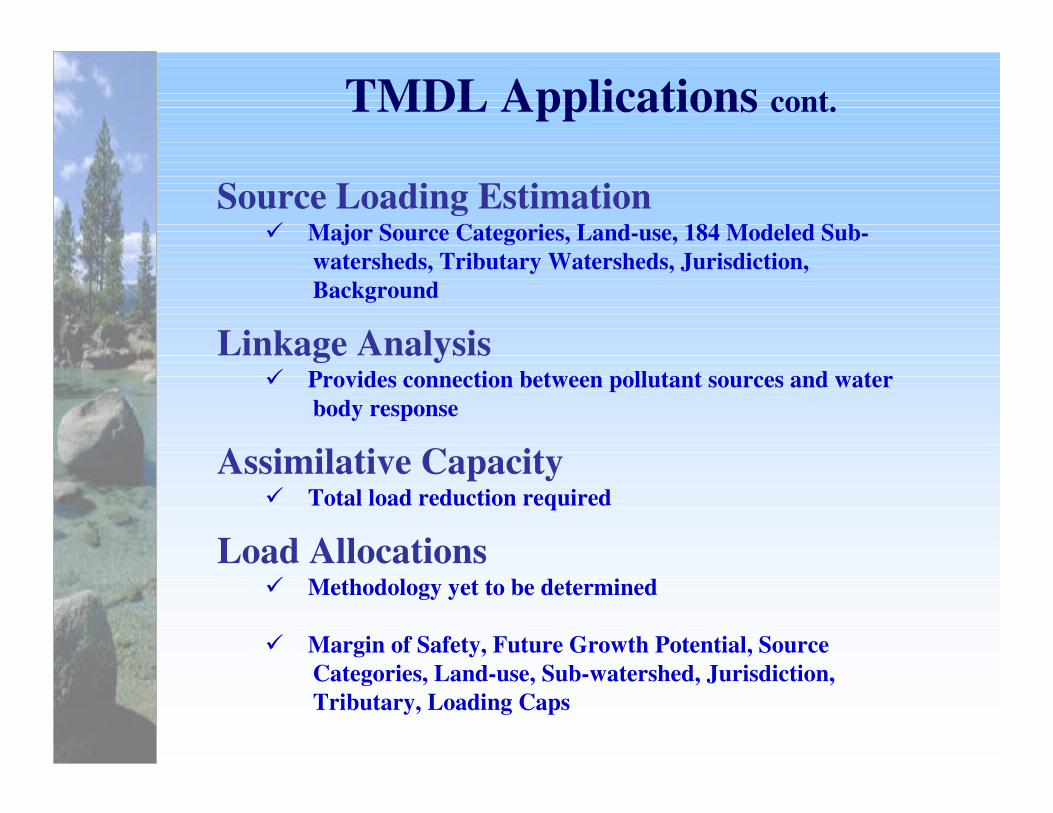
TMDL Applications cont.
Source Loading Estimation� Major Source Categories, Land-use, 184 Modeled Sub-
watersheds, Tributary Watersheds, Jurisdiction, Background
Linkage Analysis� Provides connection between pollutant sources and water
body response
Assimilative Capacity� Total load reduction required
Load Allocations� Methodology yet to be determined
� Margin of Safety, Future Growth Potential, Source Categories, Land-use, Sub-watershed, Jurisdiction, Tributary, Loading Caps
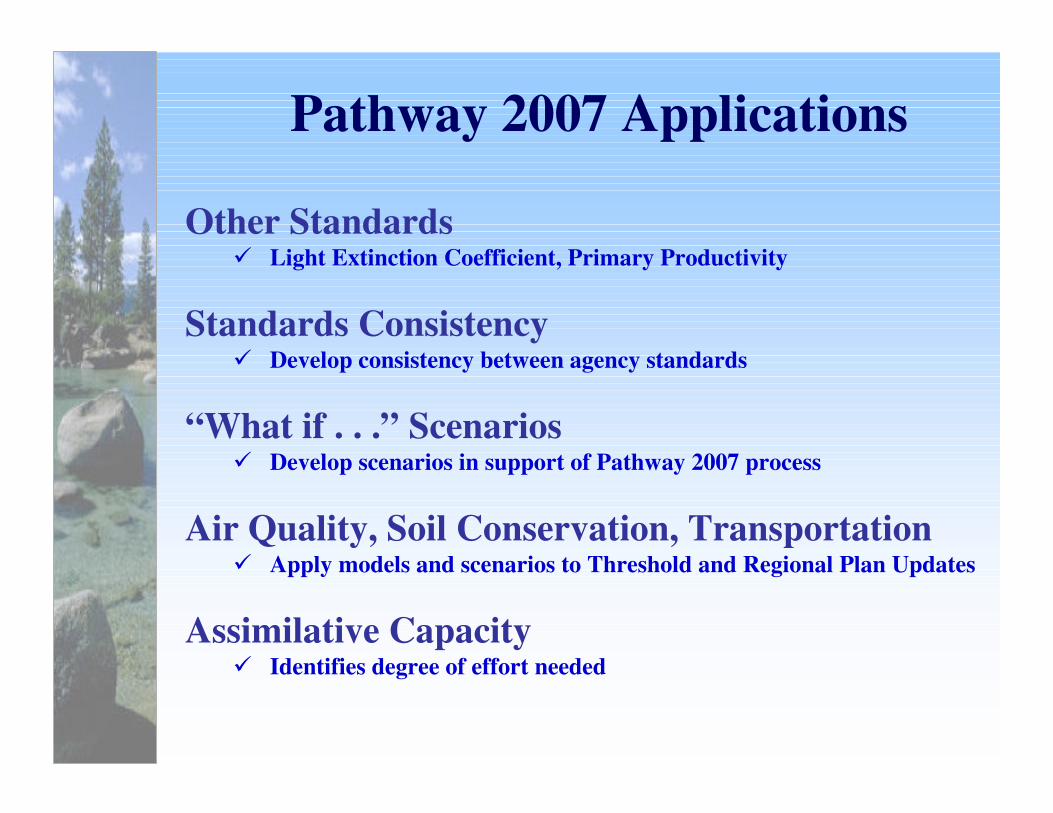
Pathway 2007 Applications
Other Standards� Light Extinction Coefficient, Primary Productivity
Standards Consistency� Develop consistency between agency standards
“What if . . .” Scenarios� Develop scenarios in support of Pathway 2007 process
Air Quality, Soil Conservation, Transportation� Apply models and scenarios to Threshold and Regional Plan Updates
Assimilative Capacity� Identifies degree of effort needed
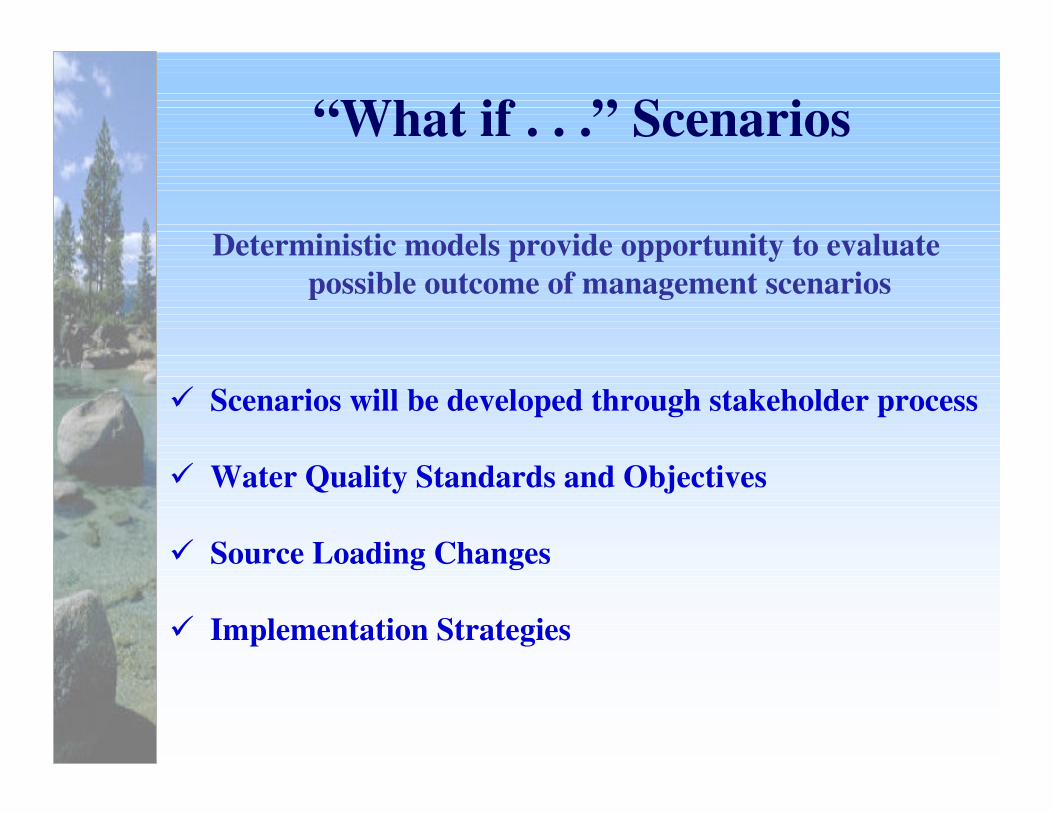
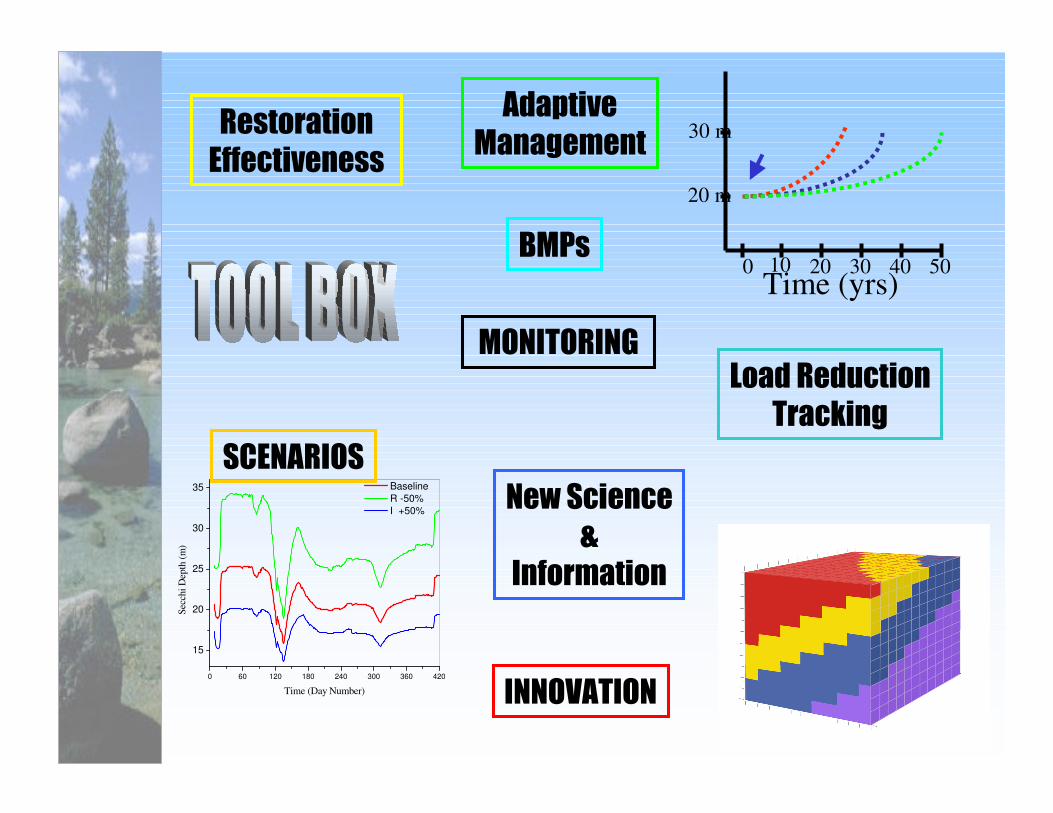
“What if . . .” Scenarios
Deterministic models provide opportunity to evaluatepossible outcome of management scenarios
� Scenarios will be developed through stakeholder process
� Water Quality Standards and Objectives
� Source Loading Changes
� Implementation Strategies
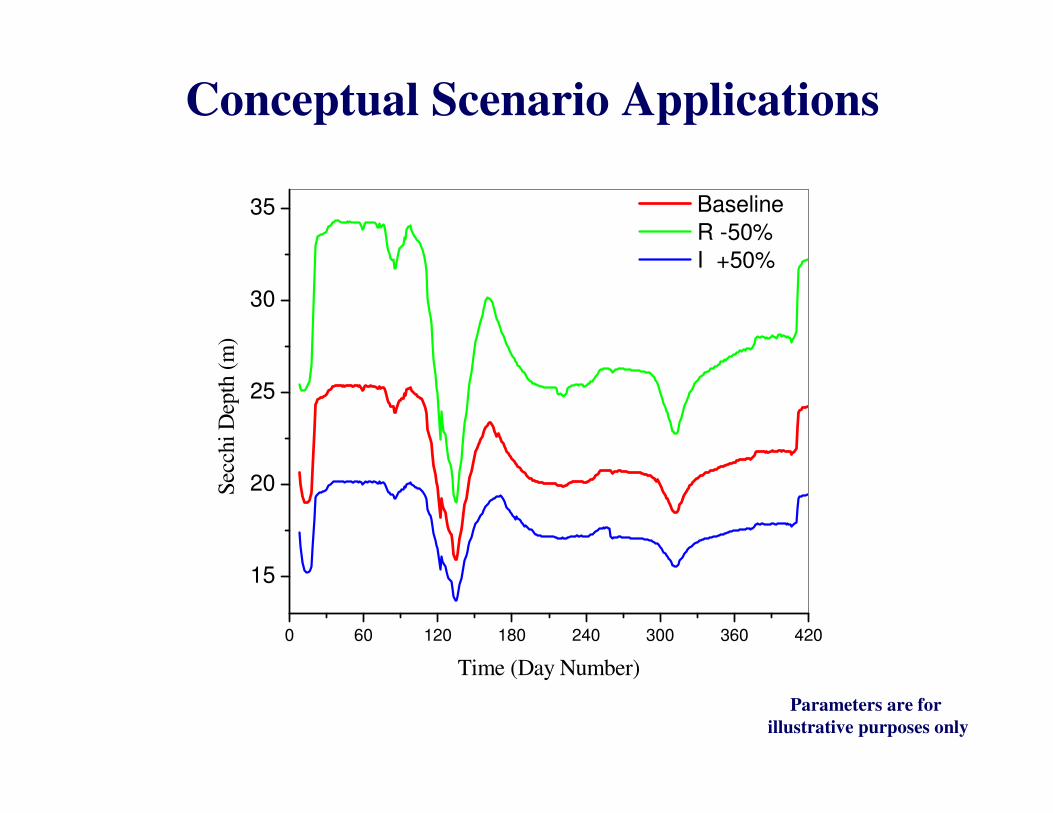
Conceptual Scenario Applications
0 60 120 180 240 300 360 420
15
20
25
30
35Se
cchi
Dep
th (m
)
Time (Day Number)
Baseline R -50% I +50%
Parameters are for illustrative purposes only
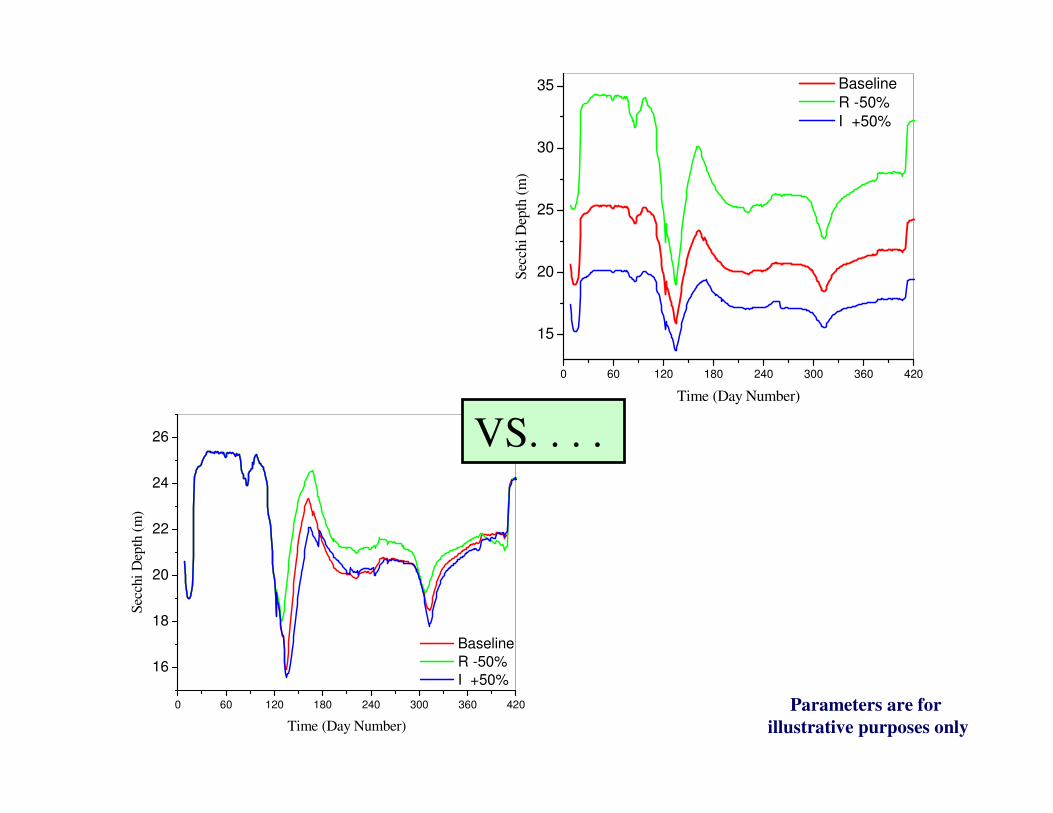
0 60 120 180 240 300 360 420
16
18
20
22
24
26 NO3
Secc
hi D
epth
(m)
Time (Day Number)
Baseline R -50% I +50%
0 60 120 180 240 300 360 420
15
20
25
30
35
Secc
hi D
epth
(m)
Time (Day Number)
Baseline R -50% I +50%
VS. . . .
Parameters are for illustrative purposes only
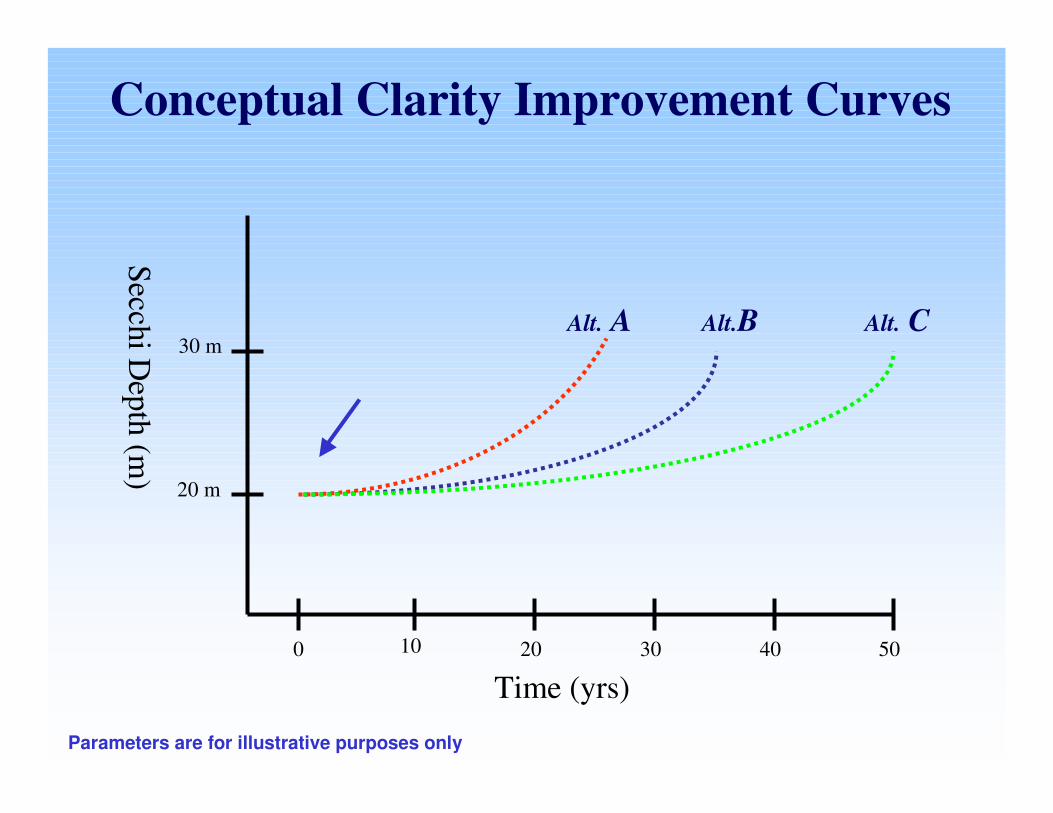
Secchi Depth (m
)
20 m
30 m
Time (yrs)10 20 30 40 500
Conceptual Clarity Improvement Curves
Alt. A Alt.B Alt. C
Parameters are for illustrative purposes only
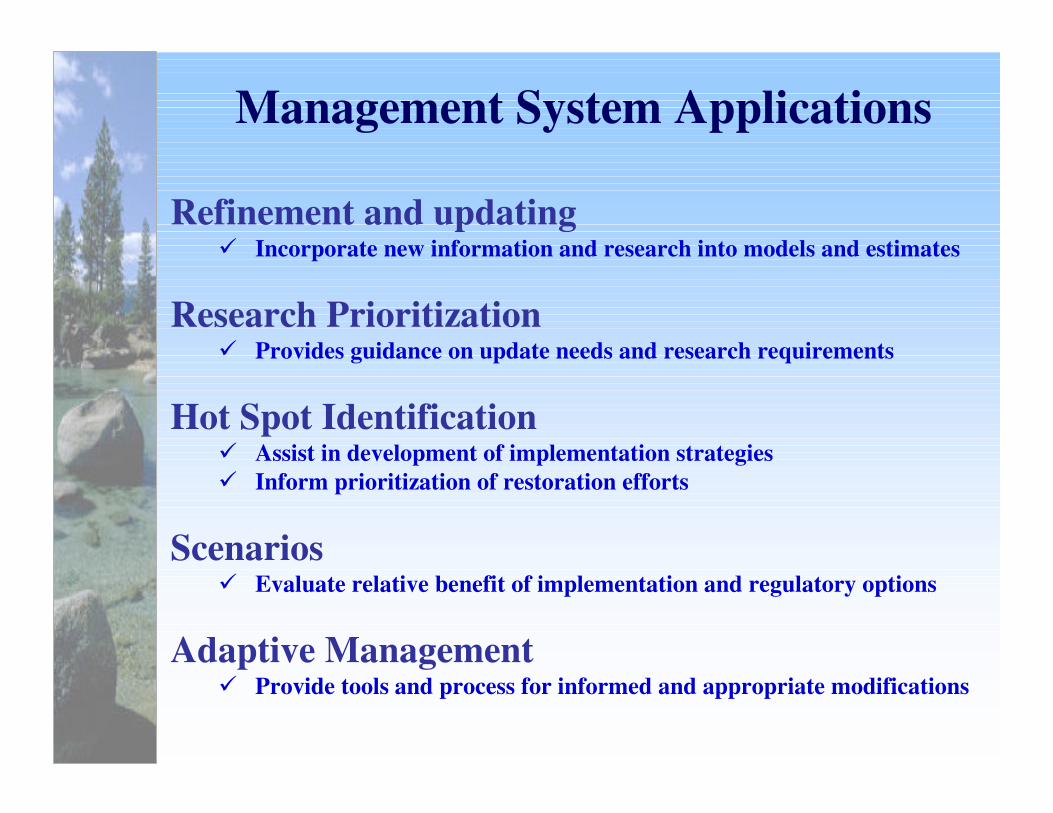
Management System Applications
Refinement and updating� Incorporate new information and research into models and estimates
Research Prioritization� Provides guidance on update needs and research requirements
Hot Spot Identification� Assist in development of implementation strategies� Inform prioritization of restoration efforts
Scenarios� Evaluate relative benefit of implementation and regulatory options
Adaptive Management� Provide tools and process for informed and appropriate modifications
0 60 120 180 240 300 360 420
15
20
25
30
35
Secc
hi D
epth
(m)
Time (Day Number)
Baseline R -50% I +50%
20 m
30 m
Time (yrs)10 20 30 40 500
����������
������ ����
�����������������������
�������
����������
�
���������
������ �
��������
� ������
����!�����
"�#�
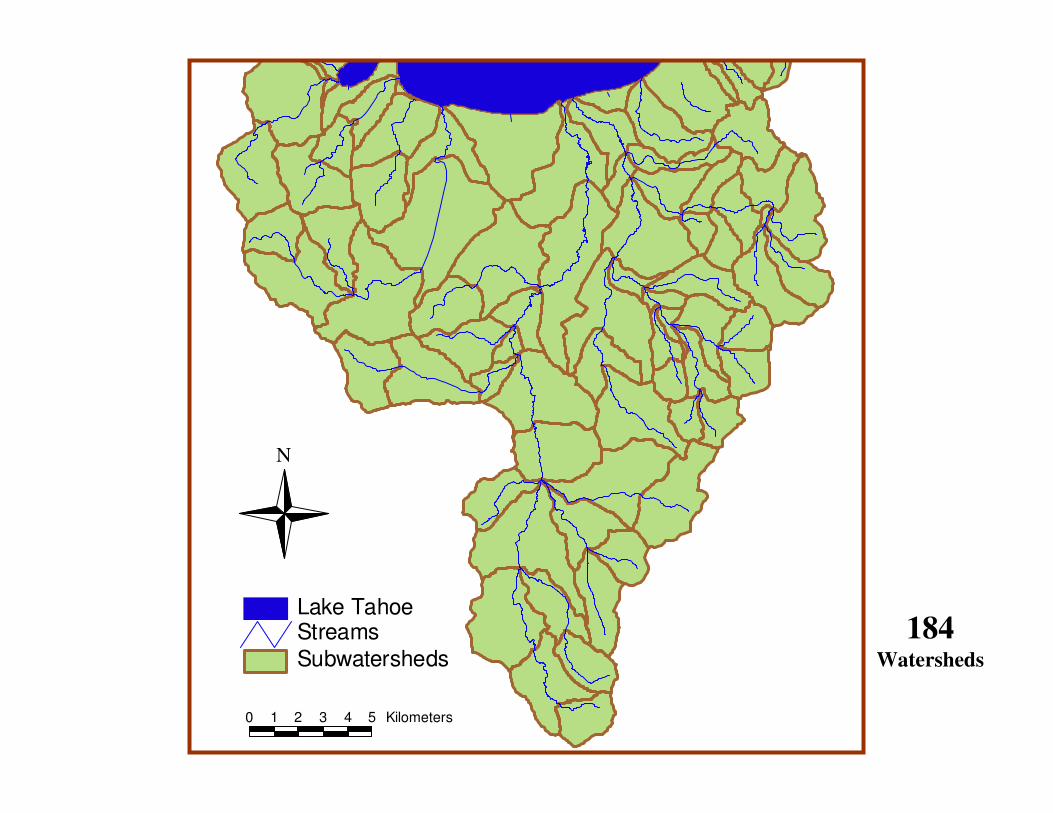
0 1 2 3 4 5 Kilometers
SubwatershedsStreamsLake Tahoe
N
184Watersheds
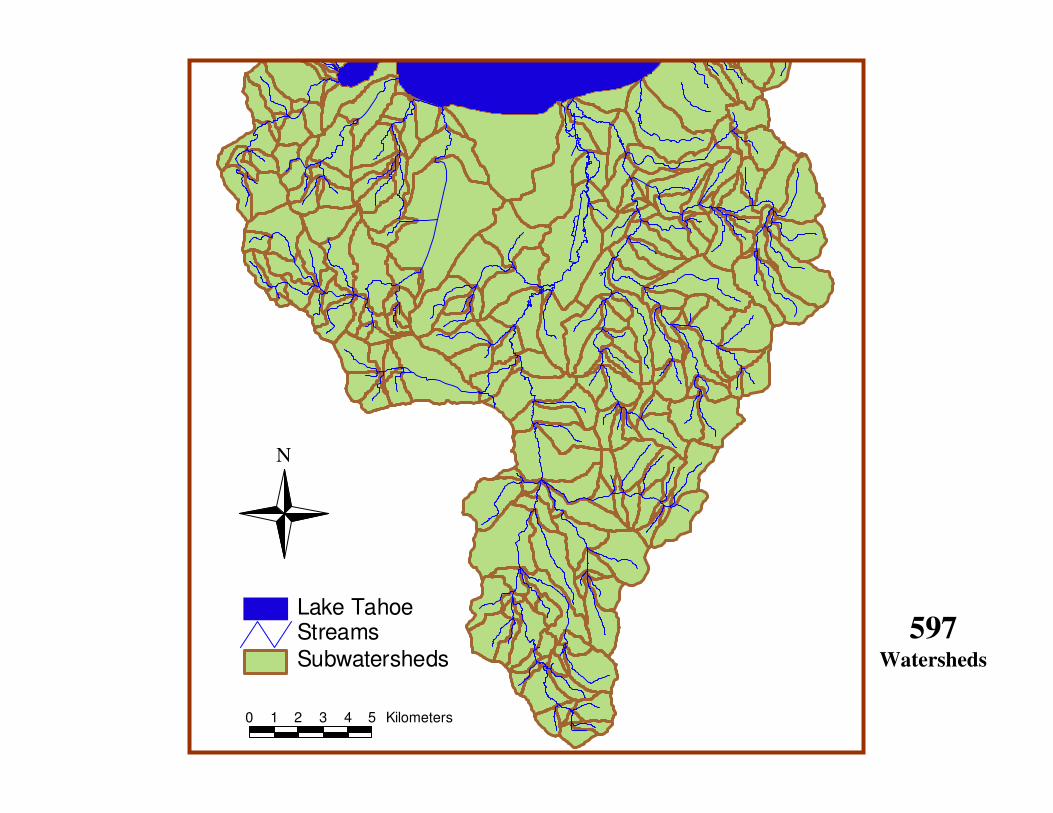
0 1 2 3 4 5 Kilometers
SubwatershedsStreamsLake Tahoe
N
597Watersheds
TMDL ImplementationTool Box
Introduction
Presented by:Dave Roberts
Lahontan RWQCB

Tool Box Objectives
� Develop a unified set of planning and implementation tools
� Develop and apply tools needed for planning and implementation
� Integrate functionality between tools
� Develop system to update tools based upon new information
� Create forum for collaboration between agencies
� Centralize funding and resource needs
� Prioritize needed tools and supporting research
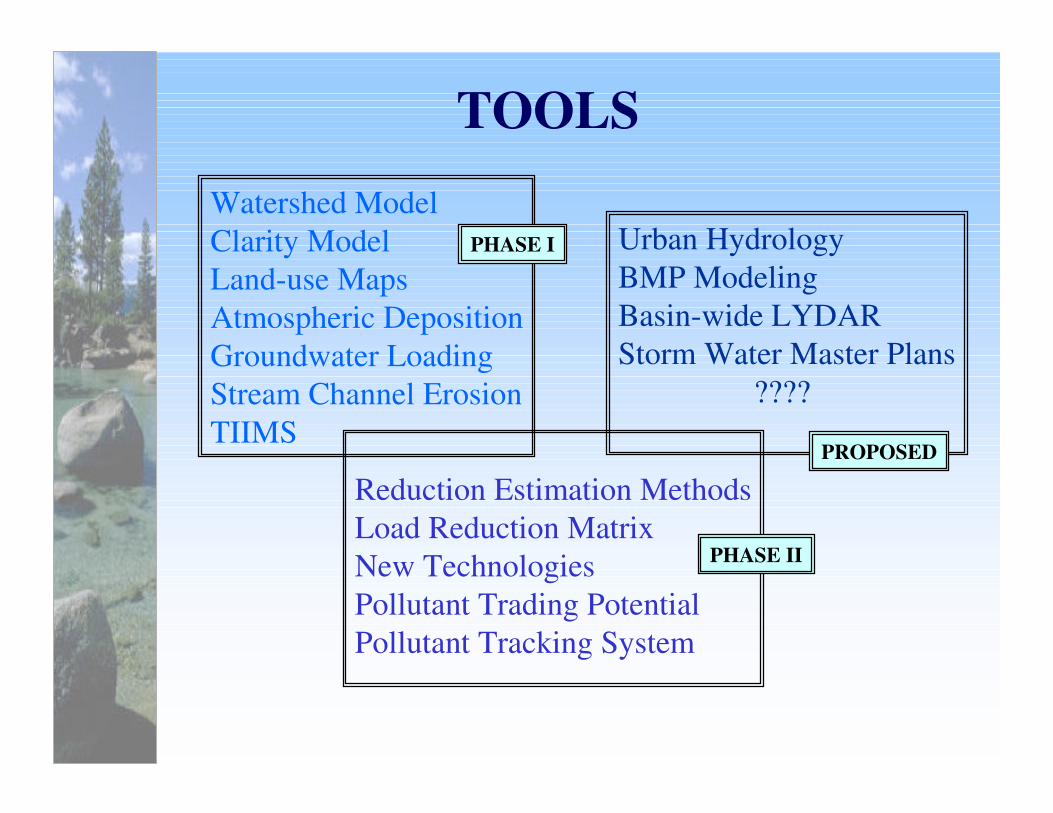
TOOLSWatershed ModelClarity ModelLand-use MapsAtmospheric DepositionGroundwater LoadingStream Channel ErosionTIIMS
Reduction Estimation MethodsLoad Reduction MatrixNew TechnologiesPollutant Trading PotentialPollutant Tracking System
Urban HydrologyBMP ModelingBasin-wide LYDARStorm Water Master Plans
????
PHASE I
PHASE II
PROPOSED
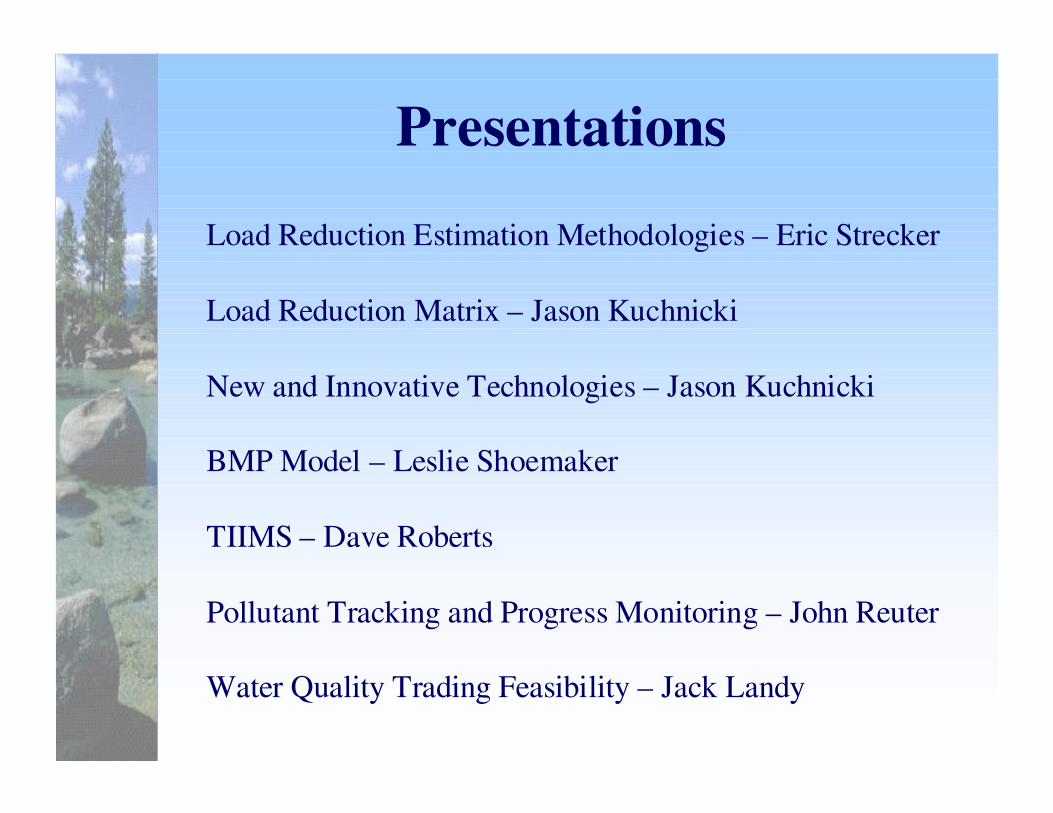
Presentations
Load Reduction Estimation Methodologies – Eric Strecker
Load Reduction Matrix – Jason Kuchnicki
New and Innovative Technologies – Jason Kuchnicki
BMP Model – Leslie Shoemaker
TIIMS – Dave Roberts
Pollutant Tracking and Progress Monitoring – John Reuter
Water Quality Trading Feasibility – Jack Landy