18th November 2013 GMS Ship Recycling Conference …. Anil Shar… · Chartering earnings: from...
28
18th November 2013 GMS Ship Recycling Conference - Tokyo 1
Transcript of 18th November 2013 GMS Ship Recycling Conference …. Anil Shar… · Chartering earnings: from...

18th November 2013 GMS Ship Recycling Conference - Tokyo 1
Agenda
1. Industry Facts
2. Ship recycling Boom and Corrections
3. Ship Recycling: Source of Recovery?
4. Changing Role of Cash Buyer
5. Closing Thoughts
18th November 2013 GMS Ship Recycling Conference - Tokyo 2

1.1. Industry Facts
Cash Buying has evolved into a huge industry with large economic, environmental and
social impacts. In 2012 alone, roughly $5.1 billion worth of scrap ships were
purchased for recycling.
Throughout 2012 about 56.5 million DWT was recycled vs. total of 40.6 million in 2011
• Dry Bulk: 35.7 mill DWT vs. 25.3 mill in 2011
• Wet: 13.7 mill DWT vs. 10.4 mill in 2011
Average age:
2011 - 37 years old 2012 - 31 years old 2013 - 29 years old
INDUSTRY BREAKDOWN (2012)
INDIAN SUB
CONTINENT CHINA TURKEY
No. of Vessels 760 232 282
Lightweight (lt) 8,790,220 2,027,000 912,401
Amount (US$) 3.9 bill 850 mill 283 mill
Note: all figures are approximates
18th November 2013 GMS Ship Recycling Conference - Tokyo 3

1.2. Where it is done (Capacity)
Number of active yards in each Country:
Indian subcontinent
India (160-162 of 170-172)
Bangladesh (70-80 of 100-110)
Pakistan (110 of 129)
China (16 of 20)
Turkey (20)
________ Note: all figures are approximates
These 5 countries (with 80% Asian) recycle more than 95% of
the world’s fleet.
18th November 2013 GMS Ship Recycling Conference - Tokyo 4
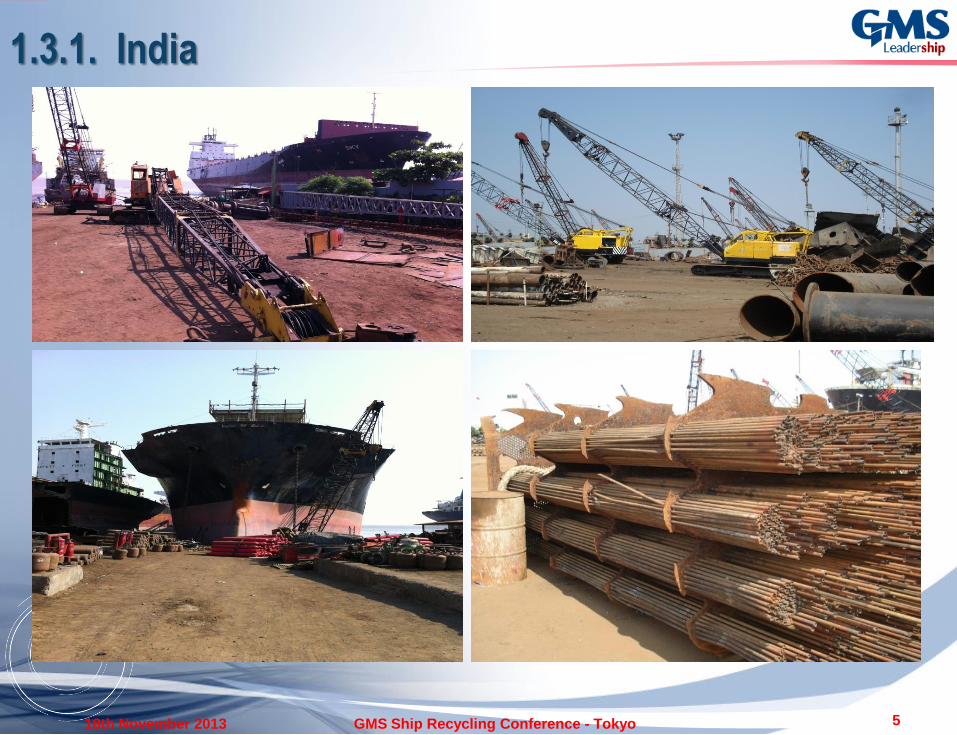
1.3.1. India
18th November 2013 GMS Ship Recycling Conference - Tokyo 5

1.3.2. India
18th November 2013 GMS Ship Recycling Conference - Tokyo 6

1.3.3. India
18th November 2013 GMS Ship Recycling Conference - Tokyo 7

1.3.4. China
18th November 2013 GMS Ship Recycling Conference - Tokyo 8
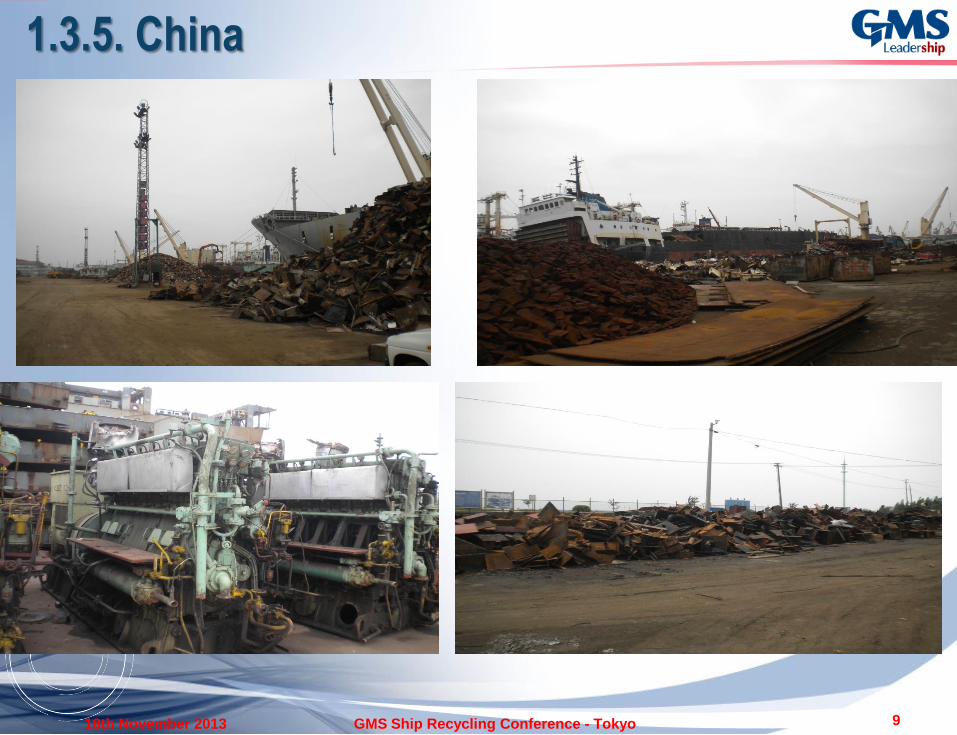
1.3.5. China
18th November 2013 GMS Ship Recycling Conference - Tokyo 9

2.1. Historical Highs – Ship Recycling BOOM…and
2013!
•1985
42.6 Million Dwt
9 Million LDT
•2012
56.5 Million Dwt
11.7 Million LDT
•September 2013
37.56 Million Dwt
7.9 Million LDT
Note: All figures are approximate
18th November 2013 GMS Ship Recycling Conference - Tokyo 10

2.2. Bulk Carriers
Sold for Recycling 2011
(No./DWT)
2012
(No./DWT)
2013 YTD
(No./DWT)
Capesize 74 11,533,655 87 13,885,067 40 6,734,449
Panamax 66 4,481,196 118 7,945,415 51 3,438,242
Handymax 48 2,239,479 102 4,630,781 61 2,715,547
Handysize 291 6,536,167 322 8,459,421 248 6,663,369
Minibulk 86 511,316 69 456,105 70 434,065
Total 565 25,301,813 698 35,376,789 470 19,985,722
Source: Allied
Shipbroking Inc.
November 2013
18th November 2013 GMS Ship Recycling Conference - Tokyo 11

Sold For Recycling 2011
(No./DWT)
2012
(No./ DWT)
2013 YTD
(No./ DWT)
ULCC 2 618,576 3 918,638 5 1,564,191
VLCC 12 3,239,246 12 3,209,269 17 4,727,514
Suezmax 7 1,002,063 22 3,239,167 9 1,347,458
Aframax 28 2,656,659 39 3,714,797 22 2,168,617
Panamax 6 411,956 7 473,380 8 565,937
Product 68 2,207,837 62 2,033,749 43 1,394,146
Minitank 44 225,574 26 152,370 21 95,707
Total 167 10,361,911 171 13,741,370 125 11,863,570
2.3 Tankers
18th November 2013 GMS Ship Recycling Conference - Tokyo 12
Source: Allied
Shipbroking Inc.
November 2013

2.4. Baltic Demolition Assessment 2013
18th November 2013 GMS Ship Recycling Conference - Tokyo 13
290
310
330
350
370
390
410
430
450
470
2013/1/7 2013/2/7 2013/3/7 2013/4/7 2013/5/7 2013/6/7 2013/7/7 2013/8/7 2013/9/7 2013/10/7
D/TKR CHINA
D/TKR SUBCON
C/TKR CHINA
C/TKR SUBCON
B/C CHINA
B/C SUBCON

2.5. Factors that Affect Pricing 1. Supply
2. Demand
3. Steel Prices
4. Currency exchange rates
5. Government Regulations
18th November 2013 GMS Ship Recycling Conference - Tokyo 14

2.6. Steel Prices – Currency 2013: India
• IR on 1st January : 54.80 per USD / Steel prices: IR 26,000 per 12 mm
scrap metal
• IR on 28th August: 68.34!!! / Steel prices: IR 25,900
• IR on 1st September: 65.70 / Steel prices: IR 26,600
• IR on 1st October: 62.52 / Steel prices: IR 26,800
• IR on 1st November: 62.33 / Steel prices: IR 26,000
18th November 2013 GMS Ship Recycling Conference - Tokyo 15
22,500.00
23,000.00
23,500.00
24,000.00
24,500.00
25,000.00
25,500.00
26,000.00
26,500.00
27,000.00
27,500.00
28,000.00
STEEL INDIA (RS)
STEEL INDIA(RS)
370
390
410
430
450
470
490
STEEL INDIA (USD)
INDIA (USD)

2.7. Steel Prices – Currency 2013: Pakistan
• PKR on 1st January : 97.27 per USD / Steel prices: PKR 52,000 per 12
mm scrap metal
• PKR on 1st August: 101.76 / Steel prices: PKR 54,500
• PKR on 1st September: 104.55 / Steel prices: PKR 54,500
• PKR on 1st October: 105.90 / Steel Prices: PKR 55,000
• PKR on 1st November: 106.89!!! / Steel Prices: PKR 55,500
18th November 2013 GMS Ship Recycling Conference - Tokyo 16
50,000.00
51,000.00
52,000.00
53,000.00
54,000.00
55,000.00
56,000.00
57,000.00
STEEL PAKISTAN (PKR)
STEELPAKISTAN(PKR)
510
520
530
540
550
560
570
STEEL PAKISTAN (USD)
PAKISTANUSD
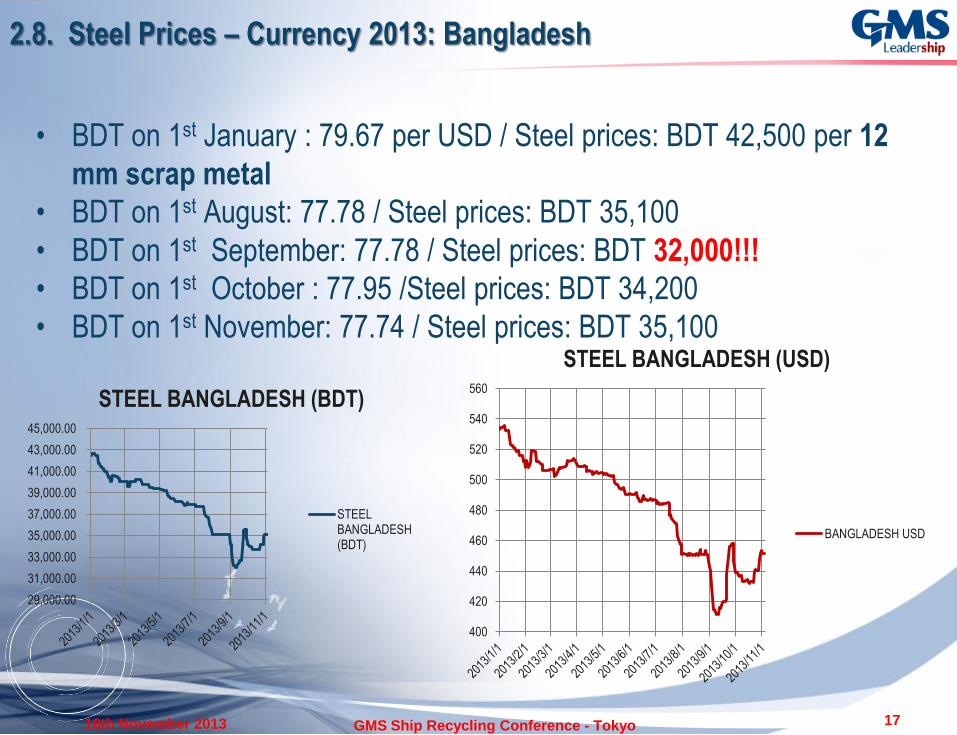
2.8. Steel Prices – Currency 2013: Bangladesh
• BDT on 1st January : 79.67 per USD / Steel prices: BDT 42,500 per 12
mm scrap metal
• BDT on 1st August: 77.78 / Steel prices: BDT 35,100
• BDT on 1st September: 77.78 / Steel prices: BDT 32,000!!!
• BDT on 1st October : 77.95 /Steel prices: BDT 34,200
• BDT on 1st November: 77.74 / Steel prices: BDT 35,100
18th November 2013 GMS Ship Recycling Conference - Tokyo 17
29,000.00
31,000.00
33,000.00
35,000.00
37,000.00
39,000.00
41,000.00
43,000.00
45,000.00
STEEL BANGLADESH (BDT)
STEELBANGLADESH(BDT)
400
420
440
460
480
500
520
540
560
STEEL BANGLADESH (USD)
BANGLADESH USD

Chartering earnings: from region USD 4.9k/day during beginning of January
2013 to region USD 40k /day during end of September. Improvement of more
than 700%!!!
On 4th November abt USD 19k /day
3.1 Recovery(?): Capesize
1000
1500
2000
2500
3000
3500
4000
4500
1/2/13 2/2/13 3/2/13 4/2/13 5/2/13 6/2/13 7/2/13 8/2/13 9/2/13
BCI – 2013 / September 2013
BCI -2013
18th November 2013 GMS Ship Recycling Conference - Tokyo 18
2000
2500
3000
3500
4000
4500
BCI – October 2013
BCI

Chartering earnings: from region USD 5.3k/day during beginning of January
2013 to region USD 14.3k /day during end of September. Improvement of about
169.8%!!!
3.2. Recovery(?): Panamax
600
800
1000
1200
1400
1600
1800
1/2/13 2/2/13 3/2/13 4/2/13 5/2/13 6/2/13 7/2/13 8/2/13 9/2/13
BPI – 2013 / September
BPI -2013
18th November 2013 GMS Ship Recycling Conference - Tokyo 19
1500
1600
1700
1800
1900
2000
2100
BPI October 2013
BPI
On 4th November abt USD 13k /day

As of September 2013
drop of about:
40% comparing
to the total fleet
recycled in 2012
Or
48% comparing to
the total DWT
supplied in 2012
500
1000
1500
2000
2500
BDI 2013 BDI 2013
3.3. Bulk Carriers: The effect of chartering
improvement
0
500
1000
1500
2000
1/3/
12
2/3/
12
3/3/
12
4/3/
12
5/3/
12
6/3/
12
7/3/
12
8/3/
12
9/3/
12
10/3
/12
11/3
/12
12/3
/12
BDI 2012 BDI 2012
18th November 2013 GMS Ship Recycling Conference - Tokyo 20
1400
1600
1800
2000
2200
BDI October 2013
BDI

TANKERS
SCRAPPED 2011 NEWBUILDING
ORDERBOOK JAN 2012 %
SCRAPPED 2012 NEWBUILDING
ORDERBOOK JAN 2013 %
ULCC/VLCC 14 67 20.9 15 57 26.3
SUEZMAX 7 67 10.4 22 64 34.4
AFRAMAX 28 60 46.7 39 30 130
PANAMAX 6 22 27.3 7 23 30.4
MR TANKER 68 94 72.3 62 116 53.4
MINI TANK 44 95 46.3 26 61 42.6
BULKERS
SCRAPPED 2011 NEWBUILDING
ORDERBOOK JAN 2012 %
SCRAPPED 2012 NEWBUILDING
ORDERBOOK JAN 2013 %
CAPESIZE 74 291 25.4 89 179 49.7
PANAMAX 66 165 40 117 223 52.5
SUPRAMAX 48 389 12.3 102 324 31.5
HANDYSIZE 291 337 86.4 324 275 118
MINI BULK 86 330 26.1 69 267 25.8
3.4 Beaching vs. Newbuilding
18th November 2013 GMS Ship Recycling Conference - Tokyo 21

Important Pillar of Shipping (facilitates market balance)
• Newbuilding – record years (pre-2008)
• Recycling – record years (2012-?)
Impact of Ship Recycling on:
• New Building Orders
• Charter rates (new/old ships, availability, etc.)
• Sale and Purchase (2nd values at par with scrap values)
• Ship Finance (residual values and future acquisitions)
• Developments in Ship Design and Fuel Efficiency
Cash Buyers as a source of vessel financing
• High Deposits and Loans
• Asset acquisitions (Companies, Vessels)
• Sale/Leaseback (BBC)
• Private Equity
4.1 Ship Recycling & Changing role of Cash Buyers
18th November 2013 GMS Ship Recycling Conference - Tokyo 22

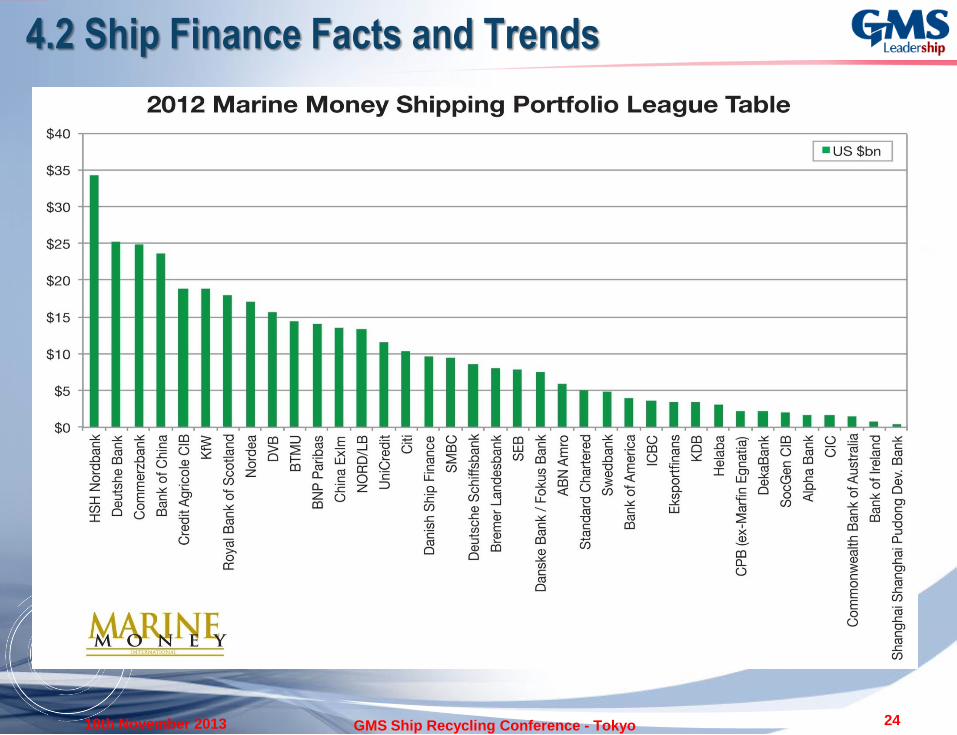
4.1 Ship Finance Facts and Trends
Top 40 Shipping Banks = $408 BILLION worth of exposure to the sector
Accounts for about 78% of global ship finance
Roughly 75% of this exposure comes from European banks
As of June, 42% of these institutions claimed to be prepared to lend while it
was only 22% one year earlier (but these banks are focusing on
conservative deals with Top Tier, existing owners/clients
Many banks with a “legacy book” are more reluctant to lend as they are
overexposed to previous “bad deals”
Increased pressure on European banks is making portfolio sales more likely
– perhaps creating a more liquid market
~Source: NORD LB
18th November 2013 GMS Ship Recycling Conference - Tokyo 23
4.2 Ship Finance Facts and Trends
18th November 2013 GMS Ship Recycling Conference - Tokyo 24
4.3 (cont.) Ship Finance Facts and Trends
With traditional banks more reluctant to lend, we now witness a more eclectic
financing mix (blurred lines in terms of PE)
Capital Markets (ie Scorpio w/ $230+ mill.)
Private Equity (Wilbur Ross – Navigator Gas Transport)
Aircraft style leasing and/or sale leaseback transactions
The USA based capital markets have gone through a Renaissance of sorts as
it applies to ship finance
Slowly but surely, European banks will become more aggressive – For the
moment, however, PE seems to be taking the stage although most of the
deals are accompanied by some sort of bank financing as well
18th November 2013 GMS Ship Recycling Conference - Tokyo 25
4.4 GMS in PE Markets
GMS Examples of Private Equity Transactions :
Example 1 – Acquisition of Existing Company (i.e. Konig & Cie)
Example 2 – Struggling Owner Needs Cash – GMS Buys 50% of vessel acts as JV
partner
Example 3 – Owner Needs to Sell Vessel but Wants to Continue Operations – GMS
buys 100% of the vessel and structures a sale leaseback / BB back
Example 4 - Cash strapped owner wants to buy a new vessel but has no funds on hand
– GMS buys the “new” asset and takes in one of the owner’s “older” assets as a down
payment and holds a note for the balance
Example 4 – Owner does not want to handle recycling of the vessel – GMS buys vessel
clean or with cash flows attached and maintains ownership for set period of time until
current employment obligations expire and vessel is recycled
18th November 2013 GMS Ship Recycling Conference - Tokyo 26

5. Closing Thoughts
1) Ship recycling is a critical aspect of greater maritime industry
2) With return of newbuildings, weak freight markets and large
inventory of vessels, life cycle of ships continue to get shorter
3) Cash Buyers play a major role in the ship recycling process
4) Environmentally safe and responsible ship recycling programs
exist in several countries, including India. However, “headline
risk” often has a greater impact on the decision making
process than facts
5) Japanese ship owners have an exceptional opportunity to
occupy a leadership position in the “green” ship recycling
industry.
6) Time to act is now!
18th November 2013 GMS Ship Recycling Conference - Tokyo 27
Established in USA in 1992….LARGEST CASH BUYER IN THE WORLD!
In last two years, principals of GMS have delivered more than a quarter of the world’s fleet sold for
recycling.
World's FIRST ISO 9001:2000 certified Cash Buyer.
EXCLUSIVE sales offices in all FIVE of the major ship recycling markets in the world (Bangladesh,
China, India, Pakistan and Turkey).
Offices in USA, UAE, SINGAPORE and CHINA to provide 24/7 service to clients worldwide.
Financial and Management capability to:
Buy fleets on simple CASH "as is where is“ terms.
Take forward positions
Structure deals
Leader in Green Recycling:
IMO’s Hong Kong Convention
Safe and Responsible Ship Recycling Programs
Development of Green Yards
18th November 2013 GMS Ship Recycling Conference - Tokyo 28